Westchester County Airport Aircraft Noise Study
|
|
|
- Dustin Snow
- 6 years ago
- Views:
Transcription


1 Westchester County Airport Aircraft Noise Study Prepared for: Westchester County Department of Transportation Prepared by: TAMS Consultants, Inc. Harris Miller Miller & Hans on, Inc. August 2002
2 EXECUTIVE SUMMARY The County of Westchester initiated this study to identify existing and likely future noise impacts resulting from aircraft operations at the Westchester County Airport (HPN). The last noise impact analysis conducted for HPN was in the mid-1980s and since that time, the mix of aircraft types serving HPN has changed. This report documents updated aircraft noise contours and discusses their significance. S.1 Principal Findings Current noise exposure levels, when compared to 1988 conditions, show some significant decreases. Those portions of the 65 db DNL contour caused by aircraft landing straight in to either end of Runway appear very similar to 1988 levels of exposure in the same area. What has changed markedly, however, is the exposure that has occurred west of the airport caused by aircraft taking off from Runways 16 and 34 and turning westbound. DNL levels in these areas appear to have decreased by almost 5 decibels. This improvement results from the mandatory elimination of Stage 2 jets from commercial operation by the end of 1999, the reduction of Stage 2 jets from the corporate fleets serving HPN and a reduction in the use of Runway 29 for takeoffs. The 1999 and 2005 DNL contours are very similar. The slight differences are attributable to two inter-related factors: a projected increase in overall airport traffic, and an offsetting continuation of replacement of Stage 2 jets in the non-commercial fleets with quieter Stage 3 aircraft. The conversion of aircraft types has only a minimal effect on noise during landings, but has a net benefit on aircraft noise (on the order of one decibel) during departures. A comparison of the areas within the various DNL contour lines for 1988, 1999, and 2005 shows significant reduction in the impacted areas from 1988 through 1999 that is expected to be maintained through decibel DNL Contour - In 1988 the area around HPN within the 60-decibel DNL contour line equaled 9.39 square miles (sq mi). In 1999 that area was 4.16 sq mi and by 2005 it is projected to decline to 3.62 sq mi. 65-decibel DNL Contour - The decibel DNL Contour line encompassed 3.44 sq mi. In 1999 the area was 1.78 sq mi and by 2005 it is projected to be 1.50 sq mi. 70-decibel DNL Contour The decibel DNL Contour line encompassed 1.58 sq mi. In 1999 the area was 0.74 sq mi and by 2005, it is projected to be 0.66 sq mi. S-1 Executive Summary
3 Aircraft Noise Study 75-decibel DNL Contour - The comparable figures for the 75-decibel DNL Contour line were 0.71 sq mi in 1988, 0.34 sq mi in 1999, and 0.32 sq mi in It is difficult to compare the impacts of the contour changes between 1988 and 1999 in terms of households affected because comparable land use data is not available and the area around the airport underwent significant residential development during that period. By 1999 an estimated 477 households (with 1,431 individuals) were located within the 60 decibel DNL contour line (or within developments that were partially within that line) An estimated 268 households with 804 individuals were within the 65 decibel DNL line or within developments that were partially within the line. An estimated 262 households with 786 individuals were within a development (Belle Fair) that was partially within the 70 decibel DNL Contour line. It is not clear, however, whether any households were actually located within that contour. S.2 Methodology The study considered two key noise metrics to develop its contour lines. DNL is the Day-Night Average Sound Level, a measure of cumulative noise exposure occurring over a 24-hour period, averaged over the entire year. It is the standard used by all federal agencies and 49 states. The study also considered the CNEL or Community Noise Equivalent Level, a similar measurement recognized by the state of California. The contours were developed using the Integrated Noise Model (INM), which was developed by the Federal Aviation Administration (FAA) and has been upgraded over many years. The DNL and CNEL systems produced slightly different but generally similar contours. To provide INM input, aviation operations and the fleet mix at HPN were analyzed for the period 1985 through 2000 and projections were made for the years between 2000 and General Aviation (GA) activity at HPN in recent years is characterized by a general decline in Local Traffic (flights beginning and ending at the same airport) and an increase in Itinerant Traffic (flights to and from other airports). Related to those trends is an overall decline in operations involving light piston aircraft and an increase in turbo-prop and corporate jet planes. Despite the fact that the experienced decline in Local Traffic is not consistent with FAA Terminal Area projections for HPN, which have projected steady growth, the study conservatively adopted the FAA s projection assuming a 1.8 percent annual increase in Local Traffic through Projections of Itinerant GA Traffic were based on the 1995 to 2000 average annual growth rate of 2.2 percent. FAA projections of commercial airline passenger demand indicate a significant opportunity for growth in this area over the five-year projection period. Never-the-less commercial aviation operations were projected to remain at or near the 1999 level, for two reasons. Commercial traffic at HPN is restrained by operation of a Terminal Capacity Agreement (TCA) that limits the S-2 Executive Summary
4 Westchester County Airport number of aircraft and passengers that can use the airport terminal in any given period. In addition, passenger loadings on current flights (the percentage of seats filled) are relatively low, indicating that substantial additional passenger demand could be accommodated on existing flights without a significant change in the number of flights or aircraft types utilized. S-3 Executive Summary
5 Aircraft Noise Study This page intentionally left blank. S-4 Executive Summary
6 TABLE OF CONTENTS Chapter Title Page Executive Summary... S-1 1 Introduction Noise Principles Single Event Noise Metrics Cumulative Noise Exposure Metrics Noise and Land Use Compatibility Guidelines FAA Regulations and Guidelines Housing and Urban Development Guidelines World Health Organization Community Noise Guidelines Forecasts of 2005 Aviation Operations and Fleet Mix General Aviation and Passenger Forecasts General Aviation Activity Forecasts Passenger Forecasts Fleet Mix Forecasts General Aviation Fleet Mix Commercial Passenger Aircraft Fleet Mix Noise Exposure Contours Computer Model Input Airport Layout Operation Numbers/Aircraft Type Runway Use Flight Tracks/Flight Track Usage DNL Noise Contours Contours for 1999 and Comparison of DNL Noise Contours to 1988 Historic Levels CNEL Noise Contours Measured Vs Modeled Noise Exposure Noise Monitoring System Evaluation Study Noise Monitoring System Improvements under Implementation Evaluation of Measured and Modeled DNL Levels i
7 TABLE OF CONTENTS Chapter Title Page 4 Analysis of Noise Impacts Community Annoyance Residential Uses Community Facilities Planned Uses Within Noise Contours Noise-induced Vibration from Aircraft Operations References List of Preparers Appendix A: Forecasts of 2005 General Aviation Operations, Passenger Enplanements, and Fleet Mix Forecasts... A-1 Appendix B: INM Inputs for 1999 and B-1 ii
8 List of Figures Number Title Following Page 1-1 Location Map Typical A-Weighted Sound Levels Illustration of Sound Exposure Level Illustration of Equivalent Sound Level ARTS Radar Tracks for Air Carrier Jets Dec and 2005 DNL Contours Land Use Historic DNL Contours Comparison of 1988, 1999, and 2005 DNL Contours and 2005 CNEL Contours Land Use Existing Remote Monitoring Terminal Locations Sites to be Included in Expanded Monitoring System Community Reaction as a Function of Outdoor Noise Level Percentage of People Highly Annoyed as a Function of Exposure Comparison of Schultz Data (1978) and USAF Data (1992) on Annoyance and 2005 DNL Contours Census Tracts and 2005 DNL Contours Community Facilities and 2005 CNEL Contours Community Facilities iii
9 List of Tables Number Title Page 1-1 Decibel Changes and Loudness FAA Noise/Land Use Compatibility Guidelines HUD Site Acceptability Standards World Health Organization Guidelines Historic General Aviation Activity and Forecasts for Westchester County Airport: Forecast of Total General Aviation Operations for Westchester County Airport: Historic Total Passenger Counts and Alternate Forecasts for HPN: Forecasts of Total Passengers at HPN: Annual GA Operations for HPN by Type of Operation, Class of Aircraft, and Period of the Day Commercial Fleet for the Peak Month, Average Weekday at HPN Airport Operations by Aircraft Category Forecast Airport Operations by Aircraft Category Westchester Contours for 1999 and Comparison of 1999 Measured and Modeled DNL Levels at 14 Monitoring Locations Total Population Population Characteristics Estimated Off-Airport and Households and Population within Noise Contours iv
10 List of Acronyms ANOMS ANSI ATADS ATCT CEQ County CNEL CT db dba DNL DoD FAA FAR FICAN FICON GA HPN HUD INM Leq MBIA NASA NIPTS NLR NY OAG OSHA PTS RMT SEL Sq mi SUNY TAF TCA TTS USEPA USGS WHO Airport Noise Monitoring System American National Standards Institute Air Traffic Data Information System Air Traffic Control Tower Council on Environmental Quality County of Westchester Community Noise Equivalent Level Connecticut Decibel A-weighted Decibel Day-Night Sound Level Department of Defense Federal Aviation Administration Federal Aviation Regulation Federal Interagency Committee on Aviation Noise Federal Interagency Committee on Noise General Aviation Westchester County Airport Department of Housing and Urban Development Integrated Noise Model Equivalent Sound Level Municipal Bond Insurance Association National Aeronautics and Space Administration Noise-Induced Permanent Threshold Shift Noise Level Reduction New York Official Airline Guide US Occupational Safety and Health Administration Permanent Threshold Shift Remote Monitoring Terminal Sound Exposure Level Square Mile State University of New York Terminal Area Forecasts Terminal Capacity Agreement Temporary Threshold Shift US Environmental Protection Agency US Geological Survey World Health Organization v
11 This page intentionally left blank. vi
12 1 INTRODUCTION The County of Westchester (County) initiated this study to determine existing and future noise impacts resulting from aircraft operations at Westchester County Airport (HPN). The last noise impact analysis conducted for HPN was in the mid-1980s and since that time, the mix of aircraft types (the fleet mix ) serving HPN has changed. This report documents updated aircraft noise contours and discusses their significance. Westchester County Airport is located in the Town/Village of Harrison, the Town of North Castle, and the Village of Rye Brook (in the Town of Rye) in Westchester County, New York (NY). The approximately 700-acre airport is adjacent to Fairfield County, Connecticut. It is approximately four miles northeast of White Plains, New York, and about 12 miles northeast of New York City (Figure 1-1, Location Map). Owned by the County of Westchester and managed under contract by American Ports Services, Inc., the airport serves general, commercial, and corporate aviation uses, principally residents and business travelers in Westchester and Fairfield Counties. This report is organized as follows: Chapter 1 Presents a general introduction to noise principles and noise metrics. Chapter 2 Presents forecasts of aviation operations and passenger enplanements. Chapter 3 Provides 1999 and 2005 noise exposure contours and the land acreage within each contour. Comparisons between these contours and the contours prepared for HPN in 1988 are provided. Chapter 4 Presents an analysis of noise impacts resulting from aviation operations at HPN. It provides the estimated number of households and individuals, and identifies sensitive uses and major businesses within each noise contour off-airport. 1.1 Noise Principles Noise, often defined as unwanted sound, is one of the most common environmental issues associated with aircraft operations. Aircraft are not the only sources of noise in an urban or suburban environment, where interstate and local roadway traffic, rail, industrial, and neighborhood sources also intrude on the everyday quality of life. Nevertheless, aircraft are readily identified by their noise and are typically singled out for special attention and criticism. Consequently, aircraft noise problems often dominate analyses of environmental impacts. To help understand and interpret these impacts, it is important to be familiar with the various metrics that are used to describe the noise from an aircraft and from the collection of noise events that 1-1 Introduction
13 Aircraft Noise Study comprise an airport noise environment. This introductory section describes those commonly used noise metrics, in increasing complexity. They include the: Decibel (db). A-weighted decibel, or sound level (dba). Sound Exposure Level (SEL). Equivalent Sound Level (L eq ). Day-Night Sound Level (DNL). Community Noise Equivalent Level (CNEL) Single-Event Noise Metrics Sound is a physical phenomenon consisting of minute vibrations that travel through a medium, such as air, and are sensed by the human ear. Whether that sound is interpreted as pleasant (music, for example) or unpleasant (aircraft noise, for example) depends largely on the listener's current activity, experience, and attitude toward the source of that sound. It is often true that one person's music is another person s noise. The loudest sounds the human ear can comfortably hear have one trillion (1,000,000,000,000) times the acoustic energy of sounds the ear can barely detect. Because of this vast range, any attempt to represent the intensity of sound using a linear scale becomes unwieldy. As a result, a logarithmic unit called the decibel (db) is used to represent the intensity of sound. This representation is called a sound pressure level. A sound pressure level of less than 10 db is approximately the threshold of human hearing and is barely audible under extremely quiet conditions. Normal conversational speech has a sound pressure level of approximately 60 to 65 db. Sound pressure levels above 120 db begin to be felt inside the human ear as discomfort and eventually pain at still higher levels. Decibel Addition Some simple rules of thumb are useful in dealing with sound pressure levels. First, if a sound's intensity is doubled, the sound pressure level increases by 3 db, regardless of the initial sound level. Thus, for example: 60 db + 60 db = 63 db, and 80 db + 80 db = 83 db. On the other hand, the total sound pressure level produced by two sources of different levels is usually only slightly more than the higher of the two. For example: 60.0 db db = 70.4 db. Introduction 1-2
14 (/ 209 (/ 44 ', 87 NY (/ NJ 46 ', 287 Paterson ', 80 Yonkers ', 95 ', 84 ', 684 Æ` ', 495 (/ 1 VA CT (/ (/ (/ "!8 Westchester Airport (/ 7 Newark Manhattan H u d s o n R i v e r Queens Location Map Newburgh Poughkeepsie "!15 Stamford PA MD Bridgeport L o n g I s l a n d S o u n d L o n g I s l a n d NY NJ VT NH MA CT Area of Interest A t l ME RI a n t c i New ', 91 Haven (/ 1 ', 78 ', 95 Elizabeth (/ 9 (/ 1 Brooklyn A t l a n t i c O c e a n Æ` Westchester Airport State Boundary Scale in Miles 0 20 Scale in Kilometers Figure 1-1 N
15 Typical A-Weighted Sound Levels COMMON SOUNDS SOUND LEVEL db LOUDNESS - Compared to 70 db - Jet Engine at 3 m (10 ft) 140 Threshold of Pain 130 Oxygen Torch 120 UNCOMFORTABLE 32 Times as Loud Accelerating Motorcycle at 5 m (15 ft) Times as Loud Textile Mill 100 VERY LOUD 90 4 Times as Loud Garbage Disposal 80 Heavy Truck at 15 m (50 ft) MODERATE Vacuum Cleaner at 3 m (10 ft) 70 Automobile at 30 m (100 ft) Two Person Conversation 60 Quiet Urban Daytime 50 QUIET 1/4 as Loud Quiet Urban Nighttime 40 Bedroom at Night 30 1/16 as Loud 20 Recording Studio Threshold of Hearing 10 JUST AUDIBLE 0 Source: Based on Harris, 1979 and Pierce, Figure 1-2
16 Westchester County Airport Additionally, not all sound pressures are heard equally well by the human ear. Some tones are easier to detect than others and hence, are perceived as being louder or noisier. Thus, in measuring community noise, frequency dependence is taken into account by adjusting the very high and very low frequencies to approximate the human ear s reduced sensitivity to those frequencies. This adjustment is called A-weighting and is commonly used in measurements of environmental noise. Figure 1-2 (Typical A Weighted Sound Levels) shows A-weighted sound levels for some common sounds. In this document, all sound pressure levels are A-weighted and, as is customary, are referred to simply as sound levels, where the adjective A-weighted has been omitted. Sound levels are designated in terms of A-weighted decibels, abbreviated dba. With A-weighting, a noise source having a higher sound level than another is generally perceived as louder. Also, the minimum change in sound level that people can detect outside of a laboratory environment is on the order of 3 db. A change in sound level of 10 db is usually perceived by the average person as a doubling (or halving) of the sound s loudness, and this relationship holds true for loud sounds as well as for quieter sounds (Table 1-1). Change (dba) Source: Based on FHWA, June Table 1-1 Decibel Changes and Loudness Relative Loudness Reference Barely perceptible change Readily perceptible change Half or twice as loud 1/4 or four times as loud 1/8 or eight times as loud A further complexity in judging the impact of a sound is how long it lasts; long duration noises are more annoying than short ones. The period over which a noise is heard is accounted for in noise measurements and analyses by integrating sound pressures over time. In the case of an individual aircraft flyover, this can be thought of as accounting for the increasing noise of the airplane as it approaches, reaches a maximum, and then falls away to blend into the background. (Figure 1-3, Illustration of Sound Exposure Level). The total noise dose, or exposure, resulting from the time-varying sound is normalized to a one-second duration so that exposures of different durations can be compared on an equal basis. This time-integrated level is known as the Sound Exposure Level (SEL), measured in A-weighted decibels. 1-3 Introduction

17 Aircraft Noise Study Figure 1-3 Illustration of Sound Exposure Level Sound Level, in dba Because aircraft noise events last longer than one second, the time-integrated SEL always has a value greater in magnitude than the maximum sound level of the event usually about 7 to 10 db higher for most airport environments. SELs are utilized in this study as a means of comparing the noise of several significant aircraft types; they are also highly correlated with sleep disturbance, an impact that is discussed later in this report. The remaining noise metrics discussed in this section refer to the accumulation of exposure caused by multiple noise events over time. While such metrics are often viewed as downplaying the importance of individual aircraft operations, they are extremely good indicators of community annoyance with complex noise environments, and they have become widely accepted as the most appropriate means of evaluating land use planning decisions Cumulative Noise Exposure Metrics The most basic measure of cumulative exposure is the Equivalent Sound Level (L eq ). It is a measure of exposure resulting from the accumulation of A-weighted sound levels over a particular period (as opposed to an event) of interest such as an hour, an eight-hour school day, nighttime, a single 24-hour period, or an average 24-hour period. Because the length of the Introduction 1-4
 or L eq (24).")
18 Westchester County Airport period can differ, the applicable period should always be identified or clearly understood when discussing the metric. Such durations are often identified through a subscript, for example L eq (8) or L eq (24). Conceptually, the L eq may be thought of as the constant sound level occurring over the designated period of interest and having as much sound energy as that created by the actual rising and falling sound pressures from multiple noise sources as they become more or less pronounced. This is illustrated in Figure 1-4 (Illustration of Equivalent Sound Level) for the same representative one-minute of exposure shown earlier in Figure 1-2. Both the solid and striped shaded areas have a one-minute L eq value of 76 dba. It is important to recognize, however, that the two representations of exposure (the constant one and the time-varying one) would sound very different from each other were they to occur in real life. Figure 1-4 Illustration of Equivalent Sound Level Sound Level, in dba Leq = 76 Leq = 76 Minute Often the L eq is referred to misleadingly as an average sound level. This is not true in the traditional sense of the term average. Because decibels are logarithmic quantities, loud events dominate the calculation of the L eq ; for example, if an aircraft were to produce a constant sound level of 85 dba for 30 seconds out of the minute then immediately disappear, leaving only ambient noise sources to produce a level of 45 dba for the remainder of the minute, the L eq for the full minute would be 82 dba just 3 decibels below the maximum caused by the aircraft, not the 65 dba suggested by normal averaging. More typical timeframes of interest are daytime, nighttime, and annual average 24-hour exposure levels, but all of these same principles of combining sound levels apply to those periods as well. Loud noise events occurring during any timeframe are going to have the greatest influence on the overall exposure for the period. 1-5 Introduction
19 Aircraft Noise Study The Day-Night Sound Level, DNL The most widely-used cumulative noise metric is a variant of the 24-hour L eq known as the daynight sound level, or DNL, a measure of noise exposure that is highly correlated with community annoyance. It is also associated with a variety of land use guidelines that suggest where incompatibilities are expected to exist between the noise environment and various human activities. Because of these strengths, the metric is required to be used on airport noise studies funded by the Federal Aviation Administration (FAA). In simple terms, DNL is the equivalent sound level for a 24-hour period, modified so that noises occurring at night (defined specifically as 10:00 pm through 7:00 am) are artificially increased by 10 db. This penalty reflects the added intrusiveness of nighttime noise events as community activity subsides and ambient noise levels get quieter. The penalty is mathematically equivalent to multiplying the number of nighttime noise events by a factor of ten. Originally, the US Environmental Protection Agency (USEPA) identified DNL as the most appropriate means of evaluating airport noise based on the following considerations (from Information on Levels of Environmental Noise Requisite to Protect Public Health and Welfare with an Adequate Margin of Safety, USEPA Report No. 550/ , September 1974): The measure should be applicable to the evaluation of pervasive long-term noise in various defined areas and under various conditions over long periods of time. The measure should correlate well with known effects of the noise environment and on individuals and the public. The measure should be simple, practical and accurate. In principal, it should be useful for planning as well as for enforcement or monitoring purposes. The required measurement equipment, with standard characteristics, should be commercially available. The measure should be closely related to existing methods currently in use. The single measure of noise at a given location should be predictable, within an acceptable tolerance, from knowledge of the physical events producing the noise. The measure should lend itself to small, simple monitors, which can be left unattended in public areas for long periods of time. Despite these origins, the lay public often criticizes the use of DNL as not accurately representing community annoyance and land use compatibility with aircraft noise. Much of that criticism stems from a lack of understanding of the measurement or calculation of DNL. One frequent criticism is based on the feeling that people react more to single noise events than to Introduction 1-6
20 Westchester County Airport meaningless" time-average sound levels. In fact, DNL takes into account both the noise levels of all individual events occurring during a 24-hour period and the number of times those events occur. The logarithmic nature of the decibel causes noise levels of the loudest events to control the 24-hour average, just as they were shown to do in the previous discussion of shorter-term L eq s. DNL Illustration The averaging of noise over a 24-hour period does not ignore the louder single events and, in fact, tends to emphasize both the higher sound levels and the number of those events. This is the basic concept of a time-average sound metric, and specifically the DNL. Consider these two examples: A single aircraft overflight occurs during the daytime of a 24-hour period and creates a sound level of 100 db for 30 seconds. During the remaining 23 hours, 59 minutes, and 30 seconds of the day, the ambient sound level is 50 db. The DNL for this 24-hour period is 65.5 db. Ten 30-second overflights occur during the daytime of the next 24-hour period with the same ambient sound level of 50 db during the remaining 23 hours and 55 minutes of the day. The DNL for this 24-hour period is 75.4 db. Most federal agencies dealing with noise have formally adopted DNL, though they also encourage the use of supplemental noise metrics to aid the public in its understanding of the complex noise environment of an airport. The Federal Interagency Committee on Noise (FICON), comprised of member agencies such as the FAA, Department of Defense (DoD), USEPA, Department of Housing and Urban Development (HUD), National Aeronautics and Space Administration (NASA), Council on Environmental Quality (CEQ), and the Department of Veterans Affairs, reaffirmed the appropriateness of DNL in The FICON summary report stated, There are no new descriptors or metrics of sufficient scientific standing to substitute for the present DNL cumulative noise exposure metric. DNL can be measured or estimated. Measurements are practical only for obtaining DNL values for a relatively limited numbers of points, and, except in the case of a permanently installed noise monitoring system, only for relatively short time periods. Most airport noise studies, including the present assessment of noise at Westchester County Airport, are based on computer-generated DNL estimates, depicted in terms of equal-exposure noise contours, much as topographic maps have contours of equal elevation. Typical DNL levels in a community can range from highs of 70 to 75 dba in a noisy urban environment to lows of 40 to 45 dba in very quiet rural areas. DNL levels near a modest sized commercial airport such as Westchester County s would normally range from about 55 to 70 dba. A DNL of 65 dba is considered by the FAA to be the onset of significant impact on residential land use near an airport. Exposure levels less than that are acknowledged to cause people to be highly annoyed (see Subchapter 4.3), but levels greater than 65 dba are considered high enough to qualify for certain mitigation measures, including sound insulation treatment of homes. 1-7 Introduction
21 Aircraft Noise Study The Community Noise Equivalent Level, CNEL The final noise metric to be considered in this assessment of noise at Westchester is the community noise equivalent level, CNEL. It is analogous to the day-night sound level except that in addition to the 10 decibel penalty on night activity, it includes a 4.8 decibel penalty on evening noise events occurring between 7:00 pm and 10:00 pm. This evening penalty is mathematically equivalent to multiplying the number of evening noise events by a factor of three; the added emphasis on the evening period normally adds a few tenths of a decibel to the comparable DNL value for the same activity. More significantly, while CNEL is required by California state law to be used in environmental assessments in that state, that is the only location within the United States where the metric is officially sanctioned. CNEL is not a metric recognized by the American National Standards Institute (ANSI), the standards-setting organization for the Acoustical Society of America. It is included in this analysis as a supplemental measure to specifically address the impacts of evening activity on nearby residents. 1.2 Noise and Land Use Compatibility Guidelines Based on the relationships between noise and the collective response of people to their environment, DNL has become accepted as a standard for evaluating community noise exposure and as an aid in decision-making regarding the compatibility of alternative land uses. In their application to airport noise in particular, DNL projections have two principal functions: To provide a means for comparing existing noise conditions with those that might result from the implementation of noise abatement procedures and/or from forecast changes in airport activity; and To provide a quantitative basis for identifying and judging potential noise impacts. Both of these functions require the application of objective criteria. Government agencies dealing with environmental noise have devoted significant attention to this issue, and thus have developed noise/land use compatibility guidelines to help federal, state, and local officials with this evaluation process FAA Regulations and Guidelines In Federal Aviation Regulation (FAR) Part 150, which defines procedures for developing airport noise compatibility programs, the FAA has established DNL as the official cumulative noise exposure metric for use in airport noise analyses, and has developed recommended guidelines for noise/land use compatibility evaluation. Table 1-2 presents these guidelines. Introduction 1-8
22 Westchester County Airport Table 1-2 FAA Noise/Land Use Compatibility Guidelines Yearly Day-Night Average Sound Level, L dn Land Use in Decibels < >85 Residential Use Residential other than mobile homes and transient lodgings Y N(1) N(1) N N N Mobile home park Y N N N N N Transient lodgings Y N(1) N(1) N(1) N N Public Use Schools Y N(1) N(1) N N N Hospitals and nursing homes Y N N N Churches, auditoriums, and concert halls Y N N N Governmental services Y Y N N Transportation Y Y Y(2) Y(3) Y(4) Y(4) Parking Y Y Y(2) Y(3) Y(4) N Commercial Use Offices, business and professional Y Y N N Wholesale and retain building materials, hardware and farm equipment Y Y Y(2) Y(3) Y(4) N Retain trade general Y Y N N Utilities Y Y Y(2) Y(3) Y(4) N Communication Y Y N N Manufacturing and Production Manufacturing general Y Y Y(2) Y(3) Y(4) N Photographic and optical Y Y N N Agriculture (except livestock) and forestry Y Y(6) Y(7) Y(8) Y(8) Y(8) Livestock farming and breeding Y Y(6) Y(7) N N N Mining and fishing, resource production and extraction Y Y Y Y Y Y 1-9 Introduction
23 Aircraft Noise Study Table 1-2 (continued) Land Use Yearly L dn in Decibels < >85 Recreational Outdoor sports arenas and spectator sports Y Y(5) Y(5) N N N Outdoor music shells, amphitheaters Y N N N N N Nature exhibits and zoos Y Y N N N N Amusements, parks, resorts and camps Y Y Y Y Y Y Golf courses, riding stables, water recreation Y Y N N Notes: Y(Yes) - Land use and related structures compatible without restrictions. N(No) - Land use and related structures are not compatible and should be prohibited. NLR (Noise Level Reduction) (outdoor to indoor) - to be achieved through incorporation of noise attenuation into the design and construction of the structure. 25, 30, or 35 - Land use and related structures generally compatible; measures to achieve NLR of 25, 30, or 35 db must be incorporated into design and construction of structure. (1) Where the community determines that residential or school uses must be allowed, measures to achieve outdoor to indoor noise level reduction (NLR) of at least 25 db and 30 db should be incorporated into building codes and be considered in individual approvals. Normal residential construction can be expected to provide a NLR of 20 db, thud, the reduction requirements are often stated as 5, 10, or 15 db over standard construction and normally assume mechanical ventilation and closed windows year round. However, the use of NLR criteria will not eliminate outdoor noise problems. (2) Measures to achieve NLR of 25 db must be incorporated into the design and construction of portions of these buildings where the public is received, office areas, noise sensitive areas or where the normal noise level is low. (3) Measures to achieve NLR of 30 db must be incorporated into the design and construction of portions of these buildings where the public is received, office areas, noise sensitive areas or where the normal noise level is low. (4) Measures to achieve NLR of 35 db must be incorporated into the design and construction of portions of these buildings where the public is received, office areas, noise sensitive areas or where the normal noise level is low. (5) Land use compatible provided special sound reinforcement systems are installed. (6) Residential buildings require an NLR of 25. (7) Residential buildings require an NLR of 30. (8) Residential buildings not permitted. The designations contained in this table do not constitute a federal determination that any use of land covered by the program is acceptable or unacceptable under federal, state, or local law. The responsibility for determining the acceptable and permissible land uses and the relationship between specific properties and specific noise contours rests with the local authorities. FAA determinations under Part 150 are not intended to substitute federally determined land uses for those determined to be appropriate by local authorities in response to locally determined needs and values in achieving noise compatible land uses. Source: FAR Part 150. Introduction 1-10
24 Westchester County Airport The guidelines represent a compilation of extensive scientific research into noise-related activity interference and attitudinal response. However, reviewers of DNL contours should recognize the highly subjective nature of response to noise and the special circumstances that can either increase or decrease individuals tolerance. For example, a high non-aircraft background or ambient noise level (such as from traffic) can reduce the significance of aircraft noise. Alternatively, residents of areas with unusually low background levels may find relatively low levels of aircraft noise very annoying Housing and Urban Development (HUD) Guidelines HUD has promulgated regulations (set forth in Part 51 of the Code of Federal Regulations (24 CFR Part 51) that establish criteria for the eligibility of a site to qualify for federal funds supporting construction. Like the FAA's, those criteria are defined in terms of DNL and also utilize DNL 65 as the threshold of acceptability. They are summarized in Table 1-3. Table 1-3 HUD Site Acceptability Standards Category DNL in db Special Requirements Acceptable Normally Unacceptable Unacceptable Not exceeding 65 db Above 6 5 db but not exceeding 75 db Above 75 db None 5 to 10 db additional attenuation required Approval with additional attenuation on a case-bycase basis World Health Organization (WHO) Community Noise Guidelines The World Health Organization (WHO) published guidelines for community noise in April The WHO Community Noise report (1995), and subsequent Guidelines for Community Noise (2001), present consensus opinions of the international scientific community regarding recommended ideal exposure criteria that are chosen to give adequate protection to the exposed human populations "with an adequate margin of safety.". This approach is consistent with the approach taken by the USEPA in 1974, when it recommended DNL 55 db as the threshold cumulative environmental noise level suitable for residential land use in its report Information on Levels of Environmental Noise Requisite to Protect the Public Health and Welfare with an Adequate Margin of Safety Introduction
25 Aircraft Noise Study The development of a public policy and standard, however, must take into consideration issues of economic and technical feasibility. For this reason, the FAA, HUD, and other federal agencies have identified DNL 65 db as the level below which all land uses are considered compatible (and with proper sound insulation, projects may be built where exposure is higher). These guidelines were reconfirmed by FICON in Indeed, the WHO guidelines document itself states that regulatory standards usually include aspects other than scientific data, including "technological feasibility, costs of compliance, prevailing exposure levels, and the social, economic, and cultural conditions (Chapter 5)." A summary of the WHO guidelines is presented in Table 1-4. Chapter 2 discusses the aircraft operations which create the noise environment at Westchester County Airport. Introduction 1-12
26 Westchester County Airport Table 1-4 World Health Organization Guidelines Specific Environment Critical Health Effects Guideline Metric/Value Outdoor living area Serious annoyance, daytime and L eq (16) 55 dba evening Moderate annoyance, daytime and L eq (16) 50 dba evening Dwelling, indoors Speech intelligibility & moderate L eq (16) 35 dba annoyance, daytime and evening Inside bedrooms Sleep disturbance, nighttime L eq (8) 30 dba; L max 45 dba Outside bedrooms Sleep disturbance, window open L eq (8) 60 dba (outdoor values) School classrooms and pre-schools, indoors Speech intelligibility, disturbance of information extraction, message L eq during class 35 dba communication Pre-school bedrooms, indoors Sleep disturbance L eq during sleepingtime 30 dba School, playground outdoors Annoyance (external source) L eq during play 55 dba Hospital ward rooms, indoors Sleep disturbance, nighttime L eq (8) 30 dba; L max 40 dba Sleep disturbance, daytime and L eq (16) 30 dba evening Hospital treatment rooms, indoors Interference with rest and recovery As low as possible Industrial, commercial shopping, and Hearing impairment L eq (24) 70 dba traffic areas, indoors and outdoors Ceremonies, festivals, and entertainment events Hearing impairment (Patrons<5 times/yr) L eq (4) 100 dba; Lmax 110 dba Public addresses, indoors and outdoors Hearing impairment L eq (1) 85 dba; L max 110 Music and other sounds through headphones/earphones Hearing impairment (free-field value) L eq (1) 85 dba 1 ; L max 110 dba Impulse sounds from toys, fireworks, and Hearing impairment (adults) L max 140 dba 2 firearms Hearing impairment (children) L max 120 dba 2 Outdoors in parkland and conservation Disruption of tranquility See #3, below. areas NOTES: 1. Under headphones, adapted to free-field values. 2. Peak sound pressure measured 100 mm from the ear. 3. Existing quiet outdoor areas should be preserved and the ratio of intruding noise to natural background sound should be kept low Introduction
27 Aircraft Noise Study This page intentionally left blank. Introduction 1-14
28 2 FORECASTS OF 2005 AVIATION OPERATIONS AND FLEET MIX The forecasts of year 2005 activity at HPN were developed in two steps: first, for total general aviation (GA) operations and commercial passenger enplanements, and second, for GA and commercial carriers. The GA fleet mix was developed by expanding the current GA fleet to equal the number of total operations forecast for The commercial carrier fleet mix was determined by expanding the September 2000 commercial fleet to accommodate the number of passengers forecast for The development of year 2005 forecasts and the forecasts themselves are summarized in this chapter. The detailed analysis is presented in Forecasts of 2005 General Aviation Operations, Passenger Enplanements, and Fleet Mix (Appendix A of this report). 2.1 General Aviation and Passenger Forecasts General Aviation Activity Forecasts Table 2-1 identifies historic levels of GA operations at HPN between 1985 and 2000 (derived from the FAA Terminal Area Forecasts [TAF] and the FAA Air Traffic Data Information System [ATADS]). Itinerant operations (i.e., operations by aircraft that do not stay within sight of the air traffic control tower [ATCT] during the flight) have shown a relatively steady growth, averaging 2.2 percent per year since Itinerant GA operations include trips for business or personal travel between airports. Importantly, this category includes almost all operations by larger business aircraft in the turboprop and business jet classes. Local operations (i.e., operations by aircraft that remain within sight of the ATCT during the flight) have shown a steady decline at HPN since The decline in local operations reflects fewer touch-and-go operations, full stop landings, and low approaches all used in training. With respect to national GA activity, the FAA s forecasts show the highest GA growth rates in the categories of turboprop and turbojet aircraft, itinerant operation, and instrument operations all categories associated with business flying. This is consistent with recent trends at HPN (regarding itinerant operations). The FAA forecasts a moderate growth in local operations (primarily training) at the national level, which is not consistent with the recent trend at HPN for local operations (i.e., of steady declines in local [training] operations However, based on the FAA forecasts and the opinions of the heads of two flight schools at HPN, local operations are anticipated to reverse the declining trend of the last six years and show moderate growth starting in Table 2-1 compares the FAA s TAF for GA operations at HPN with two other forecasts: a linear regression based on historic activity between 1995 and 2000 (Linear Regression Forecast) and application of the average annual growth rate to (Average Annual Growth Forecast). The Average Annual Growth Forecast represents a mid-ground between the other two 2005 Forecasts 2-1 Aviation Operations and Fleet Mix
29 Table 2-1 Historic General Aviation Activity and Forecasts for Westchester County Airport: Number of Annual Operations Year Historic Activity 1 FAA Terminal Area Forecast 2 Linear Regression ('95-'00) 3 Avg. '95-'00 Annual Growth 4 Itinerant Local Total Itinerant Local Total Itinerant Local Total Itinerant Local Total ,100 47, , ,143 40, , ,463 31, , ,236 27, , ,272 32, , ,235 34, , ,218 35, , ,008 35, , ,372 33, , ,647 43, , ,413 40, , ,054 38, , ,977 35, , ,403 37, , ,934 39, , ,282 29, , ,417 41, , ,718 31, , ,029 27, , ,417 42, , ,873 29, , ,837 25, , ,785 43, , ,027 28, , ,706 23, , ,024 44, , ,182 26, , ,639 22, , ,300 45, , ,337 25, , ,637 20, ,800 Notes: 1 Source of Historic Activity : FAA Terminal Area Forecasts : FAA Air Traffic Data Information System (ATADS). 2 Source: FAA Terminal Area Forecast for HPN. 3 Linear regression based on historic data. 4 Application of the average annual growth rate that occurred between 1995 and
30 Westchester County Airport activity forecasts and is used to represent itinerant activity through With respect to local activity, an average annual growth rate of 1.8 percent (from the FAA s Terminal Area Forecast specifically for HPN) was utilized. Table 2-2 represents the forecast of GA activity at HPN through Table 2-2 Forecast of Total General Aviation Operations for Westchester County Airport: Year Itinerant 1 Local 2 Total ,282 29, , ,029 29, , ,837 30, , ,706 30, , ,639 31, , ,637 32, ,661 Average Annual Growth Rate % 1.8% 2.1% Notes: 1 From Average Annual Growth forecast. 2 Annual growth rate from FAA's Terminal Area Forecast Passenger Forecasts Forecasts of total passengers are necessary to determine the number and size of scheduled passenger flights needed in These passenger forecasts were ultimately converted into the number of aircraft seats needed in 2005 and then into a fleet of commercial service aircraft that is consistent with the fleets of the airlines serving HPN and that can be serviced by HPN s four gates. HPN has experienced regular growth in passenger enplanements since 1984, albeit at different rates of change. Between 1984 and 1990, passengers grew at the very high average of 20 percent per year. The average annual growth rate slowed in the 1990s to an average annual rate of 7.1 percent between 1990 and 1994 and then to 2.2 percent between 1995 and This slowing of growth reflects the constraints on the size and number of scheduled passenger aircraft serving HPN imposed by the Terminal Capacity Agreement (TCA) that took effect in Table 2-3 lists historic passenger enplanements at HPN since 1984 and three alternate forecasts discussed below. The FAA s historic passenger activity and forecasts for air carrier airports are available through TAF. The TAF forecast of total passengers shows an average annual growth rate of almost 3.8 percent, while the actual annual growth rate between 1995 and 2000 was 2.2 percent. It appears the TAF reflects national trends rather than the constrained environment at HPN resulting from implementation of the TCA Forecasts 2-3 Aviation Operations and Fleet Mix
31 Aircraft Noise Study Table 2-3 Historic Total Passenger Counts and Alternate Forecasts for HPN: Master Regression Year Historic TAF3 Plan Forecasts ('95-'00) 4 Annual Rate ('95-'00) , , , , , , , , , , , , , , , , ,084, , ,041, ,024, ,118,134 1,049,860 1,037, ,162,720 1,059,853 1,049, ,207,308 1,069,846 1,062, ,251,894 1,079,839 1,075, ,296,480 1,089,832 1,089, ,251,000 Average Annual Growth Rates % % % % % 0.9% 1.2% Notes: 1 Source: Airport records. 2 Source: 1986 Master Plan Update, Westchester County Airport. 3 Source: FAA, 2000 Terminal Area Forecasts. 4 Linear regression based on historic data. 5 Average annual growth rate based on historic data Forecasts 2-4 Aviation Operations and Fleet Mix
32 Westchester County Airport As long as the TCA remains in effect, HPN cannot return to the rapid growth rates of the 1980s and early 1990s. The period appears to best reflect the maximum growth that HPN will experience in the next five years. Using this as the base period, two alternative forecasts of passengers were developed: (1) a linear regression based on total passengers between 1995 and 2000; and (2) a forecast that applies the same average annual growth rate that occurred between the years of to the years These two forecasts are a simple mathematical extension of historic activity between 1995 and 2000, and do not reflect input from the carriers serving HPN. The TAF produces a substantially higher growth rate and number of passengers than the other two forecasts. The linear regression and average annual growth forecasts produce almost equal results and better reflect the constraints imposed on passenger activity at HPN. Interestingly, the 1986 Master Plan forecasts appear to be linear between 1991 and 2006 and reflect a much more optimistic rate of growth than has been evidenced recently under the TCA constraints. The linear regression forecast based on passenger activity was selected as the most appropriate forecast and is shown in Table 2-4. Table 2-4 Forecast of Total Passengers at HPN: Year Passengers ,049, ,059, ,069, ,079, ,089, Fleet Mix Forecasts General Aviation Fleet Mix The makeup of the current GA fleet for HPN was identified by using 1999 data generated by the Airport Noise Monitoring System (ANOMS). The ANOMS data include only those operations that have filed an instrument flight plan. It becomes necessary, then, to estimate the number of non-instrument operations from a data source that includes both visual (non-instrument) and instrument operations. The FAA s air traffic data provide the best source for this information. The FAA s historic and projected operations data for HPN for the years (1985 through 1999 are historic data) were, therefore, used in the development of the GA fleet mix forecast for HPN. Table 2-5 provides the annual GA operations at HPN by type of operation, class of aircraft, and period of the day Forecasts 2-5 Aviation Operations and Fleet Mix
33 Aircraft Noise Study Table 2-5 Annual GA Operations for HPN by Type of Operation, Class of Aircraft, and Period of the Day Type Operation Aircraft Class Period of Day Year Day 39,416 39,529 44,192 Corporate Jet - 3 Evening 6,969 6,989 7,814 Night 4,740 4,753 5,314 Total 51,125 51,272 57,320 Day Corporate Jet - 2 Evening Night Total 1,096 1,096 1,096 Day Multi-Engine Piston Evening Night Total Day 6,969 6,989 7,796 Instrument Single-Engine Piston Evening ,106 Night Total 8,404 8,427 9,401 Day 7,006 7,026 7,838 Itinerant Single-Engine TP Evening 1,049 1,052 1,174 Night Total 8,540 8,564 9,553 Day 7,457 7,478 8,341 Twin-Engine TP Evening Night Total 8,877 8,902 9,930 Day 4,065 4,076 4,547 Helicopter Evening Night Total 4,930 4,944 5,515 Day Light Twin Piston Evening Night Visual Total Day 33,159 33,252 37,093 Single Piston Evening 4,704 4,718 5,263 Night 2,120 2,126 2,372 Total 39,984 40,096 44,728 Day Light Twin Piston Evening Night Total Local Day 31,696 23,711 25,924 Single Piston Evening 4,497 3,364 3,678 Night 2,027 1,516 1,658 Total 38,220 28,592 31, Forecasts 2-6 Aviation Operations and Fleet Mix
34 Westchester County Airport Commercial Passenger Aircraft Fleet Mix The estimate of the daily fleet of commercial passenger aircraft anticipated to serve HPN in 2005 was developed by identifying a representative daily schedule and fleet and then expanding this fleet to accommodate the number of passengers forecast for The schedule for the week of April 10-17, 2000, served as the base schedule for development of a 2005 schedule of passenger operations (upon review of 2000 data at HPN, it was determined that the month of April best represented the average operations at HPN.) The schedule, which includes aircraft types, number of seats, arrival/departure time, and non-stop origin/destination, was obtained from the Official Airline Guide (OAG). Expansion of the number of operations and fleet to accommodate forecasts must be consistent with any limits imposed by the airport configuration and/or operating regulations, which in this case is the TCA that is in effect at HPN. The TCA was adopted by the County in 1985 to constrain activity at HPN. Those provisions in the agreement that are relevant to this study s forecasts are limitations on the number and size of commercial passenger gates. As summarized in Table 2-4, 1,089,832 enplaning and deplaning passengers are forecast at HPN in The additional 65,000 passengers can easily be accommodated (as compared with the year 2000) with no additional flights or increases in aircraft size. Assuming no new markets or carriers, it is likely that changes in the size of aircraft serving HPN and changes in the schedule will be based more on aircraft replacements at the discretion of the airlines than on requirements to accommodate additional passengers. The Integrated Noise Model (INM) requires the following inputs: a listing of the types of aircraft using the airport, the haul lengths for each aircraft type, a separation of activity into daytime (7:00 am to 7:00 pm), evening (7:00 to 10:00 pm), and nighttime (10:00 pm to 7:00 am) operations, and flight track information. It was assumed that no new markets will be added by 2005, so the markets and haul lengths will remain the same as the current schedule. Based on the capacity of the existing schedule and fleet, no new flights or larger aircraft were added to the schedule. Table 2-6 provides the 2005 commercial fleet for an average day at HPN. The 2005 schedule (daytime, evening, and nighttime), fleet, and haul length data for 2005 that served as input to the INM is detailed in Attachment B of the Forecasts of 2005 General Aviation Operations, Passenger Enplanements, and Fleet Mix (Appendix A of this report) Forecasts 2-7 Aviation Operations and Fleet Mix
35 Table Commercial Fleet for the Average Month, Average Day at HPN Aircraft Type Daytime (07:00-18:59) Evening (19:00 21:59) Night (22:00-06:59) Totals Departures Arrivals Departures Arrivals Departures Arrivals Departures Arrivals BAE AVRO RJ BEECHCRAFT 1900 (All Series) DE HAVILLAND DHC8 DASH MCDONALD DOUGLAS DC EMBRAER 135RJ CANADAIRE RJ BRITISH AEROSPACE JETSTREAM SAAB FAIRCHILD FOKKER BOEING Totals
36 3 NOISE EXPOSURE CONTOURS Existing operations data used in developing the fleet forecast described in Chapter 2, have also been utilized to produce baseline noise contours for HPN. The contour sets depict the cumulative exposure metrics DNL and CNEL. The DNL and CNEL contour sets have also been produced for the 2005 forecast fleet. This chapter documents the operational data that went into creating each contour set and presents each as an overlay to a base map of underlying land use and noise-sensitive community facilities. The chapter also includes a discussion of likely changes in exposure that are presumed to have occurred since the last noise contours were produced in conjunction with the 1988 Master Plan Study. The noise model used to generate the contours reported in this document is known as the Integrated Noise Model (INM), version 6.0b. It has been developed and upgraded over the years by the FAA s Office of Environment and Energy at FAA Headquarters in Washington, D.C., and some 400 copies of the software have been distributed to users worldwide. This latest version of the software was released in September Computer Model Input Basic inputs to the INM include airport geometry, numbers of daytime, evening, and nighttime operations by different aircraft types, flight track definitions, and the utilizations of different runways and flight corridors. They are summarized below Airport Layout The runway configuration at HPN was assumed to remain unchanged from 1999 to 2005, and is the same as the existing layout. The airport has two runways, and Runway is 6,548 feet long and Runway is 4,451 feet long, with a displaced threshold of 1,297 feet on the approach end of Runway Operation Numbers/Aircraft Type HPN s Noise Office provided operational counts for According to the HPN Noise Office, there were 194,604 annual operational counts in 1999 (Table 3-1). Annual counts were converted to daily operations for purposes of calculating 24-hour DNL and CNEL noise contours. 3-1 Noise Exposure Contours
37 Aircraft Noise Study Table Airport Operations by Aircraft Category Category Total Daily Average Commercial Air Carrier 16, Commercial Commuter 30, General Aviation (Itinerant) 108, General Aviation (Local 39, Pattern Activity) Military Total 194, Westchester County Airport also has an airport noise monitoring system that keeps track of individual flights at the airport. The system provided counts by aircraft and information as to whether the operation occurred during the day, evening or night. Consistent with the definitions of the noise metrics discussed in Chapter 1, day is defined as 7:00 am to 7:00 pm, evening is defined as 7:00 pm to 10:00 pm and night is defined as 10:00 pm to 7:00 am the next morning. The system also provided precise information on the distribution of operations by aircraft type throughout the day. That information was supplemented with data from the Official Airlines Guide (OAG) database pertaining to airline schedules for 1999; from that data the stage-lengths or travel distances for the scheduled commercial aircraft were derived. Together, these sources provided the detail necessary to create a fleet mix for an annual average day. A complete breakdown of the 1999 operations by these subcategories is included in Appendix B, Table B-1. The data are summarized by various aircraft groups in Table 3-1. Comparable data for 2005 were generated as part of the Forecast of 2005 General Aviation Operations, Passenger Enplanements, and Fleet Mix (Appendix A of this report, and summarized in Chapter 2 of this report). In addition to the projected number of operations, the 2005 forecast also included information on the destination and time of day of each flight. As in 1999, this information was used to develop the necessary details of the 2005 fleet mix for an average annual day. For a complete breakdown of the 2005 operations, see Appendix B, Table B-2. Operations by more general aircraft groups are shown in Table 3-2. Noise Exposure Contours 3-2
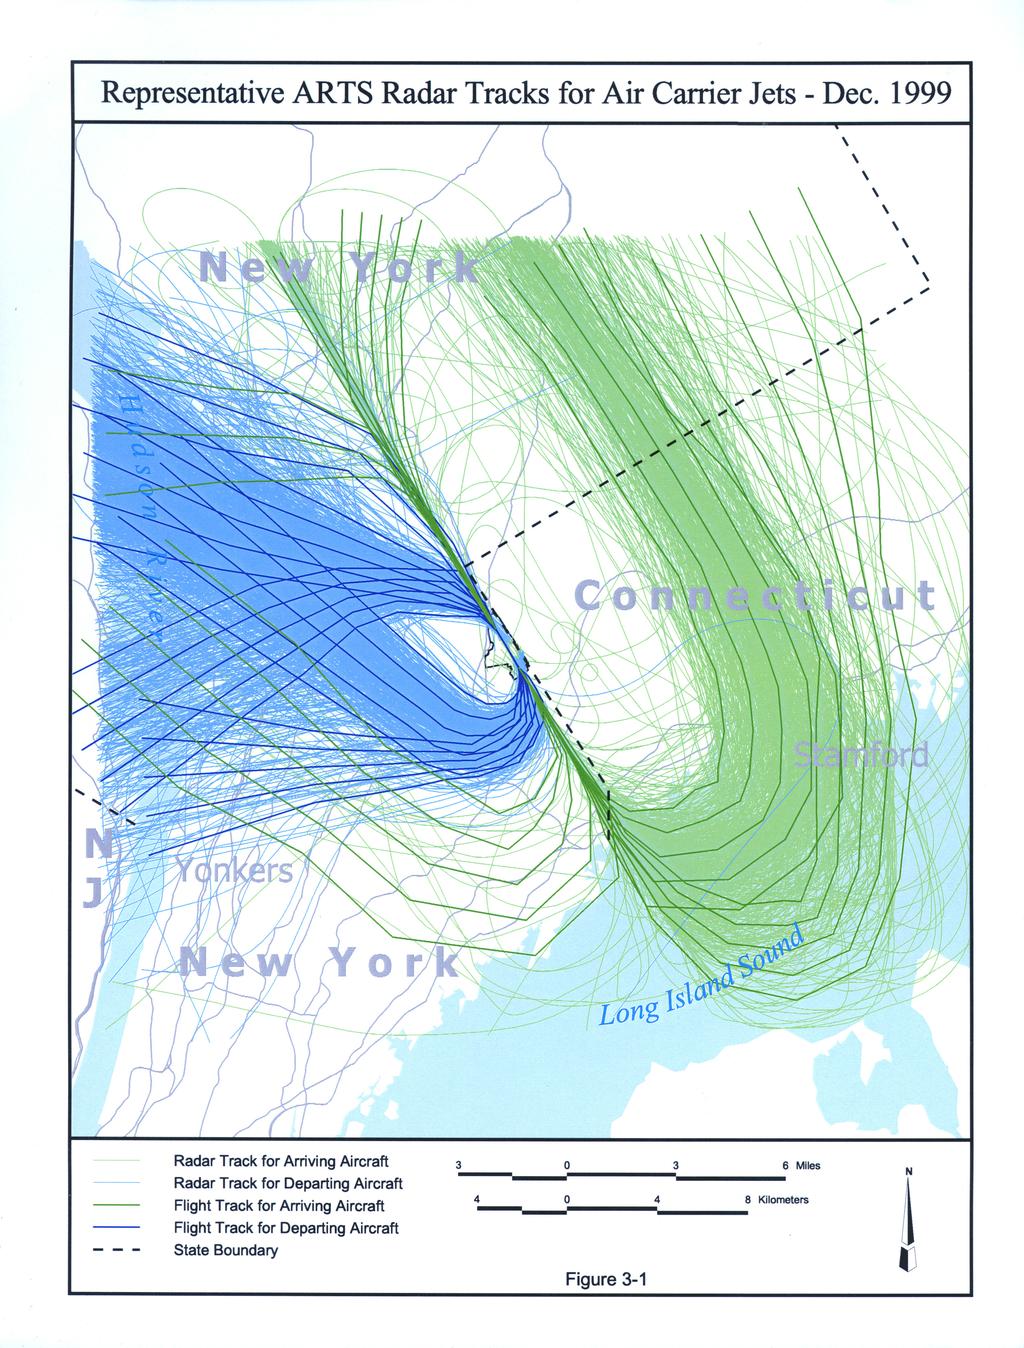
38 Westchester County Airport Table Forecast Airport Operations By Aircraft Category Category Total Daily Average Commercial Air Carrier 17, Commercial Commuter 33, General Aviation (Itinerant) 138, General Aviation (Local 31, Pattern Activity) Military Total 221, Runway Use The airport s noise monitoring system was again used to determine details of runway use for each runway end. These counts were further broken down into the three time periods (day, evening, and night) to account for any potentially significant shifts in the use of the runways during different times of day. From this information we were able to determine the runway use for five aircraft groups -- air carrier jets, corporate jets, air taxi operations, turboprops, and single engine piston aircraft. These runway utilizations were used for both the 1999 base year and the 2005 forecast scenario, since there were no anticipated changes to the operation of the airport over the six-year study period. In general, the utilizations show that all aircraft utilize Runway 16-34, with the predominant flow of traffic towards the northwest, and only the single engine piston aircraft and an occasional general aviation turboprop utilize the shorter Runway Also, departure traffic appears to favor Runway 34 for daytime departures, lowering use of that runway for evening and nighttime departures. Landing traffic is split approximately half-and-half, utilizing 16 and 34 about equally for landing during all three time frames. A complete breakdown of the runway use in included in Appendix B, Table B Flight Tracks/Flight Track Usage Four months of ARTS radar data from Westchester County Airport s noise monitoring system were used to develop the noise contours. This feature of the system only became operational as a result of a system upgrade completed in November of 1999; thus, although the data sample was not representative of a full year of 1999 activity, it did provide information on flight tracks that heretofore had been unavailable and were significantly more reliable than any previous method of obtaining flight corridor locations and utilizations. Data were analyzed for every third month beginning with December 1999, and included March, June, and September 2000 to account for seasonal variability in the data. The radar flight tracks were sorted into six groups by aircraft 3-3 Noise Exposure Contours
39 Aircraft Noise Study type and traffic flow, using the HPN noise monitoring system previously described. Each category of data was imported into the INM and analyzed to produce both primary backbone tracks and dispersed sub-tracks for each of the radar flows. A sample of the ARTS tracks for air carrier jets operating during the month of December 1999 is shown in Figure 3-1 (Representative ARTS Radar Tracks for Air Carrier Jets Dec. 1999). Arrivals are shown in green, departures in blue. Flight track utilizations were then computed and assigned to each of the backbone tracks. Track locations and their utilizations were assumed to remain constant between the 1999 and 2005 study years, as no changes in flight procedures are anticipated between the two scenarios. A complete breakdown of the 1999/2005 track utilizations is included in Appendix B, Tables B-4 and B DNL Noise Contours Contours for 1999 and 2005 Figure 3-2 (1999 and 2005 DNL Contours Land Use) shows the 60, 65, 70, and 75 decibel DNL noise contours for 1999 and 2005 superimposed over a land use base map of the surrounding community. Table 3-3 shows the areas within each contour. Table 3-3 Westchester Contours for 1988,1999, and 2005 Area within the Contours (sq mi) Year/Metric >60 db >65 db >70 db >75 db 1999 DNL DNL CNEL CNEL DNL The 75 decibel DNL contour is contained entirely within the airport boundary for each of the two study years; the 70 db DNL contours extend off the airport to the southeast near the Belle Fair Planned Unit Development; and the 65 decibel DNL contour extends approximately 4,000 feet off each main runway end. DNL levels of 65 dba and greater are normally considered incompatible with residential land use and are deemed by the FAA to create significant impact on people because of their potential to disrupt speech, disturb sleep, and cause annoyance. Specific impacts from these levels are addressed in Chapter 4. In comparing the two timeframes, one sees that the 2005 DNL contours extend slightly beyond the 1999 contours directly off the ends of Runway as aircraft line up on their final Noise Exposure Contours 3-4
40
41 1999 and 2005 DNL Contours - Land Use NYC Water Supply 60 Swiss Re MBIA Tamarack Country Club Audubon Kensico Reservoir Silver Lake Park N O R T H C A S T L E 60 R y e H A R R I S O N Brae Burn C.C. 65 L a k e Rye Lake Treatment Plant Purchase Friends Meeting House Laurel Hill Stonehill Estates C o n n e c t i c u t N e w Y o r k The Country Club at Purchase Old Oaks C.C. Audubon Harvest Time Church Nature Conservancy Fairview Country Brunswick Club School SUNY College at Purchase G R E E N W I C H Convent Sacred Heart Audubon Audubon Seton Reservation Boy Scouts United Cerebral Palsy Association Belle Fair of Westchester County PUD Chieftans Westchester Co. Fairfield Co. Reckson Office Park Y E B R O O K Doral Greens Doral Arrowwood Blind Brook C.C. DNL Contour (1999) DNL Contour (2005) Airport Boundary Municipal Boundary Water Undeveloped Non Residential Open Space Residential Feet Meters N Land Use Source: Westchester County GIS System, 1996 and The Town of Greenwich, CT, Planning & Zoning Commission Property Map, Figure 3-2
42 Westchester County Airport approach to land. The cause of the increased noise is the expected increase in traffic over the sixyear period of comparison. This increased noise is occurring despite airlines elimination and/or conversion, by the end of 1999, of older Federal Aviation Regulation Part 36 Stage 2 airplanes to quieter Stage 3 aircraft. The conversions have only minimal effect on aircraft noise during landing. In other areas around the airport, however, particularly to the west where the exposure is dominated by aircraft taking off from Runway 34 and turning left to 295º or taking off in the opposite direction from Runway 16 and turning right to 320º, the 2005 contour is seen to get slightly smaller than in Here, the phase-out of the older Stage 2 aircraft and conversion to new Stage 3 airplanes is more effective. The decreased exposure is occurring despite the increases in air traffic. The net benefit in the areas affected by departure noise is expected to be on the order of one decibel Comparison of 1999 DNL Contours to 1988 Historical Levels Current noise exposure levels, when compared to historical data, show some similarities but also some marked decreases. Figure 3-3 (1988 Historic DNL Contours) shows the most recent past contours for HPN. These contours were published in November 1988 as part of the Westchester County Airport Terminal Facilities Modernization Project Environmental Assessment and Final Environmental Impact Statement, a supplement to the Environmental Assessment and Final Generic Environmental Impact Statement for the Westchester County Airport Master Plan Update. Table 3-3 (presented above) and Figure 3-4 (Comparison of the 1988, 1999, and 2005 DNL Contours) provide a comparison of the 1988, 1999, and 2005 DNL contours. Interestingly, those portions of the 65 db DNL contour caused by aircraft landing straight in to either end of Runway appear very similar to 1988 levels of exposure in the same area. What has changed markedly, however, is the exposure that has occurred west of the airport caused by aircraft taking off from Runways 16 and 34 and turning westbound; DNL levels in these areas appear to have decreased by almost 5 decibels. The 60 db DNL contour, which in 1988 extended westward beyond I-684 along Anderson Hill Road (Route 18) into White Plains, now does not even extend west of the SUNY-Purchase Campus. To the north the picture is similar. In 1988, the 60 db DNL contour extended beyond Westlake Drive in Mount Pleasant but by 1999 receded back toward the airport, where it remains east of Route 22. Lastly, there was an apparently much greater use of Runway 29 for takeoff in The 60 db DNL contour extended west to Route 22 but now barely extends west of I-684, which runs along the western boundary of the airport. All of these sites are believed to have benefited from the collective efforts of the airlines to convert their fleets to Stage 3 aircraft. 3-5 Noise Exposure Contours
43 Aircraft Noise Study 3.3 CNEL Noise Contours Figure 3-5 (1999 and 2005 CNEL Contours Land Use) shows the same contour comparisons, this time using the CNEL noise metric. Table 3-3 shows the areas within each contour. As should be expected, the relative differences between the two contour sets are nearly identical, regardless of which of the two noise metrics is used to judge the change. The only difference between the contour sets is that the CNEL contours are each slightly larger in size than their DNL counterparts due to the additional penalty on evening operations. 3.4 Measured vs Modeled Noise Exposure A useful check of how well the computed DNL noise exposure contours reflect actual conditions can be made by comparing INM-generated noise exposure levels with those measured by Westchester County Airport s permanent noise monitoring system. Each site is referred to as a remote monitoring terminal (RMT). By knowing the latitudes and longitudes of each microphone it is possible to compute the modeled exposure levels for direct comparison to annual measurements. A map of the existing sites is included as Figure 3-6 (Existing Remote Monitoring Terminal Locations). While at first this comparison might seem to be a trivial exercise, it is important to recognize that the noise contours of Subchapter 3.1 depict noise exposure due solely to aircraft operations, while the microphones from the monitoring system are continuously measuring sound from all sources. The monitoring system must utilize additional information to sort out aircraft from nonaircraft noise events and isolate only that noise attributable to airplanes operating at HPN. To accomplish this, the system uses a complex series of steps as follows: The system seeks to identify a discrete noise event whenever the noise level at an RMT exceeds a preset threshold. The threshold is set as low as possible at each location to maximize the number of potential aircraft noise events identified, without collecting unmanageable numbers of non-aircraft noise events. The establishment of these parameters requires careful optimization. The system also includes minimum and maximum event duration settings at each RMT, to reject noise events that are either too short or too long to be aircraft-related. For example, non-aircraft noise events such as thunder or dogs barking will produce relatively short-duration events compared to an aircraft overflight, while activities such as lawn mowing will produce relatively long duration events. Both must be rejected as aircraft. Where the physical distribution of noise monitors makes it feasible, the system compares the timing of noise events at RMTs that are located in geographic sequences corresponding to major arrival or departure flight paths. Noise Exposure Contours 3-6
44 1988 Historic DNL Contours Kensico Reservoir N O R T H C A S T L E Great Island 65 R y e L a k e "! 120 Bedford Rd C o n n e c t i c u t N e w Y o r k Cliffdale G R E E N W I C H Rd Riversville Rd Park Ln King St Lake St E ', 684 Barnes Ln H A R R I S O N "! 120 East Rd Lincoln Ave A Westchester Co. Fairfield Co. 60 Y E B R O O K Sherwood Ave 6065 DNL Contour (1988) Airport Boundary Municipal Boundary Source: Greiner, Inc., et al., Feet Meters Figure 3-3 N
45 Comparison of 1988, 1999, and 2005 DNL Contours 60 N O R T H C A S T L E Kensico Reservoir 60 Great Island C o n n e c t i c u t N e w Y o r k Bedford Rd G R E E N W I C H Riversville Rd R y e k e L a "! Cliffdale Rd Park Ln King St Lake St E.-, 684 Barnes Ln H A R R I S O N East Rd Lincoln Ave A Sherwood Ave "! Fairfield Co..-, Westchester Co. R Y E B R O O K DNL Contour (1988) DNL Contour (1999) DNL Contour (2005) Airport Boundary Municipal Boundary Source of 1988 Contours: Greiner, Inc., et al., Feet Meters Figure 3-4 N
46 1999 and 2005 CNEL Contours - Land Use NYC Water Supply 60 Swiss Re MBIA Tamarack Country Club Audubon Kensico Reservoir Silver Lake Park N O R T H C A S T L E R y e H A R R I S O N Brae Burn C.C. k e L a 70 Rye Lake Treatment Plant Purchase Friends Meeting House Laurel Hill Stonehill Estates C o n n e c t i c u t N e w Y o r k The Country Club at Purchase Old Oaks C.C. Audubon Harvest Time Church Nature Conservancy Fairview Country Brunswick Club School 75 SUNY College at Purchase G R E E N W I C H Convent Sacred Heart Audubon Belle Fair PUD Westchester Co. Fairfield Co. Reckson Office Park Y E B R O O K Audubon Seton Reservation Boy Scouts United Cerebral Palsy Association of Westchester County Chieftans Doral Greens Doral Arrowwood Blind Brook C.C. CNEL Contour (1999) CNEL Contour (2005) Airport Boundary Municipal Boundary Water Undeveloped Non Residential Open Space Residential Feet Meters N Land Use Source: Westchester County GIS System, 1996 and The Town of Greenwich, CT, Planning & Zoning Commission Property Map, Figure 3-5
47 Existing Remote Monitoring Terminal Locations Figure 3-6
48 Westchester County Airport The system also reviews flight tracks to determine whether there was an aircraft (or several aircraft) in the vicinity of the RMT which could have caused the event. The system links the noise event with the flight (or flights) that is (are) the most likely to have caused it Noise Monitoring System Evaluation Study The County recently completed a comprehensive evaluation of the noise monitoring system, including the monitoring locations, operating parameters, and overall performance (HMMH, 2000). This study had two principal objectives: To ensure that the number and location of permanent noise monitors provides appropriate geographic coverage of areas affected by noise from HPN operations. To ensure that the ANOMS noise event detection parameters are set in a manner that will maximize the detection of aircraft noise events and, therefore, measure the contribution of aircraft to overall noise exposure. The study also had a third, non-technical, but equally important objective: To provide opportunities for the public to understand the bases for selecting monitor locations, and to suggest new or relocated sites for consideration. Public input fell into two principal areas: There was concern that there were gaps in the overall geographic coverage of the permanent noise monitors, which might cause the system to miss operations or fail to address noise sensitive areas of interest. There was concern that some existing monitors may be in areas where high background levels limit the system s ability to detect aircraft events or cause the system to reflect non-aircraft exposure levels that are not reasonably representative of residential areas. In most instances, high background levels are associated with street traffic, since several existing monitors are located in the shoulder of relatively busy roads Noise Monitoring System Improvements under Implementation The County is now in the process of implementing the study s recommendations, which included: Addition of six new noise monitors to provide comprehensive geographic coverage. 3-7 Noise Exposure Contours
49 Aircraft Noise Study Relocation of six existing noise monitors to address current site problems, such as unacceptably high non-aircraft noise levels. Confirmation of the locations of the eight remaining existing monitors. Implementation of an enhanced floating noise threshold capability that will improve the system s ability to identify the maximum number of events by lowering the discrimination threshold during time periods when non-aircraft noise levels are low, such as at night. Figure 3-7 (20 Sites to be Included in Expanded Monitoring System) depicts the 20 sites that the system will incorporate when the implementation is complete. It is in this larger context that it is now appropriate to addressed measured and modeled DNL levels Evaluation of Measured and Modeled DNL Levels Table 3-4 presents the aircraft-related DNL levels measured at the 14 existing noise monitoring locations over calendar year 1999, and compares them to the INM calculations. Given the very complex processes required to both measure and model aircraft-related noise exposure, the agreement between the two results was excellent (within two decibels) at monitoring sites 1, 4, 5, 6, 8, 9, 10, and 14. The monitoring system evaluation study concluded that all but one of these sites were in optimal locations, without unreasonable interference from non-aircraft noise sources. Table 3-4 Comparison of 1999 Measured and Modeled DNL Levels at 14 Monitoring Locations RMT Measured Modeled Location DNL DNL Difference Noise Exposure Contours 3-8

50 20 Sites to be Included in Expanded Monitoring System Figure 3-7
APPENDIX C NOISE ANALYSIS
 APPENDIX C NOISE ANALYSIS KBE Final - 10/11/16 Existing Noise The extent of existing noise resulting from aircraft operations at Central Colorado Regional Airport (AEJ) was determined using the FAA-approved
LAX Community Noise Roundtable. Aircraft Noise 101. November 12, 2014
 LAX Community Noise Roundtable Aircraft Noise 101 November 12, 2014 Overview Roles and Responsibilities for Aircraft Noise Relevant Federal Regulations Relevant California Regulations Aircraft Noise Metrics
Part 150 and Part 161: Purpose, Elements, and Process
 Part 150 and Part 161: Purpose, Elements, and Process Presentation to: Noise Compatibility Committee January 29, 2015 Ted Baldwin Part 150, Airport Noise Compatibility Planning FAA created in response
1.0 OUTLINE OF NOISE ANALYSIS...3
 Table of Contents 1.0 OUTLINE OF NOISE ANALYSIS...3 2.0 METHODOLOGY...3 2.1 BACKGROUND...3 2.2 COMPUTER MODELING...3 3.0 EXISTING NOISE ENVIRONMENT...4 3.1 EXISTING SANTA MONICA MUNICIPAL AIRPORT NOISE...4
14 CFR Part 150 Study
 14 CFR Part 150 Study NOISE EXPOSURE MAP and NOISE COMPATIBILITY PROGRAM Volume I Prepared for: CONNECTICUT DEPARTMENT OF TRANSPORTATION Prepared by: HNTB Corporation In association with HMMH Inc. Elvin
APPENDIX H 2022 BASELINE NOISE EXPOSURE CONTOUR
 APPENDIX H 2022 BASELINE NOISE EXPOSURE CONTOUR This appendix sets forth the detailed input data that was used to prepare noise exposure contours for 2022 Baseline conditions. H.1 DATA SOURCES AND ASSUMPTIONS
Portable Noise Monitor Report
 Portable Noise Monitor Report Chicago O Hare International Airport Site 2117 5843 N. Christiana Avenue, Chicago July 14, 217 through August 2, 217 USH5-ILH15-ILS8-CHI39 Visit the O Hare Noise webpage on
Portable Noise Monitor Report
 Portable Noise Monitor Report Chicago O Hare International Airport Site 2198 5N67 Rochefort Lane, Wayne May 9, 218 through June 3, 218 USH6-ILH49-ILS25 Visit the O Hare Noise webpage on the Internet at
Portable Noise Monitor Report
 Portable Noise Monitor Report Chicago O Hare International Airport Site 2114 5516 N. Neenah Avenue, Chicago July 12, 217 through August 9, 217 USH5-ILH19-ILS1-CHI45 Visit the O Hare Noise webpage on the
Portable Noise Monitor Report
 Portable Noise Monitor Report Chicago O Hare International Airport Site 299 93 Wilshire Avenue, Elk Grove Village June 27, 217 through July 1, 217 USH8-ILH55-ILS28 Visit the O Hare Noise webpage on the
TORONTO PEARSON INTERNATIONAL AIRPORT NOISE MANAGEMENT
 TORONTO PEARSON INTERNATIONAL AIRPORT NOISE MANAGEMENT Noise and the GTAA The GTAA is sensitive to the issue of aircraft noise and how it affects our neighbours. Since assuming responsibility for Toronto
Chapter 9 Aviation. Springfield-Branson National Airport
 Chapter 9 Aviation The main air facility in southwest Missouri is the Springfield-Branson National Airport. This is the primary air connection to the national and international markets. The region also
Minneapolis-St. Paul International Airport (MSP)
") 2 nd Quarter 2016 Minneapolis-St. Paul International Airport (MSP) Public Input Meeting Metropolitan Airports Commission Noise Program Office April 27, 2016 PUBLIC INPUT MEETING Meeting Goals To hear the
2 nd Quarter 2016 Minneapolis-St. Paul International Airport (MSP) Public Input Meeting Metropolitan Airports Commission Noise Program Office April 27, 2016 PUBLIC INPUT MEETING Meeting Goals To hear the
Portable Noise Monitor Report
 Portable Noise Monitor Report Chicago O Hare International Airport Site 241 61 Grange Road, Elk Grove Village October 3, 215 through October 19, 215 USH8-ILH55-ILS28 Visit the O Hare Noise webpage on the
CHAPTER 6 NOISE EXPOSURE
 CHAPTER 6 NOISE EXPOSURE FAA requires that the NEM submitted for review represent the aircraft noise exposure for the year of submittal (in this case 2008) and for a future year (2013 for OSUA). However,
 Burlington )@=8796?;9!-9?5=93?7;938!(7=
 Recommendations for Northbound Aircraft Departure Concerns over South Minneapolis
 Recommendations for Northbound Aircraft Departure Concerns over South Minneapolis March 21, 2012 Noise Oversight Committee Agenda Item #4 Minneapolis Council Member John Quincy Background Summer of 2011
HEPPEW#PSZI#JMIPH. 534##He}0Rmklx#Eziveki#Wsyrh#Pizip#Gsrxsyvw. LQQL#Vitsvx#Rs1#63;74" %(/2(,'(0 ;89$ Tvitevih#jsv>
 HEPPEW#PSZI#JMIPH 534##He}0Rmklx#Eziveki#Wsyrh#Pizip#Gsrxsyvw LQQL#Vitsvx#Rs1#63;74" %(/2(,'(0 ;89$ Tvitevih#jsv> #*26.) $&++&1 "5*&3.- $(/&02,(-2 Heppew#Pszi#Jmiph#Emvtsvx
WELCOME! FORT LAUDERDALE-HOLLYWOOD INTERNATIONAL AIRPORT 14 CFR PART 150 NOISE AND LAND USE COMPATIBILITY STUDY
 WELCOME! FORT LAUDERDALE-HOLLYWOOD INTERNATIONAL AIRPORT 14 CFR PART 150 NOISE AND LAND USE COMPATIBILITY STUDY Public Information Workshop November 2017 1 14 CFR Part 150 Overview Establishes the methodology
Portable Noise Monitor Report
 Portable Noise Monitor Report Chicago O Hare International Airport Site 213 475 W. Hutchinson Street, Chicago April 8, 217 through May 3, 217 USH5-ILH19-ILS1-CHI45 Visit the O Hare Noise webpage on the
T.F. Green Airport Part 150 Update Noise Exposure Map
 T.F. Green Airport Part 150 Update Noise Exposure Map Draft June 2010 Submitted to: Rhode Island Airport Corporation Submitted by: T.F. Green Airport 14 CFR Part 150 Update 2010 and 2020 NOISE EXPOSURE
STAFF REPORT. Airport Land Use Plan Consistency Review: Santa Barbara Airport Master Plan. MEETING DATE: November 19, 2015 AGENDA ITEM: 7D
 STAFF REPORT SUBJECT: Airport Land Use Plan Consistency Review: Santa Barbara Airport Master Plan MEETING DATE: AGENDA ITEM: 7D STAFF CONTACT: Peter Imhof, Andrew Orfila RECOMMENDATION: Adopt findings
Noise Issues. Dr. Antonio A. Trani Professor
 Noise Issues CEE 4674 Analysis of Air Transportation Systems Dr. Antonio A. Trani Professor Virginia Tech - Air Transportation Systems Laboratory What is Noise? Many definitions of noise exist Unwanted
Session 15 The Law of Airport Noise 101
 Session 15 The Law of Airport Noise 101 31 st Annual AAAE Basics of Airport Law Workshop and 2015 Legal Update November 1-3, 2015 Desk Reference Chapters 1, 17, 18 Catherine van Heuven Kaplan Kirsch &
Buchanan Field. Airport Planning Program. FAR Part 150 Meeting. September 28, Master Plan FAR Part 150 Noise Study Strategic Business Plan
 Airport Planning Program Master Plan FAR Part 150 ise Study Strategic Business Plan FAR Part 150 Meeting September 28, 2006 Agenda Introduction Part 150 Study Working Paper Two Operational Alternatives
APA NOISE REPORT. January 2018
 January 2018 [Grab your reader s attention with a great quote from the document or use this space to emphasize a key point. To place this text box anywhere on the page, just drag it.] APA NOISE REPORT
MINNEAPOLIS-ST. PAUL PUBLIC INPUT MEETING 3 RD QUARTER 2016 INTERNATIONAL AIRPORT (MSP)
") 3 RD QUARTER 2016 MINNEAPOLIS-ST. PAUL INTERNATIONAL AIRPORT (MSP) PUBLIC INPUT MEETING Metropolitan Airports Commission Noise Program Office July 27, 2016 PUBLIC INPUT MEETING Meeting Goals To hear the
3 RD QUARTER 2016 MINNEAPOLIS-ST. PAUL INTERNATIONAL AIRPORT (MSP) PUBLIC INPUT MEETING Metropolitan Airports Commission Noise Program Office July 27, 2016 PUBLIC INPUT MEETING Meeting Goals To hear the
PRELIMINARY WEB DOCUMENT
 APA NOISE REPORT May 2018 [Grab your reader s attention with a great quote from the document or use this space to emphasize a key point. To place this text box anywhere on the page, just drag it.] 1 TABLE
STAFF REPORT. Airport Land Use Consistency Determination Betteravia Plaza. MEETING DATE: January 21, 2016 AGENDA ITEM: 8D
 STAFF REPORT SUBJECT: Airport Land Use Consistency Determination Betteravia Plaza MEETING DATE: AGENDA ITEM: 8D STAFF CONTACT: Andrew Orfila RECOMMENDATION: Adopt findings for the Betteravia Plaza project
APA NOISE REPORT. August 2018
 August 2018 [Grab your reader s attention with a great quote from the document or use this space to emphasize a key point. To place this text box anywhere on the page, just drag it.] APA NOISE REPORT 1
APA NOISE REPORT. August 2017
 August 2017 [Grab your reader s attention with a great quote from the document or use this space to emphasize a key point. To place this text box anywhere on the page, just drag it.] APA NOISE REPORT 1
5.C NOISE AND COMPATIBLE LAND USES
 5.C NOISE AND COMPATIBLE LAND USES The discussion of the affected environment for noise and compatible land uses describes the existing noise exposure on communities surrounding Fort Lauderdale- Hollywood
Portable Noise Monitor Report
 Portable Noise Monitor Report Chicago O Hare International Airport Site 221 5716 N. Virginia Avenue, Chicago July 23, 214 through August 11, 214 Visit the O Hare Noise Management Webpage on the Internet
530 Airport Comprehensive Plan Section 530
 531 530 Comprehensive Plan Section 530 This section of the comprehensive plan will summarize the existing Master Plan as developed by Howard, Needles, Tammen, and Bergendoff and adopted by the Owensboro-
Forecast of Aviation Activity
 DETROIT METROPOLITAN WAYNE COUNTY AIRPORT FAR PART 150 NOISE COMPATIBILITY STUDY UPDATE CHAPTER B FORECAST OF AVIATION ACTIVITY Forecast of Aviation Activity Introduction This chapter summarizes past aviation
Martin County Airport / Witham Field Noise Abatement Departure Profile (NADP) Demonstration Technical Report March 2010
 Demonstration Technical Report March 2010") Martin County Airport / Witham Field Noise Abatement Departure Profile (NADP) Demonstration Technical Report March 2010 Prepared for: Federal Aviation Administration (FAA) Orlando Airport District Office
Martin County Airport / Witham Field Noise Abatement Departure Profile (NADP) Demonstration Technical Report March 2010 Prepared for: Federal Aviation Administration (FAA) Orlando Airport District Office
3. Aviation Activity Forecasts
 3. Aviation Activity Forecasts This section presents forecasts of aviation activity for the Airport through 2029. Forecasts were developed for enplaned passengers, air carrier and regional/commuter airline
Airport Land Use Compatibility Plan (ALUCP) Update. Public Information Meeting #2 December 1, 2015
 Update. Public Information Meeting #2 December 1, 2015") Airport Land Use Compatibility Plan (ALUCP) Update Public Information Meeting #2 December 1, 2015 Agenda 1. Welcome and Introductions 2. Status of Study 3. Long-term Planning Activity Level Annual Service
Airport Land Use Compatibility Plan (ALUCP) Update Public Information Meeting #2 December 1, 2015 Agenda 1. Welcome and Introductions 2. Status of Study 3. Long-term Planning Activity Level Annual Service
Welcome to Public Information Workshop 1. San Francisco International Airport FAR Part 150 Study Update Noise Exposure Map Report
 Welcome to Public Information Workshop 1 Chetcuti Room, City of Milbrae 450 Poplar Avenue Milbrae, California 94030 Wednesday, June 4, 2014 5:45 p.m. to 6:45 p.m. PDT The FAA typically uses the airport
MONTEREY REGIONAL AIRPORT MASTER PLAN TOPICAL QUESTIONS FROM THE PLANNING ADVISORY COMMITTEE AND TOPICAL RESPONSES
 MONTEREY REGIONAL AIRPORT MASTER PLAN TOPICAL QUESTIONS FROM THE PLANNING ADVISORY COMMITTEE AND TOPICAL RESPONSES Recurring topics emerged in some of the comments and questions raised by members of the
Helicopter Noise Analysis
 Clark County Department of Aviation Appendix D. Helicopter Noise Analysis D.1 General Characteristics of Helicopter Noise Helicopter noise originates from three components of the helicopter: the rotors,
According to FAA Advisory Circular 150/5060-5, Airport Capacity and Delay, the elements that affect airfield capacity include:
 4.1 INTRODUCTION The previous chapters have described the existing facilities and provided planning guidelines as well as a forecast of demand for aviation activity at North Perry Airport. The demand/capacity
Northeast Stoney Trail In Calgary, Alberta
 aci Acoustical Consultants Inc. 5031 210 Street Edmonton, Alberta, Canada T6M 0A8 Phone: (780) 414-6373, Fax: (780) 414-6376 www.aciacoustical.com Environmental Noise Computer Modelling For Northeast Stoney
Fly Quiet Report. 3 rd Quarter November 27, Prepared by:
 November 27, 2017 Fly Quiet Report Prepared by: Sjohnna Knack Program Manager, Airport Noise Mitigation Planning & Environmental Affairs San Diego County Regional Airport Authority 1.0 Summary of Report
Ted Stevens Anchorage International Airport FAR Part 150 Study Update Glossary of Common Acoustic and Air Traffic Control Terms
 Ted Stevens Anchorage International Airport FAR Part 150 Study Update Glossary of Common Acoustic and Air Traffic Control Terms ADOT&PF (Alaska Department of Transportation and Public Facilities): The
SAN FRANCISCO INTERNATIONAL AIRPORT CITY & COUNTY OF SAN FRANCISCO MEMORANDUM
 SAN FRANCISCO INTERNATIONAL AIRPORT CITY & COUNTY OF SAN FRANCISCO MEMORANDUM TO: MONTARA COMMUNITY FROM: SAN FRANCISCO INTERNATIONAL AIRPORT AIRCRAFT NOISE ABATEMENT OFFICE SUBJECT: MONTARA SHORT-TERM
Technical Report. Aircraft Overflight and Noise Analysis. Brisbane, California. December Prepared by:
 Aircraft Noise Abatement Office Technical Report Aircraft Overflight and Noise Analysis Brisbane, California Prepared by: P.O. Box 8097 San Francisco, California 94128 (650) 821-5100 Introduction In response
Washington Dulles International Airport (IAD) Aircraft Noise Contour Map Update
 Aircraft Noise Contour Map Update") Washington Dulles International Airport (IAD) Aircraft Noise Contour Map Update Ultimate ASV, Runway Use and Flight Tracks 4th Working Group Briefing 8/13/18 Meeting Purpose Discuss Public Workshop input
Washington Dulles International Airport (IAD) Aircraft Noise Contour Map Update Ultimate ASV, Runway Use and Flight Tracks 4th Working Group Briefing 8/13/18 Meeting Purpose Discuss Public Workshop input
STAFF REPORT. Airport Land Use Plan Consistency Review: Old Town Village Mixed Use Project City of Goleta. MEETING DATE: June 18, 2015 AGENDA ITEM: 5M
 STAFF REPORT SUBJECT: Airport Land Use Plan Consistency Review: Old Town Village Mixed Use Project City of Goleta MEETING DATE: AGENDA ITEM: 5M STAFF CONTACT: Peter Imhof, Andrew Orfila RECOMMENDATION:
Quiet Climb. 26 AERO First-Quarter 2003 January
 Quiet Climb Boeing has developed the Quiet Climb System, an automated avionics feature for quiet procedures that involve thrust cutback after takeoff. By reducing and restoring thrust automatically, the
Time-series methodologies Market share methodologies Socioeconomic methodologies
 This Chapter features aviation activity forecasts for the Asheville Regional Airport (Airport) over a next 20- year planning horizon. Aviation demand forecasts are an important step in the master planning
Heathrow Community Noise and Track-keeping Report: Burhill
 Heathrow Community Noise and Track-keeping Report: Burhill This document reports on an 1-day period of continuous noise monitoring from 14 June 211 to 21 September 211 using a Larson Davies LD 87 sound
2015 ANNUAL NOISE REPORT
 2015 ANNUAL NOISE REPORT MASSACHUSETTS PORT AUTHORITY L.G. HANSCOM FIELD BEDFORD, MA 01730 PREPARED BY AMBER GOODSPEED SUBMITTED TO HANSCOM FIELD ADVISORY COMMISSION July 2016 Connecting with our communities
THE BURBANK-GLENDALE-PASADENA AIRPORT AUTHORITY S UPDATE REGARDING ITS NOISE IMPACT AREA REDUCTION PLAN AND ITS PART 161 STUDY SECOND QUARTER 2015
 THE BURBANK-GLENDALE-PASADENA AIRPORT AUTHORITY S UPDATE REGARDING ITS NOISE IMPACT AREA REDUCTION PLAN AND ITS PART 161 STUDY SECOND QUARTER 2015 Pursuant to the California Department of Transportation
MEETING SUMMARY Page 1 of 4
 MEETING SUMMARY www.jjr-us.com Page 1 of 4 Ann Arbor Municipal Airport 50178.000 July 20, 2009 September 8, 2009 PROJECT PROJECT NO. MEETING DATE ISSUE DATE Ann Arbor Municipal Airport Citizens Advisory
Washington Dulles International Airport (IAD) Noise Contour Map Update. For Publication on MWAA Website April 4, 2018
 Noise Contour Map Update. For Publication on MWAA Website April 4, 2018") Washington Dulles International Airport (IAD) Noise Contour Map Update For Publication on MWAA Website April 4, 2018 Introduction Background Existing Conditions Noise Contours Land Use Compatibility Planning
Washington Dulles International Airport (IAD) Noise Contour Map Update For Publication on MWAA Website April 4, 2018 Introduction Background Existing Conditions Noise Contours Land Use Compatibility Planning
THE BURBANK-GLENDALE-PASADENA AIRPORT AUTHORITY S UPDATE REGARDING ITS NOISE IMPACT AREA REDUCTION PLAN AND ITS PART 161 STUDY FIRST QUARTER 2015
 THE BURBANK-GLENDALE-PASADENA AIRPORT AUTHORITY S UPDATE REGARDING ITS NOISE IMPACT AREA REDUCTION PLAN AND ITS PART 161 STUDY FIRST QUARTER 2015 Pursuant to the California Department of Transportation
6.C.1 AIRPORT NOISE. Noise Analysis and Land Use Impact Assessment FORT LAUDERDALE-HOLLYWOOD INTERNATIONAL AIRPORT ENVIRONMENTAL IMPACT STATEMENT
 6.C.1 AIRPORT NOISE The existing land uses are described in Chapter Five, Affected Environment. The methodologies used to develop the Geographic Information System (GIS) land use database, the estimated
Alternatives. Introduction. Range of Alternatives
 Alternatives Introduction Federal environmental regulations concerning the environmental review process require that all reasonable alternatives, which might accomplish the objectives of a proposed project,
> Aircraft Noise. Bankstown Airport Master Plan 2004/05 > 96
 Bankstown Airport Master Plan 2004/05 > 96 24.1 Why Is Aircraft Noise Modelled? Modelling of the noise impact of aircraft operations has been undertaken as part of this MP. Such modelling is undertaken
Runway Length Analysis Prescott Municipal Airport
 APPENDIX 2 Runway Length Analysis Prescott Municipal Airport May 11, 2009 Version 2 (draft) Table of Contents Introduction... 1-1 Section 1 Purpose & Need... 1-2 Section 2 Design Standards...1-3 Section
Perth Noise Abatement Procedures - Change to Preferred Runways
 Environmental Analysis Summary Preferred Runways Perth Perth Airport Perth Noise Abatement Procedures - Change to Preferred Runways Environmental Analysis Summary April 2016 1 of 10 Environment Analysis
THE BURBANK-GLENDALE-PASADENA AIRPORT AUTHORITY S UPDATE REGARDING ITS NOISE IMPACT AREA REDUCTION PLAN AND ITS PART 161 STUDY SECOND QUARTER 2017
 THE BURBANK-GLENDALE-PASADENA AIRPORT AUTHORITY S UPDATE REGARDING ITS NOISE IMPACT AREA REDUCTION PLAN AND ITS PART 161 STUDY SECOND QUARTER 2017 Pursuant to the California Department of Transportation
Airport Land Use Compatibility Plan (ALUCP) Update. Public Information Meeting #4 June 8 & 9, 2016
 Update. Public Information Meeting #4 June 8 & 9, 2016") Airport Land Use Compatibility Plan (ALUCP) Update Public Information Meeting #4 June 8 & 9, 2016 Agenda 1. Study Process 2. Noise Complaint Patterns 3. Proposed Overflight Areas (AOA) 4. Proposed Land
Airport Land Use Compatibility Plan (ALUCP) Update Public Information Meeting #4 June 8 & 9, 2016 Agenda 1. Study Process 2. Noise Complaint Patterns 3. Proposed Overflight Areas (AOA) 4. Proposed Land
APPENDIX K LAND USE. Charles M. Schulz - Sonoma County Airport Draft Environmental Impact Report July 2011 K-1
 APPENDIX K LAND USE Charles M. Schulz - Sonoma County Airport Draft Environmental Impact Report July 2011 K-1 Appendix K Land Use THIS PAGE INTENTIONALLY LEFT BLANK Charles M. Schulz - Sonoma County Airport
Memorandum. Federal Aviation Administration. Date: June 19, Richard Doucette, Environmental Protection Specialist. From: To:
 Federal Aviation Administration Memorandum Date: June 19, 2008 From: To: Subject: Richard Doucette, Environmental Protection Specialist LaVerne Reid, Airports Division Manager John Donnelly, Regional Counsel
Comparison Between Old and New ALUC Plans
 A P P E N I X H Comparison Between Old and New ALUC Plans OVERVIEW This Placer County Airport Land Use Compatibility Plan (ALUCP) sets forth land use compatibility criteria for the environs of Auburn Municipal,
Technical Report. Aircraft Noise Analysis. Portola Valley and Woodside, California. July Prepared by: Aircraft Noise Abatement Office
 Technical Report Aircraft Noise Analysis Portola Valley and Woodside, California Prepared by: San Francisco International Airport P.O. Box 8097 San Francisco, California 94128 (650) 821-5100 Introduction
Perth Airport. Runway 21 Night-Time Departure Trial Proposal. Environmental Analysis Summary. August Airservices Australia 1 of 17
 Perth Airport Runway 21 Night-Time Departure Trial Proposal Environmental Analysis Summary August 2015 Airservices Australia 1 of 17 Change Summary Version Date Change Description Amended by 1 6 August
Airport Noise Modelling ACNCC Meeting October 15, 2009
 ACNCC Meeting October 15, 2009 Prepared by: AECOM Canada Ltd. 2540 Kensington Road NW, Calgary, AB, Canada T2N 3S3 T 403.270.9200 F 403.270.0399 www.aecom.com Project Number: 2759-095-00 Date: November
COMMERCIAL AND GENERAL AVIATION
 Existing Facilities Daytona Beach International Airport is served by a number of airside and landside facilities. The airport has three asphalt runways: Runway 07L/25R (10,500 feet long by 150 feet wide),
CHAPTER 1 EXECUTIVE SUMMARY
 CHAPTER 1 EXECUTIVE SUMMARY 1 1 EXECUTIVE SUMMARY INTRODUCTION William R. Fairchild International Airport (CLM) is located approximately three miles west of the city of Port Angeles, Washington. The airport
Portable Noise Monitor Report
 Portable Noise Monitor Report Chicago O Hare and Midway International Airports Site 217 1149 Candlewood Drive, Downers Grove May 17, 214 through May 31, 214 Visit the O Hare and Midway Noise Management
Draft Concept Alternatives Analysis for the Inaugural Airport Program September 2005
 Draft Concept Alternatives Analysis for the Inaugural Airport Program September 2005 Section 3 - Refinement of the Ultimate Airfield Concept Using the Base Concept identified in Section 2, IDOT re-examined
Public Comments and Responses
 APPENDIX G Public Comments and Responses G.1 Introduction Comments submitted by local agencies and the general public during the 14 CFR Part 150 Noise Exposure Map Update are provided on the following
Small Aircraft Transportation System (SATS) Environmental Noise Impact Study
 Environmental Noise Impact Study") Small Aircraft Transportation System (SATS) Environmental Noise Impact Study Dr. Antonio A. Trani Howard Swingle Dr. Hojong Baik Dr. Dusan Teodorovic Chad Ackley Department of Civil and Environmental Engineering
Small Aircraft Transportation System (SATS) Environmental Noise Impact Study Dr. Antonio A. Trani Howard Swingle Dr. Hojong Baik Dr. Dusan Teodorovic Chad Ackley Department of Civil and Environmental Engineering
Quieter Skies Report. Partnership for. Fort Lauderdale-Hollywood International Airport. Prepared by: Broward County Aviation Department
 Fort Lauderdale-Hollywood International Airport Prepared by: February 2016 Partnership for Quieter Skies Report The Report provides an overview of progress of efforts to reduce the noise impacts of Fort
Appendix B Ultimate Airport Capacity and Delay Simulation Modeling Analysis
 Appendix B ULTIMATE AIRPORT CAPACITY & DELAY SIMULATION MODELING ANALYSIS B TABLE OF CONTENTS EXHIBITS TABLES B.1 Introduction... 1 B.2 Simulation Modeling Assumption and Methodology... 4 B.2.1 Runway
The forecasts evaluated in this appendix are prepared for based aircraft, general aviation, military and overall activity.
 Chapter 3: Forecast Introduction Forecasting provides an airport with a general idea of the magnitude of growth, as well as fluctuations in activity anticipated, over a 20-year forecast period. Forecasting
Master Plan & Noise Compatibility Study Update
 Working Document-Subject to Change, March 2010 Master Plan & Noise Compatibility Study Update (14 CFR Part 150) TECHNICAL ADVISORY COMMITTEE March 24, 2010 Working Document-Subject to Change, March 2010
FRENCH VALLEY AIRPORT (F70) Sky Canyon Dr. Murrieta, CA. Phone: Riverside FAA FSDO Complaint Line: (951)
 Sky Canyon Dr. Murrieta, CA. Phone: Riverside FAA FSDO Complaint Line: (951)") FRENCH VALLEY AIRPORT (F70) 37600 Sky Canyon Dr. Murrieta, CA Phone: 951-600-7297 Riverside FAA FSDO Complaint Line: (951) 276-6701 Visit the F70 website for additional information regarding the airport
FRENCH VALLEY AIRPORT (F70) 37600 Sky Canyon Dr. Murrieta, CA Phone: 951-600-7297 Riverside FAA FSDO Complaint Line: (951) 276-6701 Visit the F70 website for additional information regarding the airport
Noise Abatement 101. July 13, Regular Board Meeting / August 7, 2014 Hillsborough County Aviation Authority
 Noise Abatement 101 July 13, 2017 1 Objectives Provide context and a better understanding for how and why flights may operate at Tampa International Airport the way they do. Provide an overview of laws,
DCA Airport Noise. MWAA WG Dec 15, 2016
 DCA Airport Noise MWAA WG Dec 15, 2016 BACKGROUND FAA Next Gen noise Analyzed on macro level Data below 3K Ft under estimated community level impacts Primary focus has been on departure procedures 1 part
Researched the feasibility of backblast noise (low frequency noise) mitigation.
 mitigation.") The Monitor Winter 2010 Issue Working together for quieter skies Message from the Hon. Mark Church, Roundtable Chairperson and Member, County of San Mateo Board of Supervisors The Roundtable is a unique
The Monitor Winter 2010 Issue Working together for quieter skies Message from the Hon. Mark Church, Roundtable Chairperson and Member, County of San Mateo Board of Supervisors The Roundtable is a unique
FORT LAUDERDALE-HOLLYWOOD INTERNATIONAL AIRPORT ENVIRONMENTAL IMPACT STATEMENT DRAFT
 D.3 RUNWAY LENGTH ANALYSIS Appendix D Purpose and Need THIS PAGE INTENTIONALLY LEFT BLANK Appendix D Purpose and Need APPENDIX D.3 AIRFIELD GEOMETRIC REQUIREMENTS This information provided in this appendix
Environmental Assessment. Runway 14 Smart Tracking Approach Gold Coast Airport
 Environmental Assessment Runway 14 Smart Tracking Approach Gold Coast Airport Table of Contents Introduction ` 3 Runway 14 Smart Tracking approach 3 Assessment 3 Assumptions 3 Nominated aircraft 3 How
Airport Noise Management System
 4 th Quarter 2009 Quarterly Report Airport Noise Management System City of Chicago Department of Aviation Visit the Community Noise Resource Center on the Internet at www.flychicago.com Airport Noise Management
New Opportunities PUBLIC WORKSHOP. Venice Municipal. Bringing g the pieces together
 Bringing g the PUBLIC WORKSHOP Venice Municipal Airport New Opportunities Presented for Venice City Council & Citizens of Venice September 25, 2009 Slide 1 Bringing g the Welcome & Introductions May 12th
VILLAGE OF CENTRE ISLAND, NEW YORK AND THE ISSUE OF PRIVATE-USE HELIPADS October 29, 2018 Approved by Board of Trustees December 19, 2018
 QED Airport & Aviation Consultants VILLAGE OF CENTRE ISLAND, NEW YORK AND THE ISSUE OF PRIVATE-USE HELIPADS October 29, 2018 Approved by Board of Trustees December 19, 2018 This report is intended to set
Airport Noise Management System Chicago O Hare International Airport
 November 218 Monthly Report Airport Noise Management System Chicago O Hare International Airport Visit the O Hare Noise webpage on the Internet at www.flychicago.com/ordnoise Airport Noise Management System
CHAPTER FOUR RECOMMENDED NOISE COMPATIBILITY PROGRAM MEASURES
 CHAPTER FOUR RECOMMENDED NOISE COMPATIBILITY PROGRAM MEASURES This chapter provides the detailed descriptions of the recommended Part 150 noise abatement, land use management, and program management measures
Partnership for Quieter Skies Report
 Ft. Lauderdale-Hollywood International Airport Prepared by: March 2008 Partnership for Quieter Skies Report The Partnership for Quieter Skies Report provides an overview of progress of efforts to reduce
Airport Noise Management System Chicago O Hare International Airport
 December 218 Monthly Report Airport Noise Management System Chicago O Hare International Airport Visit the O Hare Noise webpage on the Internet at www.flychicago.com/ordnoise Airport Noise Management System
WELCOME! FORT LAUDERDALE-HOLLYWOOD INTERNATIONAL AIRPORT 14 CFR PART 150 NOISE AND LAND USE COMPATIBILITY STUDY
 WELCOME! FORT LAUDERDALE-HOLLYWOOD INTERNATIONAL AIRPORT 14 CFR PART 150 NOISE AND LAND USE COMPATIBILITY STUDY Public Information Workshop #2 January 2019 Station 1: Par t 150 Over view 14 CFR Part 150
Van Nuys Airport December 2011 Updated 14 C.F.R. Part 150 Noise Exposure Maps page 1
 Updated 14 C.F.R. Part 150 Noise Exposure Maps page 1 1 INTRODUCTION The federal Airport Safety and Noise Abatement Act of 1979 1 ( ASNA ), as amended, defines procedures under which the federal government,
DENVER INTERNATIONAL AIRPORT 2016 IGA NOISE RELEASE STUDY. June 22, 2016
 DENVER INTERNATIONAL AIRPORT 2016 IGA NOISE RELEASE STUDY June 22, 2016 INTRODUCTION This Noise Release Study was prepared pursuant to Section 4.5.3 Noise Studies of the Intergovernmental Agreement dated
Runway 35 South & West (Jet) Departure Flight Path Amendment
 Departure Flight Path Amendment") Environmental Assessment Runway 35 South & West (Jet) Departure Flight Path Amendment Canberra Airport Airservices Australia 1 of 8 Environment Assessment Runway 35 South & West (Jet) Departure & North
Environmental Assessment Runway 35 South & West (Jet) Departure Flight Path Amendment Canberra Airport Airservices Australia 1 of 8 Environment Assessment Runway 35 South & West (Jet) Departure & North
at: Accessed May 4, 2011.
 3.11 SAFETY 3.11.1 Background and Methodology As with other forms of transportation, there is risk associated with aviation activities. This section focuses on risk to those on the ground near airports.
2009 Muskoka Airport Economic Impact Study
 2009 Muskoka Airport Economic Impact Study November 4, 2009 Prepared by The District of Muskoka Planning and Economic Development Department BACKGROUND The Muskoka Airport is situated at the north end
Pacifica. Short Term Aircraft Noise Monitoring
 Short Term Aircraft Noise Monitoring March March, Pacifica Prepared for the Oddstad Boulevard Park Pacifica Avenue Neighborhoods by San Francisco International Airport Noise Abatement Office P.O. Box 8097