THE PORT AUTHORITY OF NEW YORK & NEW JERSEY AIRTRAIN LGA LGA GROUND ACCESS MODE CHOICE MODEL AND AIRTRAIN RIDERSHIP FORECAST OCTOBER 2018
|
|
|
- Samson Howard
- 5 years ago
- Views:
Transcription
1 THE PORT AUTHORITY OF NEW YORK & NEW JERSEY AIRTRAIN LGA LGA GROUND ACCESS MODE CHOICE MODEL AND AIRTRAIN RIDERSHIP FORECAST OCTOBER 2018
2
3 AIRTRAIN LGA LGA GROUND ACCESS MODE CHOICE MODEL AND AIRTRAIN RIDERSHIP FORECAST PORT AUTHORITY OF NEW YORK & NEW JERSEY
4
5 TABLE OF CONTENTS EXECUTIVE SUMMARY... 1 INTRODUCTION... 3 PASSENGER PREFERENCE SURVEY... 7 MODEL DATABASE CONSTRUCTION AND INPUTS ORIGIN, DESTINATION, AND DEMOGRAPHIC DATA SURVEY WEIGHTING AND CONTROL DATA SOURCES LGA PASSENGER FORECAST AND GROWTH FACTORS MODEL ANALYSIS FOR AIRTRAIN LGA GEOGRAPHIC MARKETS OF AIR PASSENGERS AND EMPLOYEES LGA PASSENGER TYPES AUTO AND TRANSIT TRAVEL TIMES FOR KEY O&D PAIRS...19 OVERVIEW OF THE RIDERSHIP MODELING METHODOLOGY PROTOTYPES AND SOURCES FOR THE CURRENT MODEL COMPLETE SYSTEM WITH EQUILIBRATION RIDERSHIP FORECASTING PROCESS COMPARISON TO THE PREVAILING PRACTICES IN AIRPORT GROUND ACCESS MODELING MODELED GROUND ACCESS MODES AND MODE COMBINATIONS...28 OVERVIEW OF THE STATISTICAL STRUCTURE OF THE MODEL GROUND ACCESS MODE CHOICE FRAMEWORK MAIN VARIABLES AND FACTORS ACCOUNTED IN THE MODEL VALUE OF TIME (VOT)...32 LEVEL-OF-SERVICE (LOS) DATA AND ASSUMPTIONS BASELINE ALTERNATIVE BUILD ALTERNATIVE...36 AIRTRAIN LGA RIDERSHIP FORECAST AIRTRAIN LGA RIDERSHIP SUMMARY BY MODE COMBINATION COMPARISON OF LGA GROUND ACCESS MODE SHARES FOR BASE AND BUILD SCENARIOS AIRTRAIN LGA PAID RIDERSHIP MARKET SHARE BY GEOGRAPHY MODE SWITCHES FROM THE EXISTING MODES TO AIRTRAIN LGA RIDERSHIP SENSITIVITY TEST RESULTS...48 REFERENCES...53 LIST OF CONTRIBUTORS...55 LGA Airport Access Improvement Project i
6 APPENDICES APPENDIX A. LAGUARDIA AIRPORT (LGA) SURVEYS USED IN THE MODELING PROCESS APPENDIX B. LGA PASSENGER AND EMPLOYEE SURVEY RESULTS APPENDIX C. ANALYSIS OF CONGESTION GROWTH AND HIGHWAY TIME RELIABILITY FOR TRIPS TO AND FROM LGA APPENDIX D. SURVEY OF VOT AND MODE CONVENIENCE FACTORS IN APPLIED MODELS FOR AIRPORT GROUND ACCESS MODE CHOICE APPENDIX E. COMPARATIVE ANALYSIS OF RAIL MODE SHARE FOR DIFFERENT AIRPORTS APPENDIX F. DETAILS OF SWITCHING LOGIT MODEL FORMULATION APPENDIX G. TRAVEL TIMES USED FOR RIDERSHIP MODEL INPUTS TABLES TABLE 1-1 GROUND ACCESS MODE CHOICE AT LGA... 4 TABLE 1-2 CUMULATIVE TRAFFIC GROWTH RATES FOR STUDY AREA... 6 TABLE 2-1 PARTICIPATION OF AIR PASSENGERS IN THE SURVEY FOR AIRTRAIN LGA... 7 TABLE 3-1 AIR PASSENGERS BY MODE (UN-WEIGHTED) FROM 2017 SURVEY...11 TABLE 3-2 SUMMARY OF EMPLOYEE OBSERVATIONS BY MODE (UN-WEIGHTED) FROM 2017 SURVEY...11 TABLE 3-3 AIR PASSENGERS BY MODE (UN-WEIGHTED) FROM CSS TABLE 3-4 TARGET CONTROLS FOR SURVEY EXPANSION...13 TABLE 3-5 LGA LONG-RANGE FORECAST TABLE 3-6 INPUT DATA FOR THE CALCULATION OF DAILY EMPLOYEE TRIPS TO AND FROM LGA...15 TABLE 4-1 DISTRIBUTION OF LGA AIR PASSENGERS BY TYPE...19 TABLE 4-2 COMPARISONS OF AUTO AND TRANSIT TRAVEL TIMES WITH AIRTRAIN TO LGA (PM PEAK) FOR SELECTED IMPORTANT LOCATIONS, 2025 AND TABLE 4-3 COMPARISONS OF AUTO AND TRANSIT TRAVEL TIMES WITH AIRTRAIN FROM LGA (AM PEAK) FOR SELECTED IMPORTANT LOCATIONS, 2025 AND TABLE 5-1 DEFINITION OF DETAILED GROUND ACCESS MODES FOR LGA...28 TABLE 6-1 MODEL UTILITY COEFFICIENTS...31 TABLE 6-2 EXAMPLES OF ESTIMATED OR ASSUMED VOT IN APPLIED AIRPORT GROUND ACCESS MODE CHOICE MODELS...33 TABLE 8-1 DAILY AIRTRAIN RIDERSHIP SUMMARY FOR ii LGA Airport Access Improvement Project
7 TABLE 8-2 ANNUAL AIRTRAIN RIDERSHIP SUMMARY FOR 2025 IN THOUSANDS...39 TABLE 8-3 DAILY AIRTRAIN RIDERSHIP SUMMARY FOR TABLE 8-4 ANNUAL AIRTRAIN RIDERSHIP SUMMARY FOR 2045 IN THOUSANDS...40 TABLE 8-5 LGA GROUND ACCESS MODE SHARES FOR AIR PASSENGERS FOR BASELINE AND BUILD SCENARIOS IN TABLE 8-6 LGA GROUND ACCESS MODE SHARES FOR AIR PASSENGERS FOR BASELINE AND BUILD SCENARIOS IN TABLE 8-7 LGA GROUND ACCESS MODE SHARES FOR EMPLOYEES BASELINE AND BUILD SCENARIOS IN TABLE 8-8 LGA GROUND ACCESS MODE SHARES FOR EMPLOYEES FOR BASELINE AND BUILD SCENARIOS IN TABLE 8-9 AIRTRAIN MARKET SHARE BY GEOGRAPHY IN 2025 (DAILY TRIPS)...44 TABLE 8-10 AIRTRAIN MARKET SHARE BY GEOGRAPHY IN 2025 (ANNUAL TRIPS, MILLIONS)...45 TABLE 8-11 AIRTRAIN MARKET SHARE BY GEOGRAPHY IN 2045 (DAILY TRIPS)...46 TABLE 8-12 AIRTRAIN MARKET SHARE BY GEOGRAPHY IN 2045 (ANNUAL TRIPS)...47 TABLE 8-13 AIRTRAIN AIR PASSENGER MODE SWITCHES, 2025 DAILY TRIPS...49 TABLE 8-14 MODE SWITCHED FROM THE EXISTING MODES TO AIRTRAIN FOR AIR PASSENGERS IN 2045 (DAILY TRIPS)...50 TABLE 8-15 MODE SWITCHED FROM THE EXISTING MODES TO AIRTRAIN FOR EMPLOYEES IN 2025 (DAILY TRIPS)...51 TABLE 8-16 MODE SWITCHED FROM THE EXISTING MODES TO AIRTRAIN FOR EMPLOYEES IN 2045 (DAILY TRIPS)...52 LGA Airport Access Improvement Project iii
8 FIGURES FIGURE 1-1 PROJECT VICINITY... 3 FIGURE 1-2 PUBLIC TRANSIT OPTIONS TO LAGUARDIA AIRPORT... 3 FIGURE 2-1 RANKING OF LIRR+AIRTRAIN OPTION BY LGA AIR PASSENGERS... 8 FIGURE 2-2 RANKING OF SUBWAY+AIRTRAIN OPTION BY LGA AIR PASSENGERS... 8 FIGURE 4-1 LAGUARDIA AIRPORT PASSENGER SHARE BY TRIP ORIGIN/DESTINATION FIGURE 4-2 LAGUARDIA AIRPORT EMPLOYEE SHARE BY TRIP ORIGIN/DESTINATION FIGURE 4-3 LAGUARDIA AIRPORT GEOGRAPHIC MARKETS FIGURE 4-4 O&D SHARE OF BUSINESS AIR PASSENGERS FOR NY MAJOR AIRPORTS FIGURE 4-5 O&D SHARE OF AIR PASSENGERS TO MANHATTAN 14TH-96TH STREET FOR NY MAJOR AIRPORTS FIGURE 4-6 COMPARISON OF OVERALL GENERALIZED COST BY AUTO AND TRANSIT WITH AIRTRAIN TO LGA, FIGURE 5-1 ACCUMULATED EXPERIENCE OF AIRPORT MODELING TOOLS DEVELOPED FOR PANYNJ FIGURE 5-2 COMPLETE SYSTEM WITH EQUILIBRATION FIGURE 5-3 MAIN MODELING STEPS iv LGA Airport Access Improvement Project
9 EXECUTIVE SUMMARY This report documents the methodology and results of the ridership forecasting process for the LaGuardia Airport (LGA) Access Improvement Project. Ridership forecasts were prepared for a new AirTrain system that would efficiently connect LGA with the regional transit system, specifically the Metropolitan Transportation Authority (MTA) Long Island Rail Road (LIRR) Port Washington Branch and the New York City Transit (NYCT) 7 Line subway at Willets Point (WP), where a station complex and parking facility for airport employees would be built. In August 2017, a premier market research firm (Kantar TNS) conducted an on-airport survey of arriving and departing passengers at LGA on behalf of the Port Authority of New York and New Jersey (PANYNJ). Of the total respondents, 1,515 passengers answered questions regarding the use of a new AirTrain system, referred to as AirTrain LGA. The Passenger Preference Survey found that 38 percent of air passengers with an origin or destination in the LIRR service territory responded that they would definitely switch or were likely to use AirTrain LGA even at the highest fare level. For those in the service territory of the subway, 44 percent responded that they would definitely switch or were likely to use AirTrain LGA at the highest fare level. The responses received in the Passenger Preference Survey would equate to approximately 10 million AirTrain passengers in 2025 and 12 million passengers in In addition to the survey, a LGA ground access mode choice model was developed to generate the AirTrain LGA ridership forecast for planning purposes, and to support the environmental review process. The model was developed using information from the Best Practice Model (BPM), which is the regional travel model of the New York Metropolitan Transportation Council (NYMTC) used by their Interagency Consultation Group (comprised of U.S. Environmental Protection Agency (USEPA), Federal Highway Administration (FHWA), U.S. Department of Transportation (USDOT), Federal Transit Administration (FTA), and New York State Department of Transportation (NYSDOT) representatives) for air quality conformity determinations and other transportation planning purposes in the region. The LGA ground access mode choice model covers the same geographic region as the BPM, adopts travel time inputs 1 and traffic growth factors from BPM, and uses the same conventional mode choice modeling technique. During this analysis, MTA was consulted to refine the modeling assumptions for the public transportation system that is coded in the LGA ground access mode choice model. The LGA ground access mode choice model provides forecasts for different airport-related travel markets by trip purpose (business and personal trips) and residential status (New York region residents and visitors). The LGA ground access mode choice model predicts about 6.6 million annual trips will be made on AirTrain LGA in the year 2025 (comprised of about 18,000 daily trips). In the year 2045, the model predicts that total annual trips on AirTrain LGA will be about 8.4 million (comprised of about 23,000 daily trips). The model estimates that AirTrain LGA would capture about 17 percent of the total air passenger market in 2025 and 18 percent in The modeled results can be considered conservative in light of the responses received for the Passenger Preference Survey questions obtained in BPM travel times for trips to and from LGA were updated using highway travel times from the 2017 NYC Taxi and Limousine Commission GPS datasets. LGA Airport Access Improvement Project 1
10 The results of the LGA ground access model and the Passenger Preference Survey indicate a projected range of approximately 6.6 to 10 million riders in 2025 (and approximately 8.4 to 12 million in 2045). 2 LGA Airport Access Improvement Project
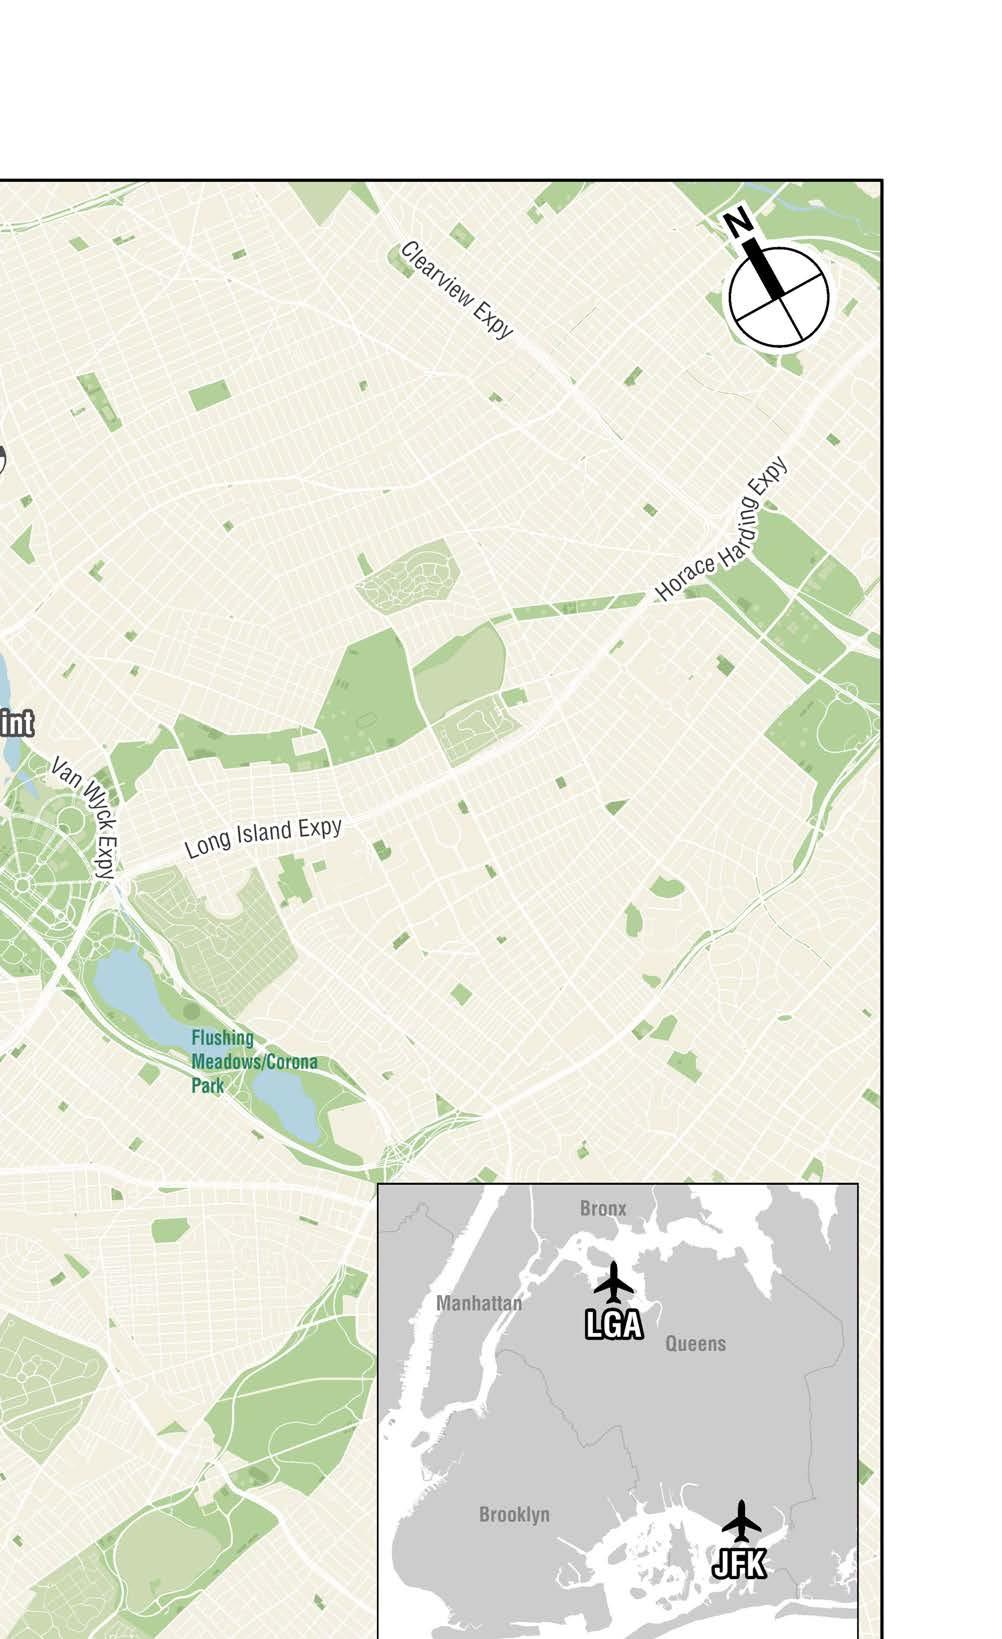
11 INTRODUCTION This report documents the methodology and results of the ridership forecasting process for the LaGuardia Airport (LGA) Airport Access Improvement Project. Ridership forecasts have been prepared for a new AirTrain system that would efficiently connect LGA with the regional transit system, specifically the Metropolitan Transportation Authority (MTA) Long Island Rail Road (LIRR) Port Washington Branch and the New York City Transit (NYCT) 7 Line subway at Willets Point (WP), where a station complex and parking facility for airport employees would be built. Located in Corona, Queens to the east of LGA and directly south of Citi Field, WP is a transportation hub located near the Grand Central Parkway and Van Wyck Expressway (I-678) connections to the Long Island Expressway (I-495), NY25A, and local city streets (Figure 1-1). The Mets-Willets Point Station on LIRR s Port Washington Branch, which currently offers gameday and event service, will provide direct service to both New York Penn Station on Manhattan s West Side and Grand Central Terminal on Manhattan s East Side once construction of the project known as East Side Access is complete. The 7 Line (Flushing) subway serves Woodside Queens and the growing Long Island City business district in addition to stops in Manhattan on Third and Fifth Avenues, at Grand Central Station and Times Square, at 34th Street and 11th Avenue in the Hudson Yards neighborhood of far West Midtown (Figure 1-2). The 7 Line connects to 16 subway lines (i.e., E, F, M, R, N, Q, W, 4, 5, 6, 1, 2, 3, A, C, and E) that provide extensive service throughout Manhattan and parts of Queens, Brooklyn and the Bronx (Figure 1-2). AirTrain LGA would operate at high frequency, with a four-minute headway for the base scenario, and would provide a quick ride from WP to LGA about six minutes to the new East Station at Terminal C/D and seven minutes to the new Central Hall Station at Terminal B. In general, the New York metropolitan region relies on transit as the main mode for trips to and from Manhattan due to the limited capacity on the bridges and tunnels that serve the island s central business districts. Out of the three main airports in the New York region, LGA is the only one that does not have an AirTrain system or a convenient and reliable transit access option for air passengers and airport employees. The other two major airports Newark Liberty International Airport (EWR) and John F. Kennedy International Airport (JFK) both have AirTrain systems, which have proved to be an essential ground access component for air travelers and airport employees. Currently, a majority of LGA air passengers use taxis and other For Hire Vehicles for ground access, but a majority of LGA employees drive. Ground access by mode type for air passengers and airport employees at LGA are shown in Table 1-1. In September 2018, JD Power and Associates released its study of customer satisfaction among North American (U.S. and Canada) airports. LGA ranked last (24 out of 24) among large airports, and airport access was one of the key factors in its low ranking. LGA has consistently ranked last or near the bottom of JD Power and Associate s customer satisfaction study over the last decade for the years that the study was conducted. LGA Airport Access Improvement Project 3

12

13 Note: The locations of the terminals represent the route that buses take on-airport, which is to stop at Terminal B, Terminal D, and Terminal C, respectively. This routing follows the design of the Airport s roadway network as shown. AirTrain LGA, LGA Ground Access Mode Choice Model and AirTrain Ridership Forecast Source: Metropolitan Transportation Authority Figure 1-2 Public Transit Options to LaGuardia Airport
14 Table 1-1 Ground Access Mode Choice at LGA Mode Air Passengers Airport Employees Auto park / short term 5.6% 55.7% Auto park / long term 1.0% 0.0% Auto park / off-airport 1.5% 0.0% Auto passenger / drop-off or pick-up 20.0% 1.6% Taxi/limousine/Uber/Lyft 51.2% 1.3% Bus, subway, LIRR 6.2% 40.1% Van/shuttle/hotel courtesy 5.6% 0.0% Rental car on-airport and off-airport 7.8% 0.0% Other modes 1.1% 1.3% Total 100.0% 100.0% Sources: 2017 LGA Ground Access Survey and LGA Customer Satisfaction Surveys. Air travelers are particularly sensitive to travel time reliability since the cost of delay could be a missed flight. As a result, air travelers build in extra time for their trip. Data from the annual Customer Satisfaction Survey (CSS) at LGA show that between 2006 and 2016, passengers increased the amount of time allotted to get to the Airport and through security by 12 percent, which is likely due in part to the increased traffic congestion in the area. Traffic congestion and associated travel times are expected to worsen in the future. Based on the New York Metropolitan Transportation Council s (NYMTC s) Best Practice Model (BPM), 2,3 congestion on the highway systems near the Airport will increase by a daily average of 10 percent from 2017 through 2045, and local road congestion will increase by a daily average of 11 percent, as shown in Table 1-2. As congestion increases, the additional budgeted travel time that travelers use to plan trips will increase at an even faster rate to account for a greater amount of unpredictability. Based on the Bureau of Public Roads Volume-Delay Function used in BPM, an increase of 10 percent in volume on an already congested road could result in 10 to 50 percent growth in travel times without an alternative travel mode option. The projected growth in traffic volumes on the already congested highways and local roadways around the airport would likely result in an increase in travel times to LGA. Considering that roadway congestion is expected to worsen and that air passengers and airport employees are currently highly dependent on roadway based vehicles, the need for a reliable alternative for access to and from LaGuardia Airport will increase in the future. For purposes of taking a conservative modeling approach and ensuring consistency with best practices in regional travel modeling, this study utilized the BPM, as previously described, to project future traffic volume and travel time growth. It should be noted that the BPM is based on data from 2010, and therefore does not account for new technologies such as app-based For Hire Vehicle companies and autonomous vehicles, which will likely impact travel choices in the future. Recent trends in the For Hire Vehicle industry and the development of emerging technologies, such as automated and connected vehicles, indicate that regional traffic volume growth could potentially be higher than what the BPM model projects. For example, in Manhattan and the 2 Web. Accessed April 6, Assuming growth rates consistent with City Environmental Quality Review (CEQR) Technical Manual published by NYC Mayor s office of Environmental Coordination. 4 LGA Airport Access Improvement Project
15 Brooklyn and Queens neighborhoods experiencing high population growth, traffic volumes have increased by 7 percent from 2013 to 2016 due in large part to the dramatic increase in the For Hire Vehicle market. 4 This rapid growth has continued through 2017 and into the first third of 2018 and is well in excess of the less than one percent average annual growth assumed in the BPM model (as shown in Table 1-2). 5 Furthermore, average traffic speeds in Midtown Manhattan, where over 26.3 percent of LGA passengers originate or terminate, decreased over a five-year period from 6.5 miles per hour (mph) in 2012 to 4.7 mph in 2017, which is a 28 percent decrease. 6 Travel times have increased for the complete trip between Midtown Manhattan and LGA as follows: For trips from Times Square to LGA from : 7 The annual average travel time increased from 31 to 35 minutes. The annual average daily maximum travel time (the longest single trip on any given day) increased from 47 to 54 minutes. The number of extreme travel days (with at least one trip taking 70 minutes or more) increased from 4 to 17, more than four-fold. For trips from LGA to Times Square from : The annual average travel time increased from 36 to 43 minutes. The annual average daily maximum travel time increased from 54 to 65 minutes. The number of extreme travel days increased from 21 to 114, more than five-fold. Such trends point toward significantly higher rates of traffic growth than the less than one percent average annual growth that the BPM model predicts. With autonomous vehicles, which are expected to be widely adopted by the 2040s, the greatest increase is expected to be in autonomous vehicle-taxis and autonomous For Hire Vehicles. Traffic volumes, as described above, have already increased significantly in just a few years with the growth of For Hire Vehicles; the emergence of autonomous For Hire Vehicles will likely continue that trend. Most studies on the future impacts of autonomous vehicles show a projected increase in Vehicle Miles Traveled (VMT). 8 Traffic experts believe that highways will move more vehicles per hour but not necessarily more people since some of the vehicles will have no passengers on their way to a pick up or wait area. However, on city streets, such as Midtown Manhattan, capacity may very well decrease as autonomous vehicles mix with large numbers of pedestrians and bicycle riders. This could be aggravated by the increased vehicular capacity of highways as they discharge more traffic, more 4 Schaller Consulting. Unsustainable? The Growth of App-Based Ride Services and Traffic, Travel and the Future of New York City. February 27, NYC Taxi and Limousine Commission and The New York Times. De Blasio s Five-Point Plan Aims to Reduce Traffic Congestion. Quote in article from NYC Department of Transportation Commissioner, Polly Trottenberg. October 22, Accessed April 5, NYC Taxi and Limousine Commission. Taxi GPS Datasets Data cleaned to remove any days during which onairport traffic conditions led to delays on the off-airport roadway network. 8 Public Square: A CNU Journal. Autonomous Vehicles: Hype and Potential. Peter Calthorpe and Jerry Walters. September 6, Accessed May 14, LGA Airport Access Improvement Project 5
16 rapidly, on city streets with reduced capacity. 9 However, since autonomous vehicles are an emerging technology and are new and not prevalent in the region, for the purposes of this study, the PANYNJ used the BPM traffic growth rates as inputs to the LGA ground access mode choice model. Table 1-2 Cumulative Traffic Growth Rates for Study Area Functional Class Time Period Highway Facilities Off-Peak 6% 5% 11% Highway Facilities Peak 5% 3% 9% Highway Facilities Daily 6% 4% 10% Local Roadways Off-Peak 5% 8% 13% Local Roadways Peak 2% 6% 8% Local Roadways Daily 4% 7% 11% Note: Peak refers to 6:00 AM to 9:59 AM and 4:00 PM to 7:59 PM. All other times are Off-Peak. Source: NYBPM (growth rates are consistent with CEQR Technical Manual). PANYNJ s primary goal for the LGA Airport Access Improvement Project is to provide a convenient and reliable transportation alternative for air passenger and employee access to, from, and within LGA. PANYNJ would also like the transportation alternative to provide a permanent, convenient, and safe parking facility for airport employees that does not restrict current redevelopment plans. A summary of the ridership forecasting methodology is presented in Chapters 2 through 7 of this report and Chapter 8 presents the results of modeling effort. The ridership forecasting process included: Summary of Passenger Preference Survey data (Chapter 2); Description of the LGA survey data used in the model (Chapter 3); Evaluation of the total ground access travel demand for trips to and from LGA and identification of the main geographic and customer travel markets (Chapter 4); Development of a ground access mode choice model that would comprehensively address travel options and mode combinations with and without AirTrain LGA (Chapter 5); Overview of the statistical structure of the model (Chapter 6); Description of assumptions and the level-of-service (LOS) characteristics (i.e., travel time and cost of trip) of AirTrain LGA that was used in the model (Chapter 7); and Summary of the AirTrain LGA ridership results for each travel market in two analysis years (Chapter 8). 9 Urban Land Magazine. Autonomous Vehicles: Hype and Potential. Peter Calthorpe and Jerry Walters. March 1, Accessed May 14, LGA Airport Access Improvement Project
17 PASSENGER PREFERENCE SURVEY This chapter highlights the results of a Passenger Preference Survey that was administered to gauge the likely future use of AirTrain LGA by air passengers. A premier market research firm (Kantar TNS) conducted an on-airport survey of arriving and departing passengers at LGA on behalf of PANYNJ in August The in-person interviews included future travel choices if AirTrain LGA service was provided between WP (with connection to the subway and LIRR) and LGA terminals. Airport passenger responses were recorded on tablet devices by trained surveyors and data results were prepared by Kantar TNS. The Passenger Preference Survey was administered with the LGA Ground Access Survey, which included questions about the current trip to and from LGA, as further described in Chapter 3 and Appendix A. The Passenger Preference Survey was administered only to those air passengers whose origin or destination was reported to be in the service territory of LIRR or the subway. An LGA Airport Employee Survey was also administered, which included questions about employees typical commute and likely future use of AirTrain LGA. All 2017 survey questionnaires are presented in Appendix A. The results of the 2017 surveys are described in Appendix B and summarized below. The Passenger Preference Survey questions asked respondents to rank the likelihood of using a new AirTrain ground access option that was connected to the LIRR and the 7 Line subway assuming low, medium, and high integrated fare scenarios. Both departing and arriving passengers expressed a high level of interest in using the future system in combination with both LIRR and subway service (Table 2-1). Table 2-1 Participation of Air Passengers in the Survey for AirTrain LGA Number of Survey Respondent by Category Departing Passengers Arriving Passengers Total Total number of survey respondents 1, ,373 Participants in the Passenger Preference Survey 1, ,515 Total participants in LIRR+AirTrain evaluation ,113 Total participants in Subway+AirTrain evaluation ,359 The respondents were presented a new option with AirTrain at three different levels of integrated fares (AirTrain fare plus connecting mode, LIRR or subway) in one direction. LIRR connection with AirTrain was presented with a $15 integrated fare as the base, $12 as the low-fare scenario, and $20 as the high-fare scenario. Subway connection with AirTrain was presented as an $11 integrated fare as the base, $8 as the low-fare scenario, and $14 as the high-fare scenario. The respondents were asked to rate their likelihood to switch to the new relevant option: 1 = definitely would use, 2 = likely to use, 3 = would consider, 4 = not likely to use, and 5 = definitely would not use. LGA Airport Access Improvement Project 7
18 The results of the passenger survey questions for each integrated fare scenario are summarized in Figure 2-1 for LIRR connection with AirTrain and Figure 2-2 for subway connection with AirTrain. Figure 2-1 Ranking of LIRR+AirTrain Option by LGA Air Passengers 38% Likely or Definitely take AirTrain, even at highest integrated fare level Figure 2-2 Ranking of Subway+AirTrain Option by LGA Air Passengers 44% Likely or Definitely take AirTrain, even at highest integrated fare level As shown, 38 percent of air passengers with an origin or destination in the LIRR service territory responded that they would definitely switch or were likely to use AirTrain LGA even at the highest integrated fare level. For those in the service territory of the subway, 44 percent responded that they would definitely switch or were likely to use AirTrain LGA at the highest integrated fare level. This level of interest, despite the integrated fare difference, also indicates that there would be a relatively low sensitivity of AirTrain ridership to integrated fare because of air passengers high willingness to pay, the emphasis air passengers put on travel time reliability, and the high cost of alternative modes such as taxi/ For Hire Vehicles. The developed LGA ground access model showed a similar level of sensitivity to integrated fare (see Appendix B). The responses received in the Passenger Preference Survey would equate to approximately 10 million AirTrain passengers in 2025 and 12 million passengers in LGA Airport Access Improvement Project
19 MODEL DATABASE CONSTRUCTION AND INPUTS The primary sources for the modeling effort were the LGA Ground Access Survey conducted in 2017 and the CSS ( ). Secondary data sources (e.g., total number of passengers, number of employees, bus ridership information, ground transportation reservations, taxi dispatched) were used to expand the survey data. The Passenger Preference Survey results, which are summarized in Chapter 2 and presented in Appendix B, were not used directly as inputs to the LGA Ground Access Mode Choice Model but were used to understand the potential demand for AirTrain LGA service and model elasticity with respect to fare. 3.1 ORIGIN, DESTINATION, AND DEMOGRAPHIC DATA LGA GROUND ACCESS SURVEY RESULTS The LGA Ground Access Survey conducted at LGA for both air passengers and employees in August 2017, included questions about the trip to or from LGA for air passengers and usual work trip information for employees (see Appendix A). The survey collected trip information from the following: 1,891 departing passengers interviewed at the gate with the survey programmed on a tablet, 482 arrival passengers interviewed at baggage claim areas, taxi lines, and bus stops with the paper survey, and 824 employees interviewed at ID badging office, Hangar 7, and Delta terminal with the survey programmed on tablets. The data was compiled and processed. Trip origin and destinations outside LGA were initially geocoded to the zip code level. To further augment the data, each air passenger record was duplicated assuming symmetry of mode used to arrive at the airport and depart from the airport and the direction of the observed trip was reversed to create the reverse trip. For example, each departing passenger provided an observed trip to LGA and therefore, a corresponding trip from LGA was created to complete a round trip for the model. Similarly, this was also done for the arriving passengers surveyed. This approach balanced the total daily trips to and from the airport. Likewise, every employee record generated two commute trips. For use in the model, the individual survey records were weighted to account for people traveling to and from LGA together sharing the same access mode and a number of other parameters (see Appendix A). This survey resulted in 2,207 records in the model database. Taking into account the average travel party size of 1.7, this survey represented more than 3,700 passengers, which is more than five percent of the 68,900 total daily passengers arriving or departing LGA on a daily basis. As indicated in Appendix A, the model was built on a combined database that also included the LGA Airport Access Improvement Project 9
20 Customer Satisfaction Surveys (CSS) for three years 2014, 2015, The combined dataset represents more than 15,000 passengers or more than 20 percent of the daily total. 10 The departing passenger questionnaire included the following: 34 total questions (with subparts) Mode of transportation to LGA (today) How do people travel to and from the airport? Flight details Where are departing passengers flying to? Personal information (residence, gender, age, income) Preference for theoretical rail service to LGA with an AirTrain option Airport access trip attributes and convenience factors The arriving passenger questionnaire included the following: 29 total questions (with subparts) Mode of transportation to LGA (today) Flight details Personal information (residence, gender, age, income) Preference for theoretical rail service to LGA with an AirTrain option The employee survey, which was administered at ID badging office, Hangar 7 and the Delta Terminal, included the following: 29 total questions (with subparts) Employment information Commute details Personal information (residence, gender, age, income) Preference for theoretical rail service to LGA with an AirTrain option Airport access trip attributes and convenience factors The main purpose of the LGA Ground Access Survey was to obtain detailed and unbiased information about the current trip to/from the airport for air passengers and airport employees. The survey questionnaire was built upon the questionnaire used in the CSS, with additional questions that are important for mode choice modeling. The survey included consideration of more than 20 access mode combinations pertinent to LGA. The survey questionnaire was based on review of other airport surveys and surveys used to develop forecasting models, and represents best practices in the profession. Table 3-1 shows a mode choice summary of air passenger trips. The predominant LGA ground access mode for all passenger types was auto modes (i.e., taxis, personal auto, or rental cars), 10 For comparison purposes, the following are typical sample sizes for similar surveys that collect travel patterns and are used to develop travel demand or ridership forecasting models: about 1 percent of the total number of households for a household survey for a large metropolitan region; 5 to 10 percent of total daily transit ridership for a transit on-board survey; and as reported in Airport Cooperative Research Program (ACRP) Synthesis 5 for multiple airport studies, 2 to 5 percent of total daily passengers for an airport survey. The combination of LGA surveys for four years ( CSS and the 2017 LGA Ground Access Survey) allowed for building a sample of a greater size comparing to most of the other transportation studies. 10 LGA Airport Access Improvement Project
21 which accounted for almost 85 percent of the trips by all air passengers. The remaining 15 percent of the trips were split between shared ride/hotel courtesy services and transit. Table 3-1 Air Passengers by Mode (Un-Weighted) from 2017 Survey Air Passengers Resident Visitor Mode Business Non-Business Business Non-Business Total Total % Auto Drop-off % Auto Short-Term Park % Auto Long-Term Park % Off-Airport Park % Rental Car At Airport % Rental Car Off Airport % Taxis/FHWs ,129 2, % Hotel Courtesy Vehicle % Shared Ride Van/Shuttle % NYC Airporter % Bus % Subway + Bus % Rail + Bus/Taxi % Total 196 1, ,081 3, % Source: 2017 LGA Ground Access Survey. For employees, nearly 66 percent of the trips were by auto modes, 33 percent by transit and 1 percent by non-motorized modes (Table 3-2). Table 3-2 Summary of Employee Observations by Mode (Un-Weighted) from 2017 Survey Employees Modes Total % Auto Park at Employee/P10 Lot % Auto Park Elsewhere % Taxi 9 1.0% NYC Airporter 3 0.3% Bus % Subway + Bus % Rail + Bus/Taxi % Non-motorized 9 1.0% Total % Source: 2017 LGA Ground Access Survey CUSTOMER SATISFACTION SURVEY (CSS) Since the 2017 LGA Ground Access Survey had a limited number of records, the data for air passengers was enriched with information from the CSS. Similar data cleaning and processing steps were applied to the CSS as for the 2017 LGA Ground Access Survey. The CSS does not include an employee survey. However, this survey provided many additional records for air passengers. Specifically, the additional origins and destinations of trips reported in the CSS LGA Airport Access Improvement Project 11
22 ensured that there were enough records for each geographic market. Table 3-3 shows a significantly higher share of transit (9.6 percent) and shared ride services (12.5 percent) from the CSS compared to the 2017 LGA Ground Access Survey. It was observed that the arrival passenger component of the CSS was somewhat biased toward these modes. This was likely due to survey bias since air passengers who are waiting for bus services or shared rides are easier to recruit for surveys than auto drivers/passengers, which can lead to higher response rates for such modes. For this reason, all records in the combined database that included both LGA Ground Access Survey and the CSS were weighted based on the independent aggregate controls as described below. Table 3-3 Air Passengers by Mode (Un-Weighted) from CSS Air passengers Resident Visitor Mode Business Non-Business Business Non-Business Total Total % Auto Drop-off , % Auto Short-Term Park % Auto Long-Term Park % Off-Airport Park % Rental Car At Airport % Rental Car Off Airport % Taxis/FHWs ,307 3,167 5, % Hotel Courtesy Vehicle % Shared Ride Van/Shuttle % NYC Airporter % Bus % Subway + Bus % Rail + Bus/Taxi % Total 1,074 2,248 2,071 5,600 10,993 Source: Customer Satisfaction Survey. 3.2 SURVEY WEIGHTING AND CONTROL DATA SOURCES Data from the 2017 LGA Ground Access and CSS surveys were combined and expanded to represent the most plausible distribution of LGA employees and air passengers by access mode and person type for the Baseline (No Build) scenario. The expansion process used an open-source statistical package called R, with an advanced econometric method to match a set of established aggregate controls. The control data were taken from different reliable sources of information such as airport traffic reports, future development plans (by terminal), parking capacities and occupation, surveys of bus transit lines serving LGA, etc. This procedure has been developed and applied for the weighting of many travel surveys in the past [9] The balancing algorithm starts with a predefined set of initial individual-record weights in this case, set all to 1. The balancing algorithm iterates over all controls and calculates adjustment factors to the expansion factors until a reasonable match is achieved for each control. Calculation of the adjustment factors at each step is based on the Newton-Raphson method. This method finds successively better approximations to the roots (or zeroes) of a realvalued function that in this case is a function that represents the discrepancy between the control and corresponding current value from the survey based on the current expansion factors. 12 LGA Airport Access Improvement Project
23 The controls have differing importance levels or priority (Table 3-4), which signify how much relaxation can be applied to these controls in case of a conflict among controls. Table 3-4 Target Controls for Survey Expansion Description Total Inbound Passenger by Terminal Total Outbound Passenger by Terminal Total Connecting Passengers Connecting Passengers (Inter-Terminal) Total Employee Trips Air Passengers by Purpose (Business/Non-Business) Short Term Parking for Air Passengers (Total ins and outs) Long Term Parking for Air Passengers (Total ins and outs) NYC Airporter Taxi/Limo/For Hire Vehicles Dispatched Rental Car On Airport (Drop-offs and Pick-ups) Rental Off Airport (Drop-offs and Pick-ups) Hotel Courtesy Vehicles Shared Vans Off-airport Parking Bus Ons and Offs at LGA Air Passengers Bus Ons and Offs at LGA Employee Employee Parking Lot (Total Ins and Outs) Employee Totals by Geography (16) Priority High High High High High Medium Medium Medium Medium Medium Medium Medium Medium Medium Medium Medium Medium Medium Medium The relaxation factors allow for a deviation from the control targets and for the procedure to converge (i.e. find a unique and most statistically significant solution) with possibly imperfect controls that may not be completely consistent. The procedure applies an adjustment factor to the record weight based on each control. PANYNJ provided most control target data (e.g., number of air passengers by direction and terminal, number of employees, parking data, bus boardings and alightings, and rental car pick-ups). Additional data on taxi pick-ups and ground access transportation reservations was also available from the yearly published traffic reports by PANYNJ [13,14,15]. Later, estimated controls were provided to define an estimated target for modes for which control total data was not available. 3.3 LGA PASSENGER AND EMPLOYEE FORECASTS AND GROWTH FACTORS The total number of LGA air passengers expected in 2017, 2025, and 2045 is shown in Table 3-5. LGA Airport Access Improvement Project 13
24 Table 3-5 LGA Long-Range Forecast LAGUARDIA AIRPORT PASSENGERS (000'S) Base Case YEAR DOMESTIC INTERNAT'L TOTAL ,461 2,107 29, ,681 2,276 29, ,957 2,367 30, ,400 2,572 30, ,664 2,809 31, ,939 3,034 31, ,215 3,211 32, ,494 3,385 32, ,714 3,521 33, ,935 3,610 33, ,214 3,713 33, ,456 3,795 34, ,712 3,870 34, ,003 3,946 34, ,329 4,022 35, ,623 4,099 35, ,931 4,176 36, ,255 4,253 36, ,581 4,329 36, ,942 4,406 37, ,302 4,484 37, ,659 4,562 38, ,015 4,633 38, ,127 4,686 38, ,351 4,792 39, ,577 4,901 39, ,804 5,013 39, ,033 5,127 40, ,263 5,244 40,507 The total number of employees expected in 2017, 2025, and 2045 was derived from the growth rates of LGA passenger forecasts for the period between 2016 and As a first step, the number of employees for 2016 was obtained from PANYNJ s Air Traffic Report (12,341 employees). It was then scaled to 12,278 for 2017 based on the expected change in enplanements between those two years. 12 Due to productivity increases, technological advances, and other factors, it was assumed that employment growth at the airport would be only about 70 percent of air passenger growth. Since the growth in air passengers is expected to be 12.4 percent between 2017 and 2025, the growth in the number of employees is expected to be 8.6 percent. This 8.6 percent growth rate was applied to the 2017 employee number (12,278 employees), resulting in 13,343 employees in The same method results in 15,457 employees for 2045 where the air passenger growth between 2017 and 2045 is assumed to be 37.0 percent and the corresponding employee growth is estimated at 25.9 percent. 12 A forecast was used for 2017 employees and employee trips since actual numbers for 2017 were not available at the time the projections were generated (October 2017). 14 LGA Airport Access Improvement Project
25 Subsequently, LGA employment was translated into the number of employee trips to and from LGA. It was based on the average daily attendance factor (average number of days a LGA employee goes to the airport for work during the 7-day week divided by 7). A attendance factor accounts for work schedules, vacations, and holidays and was based on the results of the 2017 LGA Employee Survey (see Appendix B). Then the number of employee trips was calculated as a product of the number of employees and attendance factor multiplied by 2 to account for the two-way commuting. This calculation resulted in the following average daily number of employee trips to and from LGA prior to applying a survey balancing procedure: 12,278*0.544*2 = 13,358 employee trips per day for 2017; 13,343*0.544*2 = 14,517 employee trips per day for 2025; and 15,457*0.544*2 = 16,817 employee trips per day for A survey balancing procedure, following the methodology that is described in Section 3.2 for air passengers, was used to generate statistically representative expansion factors, which were then applied to the average number of daily employee trips for each of the three years. The expansion factors result in small adjustments (between 0.02 percent and 0.3 percent) to the number of employee trips; and the final numbers are used in the ridership model (see Table 3-6). The expansion factors allow for a statistically reliable way to break down the total number of daily employee trips into employee trips by bus, estimated number of employees parking at LGA, and employee geography. As described in Section 3.2, control data sources such as special bus line surveys that record employee trips by bus, employee parking data, and airport development plans were used as control targets in the survey balancing procedure. Table 3-6 Input Data for the Calculation of Daily Employee Trips to and from LGA Year Enplanements Growth Factor Employee Growth Factor (70% of Enplanements) Number of Employees Number of Employee Trips Employee Trips Input to the Model (with expansion factors) , % 0.00% 12,278 13,358 13, , % 8.68% 13,343 14,517 14, , % 25.90% 15,457 16,817 16,772 LGA Airport Access Improvement Project 15
26
27 MODEL ANALYSIS FOR AIRTRAIN LGA 4.1 GEOGRAPHIC MARKETS OF AIR PASSENGERS AND EMPLOYEES At the outset of the ridership forecasting process, geographic markets were identified to create a template for use in the LGA ground access mode choice model and to provide a framework for understanding the model s results. As further described in subsequent sections of this report, development of the LGA model was informed by NYMTC s BPM (see Chapter 5), the 2017 LGA Ground Access Survey, the CSS ( ), and supplemental data (see Chapter 3). The geographic markets were defined using data from the surveys and BPM (e.g., travel time for highway and transit trips to LGA) and identifying where air traveler and airport employee trips originate in relation to the modes of travel that are available in those locations. The New York metropolitan region has three major airports JFK, LGA, and EWR and another six local airports with partially overlapping catchment areas. LGA is characterized by its unique proximity to Midtown Manhattan and by its location between the high-density urbanized areas of Queens, Brooklyn, and the Bronx. Figure 4-1 presents the existing spatial distribution of LGA air passengers based on survey data. Overall LGA attracts air passengers from across the New York metropolitan region, however, the major markets in Manhattan, Queens, Brooklyn, the Bronx, and Upstate New York rely greatly on LGA as the closest and most accessible major airport. LGA employees are less geographically dispersed compared to air passengers (Figure 4-2). The main concentration of employees is in Queens, Brooklyn, and the Bronx, and a substantial share is from Long Island. Portions of Midtown Manhattan within walking distance of 0.5 miles to the LIRR or the 7 Line subway stations represent the largest potential AirTrain LGA market with 18 percent of LGA Origin and Destination (O&D) air passengers. Employees from Queens and Brooklyn are most likely to use the AirTrain LGA since they can choose between a subway connection or driving and parking at WP. Additionally, employees from Long Island could use the AirTrain LGA by connecting with the LIRR or driving and parking at WP. For employees from the Bronx, there is no convenient transit access to WP, and driving to LGA is an easier option. Willets Point (WP) represents a hub of the major highways, including the Grand Central Parkway, Van Wyck Expressway, and Long Island Expressway, which makes LGA accessible to air passengers and employees from Long Island. The major highways as well as transit access lines to WP define the major potential spatial markets and directions from where the air passengers and employees could travel to and from LGA. Given these factors and based on the locations of existing LGA users known from the recent LGA surveys, the geographic markets shown in Figure 4-3 and described below were identified: 16 LGA Airport Access Improvement Project
28 Port Authority LGA Ground Access Survey 2017, weighted using Customer Satisfaction Survey data from Staten Island 1.0% New Jersey NJ & PA 3.7% Midtown Walking Access 18.0% Penn Station Passenger Share, by Percentage < 1.5% 1.5% - 4% 4% - 8% 8% - 12% 18% Brooklyn West 8.5% Manhattan North 4.8% Manhattan Upper East/West 8.6% Midtown Other 8.3% Grand Central Queens Northwest 1.3% Queens W Walking Access 2.0% Brooklyn East 1.9% The Bronx 5.6% LGA Manhattan Lower Terminal Queens 8.9% W Other 0.7% Queens E Walking AirTrain LGA, LGA Ground Access Mode Choice Model and AirTrain Ridership Forecast Access 1.5% New York Queens E Other 6.1% Long Island 7.2% 0 4 MILES LaGuardia Airport Passenger Share by Trip Origin/Destination Figure 4-1
29 Port Authority LGA Ground Access Survey 2017, weighted using Customer Satisfaction Survey data from New Jersey Staten Island 0.9% NJ & PA 3.6% Penn Station Employee Share, by Percentage < 1.5% 1.5% - 4% 4% - 8% 8% - 12% 12% - 19% Brooklyn West 6.5% Manhattan North 4.4% Midtown Midtown Other Walking Access 0.1% 0.3% Queens W Walking Access 8.3% Brooklyn East 6.5% The Bronx 11.6% Manhattan Upper East/West 0.4% Queens Northwest 8.2% LGA Grand Central Terminal Willets Point Manhattan Lower 0.9% Queens W Other 2.2% Queens E Walking AirTrain LGA, LGA Ground Access Mode Choice Model and AirTrain Ridership Forecast Access 9.7% New York Queens E Other 18.8% Long Island 14.3% 0 4 MILES LaGuardia Airport Employee Share by Trip Origin/Destination Figure 4-2
30 Data source: Port Authority LGA Ground Access Survey 2017, weighted using Customer Satisfaction Survey data from MILES Brooklyn West Manhattan Lower Midtown Walking Access Midtown Other LGA Brooklyn East Queens West Other Queens West Walking Access Queens Northwest The Bronx AirTrain LGA, LGA Ground Access Mode Choice Model and AirTrain Ridership Forecast Staten Island Manhattan North Manhattan Upper East/West New Jersey New York Queens East Walking Access Queens East Other Brooklyn West The Bronx Staten Island Long Island Upstate NY & CT NJ & PA Midtown Other Manhattan Upper East/West Manhattan North Queens Northwest Queens West Walking Access Queens West Other Figure 4-3 LaGuardia Airport Geographic Markets Queens East Walking Access Brooklyn East Midtown Walking Access New York Queens East Other New Jersey Long Island Manhattan Lower NJ & PA Upstate NY & CT
31 Manhattan a key market for LGA air passengers is subdivided into the following five areas, which directly relate to probable LGA air passengers using AirTrain LGA with a combination of either the LIRR or the 7 Line subway: 1.1 = Lower Manhattan 1.21 = Midtown Manhattan with walking access to either Grand Central Terminal or Penn Station or to one of the 7 Line subway stations 1.22 = Other Midtown Manhattan 1.3 = Manhattan Upper East Side and Upper West Side 1.4 = Manhattan North Queens a key market for LGA employees is subdivided into the following five areas by potential propensity to use transit access to AirTrain LGA: 2 = Queens North-West 2.1 = Queens West with a walking access to the 7 Line subway or LIRR, which generates the primary market for employees who could use AirTrain LGA 2.2 = Queens West other 2.3 = Queens East with a walking access to the subway 2.4 = Queens East other The geographic system becomes less specific for secondary markets and areas farther away from LGA. 4.2 LGA PASSENGER TYPES Another important dimension to consider for the AirTrain LGA market is the air passenger trip purpose (i.e., business versus personal trips) and residential status (i.e., New York region residents versus visitors). Both trip type and resident type affect preferences in terms of ground access choices and many existing airport ground access choice models were developed to address this segmentation [6,7] (Appendix E). LGA is the preferred airport for many business travelers due to its unique proximity to Midtown Manhattan. Based on data collected from surveys, Figure 4-4 shows a much higher share of business air passengers for LGA (close to 35 percent on average over the last four years) compared to the other major New York airports. Because most business passengers stay in Midtown Manhattan, carry minimal luggage, and are characterized by a high willingness to pay for reliable and convenient transportation, they are an important potential market for AirTrain LGA. LGA Airport Access Improvement Project 17
32 Figure 4-4 O&D Share of Business Air Passengers for NY Major Airports % 40.0% 35.0% 30.0% 25.0% 20.0% 15.0% 10.0% 5.0% 0.0% JFK LGA EWR Average Supporting data on the share of air passengers staying in Midtown Manhattan is shown in Figure 4-5. This tabulation includes all types of air passengers, and, given the high share of business travelers described above, LGA is the most Manhattan-oriented airport amongst the three major New York airports. Figure 4-5 O&D Share of Air Passengers to Manhattan 14 th -96 th Street for NY Major Airports % 45.0% 40.0% 35.0% 30.0% 25.0% 20.0% 15.0% 10.0% 5.0% 0.0% JFK LGA EWR Average Business air passengers in general have a higher Value of Time (VOT), belong to smaller travel parties, and have less luggage compared to non-business air passengers. Relatively higher VOTs for business air passengers compared to non-business passengers were adopted in most airport ground access models [6,7,8,10,11]. Visitors more frequently use rental cars, taxis or For Hire Vehicles, while residents more often use auto drop-offs/pick-ups and/or long-term parking (see Appendix D). 13 Data collected from a LGA Survey conducted in 2016, a LGA Ground Access and AirTrain Attitudinal Survey conducted in 2017, and a PANYNJ Customer Satisfaction Surveys for LGA conducted in Data collected from a LGA Survey conducted in 2016, a LGA Ground Access and AirTrain Attitudinal Survey conducted in 2017, and a PANYNJ Customer Satisfaction Surveys for LGA conducted in LGA Airport Access Improvement Project
33 Table 4-1 summarizes the corresponding joint distribution of LGA air passengers by trip purpose and place of residence. Table 4-1 Distribution of LGA Air Passengers by Type Unweighted Customer Satisfaction Survey Consolidated weighted model database 2017 Unweighted Air passenger type Ground Access Survey Any Business Visitors 18.8% 12.8% 19.8% Any Business Residents 9.8% 5.1% 9.2% Personal Only Visitors 51.0% 54.3% 47.1% Personal Only Residents 20.5% 27.8% 23.9% In general, LGA is characterized by a relatively high share of business travelers and visitors. The main ground access mode for LGA air passengers today is taxi/for Hire Vehicles. The major advantage of rail/transit travel over auto modes is that it provides shorter and more reliable travel times due to surface street congestion in Manhattan, around LGA, and on the route between. 4.3 AUTO AND TRANSIT TRAVEL TIMES FOR KEY O&D PAIRS Travel times to and from LGA by different access modes is one of the key explanatory variables in ground access mode choice. The AirTrain LGA ridership forecast is largely a function of travel time savings (as well as travel time reliability improvements) that this new mode brings compared to the existing access modes. A substantial effort was made to analyze the average travel times and travel time reliability for the key origins and destinations to and from LGA in order to prepare the most objective input to the LGA ground access mode choice model. Tables 4-2 and 4-3 present the year 2025 and 2045 average automobile and transit times (with AirTrain LGA) for typical locations to and from LGA that are used in the LGA ground access mode choice model. As indicated in Appendix C and elsewhere in this report, highway and transit travel times for the existing modes of transportation to and from LGA is based on the information contained in BPM, with the highway travel times adjusted to reflect recent taxi GPS data. The assumptions used to develop transit travel times with AirTrain LGA are presented in Chapter 7. The transit option with the shortest total travel time (either LIRR with AirTrain LGA or subway with AirTrain LGA) from each selected location was chosen for this table. Transit travel time includes in-vehicle time on AirTrain LGA, LIRR, and the subway; walk and wait access at Willets Point; and walk and wait time at other transfer points, where applicable. Mean auto travel times shown in Tables 4-2 and 4-3 do not include explicit wait time. The model implicitly accounts for auto wait times through the mode coefficients described in Table 5-1 (Chapter 5). LGA Airport Access Improvement Project 19
34 Reference Location Table 4-2 Comparisons of Auto and Transit Travel Times with AirTrain To LGA (PM Peak) for Selected Important Locations, 2025 and 2045 Mean Auto Travel Time (min) 95th Percentile Auto Time (min) 1 Transit Travel Time (min) 2 Transit Mode 2025 Grand Central Terminal LIRR, AirTrain Penn Station LIRR, AirTrain Financial District Subway, LIRR, AirTrain Union Square Subway, LIRR, AirTrain Downtown Brooklyn Subway, LIRR, AirTrain Long Island City Subway, AirTrain 2045 Grand Central Terminal LIRR, AirTrain Penn Station LIRR, AirTrain Financial District Subway, LIRR, AirTrain Union Square Subway, LIRR, AirTrain Downtown Brooklyn Subway, LIRR, AirTrain Long Island City Subway, AirTrain Notes: 1 The value below which 95 percent of the observations can be found. 2 Transit travel time includes in-vehicle time on LIRR and the subway, walk and wait time for AirTrain LGA, the ride to LGA terminals, and additional walk and wait time if the trip involves additional transfers. The initial walk and wait time for transit is not included. A full description of the travel time components, the assumptions used to develop them, and how each was incorporated in the model is included in Chapter 7. Modeled travel time inputs are included in Appendix G. 20 LGA Airport Access Improvement Project
35 Reference Location Table 4-3 Comparisons of Auto and Transit Travel Times with AirTrain From LGA (AM Peak) for Selected Important Locations, 2025 and 2045 Mean Auto Travel Time (min) 95th Percentile Auto Time (min) 1 Transit Travel Time (min) 2 Transit Mode 2025 Grand Central Terminal LIRR, AirTrain Penn Station LIRR, AirTrain Financial District Subway, LIRR, AirTrain Union Square Subway, LIRR, AirTrain Downtown Brooklyn Subway, LIRR, AirTrain Long Island City Subway, AirTrain 2045 Grand Central LIRR, AirTrain Terminal Penn Station LIRR, AirTrain Financial District Subway, LIRR, AirTrain Union Square Subway, LIRR, AirTrain Downtown Subway, LIRR, AirTrain Brooklyn Long Island City Subway, AirTrain Notes: 1 The value below which 95 percent of the observations can be found. 2 Transit travel time includes in-vehicle time on LIRR and the subway, walk and wait time for AirTrain LGA, the ride to LGA terminals, and additional walk and wait time if the trip involves additional transfers. The initial walk and wait time for AirTrain LGA is not included. A full description of the travel time components, the assumptions used to develop them, and how each was incorporated in the model is included in Chapter 7. Modeled travel time inputs are included in Appendix G. Travelers rarely plan their trips solely based on the average travel time. Planning for an average travel time would correspond to approximately 50 percent probability of being late. To avoid being late, travelers plan their trips by building in some buffer time that can be added to the mean travel time (i.e., half of all trips are faster and half are slower). For trips to airports, the buffer has to be substantial in order to cover practically all uncertainty associated with travel times. It is important to reiterate that automobile travel times vary widely and their volatility is projected to increase in future years. To account for this volatility, Tables 4-2 and 4-3 show a 95th percentile travel time, which reflects the upper threshold of travel time for 95 percent of trips between LGA and a particular destination. From key reference locations, the transit option with AirTrain LGA represents a better travel option, even if travel time reliability is not accounted for. When the 95 th percentile auto travel time (i.e., a realistic worst-case scenario) is considered along with the average travel time, the reliability of the transit/airtrain LGA option makes it even more attractive. Appendix C provides a detailed discussion on travel time reliability. For trips to the airport (for departing passengers), travel time reliability is critically important since being late may result in missing the scheduled departure [8,12]. For different mode combinations, all LOS characteristics, including travel time reliability, are combined. In this regard, combinations of rail modes such as LIRR and AirTrain represent the most reliable modes while taxi/for Hire Vehicles, auto modes, and buses represent the least reliable option. An auto trip to WP with a transfer to LGA Airport Access Improvement Project 21
36 AirTrain LGA represents an intermediate case where the auto portion of the trip would still have a certain unreliability component while the AirTrain LGA portion would not have it. In addition to travel time, transit options (LIRR and subway) combined with AirTrain LGA can be compared against auto modes and transit options that do not utilize AirTrain LGA. This is done by using the generalized cost of each mode, which considers travel cost weighted by VOT in addition to a reliability component that is represented by a difference between the 95 th percentile of travel time and the mean travel time. In this case, 95th percentile plays the role of the worst possible case that the travelers would take into account to avoid lateness and possibly missing the flight. In the generalized cost calculation, transit travel time components (walks, waits, and transfers) are weighted using coefficients from the model, which are described in the next chapters. Figure 4-6 presents the comparisons of the generalized costs of the auto modes and transit options with AirTrain LGA. The map on the left shows a comparison between the transit/airtrain option and auto/taxi/for Hire Vehicles. The map on the right compares transit/airtrain LGA to other non-airtrain transit options (i.e., bus lines M60, Q33, Q48, Q70, Q72). The level-of-service (LOS) data and cost assumptions that were used in the analysis are presented in Chapter 7. These maps indicate that the new transit options with AirTrain LGA would be advantageous for those who live or stay in Midtown Manhattan when compared to a taxi/for Hire Vehicles ride. The new transit options with AirTrain LGA would also be advantageous when compared to existing conventional transit for the same key market. Auto/Taxi/ For Hire Vehicles would still have advantages for most trips from Queens, Brooklyn, and the Bronx. Existing conventional transit would be less competitive for trips to LGA but would still have a relatively high advantage for trips from the Bronx, certain areas of Queens (Queens North, in particular), and Brooklyn. 22 LGA Airport Access Improvement Project


37 Figure 4-6 Comparison of Overall Generalized Cost by Auto and Transit with AirTrain to LGA, 2025 LIRR/Subway+AirTrain vs. taxi/ For Hire Vehicles/auto LIRR/Subway+AirTrain vs. other non-airtrain transit LGA Airport Access Improvement Project 23
Sample enumeration model for airport ground access
 Sample enumeration model for airport ground access Surabhi Gupta, Peter Vovsha (WSP) Session 6B Cool model applications Sample enumeration model as example of data-driven approach Use model to predict
TransAction Overview. Introduction. Vision. NVTA Jurisdictions
 Introduction Vision NVTA Jurisdictions In the 21 st century, Northern Virginia will develop and sustain a multimodal transportation system that enhances quality of life and supports economic growth. Investments
5 Rail demand in Western Sydney
 5 Rail demand in Western Sydney About this chapter To better understand where new or enhanced rail services are needed, this chapter presents an overview of the existing and future demand on the rail network
5.0 REGIONAL ANALYSIS
 5.0 REGIONAL ANALYSIS This section discusses the level of congestion forecast for the entire NYMTC planning area in 2014 and 2040. Congestion levels in the New York metropolitan region are first benchmarked
Assessment of Travel Trends
 I - 2 0 E A S T T R A N S I T I N I T I A T I V E Assessment of Travel Trends Prepared for: Metropolitan Atlanta Rapid Transit Authority Prepared by: AECOM/JJG Joint Venture Atlanta, GA October 2011 General
Interstate 90 and Mercer Island Mobility Study APRIL Commissioned by. Prepared by
 Interstate 90 and Mercer Island Mobility Study APRIL 2017 Commissioned by Prepared by Interstate 90 and Mercer Island Mobility Study Commissioned by: Sound Transit Prepared by: April 2017 Contents Section
2015 Independence Day Travel Overview U.S. Intercity Bus Industry
 2015 Independence Day Travel Overview U.S. Intercity Bus Industry Chaddick Institute for Metropolitan Development, DePaul University June 25, 2015 This Intercity Bus Briefing summarizes the Chaddick Institute
SAMTRANS TITLE VI STANDARDS AND POLICIES
 SAMTRANS TITLE VI STANDARDS AND POLICIES Adopted March 13, 2013 Federal Title VI requirements of the Civil Rights Act of 1964 were recently updated by the Federal Transit Administration (FTA) and now require
APPENDIX B COMMUTER BUS FAREBOX POLICY PEER REVIEW
 APPENDIX B COMMUTER BUS FAREBOX POLICY PEER REVIEW APPENDIX B COMMUTER BUS FAREBOX POLICY PEER REVIEW The following pages are excerpts from a DRAFT-version Fare Analysis report conducted by Nelson\Nygaard
PREFACE. Service frequency; Hours of service; Service coverage; Passenger loading; Reliability, and Transit vs. auto travel time.
 PREFACE The Florida Department of Transportation (FDOT) has embarked upon a statewide evaluation of transit system performance. The outcome of this evaluation is a benchmark of transit performance that
Getting to The Juilliard School
 Getting to The Juilliard School TRANSPORTATION FROM AREA AIRPORTS Airport Shuttles Super Shuttle (800) BLUE-VAN (800-258-3826) https://www.supershuttle.com/ NYC Airporter (718) 777-5111 http://www.nycairporter.com/
THE AIRTRAIN AIRPORT ACCESS SYSTEM JOHN F. KENNEDY INTERNATIONAL AIRPORT AIRPORT ACCESS SERVICE
 THE AIRTRAIN AIRPORT ACCESS SYSTEM JOHN F. KENNEDY INTERNATIONAL AIRPORT AIRPORT ACCESS SERVICE The JFK AirTrain airport access system interfaces with two existing regional transit systems; the Long Island
Development of SH119 BRT Route Pattern Alternatives for Tier 2 - Service Level and BRT Route Pattern Alternatives
 Development of SH119 BRT Route Pattern Alternatives for Tier 2 - Service Level and BRT Route Pattern Alternatives June 1, 2018 Development of SH119 BRT Route Pattern Alternatives for Tier 2 - Service Level
BOSTON REGION METROPOLITAN PLANNING ORGANIZATION
 PLANNING ORGANIZATIO BOSTON REGION MPO NMETROPOLITAN BOSTON REGION METROPOLITAN PLANNING ORGANIZATION Stephanie Pollack, MassDOT Secretary and CEO and MPO Chair Karl H. Quackenbush, Executive Director,
3. Proposed Midwest Regional Rail System
 3. Proposed Midwest Regional Rail System 3.1 Introduction The proposed Midwest Regional Rail System (MWRRS) will operate in nine states, encompass approximately 3,000 route miles and operate on eight corridors.
PORTS TORONTO Billy Bishop Toronto City Airport Summary of 2015 Traffic and Passenger Surveys
 PORTS TORONTO Billy Bishop Toronto City Airport Summary of 2015 Traffic and Passenger Surveys 1 Summary of 2015 BBTCA Traffic and Passenger Surveys Surveys of traffic volumes and pedestrian activity were
CENTRAL OREGON REGIONAL TRANSIT MASTER PLAN
 Central Oregon Regional Transit Master Plan Volume II: Surveys and Market Research CENTRAL OREGON REGIONAL TRANSIT MASTER PLAN Volume IV: Service Plan Appendices A-B July 213 Nelson\Nygaard Consulting
A. CONCLUSIONS OF THE FGEIS
 Chapter 11: Traffic and Parking A. CONCLUSIONS OF THE FGEIS The FGEIS found that the Approved Plan will generate a substantial volume of vehicular and pedestrian activity, including an estimated 1,300
Memorandum. Roger Millar, Secretary of Transportation. Date: April 5, Interstate 90 Operations and Mercer Island Mobility
 Memorandum To: From: The Honorable Dow Constantine, King County Executive; The Honorable Ed Murray, City of Seattle Mayor; The Honorable Bruce Bassett, City of Mercer Island Mayor; The Honorable John Stokes,
METROBUS SERVICE GUIDELINES
 METROBUS SERVICE GUIDELINES In the late 1990's when stabilization of bus service was accomplished between WMATA and the local jurisdictional bus systems, the need for service planning processes and procedures
HOUSEHOLD TRAVEL SURVEY
 HOUSEHOLD TRAVEL SURVEY Household Travel Survey i TABLE OF CONTENTS Page 1.0 INTRODUCTION... 1 2.0 SUMMARY OF TRAVEL... 2 2.1 All-Day Travel Patterns... 2 2.1.1 Automobile Availability... 2 2.1.2 Trip
Ridership Projection: Direct Ferry to Midtown W 39th St.
 file Modes 500 Pier Sites Excursions Parking Sustainability Ridership Projections Feasibility Conclusion Ridership Projection: Direct Ferry to Midtown th St. 7,000 Total Catchment Area Direct Ferry to
I R UNDERGRADUATE REPORT. National Aviation System Congestion Management. by Sahand Karimi Advisor: UG
 UNDERGRADUATE REPORT National Aviation System Congestion Management by Sahand Karimi Advisor: UG 2006-8 I R INSTITUTE FOR SYSTEMS RESEARCH ISR develops, applies and teaches advanced methodologies of design
JATA Market Research Study Passenger Survey Results
 JATA Market Research Study Passenger Survey Results Prepared for the Jackson Area Transportation Authority (JATA) April, 2015 3131 South Dixie Hwy. Suite 545 Dayton, OH 45439 937.299.5007 www.rlsandassoc.com
Treasure Island Supplemental Information Report Addendum
 1 1 1 1 0 1 0 1 0 1 Treasure Island Supplemental Information Report Addendum Introduction Purpose The purpose of this Supplemental Information Report (SIR) Addendum is to determine if the current land
The Economic Impact of Tourism on Calderdale Prepared by: Tourism South East Research Unit 40 Chamberlayne Road Eastleigh Hampshire SO50 5JH
 The Economic Impact of Tourism on Calderdale 2015 Prepared by: Tourism South East Research Unit 40 Chamberlayne Road Eastleigh Hampshire SO50 5JH CONTENTS 1. Summary of Results 1 2. Table of Results Table
YARTS ON-BOARD SURVEY MEMORANDUM
 YARTS ON-BOARD SURVEY MEMORANDUM Prepared for the Yosemite Area Regional Transportation System Prepared by LSC Transportation Consultants, Inc. This page left intentionally blank. YARTS On-Board Survey
Proof of Concept Study for a National Database of Air Passenger Survey Data
 NATIONAL CENTER OF EXCELLENCE FOR AVIATION OPERATIONS RESEARCH University of California at Berkeley Development of a National Database of Air Passenger Survey Data Research Report Proof of Concept Study
Watts St westbound thru
 Executive Summary At the request of the Hudson Square Business Improvement District, Sam Schwartz Engineering, DPC (Sam Schwartz) has completed a technical analysis of various congestion pricing and/or
Other Principle Arterials Minor Arterial Major Collector Minor Collector Local
 CHAPTER 10 TRANSPORTATION Introduction The system of public roads in East Pikeland Township is decidedly rural in character. Since the 1984, the road network has remained much the same, with the addition
APPENDIX B. Arlington Transit Peer Review Technical Memorandum
 APPENDIX B Arlington Transit Peer Review Technical Memorandum Arlington County Appendix B December 2010 Table of Contents 1.0 OVERVIEW OF PEER ANALYSIS PROCESS... 2 1.1 National Transit Database...2 1.2
2009 Muskoka Airport Economic Impact Study
 2009 Muskoka Airport Economic Impact Study November 4, 2009 Prepared by The District of Muskoka Planning and Economic Development Department BACKGROUND The Muskoka Airport is situated at the north end
Baku, Azerbaijan November th, 2011
 Baku, Azerbaijan November 22-25 th, 2011 Overview of the presentation: Structure of the IRTS 2008 Main concepts IRTS 2008: brief presentation of contents of chapters 1-9 Summarizing 2 1 Chapter 1 and Chapter
Economic Impact of Kalamazoo-Battle Creek International Airport
 Reports Upjohn Research home page 2008 Economic Impact of Kalamazoo-Battle Creek International Airport George A. Erickcek W.E. Upjohn Institute, erickcek@upjohn.org Brad R. Watts W.E. Upjohn Institute
Airport Profile. St. Pete Clearwater International BY THE NUMBERS 818, ,754 $ Enplanements. Passengers. Average Fare. U.S.
 Airport Profile St. Pete Clearwater International St. Pete-Clearwater International Airport (PIE) is located in Pinellas County, Florida about nine miles north of downwn St. Petersburg, seven miles southeast
ITS. Intermountain Transportation Solutions Traffic Studies Transportation Analysis Signal Design Site Planning. January 9, 2013
 ITS Intermountain Transportation Solutions Traffic Studies Transportation Analysis Signal Design Site Planning Raymond Wright, P.E. City of Spokane Transportation Department 11707 East Sprague Avenue,
2010 El Paso Work Place Travel Survey Technical Summary
 2010 El Paso Work Place Travel Survey Technical Summary Prepared by the Texas A&M Transportation Institute June 2013 2010 El Paso Work Place Travel Survey TECHNICAL SUMMARY Texas Department of Transportation
ESTIMATION OF ECONOMIC IMPACTS FOR AIRPORTS IN HAWTHORNE, EUREKA, AND ELY, NEVADA
 TECHNICAL REPORT UCED 97/98-14 ESTIMATION OF ECONOMIC IMPACTS FOR AIRPORTS IN HAWTHORNE, EUREKA, AND ELY, NEVADA UNIVERSITY OF NEVADA, RENO ESTIMATION OF ECONOMIC IMPACTS FOR AIRPORTS IN HAWTHORNE, EUREKA
Bus Corridor Service Options
 Bus Corridor Service Options Outline Corridor Objectives and Strategies Express Local Limited Stop Overlay on Local Service 1 Deadhead 1 Stacey Schwarcz, "Service Design for Heavy Demand Corridors: Limited-Stop
The Economic Impact of Tourism on Scarborough District 2014
 The Economic Impact of Tourism on Scarborough District 2014 Prepared by: Tourism South East Research Unit 40 Chamberlayne Road Eastleigh Hampshire SO50 5JH CONTENTS 1. Summary of Results 1 2. Table of
Oakland A s Gondola Economic Impact
 January 2019 Oakland A s Gondola Economic Impact KEY FINDING: The proposed gondola system, which will connect the A s planned stadium to downtown Oakland, will generate $685 million in total economic benefit
Appendix 4.1 J. May 17, 2010 Memorandum from CTPS to the Inter Agency Coordinating Group
 Appendix 4.1 J May 17, 2010 Memorandum from CTPS to the Inter Agency Coordinating Group CTPS CENTRAL TRANSPORTATION PLANNING STAFF Staff to the Boston Region Metropolitan Planning Organization MEMORANDUM
NAPA VALLEY VISITOR INDUSTRY 2012 Economic Impact Report
 Join Visit Napa Valley NAPA VALLEY VISITOR INDUSTRY 2012 Economic Impact Report Research prepared for Visit Napa Valley by Destination Analysts, Inc. Table of Contents SECTION 1 Introduction 2 SECTION
Westover Metropolitan Airport Master Plan Update
 Westover Metropolitan Airport Master Plan Update June 2008 INTRODUCTION Westover Metropolitan Airport (CEF) comprises the civilian portion of a joint-use facility located in Chicopee, Massachusetts. The
The forecasts evaluated in this appendix are prepared for based aircraft, general aviation, military and overall activity.
 Chapter 3: Forecast Introduction Forecasting provides an airport with a general idea of the magnitude of growth, as well as fluctuations in activity anticipated, over a 20-year forecast period. Forecasting
Airport Planning Area
 PLANNING AREA POLICIES l AIRPORT Airport Planning Area LOCATION AND CONTEXT The Airport Planning Area ( Airport area ) is a key part of Boise s economy and transportation network; it features a multi-purpose
This quarterly brochure is compiled by the New York Metropolitan Transportation Council. Data Monitoring and Analysis Unit
 Travel Patterns in the New York Metropolitan Area for 2017 s Second Quarter provides an overview of regional travel patterns. On an average weekday in the Second Quarter, there were 10,326,385 total bus,
Methodology and coverage of the survey. Background
 Methodology and coverage of the survey Background The International Passenger Survey (IPS) is a large multi-purpose survey that collects information from passengers as they enter or leave the United Kingdom.
QUALITY OF SERVICE INDEX Advanced
 QUALITY OF SERVICE INDEX Advanced Presented by: D. Austin Horowitz ICF SH&E Technical Specialist 2014 Air Service Data Seminar January 26-28, 2014 0 Workshop Agenda Introduction QSI/CSI Overview QSI Uses
NAPA VALLEY VISITOR INDUSTRY 2016 Economic Impact Report
 NAPA VALLEY VISITOR INDUSTRY 2016 Economic Impact Report Research prepared for Visit Napa Valley by Destination Analysts, Inc. Table of Contents S E C T I O N 1 Introduction 2 S E C T I O N 2 Executive
Central Coast Origin-Destination Survey
 Central Coast Origin-Destination Survey July 2016 Central Coast Origin-Destination Survey Prepared for: Santa Barbara County Association of Governments San Luis Obispo Council of Governments Ventura County
NAPA VALLEY VISITOR INDUSTRY 2014 Economic Impact Report
 NAPA VALLEY VISITOR INDUSTRY 2014 Economic Impact Report Research prepared for Visit Napa Valley by Destination Analysts, Inc. Table of Contents SECTION 1 Introduction 2 SECTION 2 Executive Summary 5 SECTION
3. Aviation Activity Forecasts
 3. Aviation Activity Forecasts This section presents forecasts of aviation activity for the Airport through 2029. Forecasts were developed for enplaned passengers, air carrier and regional/commuter airline
Federal Subsidies to Passenger Transportation December 2004
 U.S. Department of Transportation Bureau of Transportation Statistics Federal Subsidies to Passenger Transportation December 2004 Federal Subsidies to Passenger Transportation Executive Summary Recent
Forecast and Overview
 Forecast and Overview DENVER INTERNATIONAL AIRPORT Overall goals of the (MPR): Work with DEN to refine the preferred airport development plan to guide the development over an approximate 25-year planning
Potomac River Commuter Ferry Feasibility Study & RPE Results
 1.1 Introduction The Prince William County Department of Transportation conducted a route proving exercise (RPE) and feasibility study of a proposed commuter ferry service on the Potomac River between
APPENDIX D MSP Airfield Simulation Analysis
 APPENDIX D MSP Airfield Simulation Analysis This page is left intentionally blank. MSP Airfield Simulation Analysis Technical Report Prepared by: HNTB November 2011 2020 Improvements Environmental Assessment/
Peer Performance Measurement February 2019 Prepared by the Division of Planning & Market Development
 2017 Regional Peer Review Peer Performance Measurement February 2019 Prepared by the Division of Planning & Market Development CONTENTS EXECUTIVE SUMMARY... 3 SNAPSHOT... 5 PEER SELECTION... 6 NOTES/METHODOLOGY...
11 December Inverness Airport Outline Business Case
 11 December 2015 Outline of Presentation Overview of the Demand Forecasting Timetabling Assumptions Calibration of the Demand Profiles Demand Forecasts Summary of the Benefits Page 2 Overview of the Demand
Chapter 4. Ridecheck and Passenger Survey
 Chapter 4. Ridecheck and Passenger Survey YOLOBUS operates a mix of local, intercity, commute and rural routes. Because there are limited roadways that intercity and rural routes can operate on, stop by
Predictive Economic Impact Study for the Mount Dora to Seminole Wekiva Trail
 Predictive Economic Impact Study for the Mount Dora to Seminole Wekiva Trail Prepared By: Valerie Seidel vseidel@balmoralgroup.us 341 N. Maitland Ave., Suite 100 Maitland, FL 32751 Phone (407) 629-2185
Lake Erie Commerce Center Traffic Analysis
 LOCATION: East of NYS Route 5 at Bayview Road Town of Hamburg Erie County, New York PREPARED BY: Wendel Companies 140 John James Audubon Parkway Suite 200 Amherst, New York 14228 January 2012 i ii Table
APPENDIX E AVIATION ACTIVITY FORECASTS
 APPENDIX E AVIATION ACTIVITY FORECASTS E.1 PURPOSE AND CONTEXT This appendix presents the St. George Airport (SGU) aviation activity forecasts for the period of 2003 through 2020. Among the components
MODAIR: Measure and development of intermodality at AIRport. INO WORKSHOP EEC, December 6 h 2005
 MODAIR: Measure and development of intermodality at AIRport INO WORKSHOP EEC, December 6 h 2005 What is intermodality? The use of different and coordinated modes of transports for one trip High Speed train
The Economic Impact of Tourism on the District of Thanet 2011
 The Economic Impact of Tourism on the District of Thanet 2011 Prepared by: Tourism South East Research Unit 40 Chamberlayne Road Eastleigh Hampshire SO50 5JH CONTENTS 1. Summary of Results 1 2. Table of
CONGESTION MONITORING THE NEW ZEALAND EXPERIENCE. By Mike Curran, Manager Strategic Policy, Transit New Zealand
 CONGESTION MONITORING THE NEW ZEALAND EXPERIENCE 26 th Australasian Transport Research Forum Wellington New Zealand 1-3 October 2003 By, Manager Strategic Policy, Transit New Zealand Abstract New Zealand
DRAFT Service Implementation Plan
 2017 Service Implementation Plan October 2016 SECTION NAME 2017 Service Implementation Plan October 2016 2017 SERVICE IMPLEMENTATION PLAN TABLE OF CONTENTS Table of Contents... I List of Tables... III
Runway Length Analysis Prescott Municipal Airport
 APPENDIX 2 Runway Length Analysis Prescott Municipal Airport May 11, 2009 Version 2 (draft) Table of Contents Introduction... 1-1 Section 1 Purpose & Need... 1-2 Section 2 Design Standards...1-3 Section
Other Ways to Get Here Getting Around New York City
 Getting Here For those traveling by air, the City is served by seven area airports. Of these, three are major hubs: John F. Kennedy International Airport (JFK) and LaGuardia Airport (LGA) are both in Queens,
MEASURING ACCESSIBILITY TO PASSENGER FLIGHTS IN EUROPE: TOWARDS HARMONISED INDICATORS AT THE REGIONAL LEVEL. Regional Focus.
 Regional Focus A series of short papers on regional research and indicators produced by the Directorate-General for Regional and Urban Policy 01/2013 SEPTEMBER 2013 MEASURING ACCESSIBILITY TO PASSENGER
CURRENT SHORT-RANGE TRANSIT PLANNING PRACTICE. 1. SRTP -- Definition & Introduction 2. Measures and Standards
 CURRENT SHORT-RANGE TRANSIT PLANNING PRACTICE Outline 1. SRTP -- Definition & Introduction 2. Measures and Standards 3. Current Practice in SRTP & Critique 1 Public Transport Planning A. Long Range (>
Corridor Analysis. Corridor Objectives and Strategies Express Local Limited Stop Overlay on Local Service 1 Deadhead
 Corridor Analysis Outline Corridor Objectives and Strategies Express Local Limited Stop Overlay on Local Service 1 Deadhead 1 Stacey Schwarcz, "Service Design for Heavy Demand Corridors: Limited-Stop Bus
Borders Railway: What is the impact two years on?
 STAR 2018 Borders Railway: What is the impact two years on? Rachel Thomas, Peter Brett Associates, Scott Leitham, Peter Brett Associates, and Rebecca Rossi, Transport Scotland 1 INTRODUCTION The Borders
San Francisco Municipal Transportation Agency (SFMTA) Travel Decision Survey 2012
 Travel Decision Survey 2012") Note: The weighting used in this report is not consistent with Travel Decision Surveys (TDS) 2013 and 2014, and findings from this report should not be compared with findings from TDS 2013 and TDS 2014.
Note: The weighting used in this report is not consistent with Travel Decision Surveys (TDS) 2013 and 2014, and findings from this report should not be compared with findings from TDS 2013 and TDS 2014.
FORECASTING FUTURE ACTIVITY
 EXECUTIVE SUMMARY The Eagle County Regional Airport (EGE) is known as a gateway into the heart of the Colorado Rocky Mountains, providing access to some of the nation s top ski resort towns (Vail, Beaver
Mount Pleasant (42, 43) and Connecticut Avenue (L1, L2) Lines Service Evaluation Study Open House Welcome! wmata.com/bus
 and Connecticut Avenue (L1, L2) Lines Service Evaluation Study Open House Welcome! wmata.com/bus") Mount Pleasant (42, 43) and Connecticut Avenue (L1, L2) Lines Service Evaluation Study Open House Welcome! Study Overview and Timeline Phase 1: Collect and Analyze Data Project Kickoff, September 2017
Mount Pleasant (42, 43) and Connecticut Avenue (L1, L2) Lines Service Evaluation Study Open House Welcome! Study Overview and Timeline Phase 1: Collect and Analyze Data Project Kickoff, September 2017
12, 14 and 16 York Street - Amendments to Section 16 Agreement and Road Closure Authorization
 REPORT FOR ACTION 12, 14 and 16 York Street - Amendments to Section 16 Agreement and Road Closure Authorization Date: April 27, 2018 To: Toronto and East York Community Council From: Senior Strategic Director,
FINEST LINK WP2 Appendix 2. Passenger volume estimation
 FINEST LINK WP2 Appendix 2. Passenger volume estimation Content Objectives and approach 3 9 Present situation 10 14 Preliminary train operating concept and land use projections 15 17 Trip type analysis
PUBLIC TRANSIT IN KENOSHA, RACINE, AND MILWAUKEE COUNTIES
 PUBLIC TRANSIT IN KENOSHA, RACINE, AND MILWAUKEE COUNTIES #118404v1 Regional Transit Authority June 19, 2006 1 Presentation Overview Existing Public Transit Transit System Peer Comparison Recent Transit
- Online Travel Agent Focus -
 North American Online Travel Report 2009 - Online Travel Agent Focus - EyeforTravel Research 7-9 Fashion Street London E1 6PX UK For queries contact: amy@eyefortravel.com www.eyefortravelresearch.com EyeforTravel
Evaluation of Predictability as a Performance Measure
 Evaluation of Predictability as a Performance Measure Presented by: Mark Hansen, UC Berkeley Global Challenges Workshop February 12, 2015 With Assistance From: John Gulding, FAA Lu Hao, Lei Kang, Yi Liu,
North American Online Travel Report
 North American Online Travel Report 2009 - Hotel Focus - EyeforTravel Research 7-9 Fashion Street London E1 6PX UK For queries contact: amy@eyefortravel.com www.eyefortravelresearch.com EyeforTravel Ltd,
TRANSPORTATION RESEARCH BOARD. Passenger Value of Time, BCA, and Airport Capital Investment Decisions. Thursday, September 13, :00-3:30 PM ET
 TRANSPORTATION RESEARCH BOARD Passenger Value of Time, BCA, and Airport Capital Investment Decisions Thursday, September 13, 2018 2:00-3:30 PM ET Purpose Discuss research from the Airport Cooperative Research
CHAPTER 4: ALTERNATIVES
 MSP Long Term Comprehensive Plan Update Metropolitan Airports Commission 4.1 INTRODUCTION CHAPTER 4: ALTERNATIVES Several alternatives were developed and evaluated based on their capability to meet the
3 Aviation Demand Forecast
 3 Aviation Demand 17 s of aviation demand were prepared in support of the Master Plan for Harrisburg International Airport (the Airport or HIA), including forecasts of enplaned passengers, air cargo, based
Travel Decision Survey Summary Report. San Francisco Municipal Transportation Agency (SFMTA)
") Note: The weighting used in this report is not consistent with Travel Decision Surveys (TDS) 2013 and 2014, and findings from this report should not be compared with findings from TDS 2013 and TDS 2014.
Note: The weighting used in this report is not consistent with Travel Decision Surveys (TDS) 2013 and 2014, and findings from this report should not be compared with findings from TDS 2013 and TDS 2014.
Estimates of the Economic Importance of Tourism
 Estimates of the Economic Importance of Tourism 2008-2013 Coverage: UK Date: 03 December 2014 Geographical Area: UK Theme: People and Places Theme: Economy Theme: Travel and Transport Key Points This article
The presentation was approximately 25 minutes The presentation is part of Working Group Meeting 3
 This is the presentation for the third Master Plan Update Working Group Meeting being conducted for the Ted Stevens Anchorage International Airport Master Plan Update. It was given on Thursday March 7
The Economic Impact of Tourism Brighton & Hove Prepared by: Tourism South East Research Unit 40 Chamberlayne Road Eastleigh Hampshire SO50 5JH
 The Economic Impact of Tourism Brighton & Hove 2014 Prepared by: Tourism South East Research Unit 40 Chamberlayne Road Eastleigh Hampshire SO50 5JH CONTENTS 1. Summary of Results 1 1.1 Introduction 1 1.2
Date: 11/6/15. Total Passengers
 Total San Diego Metropolitan Transit System POLICY 42 PERFORMANCE MONITORING REPORT Page 1 of 6 OBJECTIVE Develop a Customer-Focused and Competitive System The following measures of productivity and service
MONTEREY COUNTY TRAVEL IMPACTS P
 MONTEREY COUNTY TRAVEL IMPACTS 1992-2015P April 2016 Prepared for the Monterey County Convention and Visitors Bureau MONTEREY COUNTY TRAVEL IMPACTS, 1992-2015P Prepared for the Monterey County Convention
Existing Services, Ridership, and Standards Report. June 2018
 Existing Services, Ridership, and Standards Report June 2018 Prepared for: Prepared by: Contents Overview of Existing Conditions... 1 Fixed Route Service... 1 Mobility Bus... 34 Market Analysis... 41 Identification/Description
Title VI Service Equity Analysis
 Pierce Transit Title VI Service Equity Analysis Pursuant to FTA Circular 4702.1B NE Tacoma Service May 2016 Pierce Transit Transit Development Dept. PIERCE TRANSIT TITLE VI SERVICE EQUITY ANALYSIS TABLE
AVSP 7 Summer Section 1: Executive Summary
 AVSP 7 Summer 2016 Section 1: Executive Summary Introduction AVSP Overview The Alaska Visitor Statistics Program (AVSP) is a statewide visitor study periodically commissioned by the Alaska Department of
DEMOGRAPHICS AND EXISTING SERVICE
 EXECUTIVE SUMMARY The Central Corridor light-rail transit (LRT) project will open in 2014 and operate between downtown Minneapolis and downtown St. Paul, serving the University of Minnesota and University
Airport Profile Pensacola International
 Airport Profile Pensacola International 2015 BY THE NUMBERS Enplanements 808,170 Airport Pensacola International Airport (PNS) is located approximately three nautical miles northeast of the central business
JUNEAU BUSINESS VISITOR SATISFACTION SURVEY RESULTS
 2018 JUNEAU BUSINESS VISITOR SATISFACTION SURVEY RESULTS Completed by the Juneau Economic Development Council in partnership with the Alaska Committee. JEDC research efforts are supported by core funding
For far too long, the transit needs of Brooklynites have gone unanswered. 152 of 170 BK subway stations are NOT wheelchair accessible
 For far too long, the transit needs of Brooklynites have gone unanswered. I am 77 years old and need more accessible subways, particularly at the cultural center of Brooklyn, the Brooklyn Museum, which
Produced by: Destination Research Sergi Jarques, Director
 Produced by: Destination Research Sergi Jarques, Director Economic Impact of Tourism Epping Forest - 2014 Economic Impact of Tourism Headline Figures Epping Forest - 2014 Total number of trips (day & staying)
The Economic Impact of Tourism Eastbourne Prepared by: Tourism South East Research Unit 40 Chamberlayne Road Eastleigh Hampshire SO50 5JH
 The Economic Impact of Tourism Eastbourne 2016 Prepared by: Tourism South East Research Unit 40 Chamberlayne Road Eastleigh Hampshire SO50 5JH CONTENTS Page 1. Summary of Results 1 1.1 Introduction 1 1.2