Bay to Tahoe Basin Recreation and Tourism Travel Impact Study
|
|
|
- Merry Strickland
- 5 years ago
- Views:
Transcription


1 Bay to Tahoe Basin Recreation and Tourism Travel Impact Study October 2014
2
3 BAY TO TAHOE BASIN RECREATION AND TOURISM TRAVEL IMPACT STUDY El Dorado County Transportation Commission The purpose of this Study was to: evaluate the impacts of regional tourism travel on the highway system within the Study Area, evaluate the existing and future tourism market, associated impacts and needs based upon existing conditions, and to provide an evaluation of existing transportation funding sources and programs and likely future funding opportunities. October 2014
4 TABLE OF CONTENTS Introduction...1 Study Overview and Purpose... 3 Tourism Overview... 4 Project Partners... 5 Study Development and Content... 6 Executive Summary... ES-1 1 Existing Conditions State Route United States Highway Interstate State Route Other State Highways within the Study Area Public Opinion and Research Study Research Methodology Opinion Polling Implementation Based on Outcomes of the Public Opinion and Research Study Traffic Data Collection Bluetooth Data Collection Technology Overview Bluetooth Sensor Deployment Bluetooth Tourist and Commuter Data Analysis Speed Analysis Peak and Non-Peak Tourism and Commuter Traffic Tourism Market Study Tourism Activities Geographical Areas Evaluated In the Tourism Market Study Tourism Trends Assessment of Tourism Performance Implementation of Tourism Market Study findings Recommendations to Improve the Traveler Experience Background - Recommendations to Improve the Traveler Experience Specific Recommendations Consistency in Planning Efforts Recommendations for Coordinated Regional and Interregional Planning Funding Analysis and Creating a Path Forward Report on California s Updated Vision for Transportation Infrastructure Priorities A Time of Transition but Opportunities to Move Forward Update on New Funding Sources Implementation of Funding Strategies October 2014 i
5 6.5 Background Performance Measures Recommended Performance Measures Guiding Principles and Strategies Consistency with California s ATP and Federal MAP Acknowledgments LIST OF TABLES Table 1-1: SR 49 Existing and Future LOS Table 1-2: US 50 Existing and Future LOS Table 1-3: Interstate 80 Existing and Future LOS Table 1-4: SR 89 Existing and Future LOS Table 2-1: Items That Respondents Indicated Are Important To Improve Upon Table 3-1: Bluetooth Sensor Locations Table 3-2: Zone Assignments For Bluetooth Stations Table 5-1: Overarching Themes Of Affected Agency Transportation Planning Documents Table 7-1: Performance Measures Table 7-2: Summary Of Recommendations LIST OF FIGURES Figure 1 Project Study Area Map... 2 Figure 1-1 Major Highways Figure 2-1 User Survey Percentage of Respondents That Have Visited Tahoe Figure 2-2 Percentage of Respondents Indicating Route Used to Travel to the Tahoe Area Figure 2-3 Percentage Of Respondents Indicating Travel Time Of Year Figure 2-4 Percentage Of Respondents Indicated Number Of Times Per Year Travelled Figure 2-5 Route Use By Season Figure 2-6 Percentage Of Respondents That Stop In The Communities Surrounding The Tahoe Basin Figure 2-7 Likelihood Of Using Public Transit Figure 3-1 Sensor Locations Figure 3-2 Station Zones Figure 3-3 Percentage Commuters and Tourists Location 1 (Enterprise Blvd/I-80, West Sacramento) Figure 3-4 Percentage Commuters and Tourists Location 8 (Interstate 80/State Route 49) Figure 3-5 Percentage Commuter and Tourist Location 10 (Schnell School Road/US 50) Figure 3-6 Percentage Commuter and Tourist Location 16 (State Route 89 Tahoe City) Figure 3-7 Percentage Commuters and Tourists Location 19 (US 50 Near Stateline) Figure 4-1 Total Annual Travel Expenditures* Figure 4-2 Summary Of TOT Collections By County Appendix A Opinion Polling Script Appendix B Opinion Polling Data Table (electronic) Appendix C Market Study (electronic) Appendix D Bluetooth Daily Traffic Figures October 2014 ii
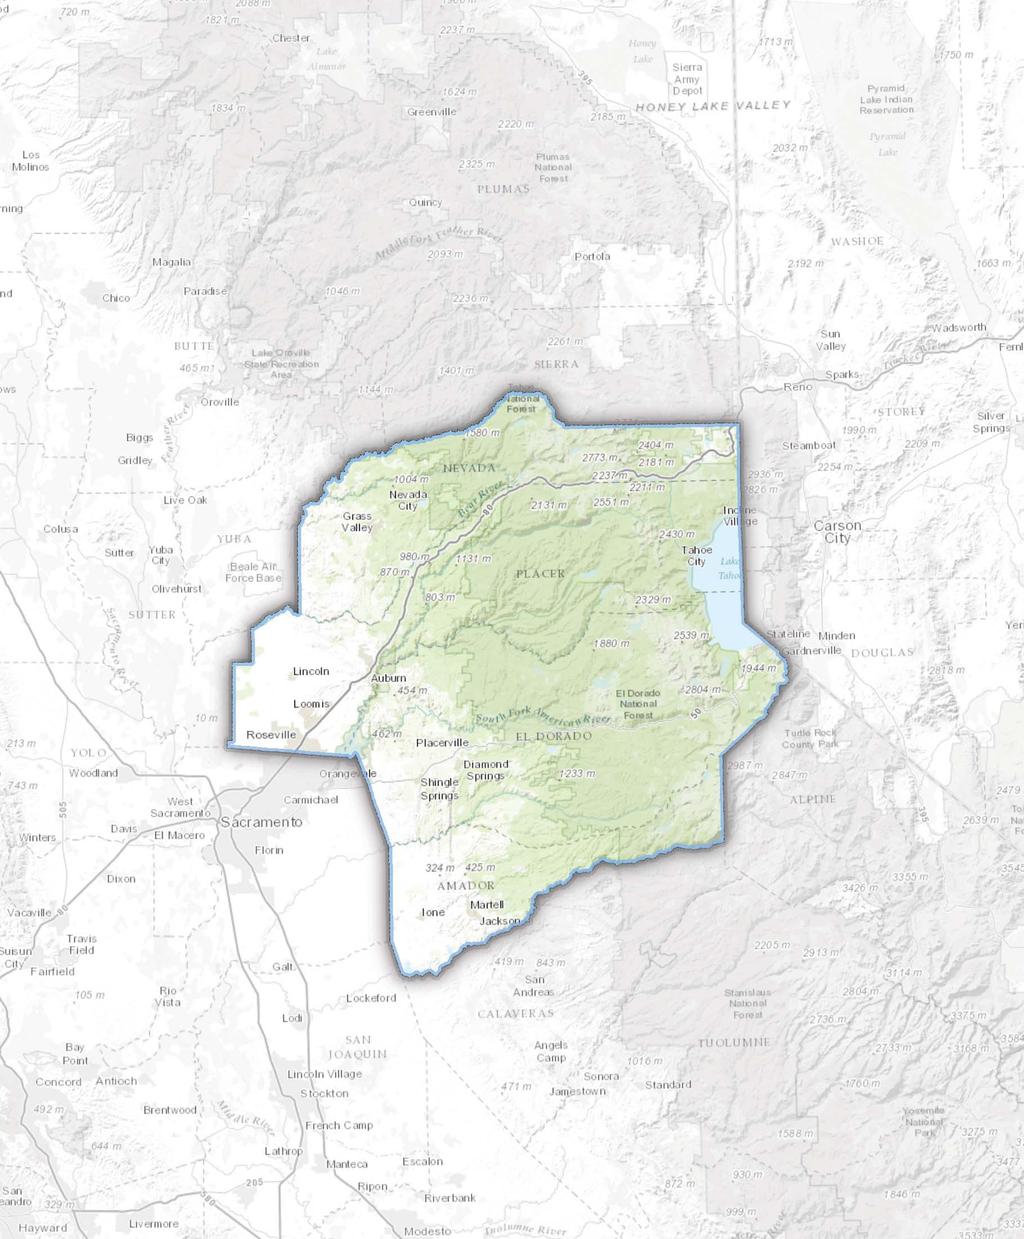
6 INTRODUCTION The Bay to Tahoe Basin Recreation and is a project funded by a California Department of Transportation (Caltrans) Partnership Planning Grant. A fundamental purpose of this partnership initiative was to examine the relationship of major Northern California urban areas and the rural areas of El Dorado, Placer, Amador, and Nevada counties and the bi-state Lake Tahoe Basin as defined by tourism travel. This study evaluates the impacts of regional and interregional tourism traffic on the rural state highway system in the Study Area, including US Highway 50 (US 50), Interstate 80 (I-80), and SR 20, SR 49, SR 88, SR 89, SR 193, and SR 267. Figure 1 is a map of the Study Area. The region defined by the Study Area is one of California s most iconic travel destinations. It is part of two of California s twelve State tourism regions, Gold Country and High Sierra, actively marketed by the California Travel and Tourism Commission and its private sector partners through the VisitCalifornia program and VisitCalifornia.com. According to a May 2014 report prepared by Dean Runyan Associates for the Tourism Commission and the Governor s Office of Business Development (GO-Biz), total direct travel spending in California was $109.6 billion in 2013 (preliminary). The Runyan report documents: Travel and tourism is one of the most important export oriented industries in California (ranks number two behind Micro-Electronics and ahead of Agriculture & Food Products). Spending by visitors generates sales in lodging, food services, recreation, transportation and retail businesses the travel industry. These sales support jobs for California residents and contribute tax revenue to local and state governments. Travel is especially important in the non-metropolitan areas of the state, where manufacturing and traded services are less prevalent. Although most travel spending and related economic impacts occur within California s primary metropolitan areas, the travel industry is important throughout California. In general, the counties with less total employment have a bigger share of travel-generated employment. In addition to tourism, the Study Area has a significant percentage of second or vacation homes. This is particularly true surrounding Lake Tahoe. The Tahoe Regional Housing Needs Program Report (February 2014) indicates that only about 45 percent of the region s housing stock is occupied by permanent renter or owner households. Most of the remainder is utilized as second homes or vacation rentals. Residents of the greater San Francisco Bay Area and the Sacramento metropolitan area own many of these properties. Second and vacation homeowners generate a share of the tourism and travel impacts documented in this study. The Importance of Transportation to Regional Connectivity, Tourism, and Commerce A transportation network functions properly when it successfully supports vital social and economic connections between and within regions. This is particularly true when a region s economy is dependent on travel and tourism. Simply stated, if travelers and tourists cannot easily reach a tourism destination, they are much less likely to go the first time or be a repeat consumer. It is clear that transportation policies and investments significantly impact the accessibility and the number and type of destinations available to tourists, and the overall health of a region s tourism and associated economy. More succinctly stated, the success of a specific tourism market is largely tied to its supporting transportation infrastructure. October
7 B u t t e 49 S i e r r a W a s h o e Reno Bay to Basin Recreation and Tourism Rural Roadway Impact Study Project Study Area Map Map Feature Key (May 2014) N e v a d a S t o r e y L y o n Project Study Area S u t t e r C o l u s a Y u b a P l a c e r Lake Tahoe Carson City C a r s o n C i t y 50 Toiyabe National Forest 395 D o u g l a s Y o l o Roseville E l D o r a d o Woodland Citrus Heights Folsom Eldorado National Forest Davis Arden-Arcade Sacramento Rancho Cordova A l p i n e S o l a n o S a c r a m e n t o Elk Grove S a n J o a q u i n J:\Jobs\ EDCTC-Bay-to-Tahoe_RdwyImpactStudy\GIS\Tasks\Report_Figures\Figure_1_ _V1.mxd 08/22/ :34:44 AM stan A m a d o r 49 C a l a v e r a s Stanislaus National Forest 108 T u o l u m n e 1 inch = 50,000 feet Miles Figure 1

8 Transportation systems in areas defined as rural are more likely than their urban counterparts to experience congestion and other negative impacts associated with tourism. Those responsible for rural transportation systems typically operate and maintain a disproportionate number of lane miles in relationship to their resident population. Most transportation funding is allocated based on a formula which takes into account the number of lane miles and the permanent resident population. That puts rural transportation jurisdictions at a distinct disadvantage when they must also serve significant tourism traffic. Current funding policies do not address the demands of tourism for adequate transportation infrastructure. Absent such policies, California s vital tourism industry is severely impaired, particularly in rural regions that are home to many of the state s natural attractions. For the purposes of receiving state and federal transportation funding, Nevada and Amador counties, and portions of El Dorado and Placer Counties, are defined as rural counties. Transportation is funded through a myriad of different sources and programs. For most of these, funding is allocated based on resident population and the number of lane miles within a given jurisdiction. The Lake Tahoe Basin is defined as a Metropolitan Area for planning purposes (Tahoe Metropolitan Planning Organization - TMPO) but, under current federal and state law, Tahoe is defined as rural when it comes to funding for transportation infrastructure and transit services. STUDY OVERVIEW AND PURPOSE The Caltrans planning grant was awarded to the El Dorado County Transportation Commission (EDCTC) in August of Immediately, Commission staff proceeded to organize a Project Advisory Committee (PAC) from among the project partners. The PAC s purpose was to provide input, guidance, information, and offer local knowledge of the study area. With PAC input, EDCTC prepared and released a Request for Proposals (RFP) consistent with applicable requirements. A robust multidisciplinary team was selected to undertake the various project tasks. There are several components to the Project Purpose: 1) Evaluate the impacts of regional and interregional tourism travel on the rural state highway system within the Study Area; 2) document existing conditions; 3) evaluate the region s tourism market based on existing conditions and emerging trends; 4) prepare a review of existing transportation funding and potential new sources; and develop recommendations for implementation. Specific tasks included traffic data collection, an extensive public opinion and research study, a tourism market study, the identification of tourism impacts and recommended improvements, the development of Performance Measures, and guiding principles for a multi-sector, cross-regional approach to implementation. October

9 The project was launched in the spring of Most of the data was collected during the summer and fall of that year. Analysis and reports followed in late 2013 and early Those involved in this study worked diligently to accurately quantify the proportion of daily traffic associated with tourism and recreation use, the impacts of this traffic, and the transportation needs of the tourists and perspectives of the traveling public. These efforts established a technical foundation to support the development of reasonable short and long-term funding and implementation strategies. Most importantly, Study recommendations call for transportation policy makers to address the needs of transient tourist and recreation users in addition to the needs of the region s resident population. Specifically in the Study Area, outcomes underscore the importance of understanding the interactions between urban and rural areas to the state s tourism industry, overall economy, resource management, and environmental challenges of the twenty-first century. TOURISM OVERVIEW Transportation is an essential part of any tourism market. Without adequate transportation infrastructure, tourism would not be possible. For decades, the tourism and travel industry has been a major contributor to California s economy and the economic vitality of communities within the Study Area. It has created jobs and supported families. It is the major industry in many locations, including South Lake Tahoe, Placerville and the Apple Hill area of El Dorado County, and the greater North Lake Tahoe area of eastern Placer County. Amador and Nevada counties each have significant tourism and travel attractions. The Town of Truckee in eastern Nevada, north of Lake Tahoe, is another center of tourism attractions and gateway to the High Sierra. Transportation infrastructure in the Study Area also provides interregional connectivity between nationally significant recreation resources and second home/vacation home opportunities for those who live in the urban population centers of the Bay Area and Sacramento. Prior to this study, the impacts of tourism on the region s transportation infrastructure were primarily anecdotal and not widely understood. Historically, highway corridors in the Study Area have been analyzed, planned and funded based on resident population and lane miles. One exception has been I-80 where some planning and improvements have been designed to address heavy interstate truck traffic and commerce. However, the needs of tourism and general travel are still not adequately addressed on I-80, nor on the adjacent Donner Route rail corridor. As an example, in Chapter 1, Existing Conditions, the study reports that, without improvements, four of six segments of I-80 between the SR 49 intersection in Auburn and the Nevada County/Sierra County line are projected to operate at Level of Service (LOS) F by the year The study identifies new tourism opportunities as well as projections for growth based on attractions, demand, and emerging trends. However, it also demonstrates that the future of tourism and travel in the Study Area must be based on innovative solutions and broader partnerships that combine to improve the region s existing transportation infrastructure. October
10 PROJECT PARTNERS EDCTC is the designated Regional Transportation Planning Agency (RTPA) for El Dorado County and responsible for coordinating regional transportation planning within the County, outside of the Tahoe Basin, where the Tahoe Regional Planning Agency (TRPA) is the designated RTPA. Although EDCTC was the sponsor and lead agency, Commission management and its board of directors determined early on that the best approach would be a regional collaboration with other stakeholders in the Study Area. To support this approach, EDCTC formed a PAC, with the following tasks: Identify expectations for the project to ensure the final product and execution met the needs of all partners. Develop informed performance measures for the project that could serve as a platform for future funding opportunities. Provide advice on transportation related issues such as use, access, mobility, and operations and maintenance. Assist with the development of the scope of work for traffic data collection and telephone survey work. Review technical information and provide input. Review and provide input on the final Study Report. Suggest approaches for addressing funding deficiencies. Suggest approaches for disseminating the completed study and recommendations to decision makers. Members of the PAC represented counties, transportation agencies and public agencies at the federal and regional levels, as well as other active partners, including tourism agencies, business, and resource organizations. Specifically, PAC members were drawn from the following: Amador County Amador Council of Tourism Amador County Transportation Commission California Department of Transportation, District 3 El Dorado County El Dorado County Visitors Authority El Dorado County Transportation Commission Lake Tahoe Visitors Authority Nevada County Economic Resource Council Nevada County Transportation Commission Truckee North Tahoe Transportation Management Association Placer County Placer County Transportation Planning Agency Placer Valley Tourism Sacramento Area Council of Governments South Shore Transportation Management Association Tahoe Transportation District Tahoe Regional Planning Agency US Forest Service October
11 STUDY DEVELOPMENT AND CONTENT At the outset, EDCTC and its project partners recognized that to fully understand the impact of tourism on the Study Area transportation network, it would be necessary to learn more about the origination and destination of tourists, how they typically access their destinations (routes of travel), and solicit their perspectives on the existing system and desired improvements. This information would help guide to the development recommendations and implementation strategies. Accordingly, the following independent research was undertaken: Public Opinion and Research Study ESI, Inc. and The Cromer Group conducted this research. There were two phases. Phase I consisted of user surveys. These were automated phone calls placed in the three metropolitan areas identified as study targets: San Francisco, San Jose and Sacramento. The primary goal of the user survey was to identify specific households in these three population centers who had visited the Study Area and understand their travel patterns. During June 2013, 30,000 automated calls were made - 10,000 in each of the three metropolitan areas. In total, 2,538 people responded to these survey calls. Through Phase 1, researchers were able to identify the extent of the population base in each of the three geographical areas that had visited the Study Area. Phase II involved 905 in-depth interviews of survey respondents who confirmed they had visited the Study Area. To develop questions that were asked during the interview, PAC members were asked to provide input. The complete survey script is in Appendix A. More background and detail about the Public Opinion and Research component of this Study, including findings and recommendations, is in Chapter 2. Traffic Data Collection The collection and analysis of traffic data is crucial when making decisions about a variety of transportation considerations. These include the identification of impacts and mitigation measures, roadway planning, design and engineering, maintenance and operations, and, in some cases, the allocation of funding. Accordingly, an important component of the Bay to Tahoe Basin Study was an evaluation of the existing traffic on major highways within the Study Area. Caltrans and local jurisdictions provided this data. To better understand the impact of tourism on major highways within the Study Area, the project team looked at methods for determining what portion of existing traffic was associated with tourism travel. The use of Bluetooth sensor technology and BluFax traffic surveillance equipment was identified as the most cost-effective approach. Bluetooth sensor technology allowed for remote sensing of data through the deployment of a network of Bluetooth sensors throughout the Study Area. More information about the process of traffic data collection, an overview of Bluetooth data collection technology, data analysis, and recommendations, is provided in Chapter 3. Tourism Market Study Tourism is not a static industry. The Project Team and PAC wanted to understand existing tourism and trends to assess transportation system impacts and needs. To this end, a Market Study was commissioned and conducted by Economic and Planning Systems (EPS) in October The Market Study evaluated existing tourism and emerging trends. It included an evaluation of the tourism market October
12 for each county within the Study Area (Amador, El Dorado, Placer and Nevada; also for the Lake Tahoe Basin). Trends confirmed include Adventure Tourism, Agritourism, and Heritage Tourism (also known as cultural or historical tourism). Details from the Tourism Market Study are in Chapter 4. The complete study is included in Appendix C. Following completion of the research, tourism related impacts to the Study Area transportation network were analyzed. The analysis included interviews with owners and operators of roadways within the Study Area, a review of maintenance, operational, and roadway condition reports, and information obtained from the research. At key project milestones, review and unique local knowledge was solicited from members of the PAC. Additional Study Components Chapter 5, Tourism Market Study Chapter 6, Funding Analysis and Creating a Path Forward Chapter 7, Performance Measures This Bay to Tahoe Basin Study Report includes a number of recommendations that highlight the importance of metro-rural relationships and partnerships. Chapter 6, page 6-7, includes the following: It is recommended that a dialogue be opened with officials at SACOG (Sacramento Area Council of Governments) and MTC (Bay Area s Metropolitan Transportation Commission) and presentations be made regarding the findings and recommendations in this Study Report. Clearly, Study Area communities are serving many of the same constituents served by SACOG and MTC. Study authors believe the development of such metro-rural relationships is timely. We encourage interested persons to read the book Megapolitan America, by Arthur C. Nelson, FAICP, and Robert E. Lang, published by the American Planning Association (APA) in 2011, giving particular attention to Chapter 12, about the Sierra Pacific Megapolitan Area. Here are some excerpts from that chapter: The Sierra Pacific megapolitan area is the highly populated agglomeration of metropolitan areas stretching from the Pacific Coast south of San Francisco to Sacramento. In the middle of the Central Valley, to Reno, just east of the Sierra Nevada range (Figure 12-1). Appendix 12.1 lists the counties in the Sierra Pacific megapolitan area. We offer a vignette of this megapolitan area in terms of major demographic and housing trends, employment and development projections, the extent of economic dependency, and attractiveness characteristics. We conclude with an assessment of major planning and development challenges. (Page 135) California s planning rigor is legendary. Although the state ranks 12th on the Nelson-Lang Planning Index, it is at the local government level where planning is rigorous. California s jurisdictions routinely win national planning awards and pioneer new planning ideas. Perhaps the limiting factor in California s planning environment is truly regional-scale planning, let alone planning done at the megapolitan scale. (Page 142) October
13 EXECUTIVE SUMMARY A substantial amount of data was collected and analyzed in the preparation of the Bay to Tahoe Basin Recreation and. This Executive Summary is designed to highlight the major findings and recommendations, by chapter. CHAPTER 1 EXISTING CONDITIONS The Study Area is comprised of four California counties: Amador, El Dorado, Placer, and Nevada. The Lake Tahoe Basin includes the eastern-most portions of El Dorado and Placer counties. Population in the Tahoe Basin also includes residents who live in the western-most sections of Washoe, Carson City, and Douglas counties, Nevada. The U.S. Census Bureau defines rural as all territory, population, and housing units located outside of urbanized areas and urban clusters. Urbanized areas include populations of at least 50,000. Urban clusters include populations of between 2,500 and 50,000. The core areas of both urbanized areas and urban clusters are defined based on a population density of 1,000 per square mile. Certain census tracts adjacent to this density are added that have at least 500 persons per square mile. Counties that have rural and urban areas still have the rural designation even though they have urban centers. With the exception of the western-most portions of El Dorado and Placer Counties, all four counties in the Study Area are defined as rural, characterized by low population density, greater distance between population centers, diversity of land geography, steep grades and mountain passes, dramatic weather events, and challenging road conditions. It is difficult to maintain roads and provide transit services to a small population over such a large area. Rural jurisdictions typically have more lane miles to operate and maintain with more constraints on available funding. The state highway system within the Study Area is located within Caltrans District 3, a district that covers a total of 11 counties. The resources available to Caltrans are also constrained. Chapter 1 reviews existing data and reports for major highway segments within the Study Area and provides, in table form, existing (2012) and projected future LOS. According to the latest Caltrans Transportation Concept Report (TCR), without investment and improvements: State Route 49 7 of 8 segments projected at LOS F by US Highway 50 7 of 10 segments projected at LOS F by Interstate 80 4 of 6 segments projected at LOS F State Route 89 1 of 7 segments projected at LOS F by Existing transit services available on these corridors is summarized. Other State Routes (SR) discussed in Chapter 1 are SR 16, SR 20, SR 28 (North Shore Lake Tahoe), SR 193, and SR 267. CHAPTER 2 PUBLIC OPINION AND RESEARCH STUDY This study was conducted by ESI, Inc. and The Cromer Group to determine the travel habits of tourists who utilize the roadway network within the Study Area. There were two phases. Phase I consisted of user surveys 10,000 automated calls placed in each of the three metropolitan (metro) areas identified October 2014 ES-1
14 as study targets: San Francisco, San Jose and Sacramento. A total of 2,538 people responded. Phase II involved 905 in-depth interviews of survey respondents who confirmed they had visited the Study Area. Additional information regarding the approach taken by these surveys is provided in the Introduction section and in Chapter 2 of this report. Among the findings: 70 percent of San Francisco respondents have visited the Study Area. 69 percent of Sacramento respondents have visited the Study Area. Just less than 62 percent of San Jose respondents have visited the Study Area. Most respondents confirmed they have visited within the last five years. Many respondents indicated they visit two or more times per year. 45 percent of Sacramento respondents indicated they visit two or more times per year. Approximately 30 percent of San Francisco and San Jose respondents indicated they visit two or more times per year. Sacramento respondents indicated they primarily use US 50 to travel to the Study Area. San Jose respondents indicated they primarily use I-80. San Francisco respondents indicated they have a higher likelihood than those from Sacramento or San Jose to use US 50 and I-80 evenly. Respondents indicated that, overall, they travel to the Study Area more during non-winter months. The number of respondents that indicated they travel fairly evenly throughout the year was relatively high for all three metro areas. San Jose was the highest at 28 percent. Data obtained from the user surveys was extrapolated over the entire populations of the three metro areas (using 2010 Census data) to calculate that over 4 million visitors make close to 8 million trips annually to the Study Area. Respondents who utilize I-80 during winter months indicated that I-80 had better road conditions, was an easier drive, had greater availability of services along the route, and had less traffic congestion than US 50. That being said, US 50 had a substantial edge over I-80 as a more scenic drive by a 3:1 margin. Public transportation (transit) use was low amongst all respondents, regardless of what time of year they traveled. October 2014 ES-2
15 Bay To Tahoe Basin Recreation and Only 30 percent of respondents indicated they stop at recreation and tourism locations on route to their final destination. Respondents were asked to identify improvements that would help increase their likelihood of stopping in communities throughout the Study Area. Among the highest percentage of improvements related to transportation were: Improved signage and access to information about recreation opportunities. Better roadways and improved access. More parking and better public transit. Better lighting. Respondents were asked about their familiarity with thirteen activities offered throughout the Study Area: Wine tasting/winery tour Camping Fishing and/or hunting Shopping Participate in agritourism* Casino gaming White water rafting Sightseeing Rock climbing Tour of a historical site Mountain biking or hiking Unique restaurant or culinary experience Gold panning *Agritourism: See definition in Section 4.1 Respondents showed a high awareness (over 70 percent) of many activities, such as: fishing, mountain biking, hiking, camping, shopping, casino gaming, sightseeing, and tours of historical sites. There was a lower awareness (40 percent or more unaware) that the following activities were available: wine tasting and winery tours, agritourism, gold panning, local restaurants and unique culinary experiences. Two activities that respondents rated as top reasons they do or might stop on the way to their destination(s) in the Study Area were: restaurants or a unique culinary experience (53 percent and shopping (52 percent). Public Transit. Respondents were asked whether or not they would use public transit to and from the Lake Study Area (Lake Tahoe region). 7 percent said they already use it. 18 percent said they would use it. 33 percent would give it a try. October 2014 ES-3
16 33 percent would not use it. 2 percent can t say. Bay To Tahoe Basin Recreation and Respondents were asked how they obtain information about activities available in the Study Area. 32 percent word of mouth. 19 percent Internet (website, Trip Advisor, or mobile device/application). Informing Transportation Improvements Recommendation 1 The travel experience for visitors who use I-80 could be improved if there was: Better access to and awareness of Study Area recreation opportunities, including signage. More accessible public transit connecting Study Area communities. Better, more accessible parking. The travel experience for visitors who use US 50 could be improved if there was: Improved condition of the roadway. Better signage, including expanded network of Intelligent Transportation System (ITS) technologies. More awareness of recreational opportunities and other attractions. Improved ingress and egress to Study Area communities. Improved lighting. Construction of at least one Safety Roadside Rest Area at a strategic location between Placerville and South Lake Tahoe. Note: There are two in the Study Area on I-80, but none on US 50. Recommendation 2 To adequately address identified transportation system impacts and the needs quantified in this report, responsible agencies should pursue the modification of transportation funding formulas to include the total number of users (User Population). This number factors in tourism travel, not just travel by the region s relatively small resident population. Recommendation 3 Methods for providing improved traveler information Expanded ITS elements. US 50 is a high priority need and opportunity. Methods for improving awareness of activities and opportunities in the Study Area. Website based marketing (prior to trip). Mobile device applications (once on trip). Recommendation 4 Establish a regionalized Traveler Information website/application. Improve regional high-speed Internet access. October 2014 ES-4
17 CHAPTER 3 TRAFFIC DATA COLLECTION Although the Bluetooth sensors were only deployed for a short period of time (June 26, 2013 to July 12, 2013), the data provides valuable information and insights related to tourism travel and associated impacts within the Study Area. Local traffic is defined as commuter traffic in the analysis and recommendations. Peak and Non-Peak Tourism and Commuter Traffic As determined by the tourist and commuter traffic data analysis, a significant amount of traffic in and around communities within the Study Area can be attributed to tourism. Peak season is represented by data gathered between June 26, 2013 to July 12, 2013, a period that included the 2013 Fourth of July holiday. On average, along US 50 and I-80 approaching the Lake Tahoe Basin, approximately 60 to 70 percent of the vehicle trips were tourist trips, with 30 to 40 percent commuter (Peak Annual Daily Traffic conditions). During non-peak periods, the split is estimated at 60 percent tourist trips and 40 percent commuter (Annual Average Daily Traffic conditions). The following are recommendations based on analysis of the Bluetooth data: Traffic Data Collection Recommendation 1 Develop a User Population. 1) Using a coordinated approach involving all the affected jurisdictions, develop a User Population that reflects the actual population using the transportation network in the Study Area; 2) Pursue modification of transportation funding formulas based on the User Population. Traffic Data Collection Recommendation 2 Support Placement of Tourism Travel Amenities. Use the Bluetooth tourism and commuter traffic data in connection with data from the Opinion and Research Study (traveler perspectives) to inform decisions regarding the location/implementation of tourism travel amenities, such as: Information signage. Safety Roadside Rest Areas/other public restrooms available to travelers. Parking. Access Improvements. Lighting. Traffic Data Collection Recommendation 3 Inform the Dissemination of Travel Information During Peak Tourism Periods. As expected, as tourism travel increases, travel time increases (speed of travel decreases). Information should be disseminated to travelers to inform them of peak travel periods, with encouragement to travel outside of those periods, choose alternate routes, choose alternate activities, and explore new destinations and recreation opportunities, if possible. October 2014 ES-5
18 CHAPTER 4 TOURISM MARKET STUDY Summary of Findings Bay To Tahoe Basin Recreation and The study identified key trends that highlight the existing and anticipated changes in the character and types of tourism in the Study Area. Emerging trends are expected to drive a broader spectrum of visitation, levels of projected growth, and an increase in tourism expenditures. Investing in transportation infrastructure can increase visitor appeal through improved traveler experience, and recreation opportunity awareness. The condition of roadways, flow of traffic, ease of access, availability of public transit, and adequacy of parking all influence visitor appeal. Emerging Trends in the Study Area Summer (non-winter) attractions and activities are an emerging trend throughout the Study Area. This will expand the diversity of non-winter attractions and likely stimulate new or more repeat visitation. Adventure Tourism such as whitewater rafting, cycling, camping, etc., an emerging trend in the Study Area, is one of the fastest growing segments in the tourism industry. Recent estimates indicate there was a 65 percent growth in Adventure Tourism from 2009 to 2012, with the trend continuing upward. Other strong trends in the Study Area are agritourism tourism and heritage tourism found primarily in the Sierra foothills and the American River and tributaries. Definitions and Background Adventure Tourism. Also known as Adventure Travel. According to the Adventure Travel Trade Association, adventure travel may be any tourist activity including two of the following three components: a physical activity (with perceived or possible risk) and potentially requiring some specialized skills, a cultural exchange or interaction, and engagement with nature. Adventure tourism includes activities such as rock climbing, cycling, whitewater rafting/kayaking, fishing, hunting, cultural experiences that include physical activity, and other physical activities. Agritourism. Agritourism is a commercial enterprise at a working farm, winery, ranch, or agricultural facility conducted for the enjoyment or education of visitors. Often agritourism generates the primary or supplemental income for the owner. Agritourism can include farm stands or shops, U-pick, farm stays, tours, on-farm classes, fairs, festivals, pumpkin patches, Christmas tree farms, winery tours and wine tasting, orchard dinners, barn dances, guest ranches, horseback riding, and more. Heritage Tourism. Also known as Historical or Cultural Tourism. Heritage tourism is defined as travel to experience the places, artifacts, and activities that authentically represent the stories and people of the past. Worldwide, heritage tourism is estimated to account for approximately 20 percent of total trips. Travelers classified as cultural and historic tourists tend to travel more frequently, on average 5.01 leisure trips per year, versus 3.98 trips per year for non-heritage tourism travelers. Attractions and activities at the center of all these emerging tourism trends can be found throughout the Study Area. One such example is the site of gold discovery in California, Marshall Gold Discovery October 2014 ES-6
19 State Park in the Coloma/Lotus community. The prospects for growth in each of these tourism sectors are reported as strong. CHAPTER 5 RECOMMENDATIONS TO IMPROVE THE TRAVELER EXPERIENCE Tourism is clearly an important economic driver in the Study Area. It is the primary economic engine in many of the region s communities. Understanding the demands placed on the Study Area transportation network by tourism related travel is an important dimension of assessing and addressing the overall impacts and opportunities for economic sustainability. This chapter presents a series of recommendations that address the demands and opportunities. Intelligent Transportation Systems (ITS) ITS Recommendation 1 Information Gathering. Travelers in urban areas have become increasingly dependent on technologies such as cameras and traffic sensors that collect real-time information and relay that information back to the traveler to help make their travel-related decisions. These include decisions about season to travel, daily travel time, and alternate routes available that may be faster or provide access to alternative activities in specific circumstances. As in urban areas, transportation officials can use this information to inform the traveler, improve the traveler experience, better manage traffic during periods of congestion (reduce congestion), improve the movement of goods and commerce, and reduce environmental impacts. These same technologies should be deployed throughout the Study Area with priorities based on the information and recommendations in this report. ITS Recommendation 2 Information Sharing. Recommendations include installing an expanded network of Changeable Message Signs (CMS), Highway Advisory Radios (HARs), websites and/or a Study Area specific traveler mobile device application and specialized warning systems, such as for weather and road closures. Currently, I-80 has a relatively comprehensive ITS network, but this is not the case for US 50 or the other state routes within the Study Area. Expanding the ITS network can significantly improve the ability to provide real-time traveler information about: traffic congestion, incidents and accidents, road construction, special events (such a cycling events), weather, speed limits on specific road segments, duration of closures or congestion, and travel times. Among other benefits, ITS technologies can provide the traveler with information about travel plan options as well as encourage the exploration of other communities and new experiences in the Study Area while waiting for a better time to reach his/her original intended destination. Improve Parking Opportunities Parking is one of the first experiences people have when traveling to a destination. Convenient, easily located and well-signed parking is considered a sign of welcome. Conversely, parking that is difficult to find, inadequate, or expensive will frustrate users and can contribute to spillover (motorists parking where they should not). Many Study Area project partners have indicated that inadequate parking availability or underutilized large parking lots or structures negatively impact the businesses and tourist attractions in their community. Fifty-seven percent of respondents to the telephone survey (Chapter 2) indicated it was important to improve parking opportunities in the Study Area. October 2014 ES-7
20 Parking Recommendations (PR) Bay To Tahoe Basin Recreation and PR 1. Provide better signage directing visitors to parking. PR 2. Construct small cluster parking lots in and around tourist destinations instead of one large lot, which is typically the more traditional approach. PR 3. Where feasible, incorporate on-street or adjacent parking facilities to better serve small businesses. PR 4. Partner with tourist destination operators to construct parking facilities in and around major tourist attractions and opportunities. PR 5. Consider transit, pedestrian, and bicycle needs and access points when planning new parking facilities. Improve Access Tourists not familiar with a destination are less likely to venture off the highway and explore surrounding communities, particularly if the access on and off the highway is perceived to be difficult. Visitors like to know what services, restaurants, and activities are available at specific highway exits and that access back on to the highway will not be difficult. Sixty percent of respondents to the telephone survey indicated that better highway ingress and egress was important to increasing the likelihood they would stop in one of the smaller communities along their route. Access Recommendations (AR) AR-1. Place informational signage regarding the services, amenities, and recreation opportunities provided at specific exits. AR-2. Install wayfinding signage for returning to highway on-ramp. AR-3. Review ramp configuration to determine if modifications are needed to improve access. For example, construction of acceleration and/or deceleration lanes, shoulder widening, safety, and lighting improvements. Lighting Improvements With the low level of ambient light present along roadways in the Study Area, it can be difficult to navigate ingress and egress to the highway and traveling along a darkened highway can be perceived as challenging. While it is important to control light pollution in the rural communities and in and around Lake Tahoe, the strategic placement of lighting can improve the traveler experience. Respondents to the telephone survey, especially those who use US 50 as their primary route, indicated that better lighting would improve the likelihood that they would stop in communities along their route. Lighting Recommendations (LR) LR 1. Ensure all highway exits that lead to traveler services, such as fueling stations, food establishments, restrooms, etc., are safely and adequately lit. October 2014 ES-8
21 LR 2. Consider the use of LED adaptive lighting that would allow for energy savings and the ability to dim the streetlights at certain times of the day. Transit Connectivity and Ease of Access Existing transit services to and within the Study Area and surrounding communities are disconnected, difficult to find, and, overall, not user friendly, particularly for tourists not familiar with the area. Although transit operations are scattered throughout the Study Area, they are not linked in a manner that provides connectivity between communities or ease of access. A destination is, in many respects, defined by its ability to provide appropriate visitor access to a destination or dispersal throughout. The dispersal of visitors in a region can provide economic and social benefits, including: reduced congestion and improved traffic management, reduced air pollution, enhanced traveler experience, and diversified visitor spending. Respondents to the survey indicated there is currently a very low use of transit by tourists. Transit operators in the Study Area have also supported this finding, anecdotally. However, more than half of the survey respondents indicated they would use transit if it was easier to use and more connected. To improve transit connectivity and ease of access, the following actions are recommended: TCR 1. Coordinate transit services on a regional basis to improve connectivity. Identify routes that connect tourist destinations and communities throughout the region, in and outside of the Tahoe Basin. TCR 2. Identify transit routes from major population centers (Bay Area and Sacramento) and connect transit services and routes to tourist destinations. TCR 3. Identify parking opportunities for travelers who wish to drive a vehicle to a tourist destination, park and explore the area using local transit services, walking and biking. TCR 4. Determine transit routes and connections to recreation opportunities. TCR 5. Plan future transit services to accommodate seasonal influx of visitors. Use modified schedules, adaptive transit stops, and allow for fluctuations in the LOS offered to accommodate peak tourism periods. TCR 6. Establish public-private partnerships to provide transit connectivity to privately owned tourism destinations or recreational sites. TCR 7. Consider establishing a cross-jurisdictional transit pass system that is accepted by transit providers throughout the Study Area. Improved Dissemination of Traveler Information Travelers receive information in a variety of ways. They seek information prior to travel and also during travel. Caltrans works with various partners to disseminate road conditions and road construction updates, however, there is not a consistent, coordinated effort among public and private entities throughout the Study Area to disseminate more detailed, real-time traveler information. According to the polling and user survey results, respondents indicated they typically receive information by word of mouth and from the Internet. If a traveler were able to access true real time information designed to improve the traveler experience, it would be more likely that a specific visitor would decide to make a repeat trip to the area or, at minimum, have a better overall travel experience. October 2014 ES-9
22 Traveler Information Recommendations (TIR) Bay To Tahoe Basin Recreation and TIR 1. Develop a mobile device application to provide real time traveler information via the Internet. TIR 2. Work with public and private partners in the Study Area to coordinate the development of a traveler information dissemination strategy. TIR 3. Integrate the traveler dissemination strategy with expanded ITS network in the Study Area. TIR 4. Establish public-private partnerships to assist with managing the flow of traffic. Example: Stagger hotel check in and check out times. Tourism Impact Recommendations (IR) IR 1. As transportation projects are planned and designed, give consideration to incorporating the pertinent recommendations of this Chapter (Chapter 5). IR 2. Utilize User Population as the Study Area s recognized population for purposes of transportation planning and project funding. IR 3. Agencies/jurisdictions responsible for Regional Transportation Plan (RTP) Updates in the Study Area should coordinate efforts to ensure a consistent approach to incorporating recommendations to address tourism travel impacts and economic vitality. IR 4. Regional partnerships are recommended to maximize the potential benefits of action steps recommended in Chapter 6 and the other chapters of this study as appropriate. IR 5. These partnerships should include private sector owners/operators of tourism attractions, facilities, and activities in the Study Area. CHAPTER 6 FUNDING ANALYSIS AND CREATING A PATH FORWARD The recently completed Statewide Transportation System Needs Assessment, prepared at the direction of the California Transportation Commission (CTC), is the most recent (2011) and comprehensive overview of the dire picture that exists for transportation funding. The Assessment projected revenue from all existing funding sources during the ten-year study period (2011 to 2020) to be at $242 billion. This represents about 45 percent of the overall estimated cost of needed transportation projects and programs identified in the Assessment. For all types of transportation needs over the ten-year period, there is an estimated shortfall of about $295.7 billion. This estimate was based on the assumption that revenues for preservation (rehabilitation and maintenance) continue to be provided at historical levels (43.4 percent) and that the amount of revenue available for system expansion and system management projects during this period would be $94.7 billion, or approximately 48 percent of the estimated cost of needed projects. The Study Area certainly needs adequate funding for the rehabilitation and maintenance of roadway, the installation of ITS and other supporting infrastructure, and expanded public transit services. To the extent these are formula based funds, the Study Area formula should be based on total User Population rather than just resident population. This is a central recommendation of this Bay to Tahoe Basin Recreation and. Given the constraints of geography and terrain, it is October 2014 ES-10
23 expected the Study Area will rely less on funding for significant roadway expansion and adopt a fix and enhance it first methodology to improve the region s system. However dire the current outlook for transportation funding picture may be, the Study Area and its State and Federal partners must move forward. The good news is that many of the recommended actions are relatively modest in cost in terms of the funding required. New Program and Funding Opportunities This study looks at the potential applicability of several new funding sources: User Population Funding Formulas for transportation projects and transit services. Cap and Trade Funding for Transportation. California Active Transportation Program (ATP). Local Revenues including public/private partnerships. Implementation of Funding Strategies Although the future of transportation funding is not stable in the long-term and is strained in the shortterm, there are at least modest opportunities to advance the projects and recommendations in this Study. Funding Recommendations F-1. ATP. To the maximum extent possible and practical, it is recommended ATP grant applications be packaged for eligible projects that address tourist impacts and needs and the needs of the local community, sub-region, or region. The Implementation Table in Chapter 7 identifies ATP goals and the applicability to various recommendations in this Study. F-2. Cap and Trade. The adopted California State Budget allocates a share of Cap and Trade funding for sustainable transportation investments. This provides an opportunity to package infrastructure projects that address tourism related congestion and/or reduce Greenhouse Gas (GHG) emissions through operational improvements, transit; complete street programs, and/or ITS projects eligible for this funding. F-3. Cross-Regional Cost-Sharing. Streets and Highways Code Section subdivision (c) provides for a cooperative process for eligible State Transportation Improvement Program (STIP) agencies to pool STIP shares. The research summarized in Chapter 6, Funding Analysis, Recommendation F-3, provides more information regarding this potential opportunity. F-4. Continue Project Readiness Activities. Although not strictly a funding consideration, one important aspect of transportation planning is to ensure agencies have the capacity to plan and develop projects to a state of readiness. This provides opportunity in the event enhanced or new funding sources are made available on a regional or statewide basis. With the suite of traveler improvements identified in this Study, pending approval by appropriate reviewers, a foundation of projects and programs can be identified for prioritization and moving to a state of readiness for available federal, state, regional or local funding sources. This Study provides the data and Performance Measures to support the development of ready projects. October 2014 ES-11
24 CHAPTER 7 PERFORMANCE MEASURES Performance Measures and Guiding Principles Bay To Tahoe Basin Recreation and The authors of this Study believe that success in addressing tourism related impacts to the Study Area s rural transportation network and accommodating likely growth in tourism markets will require a multifaceted, cross-regional implementation effort. Public agencies, government jurisdictions, and private stakeholders will each have an important role to play in the planning and execution of specific projects, programs, and activities. One of the biggest implementation challenges will be the complex nature of the transportation planning process and associated funding programs. The intent of this chapter is to: 1) Outline Performance Measures that should be applied to transportation planning in today s competitive funding environment; and, 2) Identify guiding principles to serve as a foundation for collaborative implementation. Performance Measures It is imperative that transportation agencies and their partners plan, build and operate transportation infrastructure, systems, and services that achieve the important goals of mobility and safety, support a variety of economic, environmental, GHG and air quality, and community needs AND community objectives. That includes the need to address the impacts and needs of significant tourism travel throughout the year. As part of this Study, Performance Measures were developed and presented to the PAC for refinement and adoption. Please refer to Table 7.1 to review the recommended Performance Measures. Guiding Principles A set of guiding principles emerged as this Study was being prepared. They are intended to serve as a framework for implementation. The principles are listed below, with more detail provided in Chapter 7. Develop a Regional Transportation Coalition. Seek and Achieve Consistency with Transportation Planning Documents in the Study Area. Develop a Suite of Projects within Each Jurisdictional Agency. Develop Regional Transit Connectivity. Develop New/Expand Existing Public-Private Partnerships Table 7.2 provides a summary of each of this Study s recommendations and an analysis of the consistency of each with the goals of the ATP and the federal Moving Ahead for Progress in the 21st Century (MAP-21). The applicability of Performance Measures identified in Table 7.1 is also shown. October 2014 ES-12
25 1 EXISTING CONDITIONS The Study Area is comprised of four California counties: Amador, El Dorado, Placer, and Nevada. The Lake Tahoe Basin includes the eastern-most portions of El Dorado and Placer counties. Population in the Tahoe Basin also includes residents who live in the western-most sections of Washoe, Carson City, and Douglas counties, Nevada. The U.S. Census Bureau defines rural as all territory, population, and housing units located outside of urbanized areas and urban clusters. Urbanized areas include populations of at least 50,000. Urban clusters include populations of between 2,500 and 50,000. The core areas of both urbanized areas and urban clusters are defined based on a population density of 1,000 per square mile. Certain census tracts adjacent to this density are added that have at least 500 persons per square mile. 1 Counties that have rural and urban areas still have the rural designation even though they have urban centers. With the exception of the western-most portions of El Dorado and Placer counties, all four counties in the Study Area are defined as rural, characterized by low population density, greater distance between populations centers, diversity of land geography, steep grades and mountain passes, dramatic weather events, and challenging road conditions. It is difficult to maintain roads and provide transit service to a small population over such a large area. Rural jurisdictions typically have more lane miles to operate and maintain with more constraints on available funding. The state highway system within the Study Area is located within Caltrans District 3, a district that covers a total of 11 counties. The resources available to Caltrans are also constrained. This chapter reviews existing data and reports for major highway segments within the Study Area. These highways (transportation corridors) provide primary transportation circulation, accommodating vehicles, including the movement of goods, and in some areas, bicycles, pedestrian, and public transit services. Figure 1-1 provides a map illustrating the major highways within the Study Area. 1 Rural Health Fact Sheet October
26 B u t t e 49 S i e r r a W a s h o e Reno Bay to Basin Recreation and Tourism Rural Roadway Impact Study Major Highways Map Feature Key (May 2014) S u t t e r C o l u s a Y u b a N e v a d a P l a c e r Lake Tahoe Carson City C a r s o n C i t y 50 Toiyabe National Forest D o u g l a s S t o r e y L y o n Study_Highways Project Study Area Y o l o Roseville E l D o r a d o Woodland Citrus Heights Folsom Eldorado National Forest Davis Arden-Arcade Sacramento Rancho Cordova A l p i n e S o l a n o S a c r a m e n t o Elk Grove S a n J o a q u i n J:\Jobs\ EDCTC-Bay-to-Tahoe_RdwyImpactStudy\GIS\Tasks\Report_Figures\Figure_1_1_ _V1.mxd 08/22/ :35:45 AM stan A m a d o r 49 C a l a v e r a s Stanislaus National Forest 108 T u o l u m n e 1 inch = 50,000 feet Miles Figure 1-1
27 1.1 STATE ROUTE 49 Bay To Tahoe Basin Recreation and General Description: SR 49 is a north-south state highway that passes through many historic mining communities of the 1849 California gold rush. Gold Rush history is one of the signature tourism attractions in Northern California and the northern sierra foothills. SR 49 enters into the Study Area in Amador County. It then continues north through El Dorado, Placer, and Nevada counties. In Amador, SR 49 intersects with the eastern end of SR 16 before passing through the City of Plymouth. The highway passes through Enterprise before crossing into El Dorado County and winds its way through the towns of Nashville, El Dorado, and Diamond Springs before entering Placerville. In the City of Placerville, SR 49 traverses downtown on Pacific Street and Main Street before continuing onto Spring Street, where it intersects at grade with the US 50 expressway before continuing north. As SR 49 leaves the City of Placerville, it intersects the southernmost terminus of SR 193 before continuing northwest through the town of Coloma, home of the Marshall Gold Discovery State Park, then through Lotus. The route veers north at Pilot Hill, intersects with a more northern terminus of SR 193 at Cool, and continues north through the Auburn State Recreation Area before crossing into Placer County and entering the City of Auburn as High Street. SR 49 moves onto Lincoln Way before interchanging with I-80. The highway continues almost due north out of the Auburn city limits, crossing into Nevada County. It then becomes a freeway and enters the City of Grass Valley, where it runs concurrently with SR 20 until it crosses into Yuba County and out of the Study Area. SR 49 provides access to many historical tourism and popular recreation sites. It connects the numerous small towns, employment centers, schools, healthcare facilities, and government offices, including communities that are the headquarters (seat) of their county government. Most of SR 49 within the Study Area is a two-lane conventional highway characterized by topographical constraints that preclude any significant roadway widening to add capacity. It should also be noted that SR 49 is identified as a High Emphasis Route and a Focus Route as part of the Interregional Transportation Strategic Plan. For SR 49, this designation begins at its intersection of I-80 and continues north to where it runs concurrently with SR 20 as the Golden Center Freeway. High Emphasis Routes typically have high priority for funding and programming of improvements required for the route to maintain its interregional connectivity between urban centers, while Focus Routes are comprised of 10 routes in the Interregional Road System (IRRS) that are the highest priority for completion to at least minimum facility concept standards over the next 20 years. Traffic: The Caltrans District 3 TCR prepared for SR 49 (September 2000) provides planning information and an analysis of existing and future traffic conditions for the route. Traffic information is provided using a measurement called LOS. LOS is a measure of traffic density, with A representing the least amount of density and F the most congested conditions. As shown below in Table 1-1, most of the segments were operating at LOS E in the year The two exceptions operating at a lower LOS were the segment in Placerville, operating at LOS F, and the segment beginning at I-80 in Auburn and ending at the Placer-Nevada county line that was operating at LOS D in the year In the 2000 SR 49 TCR, Caltrans stated LOS A and B were not needed to provide good conditions. 2 2 California Department of Transportation, District 3, Transportation Concept Report, September 2000 October
28 Table 1-1: SR 49 Existing and Future LOS Segment Description Existing LOS (2000) Future LOS (2020) Amador/El Dorado County Line to Union Mine Road E F Union Mine Road to Sacramento Road E F Spring Street/US 50 to Coloma Street/SR 193 F F SR 193 to the El Dorado/Placer County Line E E El Dorado/Placer County Line to I-80 in Auburn F F I-80 to the Placer/Nevada County Line D F Placer/Nevada County Line to SR 20 E F SR 20 to the Nevada/Yuba County Line E F As shown in Table 1-1, all of the SR 49 Study Area segments, except for one, are predicted to reach full breakdown at LOS F by the year 2020 if no improvements are made. The segments of SR 49 that pass through population centers are often characterized by narrow roadways, multiple public and private property access points, numerous signalized intersections, and poor site distance. All these factors contribute to significant traffic congestion. Segments of SR 49 not located in population centers are characterized by rugged topography making it difficult to construct improvements that add highway capacity. Many portions of SR 49 in the Study Area have narrow or no shoulders and few areas for slower vehicles to safely pull over to allow faster travelling vehicles to pass. Transit: There are multiple providers of transit services along SR 49 within the Study Area. The El Dorado County Transit Authority provides general public transit service and offers scheduled fixedroute service, daily commute service to Sacramento, and Dial-a-Ride service. The City of Auburn Department of Public Works operates Auburn Transit, providing a deviated fixed-route service that operates within the City of Auburn and portions of unincorporated Placer County. Auburn Transit connects with Placer County Transit, the Capital Corridor Train, and Gold County Stage (a service of Nevada County) at the Auburn-Conheim Multi-modal Station. Placer County Transit also provides transit services connecting Auburn and within certain unincorporated areas of the County. The Gold County Stage and Nevada County Public Works Transit Division provide transit services along the SR 49 corridor within Nevada County. These services connect Placer County transit services. A primary point of connection is the Auburn-Conheim Station. 1.2 UNITED STATES HIGHWAY 50 General Description: US 50 is a transcontinental route that begins at I-80 in West Sacramento and traverses portions of Yolo, Sacramento, and El Dorado County before crossing into the State of Nevada. Within the Study Area, US 50 is designated as a Scenic Highway from its descent into downtown Placerville to the western city limit of South Lake Tahoe. US 50 provides access to many recreation and tourism locations in the Sierra Nevada range and the Lake Tahoe Basin. Peak recreational and commute travel periods are heavily congested, with demand for travel often exceeding the capacity of existing facilities and services. October

29 The western half of the highway, from I-80 through Sacramento and Placerville to the canyon of the South Fork American River at Riverton is, at minimum, a four-lane divided highway, mostly built to freeway standards. The remaining portion, passing through the canyon, over the Sierra, crossing Echo Summit (7,377 feet) then descending into the Lake Tahoe Basin is primarily a two-lane road that has passing lanes in both directions at several locations. Once US 50 enters the City of South Lake Tahoe, it becomes a four-lane highway again along the Lake Tahoe s South Shore with numerous access points for public roads and private property, including many businesses, lodging accommodations, community services, and recreation/visitor attractions. US 50 is subject to adverse weather conditions that often result in chain restrictions, snow removal operations, rock, debris, and snow slides, significant travel time delays, and full closures of the highway. Long-term planning for US 50 is addressed in two documents prepared by Caltrans as the lead agency the US Corridor System Management Plan (CSMP) and a TCR. The CSMP addresses the segments of US 50 from West Sacramento to the Cedar Grove exit east of Placerville. The TCR addresses segments from the Cedar Grove exit to the Nevada State line at the eastern end of South Lake Tahoe adjacent to Stateline, Nevada. US 50 is part of the Interregional Transportation Strategic Plan and is classified as a High Priority Emphasis Route, one of Caltrans highest priority designations for interregional routes. 3 High Emphasis Routes typically have high priority status for funding and programming of the improvements required for the route to maintain its interregional connectivity between urban centers. Although trucks do utilize US 50 within the Study Area, US 50 east of Sly Park Road cannot accommodate the larger STAA trucks due to the steep terrain, areas of narrow right-of-way, and many curves. STAA trucks are the largest commercial shipping trucks allowed on the United States interstate highway system (such as I-80). Traffic: According to the CSMP and TCR prepared for the segments of US 50 in the Study Area, the concept LOS standard for the 20-year planning horizon is LOS D for rural segments and LOS E for urban segments. Table 1-2 identifies the existing and future-planning year LOS with no improvements for the portions of US 50 within the Study Area. 3 California Department of Transportation, Transportation Corridor Concept Report United States Highway 50, June 2010 October
30 Table 1-2: US 50 Existing and Future LOS Segment Description Existing LOS (2010) 20 Year LOS (2030) Cameron Park Drive to Missouri Flat Road E F Missouri Flat Road to End of Freeway in Placerville D F End of Freeway in Placerville to Bedford avenue D E Bedford avenue to Cedar grove Exit D F Cedar Grove Exit to Sly Park Exit C C Sly Park Road to Ice House Road C C Ice House Road to Echo Summit E F Echo Summit to SR 89 D F SR 89 (Luther Pass) to SR 89 North (South wye ) E F SR 89 to California/Nevada State Line C F As shown above in Table 1-2, all segments (as of 2010) are operating at an acceptable LOS. However, if no operational or capacity improvements are constructed, seven of the ten segments will experience a decrease in LOS, from their existing LOS to full breakdown at LOS F. Due to the high cost of constructing capacity-increasing improvements associated with steep terrain and environmental constraints, it is considered unlikely that such improvements will be constructed In addition, the many horizontal curves and narrow sections of right-of-way, paired with a significant percentage of drivers unfamiliar with the highway are factors that frequently combine to result in slow speeds and increased travel time. As such, Caltrans has indicated it is focusing on smaller scale improvements, such as shoulder paving, routine maintenance, and ITS elements to address traffic congestion and improve traffic operations. Highway user surveys (see Chapter 2) have expressed the desire of travelers to see a Safety Roadside Rest Area to be constructed somewhere between Placerville and South Lake Tahoe. Transit: Public transit services along the US 50 corridor, within the Study Area, are limited to bus services. These services are provided by several private operators: The Amtrak Thruway bus route, which begins at the Amtrak Station in Sacramento and runs along the US 50 corridor to South Lake Tahoe; Greyhound service between the Sacramento area and Truckee; and several smaller companies that operate ski and gaming shuttles between the Bay Area and Sacramento and the Lake Tahoe portion of the Study Area (Lake Study Area). In western El Dorado County, the El Dorado County Transit Authority operates daily morning and afternoon commuter service on US 50 connecting El Dorado County and downtown Sacramento. The Tahoe Transportation District provides public transit in the South Lake Tahoe area. The US 50 corridor is connected to other areas within the community via BlueGo buses, Nifty 50 trolley (summer service), and Heavenly Ski Resort shuttles (ski season). BlueGo also operates routes that connect into Nevada to Carson City and the Carson Valley. 1.3 INTERSTATE 80 General Description: I-80 is a primary freeway route in California. It functions as a major transcontinental transportation corridor for tourists, commuters, and other travelers, and for the October
31 movement of goods between the Bay Area, Sacramento, Truckee-Lake Tahoe, Great Basin, intermountain west, Midwest, and the Eastern United States. Within the Study Area, it is the principal east-west route through Northern California and the only freeway crossing of the Sierra Nevada. Within the Study Area, I-80 traverses Placer and Nevada counties and climbs over 7,000 feet, reaching its peak at the 7,239-foot Donner Summit. Given the elevation and terrain, I-80 is subject to winter operations to accommodate snow removal, chain requirements, and driving restrictions. There are occasionally complete highway closures, due to heavy weather or major accidents. These conditions can significantly impact the speed and flow of traffic and increase the travel time for users. I-80 experiences high volumes of large truck traffic. This is due to its connectivity to seaports, regional distribution centers, and transcontinental commercial shipping. I-80 is designated as a National Truck Network route for Surface Transportation Assistance Act (STAA) trucks and a State Highway Extra Legal Load route (SHELL). STAA trucks are the largest commercial shipping trucks allowed on the Interstate highway system. They require special consideration for ingress and egress to the highway and for stopping areas to allow truck drivers to comply with drive time limitations. I-80 is also classified as a Strategic Highway Network (STRAHNET) route by the Department of Defense. 4 While there are some sections of I-80 within the Study Area that have climbing lanes, the high levels of truck traffic significantly impact the flow of traffic on many steep grades. Traffic: According to the Caltrans District 3 TCR, traffic conditions for the segments of I-80 within the Study Area (from the intersection of SR 49 to the Nevada/Sierra county line) are primarily influenced by recreational and truck traffic and winter weather and driving conditions. This determination was further supported by traffic data collected during the Bluetooth data survey conducted as part of this Study (refer to Chapter 3). The TCR also identifies the existing LOS for I-80 with the Study Area, by segments. 5 Table 1-3 identifies these segments, starting with Segment 10 (SR 49 intersection) and ending with Segment 15 (Truckee Airport Road to Nevada/Sierra county line). Table 2-3 shows the existing and twenty-year future LOS with no improvements for each Study Area segment. Table 1-3: Interstate 80 Existing and Future LOS Description Existing LOS (2010) 20 Year LOS (2030) Segment 10, SR 49 to Applegate Exit C F Segment 11, Applegate Exit to Blue Canyon E F Segment 12, Blue Canyon to Placer/Nevada County Line D F Segment 13, Placer/Nevada County Line to Donner Pass Rd. C E Segment 14, Donner Pass Rd. to Truckee Airport Rd. D F Segment 15 Truckee Airport Rd. to Nevada/Sierra County C D 4 California Department of Transportation, Interstate 80 Transportation Corridor Concept Report, September California Department of Transportation, Interstate 80 Transportation Corridor Concept Report, September 2010 October
32 As shown, all of the segments were operating at an acceptable level in However, if no operational or capacity improvements are constructed, four of six segments are projected to operate at full breakdown (LOS F) by the year District 3 has established the minimum concept LOS standards for the 20-year planning horizon at LOS D for rural segments and LOS E for urban segments. The Study Area segments are considered rural and therefore the concept LOS would be D. However, Caltrans has determined it is not feasible to achieve LOS D within the twenty year planning horizon, due to a lack of funding the amount of resources associated with constructing large-scale capacity improvements in steep terrain. As such, Caltrans and the local agencies that have jurisdiction of the segments of I-80 within the Study Area are focusing on targeted improvements. According to Caltrans, these include ITS, Transportation Demand Management (TDM), and active multi-modal management strategies to maximize operational capacity. Transit: Public transit services along I-80 within the Study Area are limited to bus and train service (very limited). Bus service is provided by several private operators: the Amtrak Thruway bus route starts at the Amtrak Station in Sacramento and travels along I-80 to Reno, Nevada; Greyhound bus service between the Sacramento area and Truckee; also, several smaller private companies provide ski and gaming shuttles between the Bay Area, Sacramento area, and the Study Area. Rail transit in the Study Area: The Capital Corridor Joint Powers Authority (CCJPA) operates one train that provides daily service from the Sacramento area to Auburn. This train is part of the Capital Corridor intercity rail transit system that serves eight Northern California counties from the Bay Area to Placer County (Auburn). Amtrak operates one daily train, the California Zephyr (Bay Area Salt Lake - Chicago) with Study Area stops in Roseville, Auburn, Colfax and Truckee. The authors of this report believe increased passenger rail on the Donner Route (adjacent to I-80) should be part of the mix of I-80 capacity improvements. We recognize, however, that Union Pacific Railroad has consistently stated its opposition to increased passenger service on what they view as a goods movement rail line (the Donner Route). The only current exception is Amtrak s daily California Zephyr connecting San Francisco, Salt Lake City, and Chicago. There are two stops in the Study Area Roseville and Truckee. However, the California Zephyr is a long-distance transportation service, not one geared to local or regional travel within California. 1.4 STATE ROUTE 89 General Description: SR 89 begins at an intersection with US Highway 395 in Mono County, and traverses north through Alpine County before entering El Dorado County and the Study Area. Once in the Study Area, SR 89 travels north and intersects with US 50 near the community of Meyers. At that point SR 89 runs concurrently with US 50 to the South Tahoe Wye. From there, US 50 heads east while SR 89 continues northward, following the west shore of Lake Tahoe. This segment of SR 89 provides an important link between the south and north shores of the Lake. Once in North Lake Tahoe, SR crosses the Truckee River Bridge in Tahoe City. It briefly intersects with SR 28 before continuing northwest to the Town of Truckee (Nevada County) and intersecting with I-80. Within the Study Area, most of SR 89 is a conventional two-lane rural highway. October
 and the 11th deepest lake in the world.")
33 Lake Tahoe is a world-renowned environmental and recreational asset, recognized in particular for its clear, pure water. Lake Tahoe is the second largest lake in the world at or above this elevation (6,225 feet above historic sea level) and the 11th deepest lake in the world. Given this stature and memorable scenic vistas, it is not surprising that SR 89 along the Lake s west shore experiences significant peak season tourism-related traffic and congestion. Traffic: Table 1-4 identifies the LOS in the Caltrans SR 89 TCR (April 2012). As with US 50 and I-80, the concept LOS for SR 89 is LOS D in rural areas and LOS E in areas where the route transects population centers. Table 1-4: SR 89 Existing and Future LOS 6 Segment Description Existing LOS (2012) 20-Year LOS (2033) Alpine/El Dorado County Line to US 50 C C US 50 SR 89/Junction to Near South Lake Tahoe City Limits C D Near South Lake Tahoe City Limits to El Dorado/Placer County Line D D El Dorado/Placer County Line to SR 28 E E SR 28 to the Placer/Nevada County Line D E Placer/Nevada County Line to I-80 F F I-80 to the Nevada/Sierra County Line C C As shown in Table 1-4, most of SR 89 segments within the Study Area are currently operating at an acceptable LOS, with the exception of the relatively short segment from the Placer/Nevada County line to I-80 (traveling through the so-called Mousehole tunnel under the Union Pacific Railroad Donner Route tracks). As previously reported, the concept LOS for rural areas is LOS D and LOS E for the portions of SR 89 located within population centers. According to Caltrans, without any improvements, the segments in areas where future growth is not anticipated or in some way limited can anticipate the 20-year LOS will remain the same. In areas projected to see some growth (tourism or resident based), SR 89 segments can expect LOS to further degrade, and additional segments may move to LOS F. Transit: Local public transit is provided on SR 89 once it enters the Tahoe Basin. As previously stated, BlueGo serves the South Shore and has some routes into Nevada. The Tahoe Area Regional Transit (TART) system is operated by Placer County. TART serves the West and North Shores of Lake Tahoe 6 California Department of Transportation, State Route 89 Transportation Corridor Concept Report, April 2012 October
.")
34 (from Tahoma, north on SR 89), the SR 89 corridor between Tahoe City and Truckee (including the resorts of Squaw Valley and Alpine Meadows), and provides some seasonal service on SR 267 (with Northstar California the principal destination served). TART also serves the North Shore communities of Crystal Bay and Incline Village in Washoe County, with funding support from the Regional Transportation Commission (RTC) of Washoe County. The Town of Truckee also provides some transit services. To the maximum extent possible, the Town s services are coordinated with those in Placer County. There are also a number of private transit providers operating in the greater Tahoe-Truckee region. Both Lake Tahoe s South Shore and the North Lake Tahoe-Truckee Resort Triangle offer transit connections to and from the Reno-Tahoe International Airport (RTIA). Limited private sector transit is available connecting the Tahoe-Truckee region with the Sacramento International Airport. 1.5 OTHER STATE HIGHWAYS WITHIN THE STUDY AREA In addition to the discussion of major highways in this chapter, there are other highways considered integral to overall connectivity in the Study Area. These highways provide access to many tourism and recreational attractions, population centers, commerce, and vital public services. A general description of each of these highways is provided below. State Route 16: Within the Study Area, the eastern segment of SR 16 begins at US 50 east of Sacramento. The highway then heads east through Perkins, as Jackson Road. After it passes Rancho Murieta, it crosses the Cosumnes River. SR 16 then leaves the Central Valley, enters Amador County and ascends into the Sierra Nevada foothills. SR 16 is of regional significance as it provides connectivity between population centers and is heavily used by visitors to access the many agritourism operations and recreational sites located throughout Amador and El Dorado counties. State Route 20: SR 20 is an east-west highway that crosses California north of Sacramento. It begins in Fort Bragg on the coast of Mendocino County, heads east past Clear Lake, Colusa, Yuba City, Marysville, and Nevada City (entering the Study Area) until it connects with I-80 near Emigrant Gap. At the SR 20/I-80 intersection, traffic can continue east to the Tahoe-Truckee region or into the State of Nevada. SR 20 is mainly a two-lane highway that serves regional, interregional, commute, commercial, agricultural, and recreational traffic. In Nevada County, SR 20 passes through the urban centers of Grass Valley and Nevada City where it is a four-lane freeway with auxiliary lanes between some interchanges. Beyond Nevada City, the route is a conventional two-lane facility that travels through rural, mountainous Nevada County. Caltrans expects operational improvements will be needed, but capacity expansion is not expected to be necessary. State Route 193: SR 193 is a split-section highway. One section is an east-west arterial road in Placer County running from Lincoln to Newcastle, just west of Auburn. The other is a loop to the east of SR 49. October
35 This section heads eastward from Cool to Georgetown, then turns south to rejoin SR 49 just north of Placerville. Both segments are characterized by substandard roadway geometrics. Large trucks often use the portion of SR 193 between Lincoln and Newcastle to bypass traffic congestion on SR 65. State Route 28: SR 28 is located in Placer County. It is a two-lane highway that traverses the North Shore of Lake Tahoe, from Tahoe City east to the California/Nevada state line at Crystal Bay (at the state line, the highway becomes Nevada SR 28). SR 28 experiences heavy traffic congestion during peak tourism periods throughout the year. The congestion in turn triggers significant travel time delays. SR 28 is constrained by topography, limited right-of-way, and environmental sensitivity associated with its close proximity to the shores of Lake Tahoe. As such, it is not a good candidate for road widening. Caltrans considers more appropriate solutions to be bicycle, pedestrian, transit, safety and ITS improvements. State Route 267: SR 267 is identified by Caltrans as a west to east undivided two lane mountain highway 11.7 miles in length that connects I-80 in Truckee (Nevada County) to the North Shore of Lake Tahoe in Kings Beach (Placer County). SR 267 is part of the Federal Aid Primary System and is classified as a Minor Rural Arterial. The route is of local and regional significance, providing access to recreational, residential, commercial, and industrial uses. Facilities along the SR 267 corridor include the Truckee Tahoe Airport, and the primary administrative offices of the Town of Truckee. Recreational sites include the Northstar California ski and year-round resort, the Martis Creek Lake recreation area (along with the Martis Creek Dam, managed by the U.S. Army Corps of Engineers); acres of open space, and scores of hiking and biking trails. Traffic volumes on SR 267 are projected to increase due to new commercial and residential developments expected along the corridor. As development and travel demands increase traffic congestion, highway geometrics, maintenance, and bicycle access will need to be addressed. SR 267 is certainly not suitable for pedestrians, and is a challenge for all but the most experienced of cyclists. The Martis Valley Trail (MVT) is a major new section of Class 1 trail currently being planned and designed by Placer County through the Northstar Community Services District (NCSD). This trail is proposed to connect the Town of Truckee s trail system with Northstar, and, ultimately, with the North Shore of Lake Tahoe and its growing trail network. The MVT is expected to provide safer corridor passage for cyclists and hikers traveling in the area between Truckee and North Lake Tahoe or elsewhere in the Martis Valley. October

36 2 PUBLIC OPINION AND RESEARCH STUDY As a cornerstone for developing the Bay to Tahoe Basin Recreation and, a public opinion and research study was commissioned to identify the travel habits of tourists who utilize the roadway network within the Study Area. ESI, Inc. and The Cromer Group, both firms with extensive experience in polling, surveys, and analysis, conducted the research. Initial research determined there was a strong correlation between the primary place of residence of individuals who own second homes in the Tahoe portion of the Study Area (Lake Study Area) and primary residence of many general tourists. The three geographical areas of Northern California with the highest number of Tahoe second homeowners are Sacramento, San Francisco, and San Jose. Accordingly, the research team proceeded on the assumption that these three metropolitan areas would also represent the largest group of visitors to Tahoe and the Study Area. The user surveys and polling were therefore conducted in these communities. 2.1 RESEARCH METHODOLOGY The research described in this chapter was conducted in two phases. Phase I consisted of user surveys - 10,000 automated calls placed in each of the metropolitan areas identify as study targets. These calls were made in June of The primary survey goal was to determine the travel habits of visitors to the Study Area and identify specific households in the target population centers who have visited. A total of 2,538 people responded to the automated calls. Phase II involved 905 in-depth interviews of survey respondents who confirmed they had visited the Study Area. As shown in Figure 2-1, below, it was found that in Sacramento, 69 percent of respondents said they had been to the Study Area; 70 percent of respondents from San Francisco said the same, as did just under 62 percent of respondents from San Jose Sacramento San Francisco San Jose Figure 2-1 User Survey Percentage of Respondents That Have Visited Tahoe Most of the respondents who confirmed visits to the Study Area said their visits were within the last five years. Many said they visit two or more times a year. More specifically, in the Sacramento area, October
37 45 percent said they visit the Study Area two or more times per year. In San Francisco and San Jose, approximately 30 percent said they visit two or more times per year. User survey respondents also identified the route and mode typically used to travel to the Study Area. As shown below in Figure 2-2, respondents from Sacramento primarily use US 50, while respondents from San Jose primarily use I-80. Respondents from San Francisco indicated they have a higher likelihood (as compared with those from Sacramento and San Jose) to use US 50 and I-80 fairly evenly. The use of public transit as a mode choice was low for all three metropolitan areas, as was the use of SR 88 to travel to the Study Area. This result was anticipated, as SR 88 would not be the most efficient way to travel to the Study Area from any of the three population centers surveyed. Sacramento San Francisco San Jose MOSTLY USE US 50 MOSTLY USE I-80 USE US 50 & I 80 EVENLY USE SR 88 USE PUBLIC TRANSPORTATION Figure 2-2 Percentage of Respondents Indicating Route Used to Travel to the Tahoe Area To better define travel needs, researchers sought to understand what time of the year people were more likely to visit the Study Area. The Study Area travel routes are all subject to seasonal traffic concerns; whether chain restrictions, reduced speed with snowfall, or full road closure. As shown in Figure 2-3, respondents indicated that, overall, they travel to the Study Area more during non-winter months. The number of respondents indicating they travel fairly evenly throughout the year was also relatively high for all three metropolitan areas. San Jose was the highest, with 28 percent of respondents indicating they travel to the Study Area fairly evenly throughout the year. October
38 Sacramento San Francisco San Jose Bay To Tahoe Basin Recreation and MOSTLY GO DURING NON- WINTER MONTHS MOSTLY GO DURING WINTER MONTHS GO FAIRLY EVENLY THROUGH THE YEAR Figure 2-3 Percentage Of Respondents Indicating Travel Time Of Year The user survey inquired how many times per year the respondents who confirmed they travel to the Study Area actually do so. The answers varied in all three areas. Sacramento respondents said they typically travel one time per year. Those from San Francisco said less than once per year, while respondents from San Jose reported they traveled the most times 45 percent said more than once per year. Figure 2-4 identifies the number of times per year the respondents reported they travel to the Study Area. Sacramento San Francisco San Jose ONCE PER YEAR MORE THAN ONCE PER YEAR LESS THAN ONCE PER YEAR Figure 2-4 Percentage Of Respondents Indicated Number Of Times Per Year Travelled October
39 Phase I of the research revealed the extent of the adult population base in the three target areas that visit and/or vacation in the Study Area. It also provided valuable information regarding the frequency of visits that occur over the course of a year. The data obtained was extrapolated over the entire population of each area (using 2010 Census data) to calculate the number of visitors who travel to the Study Area from the Sacramento and Bay Area regions. Using this methodology, it was determined that 4,155,889 visitors make 7,902,043 visits annually to the Study Area from the combined Bay Area and Sacramento regions. 7 In round numbers, four million visitors make eight million visits. 2.2 OPINION POLLING Based on the results of Phase I user surveys, Phase II research included the completion of 905 in-depth interviews with respondents who confirmed they visited the Study Area. To help develop the questions, the research team sought input from members of the PAC. The primary focus of the final list of questions was to further characterize the visitor and better define and understand their travel needs and perspectives. The complete script that was followed in each of the interviews can be found in Appendix A. The 905 opinion polling interviews were completed between October 29 and October 31, Approximately 300 interviews were conducted in each of the three metropolitan study targets (301 in Sacramento, 303 in San Francisco, and 301 in San Jose). A total of 63 questions were involved, and, on average, the interviews lasted minutes. The data collected is available to use and can be queried in different ways. The data tables are available in Appendix B. Route Choice: Respondents were asked which route was taken if travel was completed during the nonwinter months, winter months, or if they traveled evenly throughout the year. As shown in Figure 2-5, during the non-winter months, US 50 was traveled more frequently. During winter months, I-80 was used more often. Respondents who traveled I-80 during winter months said they did so because I-80 had better road conditions, was an easier drive, had greater availability of services, and less traffic congestion than US 50. That being said, US 50 registered a substantial edge over I-80 for being a more scenic drive by a margin of 3:1. Public transit use was low among all respondents, regardless of what time of year they traveled. 8 7 Kathy Pulliam-Jordan, Power Point Presentation, December William M. Cromer, Analysis of the Public Opinion Studies of the Bay-to-Basin Project Memorandum, November 14, 2013 October
40 Use US 50 Use Interstate 80 Bay To Tahoe Basin Recreation and Evenly Use US 50 & Interstate 80 Can't Recall Public Transportation NON-WINTER VISITORS WINTER VISITORS VISIT EVENLY THROUGHOUT YEAR Figure 2-5 Route Use By Season Travel to Rural Communities: As shown in Figure 2-6, two-thirds of the respondents indicated they do not stop in any of the surrounding communities within the Study Area on their way to the Lake Tahoe region. They drive straight to their destination. By comparison, 30 percent indicated they stop at recreation or other tourism opportunities along the way. October

41 Fairly Regularly Stop At Surrounding Commmunities Drive Straight Through Mostly Take Public Transit To Tahoe or Nearby Communities 2% 1% 30% 67% Figure 2-6 Percentage Of Respondents That Stop In The Communities Surrounding The Tahoe Basin Respondents were asked to identify information or improvements that would increase the likelihood of their stopping at a tourist opportunity or in one of the Study Area communities on the way to their final destination. Please refer to Table 2-1, below. Improved hotel accommodations and more restaurants ranked the highest, with 44 percent and 43 percent, respectively, indicating these were Very Important factors. Among the highest factors related to transportation were: improved signage, better public transit, and more parking. Better lighting ranked highest in the Somewhat Important category. This data suggests that planning and implementing agencies should focus on transportation improvements consistent with what respondents rated as Very Important and Somewhat Important. Tourism organizations and private sector businesses should take note of the high rankings for Improve Hotel Accommodations and More Restaurants. October
42 Table 2-1: Items That Respondents Indicated Are Important To Improve Upon Very Important Somewhat Important Not too Important Not Important Can t Say Improve Hotel Accommodations 44% 12% 11% 26% 6% More Parking 36% 21% 13% 15% 15% Improve Access 40% 18% 23% 12% 7% Better Signage 39% 23% 21% 10% 6% Better Lighting 16% 31% 25% 17% 11% Easier Parking 29% 23% 25% 17% 6% Better Roadways 32% 23% 22% 18% 6% Better Public Transit 38% 18% 19% 18% 7% More Restaurants 43% 24% 19% 8% 6% Activities in Rural Communities: The evidence is clear. Local economies and the regional economy of the Study Area are largely dependent on tourism and tourism markets. Respondents were asked about their familiarity with thirteen activities offered throughout the Study Area: Wine tasting/winery tour Camping Fishing and/or hunting Shopping Participate in agritourism* Casino Gaming White water rafting Sightseeing Rock climbing Tour of a historical site Mountain biking or hiking Unique restaurant or culinary experience Gold panning *Agritourism: See definition in Section 4.1. Respondents demonstrated a high awareness (over 70 percent) of many of these activities, including: fishing, mountain biking, hiking, camping, shopping, sightseeing, and tours of historical sites. There was lower awareness (40 percent or more of respondents were unaware that an activity was available) for activities such as: wine tasting and wine tours, agritourism, gold panning, and local restaurants/unique culinary experiences. The respondents were asked the likelihood that they would consider stopping for any of the identified activities as they traveled to or from the Lake Tahoe area. Specifically, they were asked if they would be: Highly likely to stop, somewhat likely to stop, not too likely, or not likely at all. The polling revealed the differences in priorities if activities were available on the chosen route for visitors from the respective communities. San Francisco respondents would be the most interested in October
43 going to unique restaurants or having a culinary experience (54 percent). San Jose respondents ranked a dining experience second (47 percent) behind sightseeing (49 percent). Respondents from Sacramento ranked sightseeing as their number one choice (50 percent), and ranked a dining experience in fourth place (40 percent). When cross-tabbed with the preferred route, those respondents traveling US 50 expressed a greater interest in sightseeing (Sacramento and San Jose) while those traveling I-80 expressed greater interest in a culinary experience. The data gathered provides a roadmap for economic development opportunities on the preferred routes as well as marketing opportunities for existing businesses. Public Transit Respondents were asked whether or not they would use public transit to and from the Lake Tahoe Study Area (Tahoe portion of the overall Study Area) if it were more accessible and easier to use. As shown in Figure 2-7, 51 percent said they would use it in a heartbeat, 33 percent would at least give it a try. Seven percent said they already use it WOULD USE PUBLIC TRANSIT IN A HEARTBEAT WOULD GIVE IT A TRY DOUBTFUL THEY WOULD USE IT WOULD NOT USE IT ALREADY USE IT CAN'T SAY Figure 2-7 Likelihood Of Using Public Transit Examining the data more closely, 40 percent of respondents said they used public transit (either frequently or infrequently). Fifty-two percent said they did not use public transit much, if at all. With 40 percent of the Study Area visitors using public transit at home, researchers explored the likelihood of transit usage, if available, along their respective route of choice and the impact transit availability might have on the frequency of their visits. Forty percent of San Franciscans said they would use public transit if it were available. Twenty-four percent of the San Francisco respondents said the availability of transit would increase the number of visits they make to the area. Sixty percent of Sacramento visitors said they would use public transit if available, 43 percent said they would visit more often if transit were available. Of San Jose respondents, 53 percent said they would use public transit if it was available and 38 percent said they would increase their visitors if transit were available. October
44 Travel Related Information Bay To Tahoe Basin Recreation and Respondents were asked how they obtain information about activities available in the Study Area. The highest response (32 percent) was by word of mouth. Nineteen percent said they obtain information through the Internet (website, Trip Advisor, or similar source). This was the second highest response, except for those who could not recall where they obtained this information. Those who said they used their smartphone or tablet to obtain information were more likely to use a website than a mobile application. As the use of apps becomes more the norm, it could be expected that the number of visitors using apps to access travel related information would increase. In the meantime, it appears that website based marketing to disseminate travel and activity information to the visitor would be a more effective strategy. 2.3 IMPLEMENTATION BASED ON OUTCOMES OF THE PUBLIC OPINION AND RESEARCH STUDY The team that analyzed the research data recommends that information from four primary areas be used to shape implementation strategies: 1) Informing transportation improvements. 2) Identification of transportation system users. 3) Identifying effective methods for disseminating travel information. 4) Informing the marketing efforts that can direct tourists to a broader range of activities within the Study Area. Public Opinion and Research Study Recommendation- 1 (PORS-1) Informing Transportation Improvements Two key transportation considerations can be gleaned from the research: The travel experience for visitors who use I-80 could be improved if there was: Better access to and awareness of Study Area recreation and tourism sites. More accessible public transit connecting Study Area communities and attractions. Better, more accessible parking. All of the above to include better signage. The travel experience for visitors who use US 50 could be improved if there was: Improved condition of the roadway. Better signage, including expanded network of ITS technologies. More awareness of recreational opportunities and other attractions along the route. Improved ingress and egress to Study Area communities. Improved lighting. Construction of at least one Safety Roadside Rest Area at a strategic location between Placerville and South Lake Tahoe. Note: There are two in the Study Area on I-80 but none on US 50. The recommended improvements are relatively modest in cost. Such improvements could offer the highest cost/benefit ratio for all involved stakeholders. They would contribute to an increase in tourism- October
45 related spending and overall positive economic outcomes at the local as well as regional level, including a better travel experience and greater opportunities to increase repeat visitation. PORS-2 Identification of Transit System Users According to the data, close to eight million individual visits are made by system users who live in Sacramento, San Francisco, and San Jose. These visitors and second home/vacation property owners utilize the Study Area s limited transportation network to access and enjoy the many recreation and tourism opportunities that abound in the region. Currently, transportation-funding sources do not take into account the system impacts associated with tourism related travel. The majority of transportation funding is distributed based on permanent population. As a result, impacts on the Study Area s transportation network are not adequately addressed. It is therefore recommended that responsible agencies pursue the modification of transportation funding formulas to include the total number of system users (User Population). User population factors in tourism travel, not just travel by the region s relatively small population of permanent residents. PORS-3 Methods for Informing the Traveler In order to promote existing activities and opportunities throughout the Study Area, it is recommended that traveler information technologies, services, and projects be coordinated on a regionalized or likeactivity basis. The Public Opinion and Research data indicates that website based marketing is the most effective method to inform visitors and activities and attractions prior to their trip. Once on a trip, however, visitors are more likely to utilize a mobile phone or tablet to access travel and tourism related information. Accordingly, it is important that websites are designed or improved to more easily view on portable computers and mobile devices. A collaborative, regionalized approach to providing and disseminating traveler information is also recommended. For example, the regional website could be used to encourage people to stagger departure times from tourist destinations on peak tourism travel days and times. Likewise, the website could provide real time travel information allowing the traveler to make informed decisions on when to travel and the ability to decide if they would be better off missing a peak travel period by visiting a nearby local community in the Study Area. PORS-4 Regionalized Internet Access Providing regionalized Internet access along the most highly used transportation corridors would allow for the dissemination of coordinated traveler information while visitors are in route. More people than ever carry portable devices that allow remote access to the Internet. If Internet access were more widely available, for example through a Wi-Fi network installed along the major travel corridors, travelrelated information and updates could be provided to travelers in route. This would help local, regional, and state agencies significantly improve the management of traffic congestion, allow for critical safety information to be transmitted in real-time, and allow tourists to obtain information about the communities they pass in route to a destination. October
46 PORS-5 Marketing Opportunities Bay To Tahoe Basin Recreation and Data from the research collected as part of this Study can be used to identify population subsets to target with future marketing efforts. On average, half of the respondents indicated they would be highly likely or somewhat likely to try out one or more of the activities available in the Study Area activities that may represent a new experience for them. In examining the frequency of the highly likely and somewhat likely responses, the highest number of activities that any respondent would try is nine of the thirteen (as listed earlier in this Chapter). Two out of every eleven (18 percent of respondents) indicated they would be likely to try nine of the thirteen activity options listed. The individuals who make up this 18 percent would be considered the high target market audience. According to demographics collected during the interviews, the high target audience group is comprised as follows: Younger people from San Jose 10 years since visiting Lake Tahoe Younger men Non-college women Low-income women Use I-80 in the winter Use I-80 all year Use US 50 Female Latina Male Anglo Other minority women Households with children Would take public transit to Tahoe More public transit may increase visits In all three areas, Sacramento, San Francisco, and San Jose, 25 percent of the population fits the high target market audience profile. Tourism marketing strategies that focus on the activities that interested the high target market audience respondents the most, would likely result in increased participation in those activities and an increase in associated money spent. 9 9 William M. Cromer, Analysis of the Public Opinion Studies of the Bay-to-Basin Project Memorandum, November 14, 2013 October
47 3 TRAFFIC DATA COLLECTION The collection of traffic data is crucial for transportation professionals when making decisions about a wide range of issues and concerns. These are most often related to metropolitan and regional planning, new development, roadway maintenance and operations, and the allocation of funds. Accordingly, another important component of the Bay to Tahoe Basin Recreation and was the review of existing traffic data, and the collection and analysis of additional information using Bluetooth Data Collection technology. Existing traffic data is available through the Caltrans and multiple local jurisdictions throughout the Study Area. It is typically reported as annual average daily traffic (AADT). AADT is the total volume of vehicle traffic on a highway or road divided by 365 days. AADT, population, and lane miles are the measures normally used for transportation planning, engineering, and funding. AADT is a basic measure of how busy a specific road is. However, it does not take into account where the vehicle originates or why it is traveling. To better understand the impact that tourism has on highways within the Study Area, the Project Team sought to determine what portion of existing traffic is associated with tourism activity. However, since the Study Area is so large, traditional traffic collection methods, such as manual observations (counting of vehicles) or the deployment of Automatic Number Plate Recognition video cameras were judged to be cost prohibitive. It was instead decided to utilize Bluetooth sensor technology to monitor and collect data on traffic patterns using BluFax traffic surveillance equipment. This technology allowed for remote sensing of data through the deployment of a Bluetooth sensor network throughout the Study Area. 3.1 BLUETOOTH DATA COLLECTION TECHNOLOGY OVERVIEW Bluetooth is a trademarked telecommunications industry specification that allows electronic devices (such as mobile phones, computers, tablets, and car radios) to be connected. For example, it is the technology that allows mobile phones to wirelessly connect to a vehicle. This allows the user to speak hands free using the vehicle s speakers and microphone. The technology is effective at distances ranging from one foot to about 300 feet, depending on the power rating of the respective sub-systems. The Bluetooth protocol uses an electronic identifier in each device called a Media Access Control (MAC) address. The MAC identification address serves as an electronic nickname that allows electronic devices to keep track of who is who during data communications. It is these MAC addresses that are used as the basis for obtaining traffic information. Bluetooth equipped devices that are powered on and set in the discover mode continuously transmit a unique identifier to allow establishing a connection with other devices. Bluetooth technology also allows for anonymous traffic monitoring, by capturing the MAC addresses of Bluetooth devices without obtaining or recording any personal information that may be associated with the user of a Bluetooth device. Approximately 10 percent of vehicles in California contain some type of Bluetooth device. When a network of Bluetooth sensors is deployed and a vehicle containing a detectable device passes by, the sensor is able to record the anonymous MAC identification address emitted by the enabled device, along with a time stamp. When the MAC identification address of a Bluetooth enabled device is observed at two or more sensors, it is possible to determine the speed, time of travel, and likely route of the vehicle transporting the Bluetooth enabled device. Calculating the difference in the time stamps associated with October
48 the MAC identification address accomplishes this calculation. Observations of multiple vehicles containing Bluetooth devices can provide a highly accurate estimate of traffic conditions, travel patterns, and time of travel. 3.2 BLUETOOTH SENSOR DEPLOYMENT Twenty BluFax sensors with Bluetooth sensing capabilities were strategically placed throughout the Study Area, from the Sacramento area to the Lake Tahoe Basin. To determine the sensor locations, the likely routes that tourists from the Bay Area and Sacramento regions would take to the Study Area were evaluated. The intent was to establish a sensor network that would allow for the identification of tourists based on where they entered the network and where they traveled once inside the network. The sensors were deployed from June 26, 2013 to July 12, This time period allowed the establishment of regular traffic patterns before and after peak holiday traffic (Fourth of July), a period that traditionally generates a high level of tourism activity. Table 3-1 identifies the sensor locations and the number of detections that each particular sensor recorded. Figure 3-1 provides a map of the sensor locations. In total, there were 920,349 records recorded, with an average of just of 55,000 records per day. Of the total number of records, 168,546 unique Bluetooth MAC identification addresses were collected during the study period. It should be noted that an RV knocked down the sensor at Location 18 the evening of July 8, 2013; therefore, the dataset for that particular location is incomplete. Table 3-1: Bluetooth Sensor Locations Station Number Location Description County Number of Detections 1 Enterprise Boulevard/I-80 Yolo 153,033 2 Elk Grove Boulevard/Interstate 5 Sacramento 84,596 3 Riverside Avenue/I-80 Sacramento 154,751 4 El Dorado Hills Blvd/US 50 El Dorado 75,868 5 Jackson Road/SR 16 Sacramento 5,831 6 SR 88/SR 104 Amador 11,409 7 SR 49/SR 20 Nevada 16,575 8 Intestate 80/SR 49 Placer 114,256 9 Cherry Acres Road/SR 193 Placer 6, Schnell School Road/US 50 El Dorado 30, Main Street/SR 49 Amador 10, Donner Pass Road/I-80 Nevada 58, Floriston Road/I-80 Nevada 40, Shaffer Mill Road/SR 267 Placer 22, SR 28 At California/Nevada State Line Placer 23, SR 89 In Tahoe City Placer 18, SR 89 Near Fallen Leaf Lake Road El Dorado 10, SR 89/US 50 El Dorado 17,465* 19 US 50 Near California/Nevada State Line El Dorado 59, Nevada SR 207/Shady Lane Douglas 21,966 *Location 18 Unit Knocked Down by RV, evening of July 8, 2013 October
49 B u t t e ST 70 Y u b a ST 20 ST 49! 7 ST 20 N e v a d a 80 S i e r r a! 12! 13! 14! 15 W a s h o e Toiyabe National Forest Reno S t o r e y L y o n Bay to Basin Recreation and Tourism Rural Roadway Impact Study Sensor Locations Map Feature Key (May 2014) Sensor Locations Project Study Area S u t t e r C o l u s a ST 70 ST 65! 9! 8 P l a c e r Eldorado National Forest! 16 Lake Tahoe! 17! 18 Carson City C a r s o n C i t y! D o u g l a s! ST 99 Roseville ST Woodland Y o l o Davis! 1 Arden-Arcade Sacramento! 3! 4 Citrus Heights Rancho Cordova Folsom! 10 E l D o r a d o ST 88 A l p i n e ST 89 ST ! 2 S o l a n o S a c r a m e n t o! 5! 11 Elk A m a d o r Grove S a n J o a q u i n ST! 49 6 ST 88 ST 12 J:\Jobs\ EDCTC-Bay-to-Tahoe_RdwyImpactStudy\GIS\Tasks\Report_Figures\Figure_3_1_ _V1.mxd 09/17/ :33:43 PM stan C a l a v e r a s Stanislaus National Forest ST 108 T u o l u m n e 1 inch = 50,000 feet Miles F Figure 3-1
50 3.3 BLUETOOTH TOURIST AND COMMUTER DATA ANALYSIS Bay To Tahoe Basin Recreation and One of the primary goals of collecting the Bluetooth data was to determine whether or not a specific traveler was a tourist or commuter, on any given day during the study period. To complete this analysis, a home sensor location and home zone were established for each unique Bluetooth identifier. The home station was determined to be the sensor location that had the maximum number of records for an individual Bluetooth identifier. Once the home sensor location was determined, the zone in which the sensor was located was established as the identifier s home zone. The Study Area was divided into three zones: Zone 1 was the Sacramento Area, Zone 2 was the area that generally encompasses the Sierra foothills, and Zone 3 consisted of the Lake Tahoe Basin. Table 3-2 identifies the Bluetooth sensor location and Figure 3-2 illustrates the three zones on a map. Table 3-2: Zone Assignments For Bluetooth Stations Zone Number Zone Description Bluetooth Home Stations 1 Sacramento Area Foothills Tahoe Basin Once the home zone was determined for each Bluetooth identifier, a set of established rules were applied to the movements of the identifier. The rules were developed to identify whether or not an identifier was a tourist or a commuter. The rules were applied on a daily basis. As such, an identifier could be designated as a commuter on one day and as a tourist on another. The established rules are as follows: Rule 1: Any identifier that was only reordered at one sensor on any given day was discarded. Rule 2: If an identifier was designated as a tourist and did not return back to the identifier s home zone, the identifier was designated as a tourist on subsequent days of travel. Rule 3: If travel was only within Zone 1, the identifier was designated as a commuter. Rule 4: If travel was only within Zone 2, the identifier was designated as a commuter. Rule 5: If travel was only within Zone 3, the identifier was designated as a commuter. Rule 6: If the identifier s home zone was Zone 1 and the identifier travelled to Zone 2, the identifier was designated as a tourist. Rule 7: If the identifier s home zone was Zone 2 and the identifier travel to Zone 1, the identifier was designated a commuter. Rule 8: If the identifier s home zone was determined to be Zone 1 and the identifier travelled to Zone 3, the identifier was designated a tourist. Rule 9: If the identifier s home zone was determined to be Zone 2 and the identifier travelled to Zone 3, the identifier was designated a tourist. October
51 ST 70 ST 20 ST 49! 7 ST 20 80! 12! 13! 14! 15 Bay to Basin Recreation and Tourism Rural Roadway Impact Study Station Zones Map Feature Key (May 2014) Sensor Locations Station Zones Project Study Area Zone 2! 16 Zone 3 Lake Tahoe! 17! 18! 20! ST 70 ST 65! 9! 8 ST 99 ST 49 50! 3! 4! 10 ST 89 ST 88! Zone 1 ST 4! 5! 11! 2 ST 88! 6 ST 49 ST inch = 50,000 feet Miles F ST 12 J:\Jobs\ EDCTC-Bay-to-Tahoe_RdwyImpactStudy\GIS\Tasks\Report_Figures\Figure_3_2_ _V1.mxd 09/17/ :32:20 PM stan Figure 3-2
52 Rule 10: If the identifier s home zone was determined to be Zone 3 and the identifier travelled to Zone 2, the identifier was designated a tourist. Rule 11: If the identifier s home zone was determined to be Zone 3 and the identifier travelled to Zone 1, the identifier was designated as a tourist. Once the rules were applied to each unique identifier, the percentage of commuters and tourists recorded at each station could be determined. Separate graphics that depict the percentage of commuters and tourists designated at each sensor location, during each day of the Bluetooth sensor deployment, can be found in Appendix D. Figures 3-3 through 3-7 illustrate the percentage of Bluetooth identifiers designated as commuters and tourists at selected sensor station locations. Figure 3-3 illustrates the percentage of commuters that were detected by the Bluetooth sensor installed at Location 1, Enterprise Boulevard and I-80 in West Sacramento. As expected, on all days of the study, the percentage of commuters dominated the percentage of tourists, with an average of 91 percent of the Bluetooth identifiers detected designated as commuters. Tourist traffic peaked around the Fourth of July holiday and on the weekends; however the percentage of commuters was still significantly higher than the percentage of tourists designated Commuter Tourist Figure 3-3 Percentage Commuters and Tourists Location 1 (Enterprise Blvd/I-80, West Sacramento) Figure 3-4 depicts the percentage of commuters and tourists at I-80 and SR 49 in Auburn, California. On average, 55 percent of the Bluetooth identifiers detected were designated as tourists. As shown below, tourist activity peaked the weekend before the holiday, on the Fourth of July, and on the Sunday (July 7, 2013) after the Fourth of July holiday; when it is assumed travelers were returning home. The junction of I-80 and SR 49 is located in a tourist destination and is also a location that many tourists travel through to reach other tourist destinations in the greater Tahoe region and the surrounding communities. October
53 Commuter Tourist Figure 3-4 Percentage Commuters and Tourists Location 8 (Interstate 80/State Route 49) Figure 3-5 depicts the percentage of commuters and tourists at Bluetooth Sensor Location 10, located in Placerville. Location 10 recorded a significantly higher amount of tourists before, during, and after the Fourth of July holiday. The highest was percent of Bluetooth identifiers designated as tourists detected on July 7, 2013, the Sunday following the Fourth of July, when it was assumed a high number of tourist travelers were returning home. During the weekdays after the Fourth of July holiday week (July 8, 2013 to July 11, 2013) the percentages of commuters and tourists were closer to being even, with an average of 51 percent of the Bluetooth identifiers designated as tourists detected. Note: Both Placerville (Sensor Location 10) and Auburn (Sensor Location 8) are areas that a high volume of tourists pass through when traveling to destinations in the greater Lake Tahoe region and surrounding communities. October
54 Commuter Tourist Figure 3-5 Percentage Commuter and Tourist Location 10 (Schnell School Road/US 50) Figure 3-6 illustrates the percentage of commuters and tourists detected at Location 16 in Tahoe City. As shown, an average of 58 percent of the Bluetooth identifiers detected were designated as commuters and 42 percent as tourists. As with other locations, tourism travel increases during the Fourth of July period. However, unlike Locations 8 and 10, Location 16 detected more Bluetooth identifiers designated as commuters than those designated as tourist. The Project Team assumes this is related to the fact that the highest percentage of tourists traveling to the Lake Study Area and surrounding communities use US 50 or I-80, so funnel through Placerville or Auburn. Tahoe City is a major hub for local commerce and community activities, so it is not surprising that commuter traffic remained high even with the influx of peak season tourist traffic. October
55 Commuter Tourist Figure 3-6 Percentage Commuter and Tourist Location 16 (State Route 89 Tahoe City) Figure 3-7 illustrates the percentage of Bluetooth identifiers designated as commuters and tourists at Location 19, in South Lake Tahoe, near the California-Nevada state line. As shown, the percentage of commuters was significantly higher than the percentage of tourists on all days of the Bluetooth sensor deployment. However, similar to other locations, tourist designations peaked around the Fourth of July holiday. On average, 70 percent of the Bluetooth identifiers were designated as commuters. The Tourism Market Study (discussed in Chapter 4) indicated that tourism in the South Shore area (overall) had declined for ten consecutive years, and only recently, within the past two years, exhibited slight increases. The decreased levels of tourism activity, paired with the fact that South Lake Tahoe is not a significant route for pass-through tourism, are likely the main factors that contributed to the higher level of commuter traffic detected at Location 19, when compared with other tourist-related destinations in the Study Area. The Project Team also noted that despite the volume of tourism traffic during the Fourth of July holiday, the Stateline area remains a popular destination for local residents (commuters) enjoying entertainment and the popular Fourth of July fireworks show held in the Stateline area. It is assumed this factor helps explain the commuter/tourism traffic mix for this location. October
56 Commuter Tourist Figure 3-7 Percentage Commuters and Tourists Location 19 (US 50 Near Stateline) 3.4 SPEED ANALYSIS The Bluetooth sensors recorded a time stamp along with the Bluetooth identifier. It was therefore possible to determine the time of travel for a specific Bluetooth identified when the unique Bluetooth identifier was detected at two or more Bluetooth sensors. In analyzing the relationship between traffic count and speed, as expected, as the number of tourists traveling increased, the speed of travel decreased. In general, the more tourists using the Study Area highway network, the slower the speed of traffic and the greater the level of congestion. Accordingly, it is reasonable to conclude that increased tourism traffic contributes significantly to congestion during peak tourism travel periods. 3.5 PEAK AND NON PEAK TOURISM AND COMMUTER TRAFFIC As determined by the tourist and commuter traffic analysis, a significant amount of traffic in and around the communities within the Study Area can be attributed to tourism. Peak season is represented by data gathered between June 26, 2013 to July 12, 2013, a period that included the Fourth of July holiday. On average, along US 50 and I-80 approaching the Lake Tahoe Basin, approximately 60 to 70 percent of the vehicle trips were tourist trips. Commuter trips were 30 to 40 percent (Peak Annual Daily Traffic Conditions). During non-peak periods, Project Team traffic engineers used data available to estimate average tourist trips along US 50 and I-80 approaching Lake Tahoe at 60 percent tourist and commuter trips at 40 percent (Annual Average Daily Traffic Conditions). As discussed throughout this Study, tourism traffic has a significant impact on the Study Area roadway network, not just during peak periods, but throughout the year. Year round, there is a significant amount of local (commuter) traffic within the Tahoe Basin, so even though tourist traffic remains high during non-peak periods, the mix of tourist and commuter is more even. October
57 Although the Bluetooth sensors were deployed for only a short period of time (June 26, 2013 to July 12, 2013), the data provides valuable information and insights related to tourism travel and associated impacts within the Study Area. The following are recommendations based on the Project Team s Bluetooth data analysis: Traffic Data Collection Recommendation 1 (TDC-1) Develop a User Population As documented by the data and analysis, significant amounts of traffic in and around the communities of the Study Area can be attributed to tourism. During peak tourism season (such as the days before, during, and after a major holiday), the highway segments that serve as both tourism destinations and as pass-through routes for tourists (such as US 50 at Placerville, I-80 at Auburn, and I-80 at Truckee) can experience approximately 60 percent of traffic designated as tourist-related traffic. Areas within the Tahoe Basin can experience close to 40 percent of traffic directly associated with tourism travel. The Bluetooth data analysis can be used to inform decision-makers about the high impact of tourism on the Study Area highway system by tourist travelers, including those who live in the nearby population centers of Sacramento and the Bay Area. The resources needed to address ongoing tourist related impacts to the highway system are not factored into existing transportation funding sources or distribution formulas. These are typically allocated based on permanent population. The transportation system impacts are clearly well beyond those of just local residents. It is therefore recommended that a User Population be developed that reflects the actual population (tourists plus locals) using the Study Area transportation network. This User Population should be developed through a coordinated approach involving all the affected jurisdictions. The stakeholders should pursue modification of transportation funding sources and formulas based on the User Population as a more accurate reflection of reality. TDC-2 Support Placement of Tourism Travel Amenities The evaluation of Bluetooth tourism and commuter data, in conjunction with data collected during the Public Opinion and Research Study (Chapter 2) can be used to inform decisions regarding the implementation of tourist travel related amenities. Identified amenities include: Informational signage, access and lighting improvements, and the location of public and private property transit stops and Safety Roadside Rest Areas. For example, many survey respondents who indicated they use US 50 as a travel corridor in the Study Area said they would be more willing to stop on the way to their final destination if there was better informational signage. Data collected confirms there are a high percentage of tourists that pass through Placerville. More informational signage in the Placerville area would likely improve the traveler experience. There was similar user survey support for signage improvements and improved accessibility to interim destinations along the I-80 corridor. Likewise, a significant percentage of survey respondents indicated they would be willing to use public transit to access the Study Area, if it were available and easy to use. The Bluetooth and survey data October
58 could be used to inform the location of transit routes and stops. Chapter 5 of this Study includes a more in-depth discussion of recommended improvements. TDC-3 Inform the Dissemination of Travel Information During Peak Holiday Periods As expected, as tourism travel increases, the time it takes to travel increases (speed of travel decreases). The analysis of speed of travel indicates that shorter travel time can be experienced during non-peak hours. Information should be disseminated to travelers to inform them of peak travel periods, with encouragement to travel outside of the peak periods, choose alternate routes, choose alternative activities, and explore new destinations and recreational opportunities, if possible. The public can be informed through the use of social media, websites, and an expanded network of ITS components throughout the Study Area, just to name a few examples, thereby reducing and better managing congestion generated by tourism. October
59 4 TOURISM MARKET STUDY EPS completed the Tourism and Marketing Study for the Bay to Tahoe Basin Recreation and Tourism Travel Impact Study in October of Its primary purpose was to evaluate key tourism assets, existing tourism, emerging trends, and the potential for growth in the Study Area. Members of the Project Team and PAC recognized it was important to understand this information so it could be factored into transportation system planning and implementation strategies moving forward. The complete Tourism Market Study is included in Appendix C and summarized in this Chapter of the Bay to Tahoe Basin report. The importance of tourism as an economic driver is often under appreciated. Because it tends to fluctuate based on a variety of factors, including weather and overall economic health at the state, federal and international levels, tourism is often viewed as difficult to predict from a planning perspective. Rarely is tourism adequately incorporated in the planning and implementing of transportation system improvements. It is clear that tourism directly benefits local, regional, and state economies, generating both public and private sector revenues. As discussed in this Study s Introduction, a May 2014 report published by GO-Biz, identified Travel and Tourism as one of the most important export oriented industries in California, ranking number two behind Microelectronics and ahead of Agriculture and Food Products. The GO-Biz report also stated that, Although most travel spending and related economic impacts occur within California s primary metropolitan areas, the travel industry is important throughout California. In general, the counties with less total employment have a bigger share of travel-related employment. The region defined by the Study Area for this Bay to Tahoe Basin report is home to some of California s most iconic and popular travel destinations - Gold Country, the northern High Sierra, and Lake Tahoe. Amador, El Dorado, Placer, and Nevada counties are part of two California tourism regions actively marketed by the California Travel and Tourism Commission and its private sector partners through the VisitCalifornia program and VisitCalifornia.com. These regions are the High Sierra and Gold Country. A part of tourism that is not always recognized as such is travel related to the ownership of second or vacation homes. There are second and vacation homes throughout the Study Area. The greatest concentration of these is in the Lake Tahoe region. The Tahoe Regional Housing Needs Program Report (February 2014) indicates that only about 45 percent of the region s housing stock is occupied by permanent renter or owner households. Most of the remainder is utilized as second homes or vacation rentals. Residents of the greater San Francisco Bay Area and the Sacramento metropolitan area own many of these properties. As noted above, the health of the tourism industry is heavily influenced by the health of the overall economy. When the economy is doing well (e.g., low unemployment, high consumer confidence, increased discretionary income) tourism activity and spending increases. When the economy is depressed, as it was during the Great Recession (beginning in 2007), tourism expenditures decline. This Tourism Marketing Study confirmed that as the United States continues to recover from the Great October
60 Recession, tourism spending has shown an upward trend of six percent per year since In the U.S. overall, it is projected that tourism expenditures will continue to increase at a rate of more than four percent per year for the next three years. 11 Tourism activity and spending is also influenced by the attractiveness, accessibility, and awareness of a specific destination or region of destinations. Improvements in the three A s," including accessibility via the transportation network, can result in an increase in tourism spending. Tourism is a very competitive industry. Adding new attractions, improving facilities, and investing in related transportation infrastructure all increase visitor appeal. The condition of roadways, flow of traffic, quality of directional signage and ease of access, availability of public transit, and adequacy of parking all influence visitor appeal and can represent part of the region s competitive advantage. The Tourism Market Study evaluated existing regional tourism assets and activities, emerging trends, and included an evaluation of the tourism market for each county within the Study Area. 4.1 TOURISM ACTIVITIES Generally speaking, tourism falls into four major categories: ski resort winter and non-winter activities, adventure tourism, agritourism, and heritage (historical) tourism. A summary description of each category is provided below: Ski Resort Winter and Non-Winter Activities. In addition to winter recreation, summertime activities and amenities are an emerging trend at ski resorts. For ski resorts on federal land, this trend was facilitated by passage of the Ski Area Recreational Opportunity Enhancement Act in Several Tahoe area ski resorts have constructed, or are planning to construct, new summertime (non-winter) attractions, such as zip-lines, climbing walls, rock climbing, gravity-power coasters, and mountain biking terrain. These new activities are expected to drive additional visitation to the resorts that offer them. Although prospects are good for the ski resort industry overall, it is an industry that is very sensitive to weather conditions. The recent shorter winters and reduced snowfall have negatively impacted ski resort revenue. Despite this fact, the prospects are strong for steady growth in ski resort-related activity in the Study Area, at least in the short and medium term. It is projected that the Study Area ski resort industry will continue to grow at a rate of about four percent per decade. 12 Adventure Tourism. Also known as Adventure Travel. According to the Adventure Travel Trade Association, adventure travel may be any tourist activity including two of the following three components: a physical activity (with perceived or possible risk) and potentially requiring some specialized skills, a cultural exchange or interaction, and engagement with nature. Adventure tourism includes activities such as rock climbing, mountain biking, whitewater rafting, cultural experiences that include physical activity, and other physical activities. All of these and more are available in the Study Area. 10 Economic Planning Systems, Inc., Market Study for the Bay to Basin Recreation and Tourism Rural Roadway Impact Study, October US Travel Association, 12 Economic Planning Systems, Inc., Market Study for the Bay to Basin Recreation and Tourism Rural Roadway Impact Study, October 2013 October
61 Adventure tourism is one of the fastest growing segments in the industry. Recent estimates indicate a 65 percent rate of growth in the adventure tourism market from 2009 to The Tourism Market Study anticipates that adventure tourism opportunities within the Study Area will continue to do well and have a solid potential for future growth. Agritourism. Agritourism is a commercial enterprise at a working farm, ranch, or agricultural facility conducted for the enjoyment or education of visitors. Agritourism often generates supplemental income for the owner. Agritourism can include farm stands or shops, U-pick, farm stays, tours, on-farm classes, fairs, festivals, pumpkin patches, Christmas tree farms, winery tours and wine tasting, orchard dinners, barn dances, guest ranches, and more. 14 There are many existing agritourism and viticultural attractions and opportunities within the Study Area. Wineries in Amador, El Dorado, Placer, and Nevada counties have gained from increased notoriety in recent years. Today, the region is home to more than 140 wineries, all benefiting from a serene and relaxed setting, close proximity to major population centers, and a variety of high-quality winemaking operations. Visitors can experience wine country and wine tasting with guided tours (offered by a number of professional tour operators), follow existing wine trails, or travel the roadway network and explore the wine region by car. Beyond wine, there are other agricultural and food-related activities to explore in the Study Area. These include farmers markets, working farms and ranches, and flower growing areas, such as Daffodil Hill (near the community of Volcano in Amador County). Apple Hill, in El Dorado County, is a relatively wellknown and successful area featuring more than 50 orchard farms offering a variety of agritourism activities. It is expected that market prospects for agritourism will continue to be positive, with growth projected each year. Heritage Tourism. Also known as Historical or Cultural Tourism. Heritage tourism is defined as travel to experience the places, artifacts, and activities that authentically represent the stories and people of the past. Worldwide, heritage tourism is estimated to account for approximately 20 percent of total trips. Travelers classified as cultural or heritage tourists tend to travel more frequently, an average of 5.01 leisure trips per year, as compared with 3.98 trips per year for non-heritage travelers. 15 Many of the small historic towns scattered throughout the Study Area derive a large proportion of their tourism visitation from those who want to visit authentic historic sites. These include the many state parks now located in areas that originally came to life during the California Gold Rush and western settlement. Combining visits to historic sites with other activities such as dining, shopping, or outdoor recreation can make for a very compelling tourism experience. Tourism Market Study authors consider 13 Adventure Travel Trade Association and George Washington University, Adventure Tourism Market Study, University California Cooperative Extension, Small Farm Program, 15 According to the U.S. Cultural and Heritage Tourism Study, prepared by Mandala Research, LLC, October
62 the prospects for continued growth in heritage tourism to be strong, 16 particularly given the rich history of communities and places within the Study Area. Other Tourist Activities Many acres of state and federal lands are located in the region. These include federally owned recreation lands as well as state parks. These lands offer camping, hiking, boating, fishing, cycling, and much more. The Study Area also features golf, team sports, casino gaming, and a diverse array of special events that generate tourism travel and expenditures year round. 4.2 GEOGRAPHICAL AREAS EVALUATED IN THE TOURISM MARKET STUDY The Market Study evaluated existing tourist related opportunities, analyzed existing overnight accommodations, tourism performance, and future tourism prospects for five geographical areas: Amador County, Apple Hill and the El Dorado County wine country, Nevada County, Placer County, and Lake Tahoe. Amador County Amador County is often called The Heart of the Mother Lode. It is named after Jose Maria Amador, a soldier, rancher, and miner who was born in San Francisco in In 1848, in partnership with a group of Native Americans, he established a gold mining camp near the present-day town of Amador City. Some of the Mother Lode s most successful gold mines were located in Amador County. The county was first created by the California Legislature on May 11, 1854, and later split into Amador, Calaveras, and El Dorado counties. In 1864, part of Amador was given to neighboring Alpine County. Amador is located approximately 55 miles southeast of Sacramento. It ranges in elevation from about 250 feet in the western portion of the county to over 9,000 feet in the east. The vast majority of its population of 38,091 (2010 Census) lives in the unincorporated areas, with the two largest towns being Ione and Jackson, the county seat. Population growth in Amador County has been relatively flat over the past ten years, with some moderate growth in Jackson and small declines in Amador and Plymouth. 17 Today, in addition to its rich Gold Rush history, Amador County is becoming increasingly well known for its viticulture, such as in the Shenandoah Valley. Zinfandel is one of Amador s most popular and awardwinning varietals. Some of the Zinfandel vineyards in the county are more than 125 years old. More than 40 different wineries now call Amador County home. Amador County also offers gold panning and underground cave tours (Black Chasm in Volcano), along with a diversity of shopping, dining, colorful special events, and outdoor activities that are a signature of the entire Study Area. Water bodies in the county include Lake Amador, Lake Camanche, Pardee Reservoir, Bear River Reservoir, Silver Lake, Cosumnes River, Mokelumne River, and Sutter Creek. The major highways that criss-cross Amador County include SRs 16, 49, 88, and Economic Planning Systems, Inc., Market Study for the Bay to Basin Recreation and Tourism Rural Roadway Impact Study, October Economic Planning Systems, Inc., Market Study for the Bay to Basin Recreation and Tourism Rural Roadway Impact Study, October 2013 October

63 Apple Hill and the El Dorado County Wine Country Bay To Tahoe Basin Recreation and The Market Study looked at two areas of El Dorado County tourism separately. This part of the report focused on the Placerville, Apple Hill, Camino, Pollack Pines, Coloma, El Dorado, and the west slope communities of Shingle Springs, Cameron Park and El Dorado Hills. Tourism in the eastern communities of South Lake Tahoe and Meyers is discussed in the Lake Tahoe section, below. El Dorado was the area in which James W. Marshall first discovered gold in California, in His discovery at Sutter s Mill sparked the famed California Gold Rush and a huge influx of population. El Dorado County was incorporated in February of The site where gold was first discovered is today part of the Marshall Gold Discovery State Historic Park. The park includes much of the historic town of Coloma, now considered a ghost town as well as a National Historic Landmark District. As of the 2010 Census, the El Dorado County s population was 181,058. There are two incorporated cities in the county - South Lake Tahoe is the largest in terms of population and land area. Placerville is the county seat. As the greater Sacramento metropolitan region has expanded into the lower foothills, El Dorado s population has increased. From 2002 to 2012, a population growth of 15 percent occurred in the unincorporated portion of the county, while South Lake Tahoe lost approximately ten percent and Placerville remained flat. 18 Despite its growth in some areas, El Dorado County is still considered and designated largely rural. The major tourism destinations in this western portion of El Dorado County are Placerville, Apple Hill, Coloma (Marshall Gold Discovery State Historic Park), and other mining towns, including El Dorado and Georgetown (formerly known as Growlersburg). Both El Dorado and Georgetown are registered State Historical Landmarks. There are also many wine growing and winery destinations, and numerous outdoor recreation sites and opportunities throughout the county. Apple Hill is a well-established regional agritourism attraction focused on orchard and produce harvests and value-added products from local farms. Its profile and popularity are increasing as Apple Hill taps into the expanding local foods movement. Established in 1983, the El Dorado American Viticultural Area (AVA, also known as an appellation ) includes those portions of the county bounded on the north by the Middle Fork of the American River, and on the south by the South Fork of the Cosumnes River. El Dorado s appellation is unique due to its high elevation and complex topography, creating a diversity of microclimates and growing conditions not found in other regions. The major highways that traverse El Dorado County are US 50, and SRs 49, 89, and 193. Nevada County Nevada County was created in 1851 from parts of Yuba County. The county was named after the mining town of Nevada City, a name derived from the term Sierra Nevada. The word nevada is Spanish for snowy or snow covered. The bordering state of Nevada adopted the same name in The region 18 ibid October
64 came to life in the Gold Rush of Many historical sites remain to mark the birth of this important area during California s formative years. Among them is the Nevada Theatre in Nevada City, said to be the oldest theatre built in California (1865). It once hosted Mark Twain, among other historical figures. The historic Holbrooke Hotel in Grass Valley opened in It also hosted Mark Twain and four U.S. presidents (U.S. Grant, Grover Cleveland, Benjamin Harrison, and James A. Garfield). The gold industry in Nevada County thrived into the post World War II era. Many technological firsts in the 19th and 20th centuries occurred in Nevada County. The first longdistance telephone in the world (1877) connected two Nevada County communities. The Pelton wheel, a water impulse turbine, was invented in the region in the 1870s and still powers hydroelectric generators today. Nevada City and Grass Valley were among the first communities in California with electric lights. More recently, the first commercially viable picture phone was developed in Nevada City. More than 50 high tech and applied technology companies and many hardware and software design professionals call Nevada County home. The county is sometimes referred to as the Silicon Valley of the Sierra. In addition to its three incorporated cities (Nevada City, Grass Valley, and the Town of Truckee), Nevada County includes two significant unincorporated communities that are popular tourism centers Penn Valley and Rough and Ready. Population growth in Nevada County has been relatively slow over the past ten years. With the notable exception of Truckee, which added about 1,200 residents over the same period, other areas of the county have experienced an average growth rate of 2.2 percent. 19 Nevada County s total population in 2010 was 98,764. In addition to its historic sites, Nevada County has many outdoor recreational opportunities, including world-class fishing, snow sports, back packing and hiking. Nevada County has wineries too, including Indians Springs Vineyards, Nevada City Winery, and Truckee River Winery. In addition to the history and attractions of Nevada City and Grass Valley, Truckee, in eastern Nevada County, is a major hub of tourism activity with a rich history of its own. Originally known as Coburn Station, Truckee was named after a Paiute tribal Chief. The first Europeans who came to cross the Sierra Nevada encountered his tribe. Chief Truckee later became a guide for the famed explorer John C. Fremont. Some consider the ill-fated Donner Party ordeal to be Truckee s most famous historical event. The Donner Memorial State Park is dedicated to these early Californiabound settlers. But Truckee offers a great deal more history and historical sites. The community s growth was primarily triggered by the construction and subsequent operation of the transcontinental railroad. Union Pacific operates the railroad today. The Town of Truckee was formally incorporated in It is located on both sides of busy I-80, just north of Lake Tahoe, in the heart of the world-class skiing and centrally located to other outdoor recreational opportunities available in the greater Tahoe-Truckee-northern Sierra region. Placer County Placer County encompasses an area that stretches from the suburbs of Sacramento to Lake Tahoe and the Nevada border. It includes the incorporated cities of Roseville, Lincoln, Rocklin, Loomis, Auburn 19 Economic Planning Systems, Inc., Market Study for the Bay to Basin Recreation and Tourism Rural Roadway Impact Study, October 2013 October

65 (county seat), and Colfax. Placer County has a large number of unincorporated communities and many popular tourism destinations. The discovery of gold in 1848 brought tens of thousands of miners from around the world, in addition to many thousands more people intending to provide the miners with goods and services. Only three years after gold was discovered, the rapidly growing area that became Placer County was formed from portions of Sutter and Yuba counties. Placer took its name from the Spanish word for sand or gravel deposits containing gold. The county has experienced several periods of rapid growth, including over the past ten years, with a 34 percent total increase during that time. Much of this growth was attributed to its popular cities adjacent to the Sacramento area, such as Roseville (43 percent growth since 2002), and Lincoln (146 percent since 2002). Unincorporated areas in Placer County have experienced much slower growth, closer to nine percent overall. 20 Some communities in eastern Placer County around Lake Tahoe have actually lost permanent population during the same period. As of the 2010 Census, Placer County s total population was 348,432. Tourism opportunities and destinations in Placer County are divided on a geographical basis. Placer Valley includes Roseville, Rocklin and Lincoln. Gold Country includes the foothills and communities of Loomis, Auburn, Foresthill and Colfax. The High Country includes the High Sierra and the north and west shores of Lake Tahoe. Unincorporated communities in the High Country include Olympic Valley (home to Squaw Valley Ski Resort and site of the 1960 Olympic Winter Games), Alpine Meadows, Tahoe City, Kings Beach, Homewood, and Northstar. 21 Each of the three Placer tourism regions offers a unique experience, from shopping and dining, areas of agriculture and viticulture, to historic towns and sites, outdoor adventure, and the world famous year round activities of Lake Tahoe. The main travel routes that serve Placer County are I-80, and SRs 65, 49, 174, 89, 267, and 28. Lake Tahoe Lake Tahoe is sometimes referred to as the Lake Tahoe Basin (this typically means the boundaries of the Lake Tahoe watershed) or the Lake Tahoe region, encompassing some areas outside but adjacent to the Tahoe watershed. At North Lake Tahoe, some people refer to the North Tahoe Lake-Truckee Resort Triangle. This is an area in and around the triangle bounded by I-80, SR 89 and SR 267. The southernmost part of the triangle is within the Tahoe Basin, the rest is just outside, to the north and west. Lake Tahoe is the second largest lake in the world at or above 6,225 (historic sea level) and the 11th deepest lake in the world. It is recognized in 20 ibid 21 Placer County Visitors Bureau, October
66 particular for its clear, pure water. Given Tahoe s stature and memorable scenic vistas, it is not surprising that SR 89 along the Lake s west shore experiences significant peak season tourism-related traffic and congestion. Lake Tahoe is designated as an Outstanding National Resource Water (ONRW) under the Federal Clean Water Act. Established through a bi-state agreement between California and Nevada and ratified by Congress (Public Law ), TRPA regulates land use and other planning considerations. TRPA is responsible for ensuring that Tahoe achieves and maintains a stringent set of environmental standards. The Lake s earliest inhabitants, the Washoe Tribe, demonstrated a deep respect for the fragile environment that was their home and still revere this magnificent place. An abundance of recreational opportunities and scenic vistas have made Lake Tahoe a top national and international tourist destination. Nestled on the California-Nevada State line between the Sierra Nevada and the Carson Range, Lake Tahoe is regarded as an iconic tourism destination in both states. Lake Tahoe s tourism market has two centers, the north and south shore, each with its own unique characteristics and appeal. Accordingly, the Tourism Market Study evaluates North Lake Tahoe and South Lake Tahoe separately. North Lake Tahoe The North Shore of Lake Tahoe is comprised of a string of unincorporated communities in Placer County, including Tahoe City, Homewood, Carnelian Bay, Tahoe Vista and Kings Beach; and two in Washoe County, Nevada, Incline Village and Crystal Bay. Lake Tahoe bills itself as the largest concentration of skiing in North America. However most of the resorts are in the greater North Lake Tahoe area (eastern Placer County). These include Squaw Valley, Alpine Meadows, Northstar, Homewood, Granlibakken, Sugar Bowl, Boreal, Tahoe Donner, Donner Ski Ranch, and several cross-country ski areas. Diamond Peak and Mount Rose-Ski Tahoe are located in the Washoe County portion of North Lake Tahoe. The larger resorts are working to expand their summer (non-winter) activities in a calculated move to become more year round destinations. Water sports and outdoor recreation are virtually limitless in season. Over recent years, North Lake Tahoe has expanded its reputation as a venue for special events, including music festivals, concerts, cycling races, and extreme sports such as Ironman Lake Tahoe. Options for dining and nightlife are diverse. The pace of North Lake Tahoe is considered a bit slower than South Lake Tahoe, and the scale of its communities comparatively smaller. SRs 89, 267, and 28 serve the North Lake Tahoe area, with major access to these routes provided by I-80. South Lake Tahoe Although there have been profound changes in the gaming industry, tourism on the South Shore is still dominated by the hotel-casino resorts of Stateline, Nevada. Harrah s, Harveys, Mont Bleu, and the new Hard Rock Hotel and Casino are the largest of these. (The Hard Rock is scheduled to open in late 2014, following a major remodel of the former Horizon Hotel and Casino Resort). Lakeside Inn and Casino is popular with many local residents. Nightlife on the South Shore continues to be a 24-hour scene. Designed by George Fazio, the Edgewood Tahoe Golf Course is rated by Golf Digest Magazine as one of America s Top Golf Courses. Each July, Edgewood is home to the American Century Celebrity Golf Championship, a star-studded event broadcast on national television featuring some of the biggest names in sports, entertainment, and politics. Construction of an approved, best-in-class lodge on the October
67 grounds of Edgewood Tahoe is scheduled to begin in The resort will feature 154 hotel rooms, some fractional ownership residences and other resort amenities. Opening is anticipated by the winter of Heavenly Mountain Resort overlooks the entire South Shore, offering expansive ski and snowboard terrain in both California and Nevada. The Gondola at Heavenly is also considered a world-class attraction. You don t have to be a skier or snowboarder to enjoy the 2.4-mile scenic ride up the mountain. Heavenly is making a substantial investment in summer activities offered on the mountain, including ropes courses, outdoor climbing wall, zip line, summer tubing, and, of course, hiking. The entire South Shore is a gateway to a diverse array of outdoors and backcountry recreation. At the base of the gondola, Heavenly Village bustles with shops, restaurants, and special events. Several of South Lake Tahoe s finest lodging properties are nearby, including the Lake Tahoe Resort Hotel, Marriott Timber Lodge, and a Marriott Grand Residence. Across the street, construction on the Chateau at Heavenly Village was completed in the summer of 2014 with its first tenants expected in the fall. Other areas of the South Shore are also undergoing a renaissance. Lakeview Commons in mid-town is a new lakefront public gathering place. It features a regular schedule of summer concerts, stand-up paddle events, boating, swimming and more. Ski Run Boulevard is also emerging as a destination for shopping, dining, lodging, and special events. The South Shore also has historic resorts, such as Camp Richardson Resort on the Tahoe s south west shore. Some challenges with an aging tourism product remain, but, after many years of decline, the South Shore of Lake Tahoe seems poised for a comeback. 4.3 TOURISM TRENDS As part of the Market Study, EPS completed an analysis of key performance indicator data. This included visitor spending, visitation, transient occupancy tax, sales tax, and other key metrics. This analysis found that tourism activity within the Study Area is projected to grow at a rate of approximately three percent per year, reversing an overall decline in tourism between 2007 and 2009 as a result of the Great Recession. As shown in Figure 4-1, all four Study Area counties experienced a relatively steady increase in tourism from 2000 to From 2006, spending began to flatten out, until 2009 when spending decreased as effects of the Great Recession took hold. Since 2009, visitor spending has been back on an upward trajectory. Spending now approximates the level seen during the peak that occurred during the middle part of the decade Economic Planning Systems, Inc., Market Study for the Bay to Basin Recreation and Tourism Rural Roadway Impact Study, October 2013 October
68 Amador County El Dorado Nevada Placer North Lake Tahoe Figure 4-1 Total Annual Travel Expenditures* *Annual travel expenditure data is only available for North Lake Tahoe from 2003 to 2011 and travel expenditure data is not available for South Lake Tahoe. 23 The Market Study included an analysis of Transient Occupancy Tax (TOT) for each county. TOT is collected in California as authorized under State Revenue and Taxation Code 7280 and is an additional source of non-property tax revenue for local governments. TOT is charged to transient guests who occupy a room for a period of less than thirty (30) consecutive calendar days, counting portions of calendar days as full days. Evaluating TOT is a good method for monitoring tourism levels, as it reflects most overnight visits within a specific jurisdiction. Figure 4-2 documents that all four counties in the Study Area experienced a double-digit increase in TOT collections from 2002 and All reflected a decline in 2008, associated with the Great Recession, but the TOT figures have since regained an upward trend. The average annual change also shows a positive trend for collections that is predicted to continue in the near future. El Dorado County had the lowest annual average change, at 0.90 percent. The study shows this is primarily due to declines in overnight stays in South Lake Tahoe. Placer County had the highest annual average percent change in TOT collections, at 3.10 percent. 23 ibid October
69 45.00% 40.00% 39% 40% 35.00% 30.00% 30.00% 25.00% 20.00% 15.00% 10.00% 5.00% 0.00% 10% 2.40% 3.00% 3.10% 0.90% Amador El Dorado Nevada Placer % Change From 2002 to 2012 Average Annual % Change Figure 4-2 Summary Of TOT Collections By County 4.4 ASSESSMENT OF TOURISM PERFORMANCE Overall, tourism spending and TOT collection within the Study Area have shown a steady increase over the past ten years. However, both have reflected vulnerability to decline if the general economy is depressed, as it was during the Great Recession (2007 to 2009). Since 2008, tourism spending and TOT collections have rebounded to the levels seen prior to The individual communities (cities, towns, counties) that have focused on reinventing and/or reinvesting their tourism product, such as the North Lake Tahoe area or Nevada County, are likely to see higher than previous increases in their tourism related revenue streams. However, those communities that do not have any planned improvements to their tourism product will not likely see an increase over the average growth they have experienced over the past ten years. Market Study authors prepared a general overall assessment for each of the geographical areas evaluated: Amador County Amador County s competitive position in the tourism market is not expected to markedly change in the future, unless there is some type of major investment in a new or existing tourist-related attraction or amenity. The Study indicated future growth in Amador County visitor spending will likely range between two and three percent in the near term. However, some of the county s more popular attractions, such 24 Economic Planning Systems, Inc., Market Study for the Bay to Basin Recreation and Tourism Rural Roadway Impact Study, October 2013 October

70 as the Shenandoah Valley and Sutter Creek, may experience higher levels of growth due to ongoing market efforts. 25 El Dorado County Apple Hill and Wine Country Nevada County It is anticipated that spending in these regions of the El Dorado County will continue to increase at a health rate of between three and five percent per year. Active marketing efforts associated with many agritourism offerings, such as those conducted by the Apple Hill Grower s Association and the El Dorado Winery Association, are expected to have a continued positive impact on tourism market share. Enhancing these efforts and the targeting of specific demographics within the Sacramento and Bay Area regions (as supported by information obtained through the Public Opinion and Research Study) would likely increase the projected rate of growth. 26 Overall visitor spending in the county has shown growth every year over the past ten years, with the exception of a decline in In general, TOT collections have increased, however the rate of increase has varied amongst the jurisdictions. Nevada City and the Town of Truckee have experienced healthy growth rates. Grass Valley has achieved an extremely strong increase of 15.1 percent per year. Planned tourism related improvements in the Town of Truckee and the implementation of county wide marketing strategies should ensure that Nevada County continues to realize increased visitor spending at a rate of two to three percent, per year. 27 Placer County Outside of the Tahoe Basin, Placer County s tourism performance is projected to show modest growth. The Placer Valley area (Roseville, Rocklin and Lincoln) is expected to experience growth in tourism spending, but at a somewhat reduced rate compared to increases over the past ten years. Percentage increases in TOT during this period were largely driven by the construction of new lodging facilities in Roseville and Lincoln. However, Lincoln is expected to level out. At the time of this report, no more new facilities were being planned. The Gold Country (the foothills and, specifically Loomis, Auburn, Foresthill, and Colfax) has fewer rooms than other areas of the county; however, it is considered to have good growth potential due to the many recreational, agritourism, and heritage tourism opportunities available. Tourism in the High Country is covered in the North Lake Tahoe section, below. Overall visitor spending in Placer County grew at an annual rate of three percent per year from 2000 to The County in general is expected to see growth at a healthy rate of three to four percent, per year Economic Planning Systems, Inc., Market Study for the Bay to Basin Recreation and Tourism Rural Roadway Impact Study, October ibid 27 ibid 28 Economic Planning Systems, Inc., Market Study for the Bay to Basin Recreation and Tourism Rural Roadway Impact Study, October 2013 October
71 Lake Tahoe (North Shore and South Shore) Tourism in the North Lake Tahoe area (eastern Placer County, not just within the Tahoe Basin) is a primary economic driver for the area and the primary producer of TOT revenue in unincorporated Placer County. There are focused efforts underway to improve the area s tourism product. Visitor spending grew steadily at a rate of four percent per year from 2003 to 2012, even through the economic downturn of the Great Recession. It is expected the area will continue to realize visitor-spending growth in the range of three to five percent, per year, with a high potential to exceed five percent due to planned developments designed to further enhance and increase tourism opportunities (at the time of this report, most of these improvements are anticipated in Squaw Valley and Northstar, but also at Homewood Mountain Resort on Tahoe s West Shore, where a significant resort upgrade has been approved). The South Shore generates more tourism than any other region in the Study Area. However, visitation and visitor spending had been trending downward for many years. Finally, the last two years have reflected some improvement. Unlike other sub-regions in the Study Area, tourism on the South Shore began to decline before the Great Recession, in large measure due to changes in the gaming industry. It is projected that visiting spending in the South Shore will remain relatively flat, perhaps mimicking the slight upward trend of the past two years. Assuming approved new facilities come on line, such as the Edgewood Tahoe Lodge, the area could realize a modest rate of growth at between one and three percent, per year. If more substantial improvements are undertaken, the tourism growth rate could be much greater. 4.5 IMPLEMENTATION OF TOURISM MARKET STUDY FINDINGS The complete Market Study contains a significant amount of information. The use of this information by individual jurisdictions within the Study Area will depend on their specific needs and interests. From a regional perspective, the Market Study supports the following recommendations: Market Study Recommendation 1 (MS-1) Evolution and Enhancement of the Existing Tourism Product is Essential In order for a jurisdiction to maximize the economic benefits associated with its tourism product, a continuous effort must be made to enhance and evolve the product. Tourists will continue to have higher expectations from every products and services offered. They expect appealing accommodations, a diverse range of activities, effective transportation, and a variety of shopping and dining options. Jurisdictions within the Study Area have a unique blend of historic sites and points of interest, authentic agritourism experiences, including locally grown wines and farm products, and a world-class array of outdoor recreational activities and adventures. Those areas that have nurtured and improved their tourism assets have experienced relatively health rates of growth. Those that have not enhanced or continuously improved their products and marketing efforts have seen the lack of investment reflected in a decline of tourism market share. October
72 Recommendation MS-2 Packaging Tourist Offerings Bay To Tahoe Basin Recreation and The packaging of tourism offerings can be an effective strategy for increased revenues. The multi-day visitor spends more money than a day or one-night visitor. A package with lodging and selected activities, such as white water rafting and camping or with agritourism experiences (just two examples), reinforces the diversity of a destination, and allows visitors to plan in advance a more memorable, multifaceted vacation. Recommendation MS-3 Enhance Tourist Transportation and Connectivity This Market Study and other economic evaluations completed for tourism destinations confirm that effective, easy-to-use transportation that provides access to tourism offerings is a key element to the success of a tourism market. This conclusion was further supported by data from the Public Opinion and Research Study (PORS) summarized in Chapter 2 of this report. Transit: According to PORS findings, a significant percentage of respondents indicated that would likely try transit if it were easy to access and use (seven percent said they use it already; 18 percent said they would use it; 33 percent would give it a try). Better transit connections between the urban centers (Bay Area and Sacramento regions) and the Lake Tahoe Study Area must be made. Additionally, there is a serious lack of interconnectivity between communities within the Lake Tahoe region that must be addressed. Packaging tourism activities with public transit could represent an opportunity to increase market share from the Bay Area and Sacramento regions. Pedestrian Friendly, Walking, and Biking: Towns like Sutter Creek and Truckee that have focused on reinventing themselves as pedestrian and bike friendly areas have seen related increases in tourism expenditures. Congestion without mobility mode choices works to depress spending. All communities in the Study Area should focus on developing pedestrian friendly areas that are conducive to walking and biking and connected to transit services. Signage and Wayfinding: Signage and wayfinding features are important elements of an overall tourism experience. Visitors are more likely to stop and visit if an area is easy to find and accessible. This fact was reinforced by data obtained from the Public Opinion and Research Study (Chapter 2). Many respondents said they would be more likely to stop at communities along the way (to their final destination) if there was better signage, access, and lighting. It is recommended that all communities complete a signage and wayfinding evaluation and take actions to ensure to visitors can easily find tourist destinations, parking, and transit services. Recommendation MS-4 Traveler/Tourist Information Areas within the Study Area that have well coordinated strategies and channels for the dissemination of visitor information realize a larger share of the tourism market. Apple Hill is a great example. The area s numerous growers consolidate marketing efforts. Apple Hill is now one of the most successful agritourism regions in the Study Area. Today s visitors expect to be able to easily find travel information prior to travel and during travel. As indicated in the Public Opinion and Research Study, the majority of travelers obtained information from the Internet. Prior to travel, they use their desktops and laptops. October
73 During travel, they use their smartphone or tablets. With both approaches, respondents indicated they prefer using a website rather than an application. 29 It is recommended that efforts to provide traveler and tourist information be coordinated. Where feasible, marketing should also be coordinated. 29 William M. Cromer, Analysis of the Public Opinion Studies of the Bay-to-Basin Project Memorandum, November 14, 2013 October
74 5 RECOMMENDATIONS TO IMPROVE THE TRAVELER EXPERIENCE 5.1 BACKGROUND RECOMMENDATIONS TO IMPROVE THE TRAVELER EXPERIENCE As documented in this Study, tourism travel is a significant percentage of the traffic on US 50 and I-80, and, to a somewhat lesser extent, on other roadways in the Study Area. There are both peak and nonpeak impacts, but tourism traffic is clearly substantial 12 months of the year. The recommendations in this Chapter are based on the analysis of existing traffic conditions (Chapter 1), the needs and perspectives of Study Area travelers as expressed in the Public Opinion and Research Study (Chapter 2), the analysis of traffic data collected using Bluetooth technology (Chapter 3), and the Tourism Market Study (Chapter 5). Designed to address and improve the tourism traveler experience, Study authors believe the recommendations will benefit all users of the Study Area travel corridors, including the movement of goods and commerce. The implementation of these recommendations will benefit state, regional, and local tourism and economic sustainability. As a quick summary, recommendations have been developed to address the following identified impacts and needs: Traffic congestion and projected declines in LOS on highways and roadways throughout the Study Area, including US 50 and I-80. Lack of adequate traveler information, for purposes of trip planning and real-time updates along the route. Lack of adequate directional and wayfinding signage. Highway safety and maintenance needs. The need for improved highway ingress and egress. The need for expanded, improved public transit options along major travel corridors. The need for greater interregional cooperation among state and local jurisdictions and transportation planning agencies, including collaboration in the effort to identify new opportunities and sources for funding. 5.2 SPECIFIC RECOMMENDATIONS ITS This and other studies have recognized that increasing highway and roadway capacity in the Bay to Basin Study Area is challenged by terrain, environmental considerations, and cost considerations. Expanding ITS and information sharing technologies is a more cost-effective solution to reducing congestion and improving the capacity of existing infrastructure. To better manage the flow of traffic and improve the traveler experience, the following ITS solutions are recommended. They should be pursued with a sense of urgency. ITS R-1. Review, update and expand ITS planning and implementation on priority highway corridors within the Study Area. Secure additional funding to accelerate implementation. This should be a October
75 collaborative effort involving Caltrans and local transportation planning jurisdictions. Based on Study findings, US 50 should be an immediate top priority. ITS R-2. Expand the network of information-sharing technologies. It is recommended that Caltrans and local jurisdictions coordinate the installation and operation of additional CMS and other information sharing technologies to provide true real-time travel information to travelers on routes within the Study Area. Information gathering technologies should be combined with information sharing technologies to maximize the benefits of this approach to managing traffic and improving the traveler experience. Directional and Wayfinding Signage Tourists not familiar with a specific destination are less likely to venture off the highway to explore surrounding communities and attractions if directional and wayfinding signage is non-existent or inadequate, or if access on and off the primary travel corridor is difficult. Here again, respondents to the Public Opinion and Research user survey identified US 50 as a priority for signage and access improvements. Definition of Wayfinding Signage. Wayfinding refers to signage that helps people find their way between points of travel or to navigate a location for pleasure (recreational wayfinding). In addition to recreation, applications can include commercial districts and frequented government offices. Modern wayfinding signage has begun to incorporate research on why travelers get lost, how they react to signage, and how signage systems can be improved. Signage Recommendation (SR)-1. Install informational signage regarding the services and amenities available at specific highway exits. SR-2. Install wayfinding signage. Install wayfinding signage to guide tourists to recreational and tourism opportunities (as described in Chapter 4) and commercial districts (dining and shopping). Note: To maximize the value of both informational and wayfinding signage, a complete approach should include signage for how travelers can exit and re-enter the main highway or travel corridor. Access and Safety Not all highway ramp configurations are conducive to safe exits and returns by those unfamiliar with the area. Sixty percent of respondents to the Public Opinion and Research telephone survey indicated better highway ingress and egress was important to them in considering whether they would visit an interim destination on their way to a final destination (such as Lake Tahoe, as one example). Respondents also identified better lighting as needed for safer highway exits and re-enters. Access Recommendation (AR)-1. Review all ramp configurations to determine if modifications are needed to improve access, such as the construction of deceleration or acceleration lanes, shoulder widening, and safety and/or lighting improvements. AR-2. Ensure all exits that lead to traveler services, such as gas/electric charging stations, food establishments, and restrooms, are appropriately illuminated to support safe navigation. AR-3. Consider the use of LED adaptive lighting that allows for energy savings and the ability to dim streetlights at certain times of the day. Controls that allow operators to adjust street lighting power to October
76 meet minimum performance criteria, even to adaptively adjust light levels based on changing conditions, offer energy savings and reduce unnecessary light pollution. Transit Connectivity and Ease of Access Existing transit services to and within the Lake Tahoe region (Lake Study Area) are disconnected, difficult to access and not as user friendly as needed. In the broader region (Study Area), existing transit services are more widely scattered and often established primarily for local residents, not to meet the needs of tourists. A successful tourism destination is often defined by its ability to effective mode choice to and from and dispersal throughout the destination. The dispersal of visitors can deliver economic, social, and environmental benefits, including, but not limited to: reduced congestion and improved traffic management, and reduced air pollution and GHG emissions. It can also diversify and increase visitor spending and enhance the visitor experience. Survey respondents (Chapter 2) indicated a very low use of existing transit by visitors to the Study Area. Transit operators in the region have supported this finding, anecdotally. Of interest, over 50 percent of those surveyed said they would be willing to try transit if it were more connected and easier to use. To improve transit connectivity and ease of access, the following actions are recommended: Transit Connectivity Recommendation (TCR)-1. Coordinate transit on a regional basis to improve connectivity. Identify and serve routes that can connect between tourism destinations throughout the entire region, in and outside of the Tahoe Basin. TCR-2. Identify transit routes from major population centers (Bay Area and Sacramento) likely to generate the highest ridership, and pursue the funding and support needed to ensure the routes operate effectively to connect with tourist destinations. TCR-3. Identify transit routes that would connect travelers to recreation opportunities and study the feasibility of operating those routes. TCR-4. Plan future transit services to accommodate the seasonal influx of visitors. Modify schedules, use adaptive transit stop locations (based on seasonal interests and use), and allow levels of transit service to fluctuate consistent with peak tourism demands. TCR-5. Identify parking opportunities for travelers who prefer to drive a car to their tourist destination, then park and explore the area by walking, biking, or using transit. TCR-6. Establish public-private partnerships to provide transit connectivity to privately owned tourism destinations or recreational sites. TCR-7. Consider creating a cross-jurisdictional transit pass system that can be accepted by transit providers throughout the Study Area. Dissemination of Traveler Information Currently there is no consistent coordinated effort in the Study Area to gather and disseminate traveler information, either before or during a trip. As confirmed in the user survey (Chapter 2), respondents indicated they most often receive information about travel by word of mouth or the Internet. They said October
77 they would be more likely to visit the Study Area if they had access to real-time information, both prior to and during their trip. To improve the collection and dissemination of real-time traveler information, the following actions are recommended: Traveler Information Recommendation (TIR)-1. Develop a mechanism to gather and provide real-time travel related information to disseminate on the Internet. TIR-2. Coordinate the development of a traveler information dissemination study with the ITS solutions previously recommended (ITS R-1 and ITS R-2). Traveler information should be tied to the real-time collection of traffic related information (e.g., congestion, travel time, weather conditions, etc.) that can be obtained through ITS and other information gathering technologies. Note: Messaging must be consistent throughout the dissemination network. For example, information on CMS must be consistent with information available on the Internet. TIR-3. Establish public-private partnerships to assist with improving traffic management. For example, the staggering of hotel check-in and checkout times could assist with the metering of traffic volumes and flow. 5.3 CONSISTENCY IN PLANNING EFFORTS The Study Area crosses multiple jurisdictions and boundaries. There are a number of transportation agencies responsible for planning, maintenance and operations, and project delivery. Caltrans is responsible for Caltrans System Management Plans and Interregional Transportation Systems Plans for the regional and interregional routes managed by Caltrans. The RTPA for each geographical area is briefly described below. Amador County The Amador County Transportation Commission (ACTC) is the state-designated RTPA for Amador County and the Local Transportation Commission (LTC) serving the county. The ACTC completed an update to its RTP in 2004 and is currently in the process of completing a 2014 RTP update. 30 El Dorado County The EDCTC is the county s designated RTPA. Consistent with this function, EDCTC serves as the planning and programming authority for transportation projects on the western slope of El Dorado County, excluding those areas within the boundaries of TRPA. The RTP adopted by EDCTC includes a clear vision of its RTP goals, objectives and policies, complemented by short- and long-term strategies for implementation. 31 Nevada County The Nevada County Transportation Commission (NCTC) serves as that county s designated RTPA. NCTC adopted its 2010 RTP on July 20, This RTP documents the short-term (2010 to 2020) and long-term 30 Amador County Transportation Commission, 2004 Amador County Regional Transportation Plan Update October
78 (2020 to 2030) regional transportation policy direction; multi-modal transportation needs, and sets forth a financially constrained action plan to meet those needs. 32 It should be noted that NCTC is currently in the process of updating the 2015 RTP. Placer County The Placer County Transportation Planning Agency (PCTPA) is the state-designated RTPA for areas of Placer County outside of the Tahoe Basin and the boundary of TRPA. PCTPA is also the county s Congestion Management Agency (CMA), a statutorily designated member of the Capitol Corridor Joint Powers Agreement (CCJPA), the designated administrator for the South Placer Regional Transportation Authority (SPRTA) and the Western Placer Consolidated Transit Services Agency (WPCTSA). PCTPA adopted its current Regional Transportation Plan (2035 RTP) in and is currently working on update for consideration in the fall of Lake Tahoe In the Lake Tahoe Basin, TRPA is the State of California s designated RTPA. TRPA also serves at the Tahoe Metropolitan Planning Organization (TMPO), eligible to receive federal transportation planning funds. TRPA and TMPO take joint responsibility for maintaining and updating the Lake Tahoe Regional Transportation Plan. Tahoe s RTP is the transportation element of the Lake Tahoe Regional Plan, a broader plan that addresses all of TRPA s responsibilities under the Tahoe Bi-State Regional Planning Compact (PL ). Lake Tahoe s current RTP is Mobility Adopted in December 2012, Mobility 2035 was the first RTP in California to include a Sustainable Communities Strategy (SCS), consistent with the provisions of Senate Bill 375. This legislation requires MPOs to reduce GHG emissions from cars and light trucks in order to meet the targets established by the California Air Resources Board s Regional Targets Advisory Committee. California Department of Transportation Caltrans is responsible for interregional transportation planning and serves as the owner and operator of California s state highway system. Caltrans prepares Transportation Concept Reports (TCRs) that focus on particular routes, and Corridor System Management Plans (CSMPs) that function as a comprehensive integrated management plan for expanding transportation options, decreasing congestion, and improving travel times for larger transportation corridors. Caltrans District 3 has prepared CSMPs for I-80, US 50, and SR 89 within the Study Area. 31 El Dorado County Transportation Commission, El Dorado County Regional Transportation Plan Nevada County Transportation Commission, Nevada County 2010 Regional Transportation Plan 33 Placer County Transportation Planning Agency, Placer County 2035 Regional Transportation Plan, Tahoe Regional Planning Agency (TRPA) and the Tahoe Metropolitan Planning Organization, Regional Transportation Plan, Mobility 2035 October
79 Caltrans is also responsible for developing the Interregional Transportation Strategic Plan (ITSP), which consolidates and communicates key elements of its ongoing long- and short-range planning efforts. The Caltrans ITSP is a counterpart to the RTPs developed by the designated RTPAs. As such, it is important to seek and ensure consistency with each of the RTPA and Caltrans planning documents. Caltrans is the owner and operator of I-80, US 50 and all state highways within the Study Area, so it is also appropriate to seek consistency with Caltrans stated mission: Provide a safe, sustainable, integrated and efficient transportation system to enhance California s economy and livability. 35 Themes that are common to the various transportation planning documents and to Caltrans overall mission and goals are summarized in Table 5-1, below. Table 5-1: Overarching Themes Of Affected Agency Transportation Planning Documents 36 TRPA & Theme ACTC Caltrans EDCTC NCTC PCTPA TMPO Provide and maintain a safe, efficient, and convenient transportation system. Reduce environmental impacts and improve quality of life. Invest strategically in transportation services and facilities to improve mobility for people and goods movement. Enhance integration and connectivity of multi-modal transportation system. Strengthen economy by investing in transportation system. As shown, many of the RTPAs and Caltrans share the same commitment to improving the transportation system in a manner that reduces impacts on the environment, improves mobility, embraces the integration and connectivity of the multi-modal system, and enhances the economy. This Study clearly identifies tourism as the economic engine common to all jurisdictions in the Study Area. Tourism is also a major industry for the State of California. However, the resources needed to address ongoing tourist related impacts to the transportation system are not factored into existing transportation funding sources or distribution formulas. These are typically allocated based on permanent population. Transportation system impacts and needs in the Study Area are clearly beyond those of just local residents. The recommendation in Chapter 3 (TDC-1) to Develop a User Population is essential to proper planning and funding support for the transportation network that serves the Study Area. The recommendations in Section 5.4 are complementary to the overarching themes and goals of the RTPAs and Caltrans. The recommendations and outcomes of this Study will best be served if all Trans Sierra Coalition October
80 stakeholders take a coordinated regional approach to implementation. Without a planning and implementation partnership, the benefits of this Study will be greatly diminished. 5.4 RECOMMENDATIONS FOR COORDINATED REGIONAL AND INTERREGIONAL PLANNING Coordinated Planning Recommendation (CPR)-1. As transportation projects are planned and designed, consideration should be given the recommendations advanced in Section 5.2. For example, highway improvement projects should give consideration to the strategic placement of CMS, improved directional and wayfinding signage, improved highway access and safety, and improved lighting. As planning partners, local agencies should conduct specific evaluations of their areas of jurisdiction to help identify specific locations for these improvements. CPR-2. Tourists as a Recognized Population. It is important that tourists are recognized as part of the Study Area population, in addition to the resident based population (Total equals User Population). This approach will ensure that transportation planning and project delivery are based on true impact and need. Tourists have distinct needs when traveling. The elevated impacts and needs of consistently high volumes of tourist travelers must also be factored into the cost of highway and related infrastructure maintenance and operations. CPR-3. Future Interregional and RTP Updates. It is clear that tourism is key to the region s economy. Going forward, the regional and interregional transportation plans of all responsible jurisdictions in the Study Area, including local agencies and Caltrans, must consider and address the impacts and needs of the tourism traveler. Moving towards a more sustainable tourism industry will rely largely on planning for an integrated, multi-modal transportation network that gives appropriate consideration to congestion management, improved signage, highway access, parking and navigation improvements, an enhanced level maintenance and operational needs, and expanded transit services with improved connectivity. CPR-4. Regional Partnerships. Based on the findings and outcomes of this Study, a collaborative regional approach is recommended to many of the recommendations in Section 5.2. This is necessary to maximize the potential benefits that could be realized. For example, a regional partnership 1) could facilitate the development of an interconnected transit system; and 2) allow for congestion associated with peak tourism travel to be addressed on a region-wide basis. Additionally, ITS projects would be more effective if implemented based on a regional strategy, access to recreational locations and tourism opportunities could be enhanced, and the collection and dissemination of regionally significant travel related information would be more effective and efficient. CPR-5. Public-Private Partnerships: It is recommended that public-private partnerships be part of the coordinated local and regional approach to transportation and transit solutions. Many of the tourism opportunities in the Study Area are owned and operated by private entities. These entities also have a vested interest in improving the visitor experience. Appropriately addressing the impact of tourism travel is beneficial to their overall goals. Establishing new and/or expanding existing public-private partnerships in support of traveler information, transit, parking of more of the recommendations contained in this report would be mutually beneficial. Effective, ongoing public-private and regional partnerships are essential to maximize the benefits of the findings and recommendations contained in this Bay to Tahoe Basin Recreation and. October
81 Note: Additional work to establish the foundation for interregional and regional partnerships is underway through the Trans-Sierra Transportation Coalition. For more information, contact Carl Hasty at the Tahoe Transportation District. Mr. Carl Hasty, District Manager Tahoe Transportation District 128 Market Street, Suite 3-F Stateline, NV PO Box 499 Zephyr Cove, NV October
82 6 FUNDING ANALYSIS AND CREATING A PATH FORWARD California s transportation infrastructure is in crisis mode. Funding sources are inadequate to support the capital investments necessary to maintain California s position as the 8th largest economy in the world and achieve the sustainability and livability goals established by the Legislature, Brown Administration, and other state officials. In fact, funds are inadequate just to maintain existing infrastructure. State and other government leaders, private sector organizations, and a number of public-private sector advocacy groups have prepared and issued a series of reports documenting the crisis, identifying challenges, and offering recommendations for both short- and long-term solutions. 6.1 REPORT ON CALIFORNIA S UPDATED VISION FOR TRANSPORTATION INFRASTRUCTURE PRIORITIES Among the most recent reports is one issued by the California State Transportation Agency (CalSTA) in February 2014, entitled: California Transportation Infrastructure Priorities: Vision and Interim Recommendations. CalSTA sought assistance in preparing this report when it established the California Transportation Infrastructure Priorities (CTIP) workgroup in April Below are some excerpts from this report pertinent to this Bay to Tahoe Basin Recreation and Tourism Travel Impact Study. Introduction We offer here both a vision for California s transportation future and a set of immediate action items toward achieving that vision that are centered around the concepts of preservation, innovation, integration, reform, and, of course, funding. The transportation vision in this interim report represents a general consensus of the CTIP workgroup. Vision While transportation funding in California is highly decentralized - often resulting in a mine-versusyours tug-of-war between the state and local governments - we must remember that our collective investments must yield a single transportation system meeting the mobility needs of all Californians and the sustainability objectives so important to the state s fight against the effects of climate change. Healthy partnerships between the state, local transportation agencies, and the federal government should yield transportation investments in a single system that reflects local, regional, and state priorities. A Transformative Time for Transportation in California A key challenge for today s transportation system is how to continue to achieve important mobility and safety goals while achieving necessary state sustainability goals. While providing mobility choice is one strategy, even in project delivery, environmental conservation and restoration must be considered to protect natural resources. October
83 Preservation Bay To Tahoe Basin Recreation and Regions around the state are recognizing the importance of keeping their transportation assets in a state of good repair. So must the state. Our state highway system was largely built in the two decades following World War II. The system is reaching or exceeding its useful life. The system remains under huge demand with more vehicles driving more miles on it than ever before. While there is always pressure to expand the state highway system, expansion must remain a secondary priority to investing in the management, preservation and efficient operation of our existing assets. Potholes and other imperfections in the roadway come with real costs to motorists, estimated by one study at more than $700 per household each year. Improving our roadway through renewed focus and investment and on the operation of the highway system through the deployment of working intelligent transportation equipment and other preservation strategies provides myriad benefits that include: Improved and safer traveling experience for all road users; A 10 to 1 return on investments in maintenance over delayed rehabilitation replacement; Reduced GHG emissions through improved vehicle efficiency; and Greater sustainability through the use of energy-efficient materials and equipment on our roadways. Innovation Innovation is a key component to developing a transportation system capable of meeting our mobility, safety and sustainability objectives. California has been and will continue to be a leader when it comes to innovative approaches to transportation and environmental challenges. Among strategies identified in the Innovation section of this CalSTA report are: Utilization of ITS equipment to manage congestion and improve the operations of our highway system; Real time traveler/transit information; Integrated transit passes. Integration The primary strategy in this area is how the state can best support the implementation of regional strategies, and how to integrate the regional strategies with the state s strategies for interregional travel in California. This integration is how we develop one statewide transportation system that improves travel for system users, utilizes scare resources most efficiently, and provides a path to meet statewide greenhouse-gas-emission reduction and sustainability objectives. Greater integration encompasses many elements of our system, including planning, advanced mitigation, goods movement, and rail modernization. Funding Of course, these strategies do not answer the obvious challenge of funding. And when it comes to transportation policy in California, funding is always a challenge. Simply put, needs always outpace available revenues. Nearly fifteen years ago, the CTC conducted a broad survey of transportation stakeholders to assess the need for transportation infrastructure in California. That survey, October
84 conducted in response to Senate Resolution 8 (Burton, 1999), estimated a ten-year transportation infrastructure need of approximately $110 billion. In late 2011, thirteen years after the SR8 report, and five years after voters approved a $19.9 billion bond measure for transportation, the CTC conducted another survey of stakeholders to assess the state s transportation needs. That assessment concluded that the unfunded ten-year need is $296 billion. Clearly the state has unfunded needs, but our objective is not to chase a number. Instead, it is to lay out a vision for providing a transportation system capable of meeting our mobility, safety, and sustainability objectives, and aligning resources to meet those goals. Make no mistake, we do need additional, long-term, flexible, pay-as-you-go sources of funding dedicated to transportation improvements, including for the preservation and improved operations of the state highway system. 6.2 A TIME OF TRANSITION BUT OPPORTUNITIES TO MOVE FORWARD The present availability of transportation funding assistance from the state for local and regional systems, or even locally generated revenues for local priorities, is clouded by challenges ranging from increased cost pressures for basic system wide preservation needs and revenue sources that have not been updated or increased in many years. Federal resources available to states and regions have also been shrinking. However, 2014 is marked by emerging resource opportunities that are aligned with the needs identified in this report. In California, this is particularly true in the areas of sustainable transportation development and active transportation. Continued Work by CalSTA and the California Transportation Infrastructure Priorities Workgroup Perhaps the most important recommendation of the CalSTA Interim Report was a proposal to advance the repayment of outstanding loans totaling $337 million that were owed by the State s General Fund to transportation programs. This proposal was adopted by the Legislature and augmented by $142 million to fund local road maintenance. Transportation Secretary Brian Kelly extended the timeline for the meetings of the CTIP Workgroup, with four sub-groups focused on distinct areas of study: STIP Reform Goods Movement Road User Charge Long-term Funding Options (Voter threshold, others) It is expected full CTIP meetings will be conducted in August 2014 to produce the framework for a final report. Local Revenues Throughout California, 19 county transportation agencies are self help counties. Voters in each of these counties have approved transportation sales tax measures that fund transit, highway, freight, bicycle, pedestrian, and other mobility projects and programs. Most of the self-help counties are urban; Madera is the smallest of the 19 with a population of 152, 925 (2012), however, Madera is adjacent to the large Fresno metropolitan region (the City of Fresno is the fifth largest city in California). Eighty-one percent of California s population lives in a self-help county. Together, these counties October

85 generate approximately $3 to $4 billion in annual transportation investments. Expenditure plans explicitly detail how funds approved will be spent, providing transparency and allowing the public to fully understand where and how their local transportation will be invested. Self-help counties are typically able to use their local revenues to leverage a larger share of available state and federal transportation revenues. In 1986, passage of California Proposition 62 imposed a constitutional requirement on local special taxes that requires voter approval to be by a two-thirds majority. Since that time, voter approval of transportation sales tax measures has been difficult to come by. To address this issue and the evergrowing demand for more transportation funding, a transportation policy priority has been developed by some local and state leaders to seek a reversal of the current supermajority vote requirement, either to a simple majority (50 percent plus 1 vote) or a 55 percent approval threshold. Several bills have been introduced in the State Legislature proposing a reduction in the two-thirds vote requirement. To date, however, voter sentiment (or polling) has not demonstrated adequate support for a change. This makes any new proposed local sales tax increase for transportation much less likely. It also jeopardizes the renewal of some existing local transportation measures that were originally approved prior to the passage of Proposition 62. None of the four counties in the Study Area is currently a self help county. Going forward, one of more of the counties may be willing to explore or pursue self help status, but as long as the two-thirds approval requirement remains in place, the chance for success is considered less than likely. 6.3 UPDATE ON NEW FUNDING SOURCES ATP Senate Bill 99 (Chapter 359, Statutes of 2013) and Assembly Bill 101 (Chapter 354, Statutes of 2013) created the ATP to encourage the increased use of active modes of transportation, such as biking and walking. To establish the ATP, these bills consolidated several existing state and federal programs. ATP funding is segregated into three components and distributed as follows: 50 percent to the state for a statewide competitive program; 10 percent to small urban and rural regions with populations of 200,000 or less for the small urban and rural competitive program; 40 percent to Metropolitan Planning Organizations (MPO) in urban areas with populations greater than 200,000 for the large urbanized area competitive program. Guidelines for the ATP were developed in consultation with a stakeholder workgoup that included representatives of government agencies and active transportation organizations with expertise in pedestrian and bicycle issues, including Safe Routes to Schools (SRTS) Programs. The program guidelines describe the policies and criteria used in selecting projects to be included for funding consideration and awards. The initial ATP Call for Projects took place in March The first round of Statewide and Rural Program awards is scheduled for late August The first MPO program of projects is scheduled to be adopted in November. October
86 The goals and objectives of the ATP are well aligned with many of the needs identified by motorists and travelers as reported in the research and analytical sections of this Bay to Tahoe Basin Study report. Cap and Trade Funding for Transportation and Transit The onset of the auction of GHG emission credits under California s landmark Cap and Trade Program in 2012 and 2013 realized approximately $500 million in state revenues. The California Budget Act essentially sequestered those funds by loaning them to the State s General Fund. This allowed the Brown Administration time to assess the relative success of the auction process. This led to development of the state budget wherein the Governor proposed an aggressive spending plan, with an emphasis on dedicating a sizeable portion to development of the state s High Speed Rail program. Further in negotiating the state budget, the Governor and legislative leaders reached an agreement on both a budget year allocation plan, complete with specific appropriations to identified programs, and a long range allocation plan starting in 2015, based on dedicated proportions of the overall revenues directed to various categories. For 2014 to 2015, a total of $872 million was appropriated to a wide range of GHG reduction strategies, with $250 million for high speed rail, $50 million for transit and rail capital, $130 million for Affordable Housing and Sustainable Communities (AHSC) programs, and the balance to various state efforts. These dedicated programs will require the development of metrics by the California Air Resources Board (CARB) to ensure optimal GHG reductions are derived, as well as additional agency-based guidelines on process and definitions for eligible project types. It is expected the initial funding allocations from these appropriations will flow in the third quarter of Given the nature of the types of projects that are being contemplated, the longer range, ongoing Cap and Trade program will present very real opportunities for communities within the Bay to Tahoe Basin study region to benefit. For example, 10 percent of all ongoing Cap and Trade funds are continuously appropriated for the Transit and Intercity Rail Capital Program, a grant program for transit and rail related capital projects that is administered by the State Transportation Agency (CalSTA) and awarded by the CTC. It is realistic to anticipate that the study region will be competitive for projects that meet the needs and expectations as identified in this report. 6.4 IMPLEMENTATION OF FUNDING STRATEGIES As reported in this Chapter, there are efforts underway to address California s significant transportation funding shortfall and to do so with a new set of guiding principles appropriate for the opening decades of the 21st century. The traditional state funding system is strained, but emerging new funding opportunities exist that could (and should) play an important role in aligning with the findings and recommendations of the Bay to Tahoe Basin Recreation and. A new era of state, local, and regional partnerships appears to be dawning. This also bodes well for the transportation partnerships and collaborations recommended in this report. To advance implementation, the following funding strategies are highlighted and recommended for follow-up actions: Funding Strategy (FSR-1) The California ATP October
87 The ATP presents a real opportunity for projects identified in this Study Report to seek and secure funding. To be successful, it will be necessary to carefully consider and vet project proposals ensure they align with the published ATP and CTC guidelines. While the statewide program (administered by CTC) will provide the basis for grant requests, competition from around the state will be intense. Similarly, competition in the rural category will be intense; even more so since the total amount available in this category is even more constrained. It is recommended that project proposals be packaged and, as appropriate, incorporate the needs of tourists with other needs to meet as many of the project selection criteria as possible. The Implementation Table in Chapter 7 identifies ATP goals and the applicability to various recommendations in this Study Report. FSR-2. Cap and Trade Transportation and Transit Program. California s adopted State Budget appropriated a total of $872 million to a wide range of GHG reduction strategies, with $250 million for high speed rail, $50 million for transit and rail capital, $130 million for AHSC programs, and the balance to various state efforts. As reported above, these dedicated programs will require the development of metrics by CARB to ensure that optimal GHG reductions are achieved, as well as additional agency-based guidelines on process and definitions for eligible project types. It is recommended that eligible entities within the Study region closely monitor the development of metrics and guidelines for the Cap and Trade Transportation and Transit program and prepare project proposals consistent with criteria. As with ATP project proposals, funding requests should package tourism with other needs to meet as many of the project selection criteria as possible. FSR-3. Cross-Regional Cost-Sharing. California Streets and Highway Code Section 188.8, subdivision ( c ) provides for a cooperative process for eligible STIP agencies to pool STIP shares. The research conducted for this Bay to Tahoe Basin study (Chapter 2) identifies that some four million visitors from the Bay Area and Sacramento regions make approximately eight million annual trips to the Study Area. A plausible proposal could be developed to approach partner agencies, using the abovereferenced code provision, to request modest levels of assistance from the metro area STIP resources, pooled, for example, with STIP shares for Bay to Tahoe Basin study area counties and TRPA. The authority in Section ( c ) is voluntary, so such an approach would have to be rely on clearly demonstrating that the eight million annual visitor trips from the metro areas (Sacramento Sacramento Area Council of Governments SACOG), and the Bay Area (Metropolitan Transportation Commission MTC), are a high enough priority to the respective metro region travelers (Study Area visitors) to encourage and justify voluntary collaboration in sharing STIP resources. It is recommended this potential collaborative source of funding for recommendations in this Study Report be further explored. FSR-4. Continue to Develop Project Readiness. Although not strictly a funding consideration, one important aspect of transportation planning is to ensure planning agencies have the capacity to develop proposed projects to a state of readiness. In the event new or enhanced funding sources become available, projects that are shovel ready can be advanced for funding opportunities. The transportation system improvements in this Study Report provide a foundation for new projects and programs that can be identified for prioritization and, if prioritized, can be further developed to a position of readiness. This Study Report provides the data and performance measures to support the development of shovel ready projects. October
88 It is recommended that serious consideration be given to project readiness funding opportunities. Federal Funding Programs (MAP-21) A significant percentage of lands in the Study Area are owned and managed by the federal government. Federal ownership in the Lake Tahoe Basin is very high, at approximately 78 percent. Many of these federal lands provide recreational and other tourism opportunities. Two new federal transportationfunding programs were established (or at least re-packaged) in the federal transportation legislation, MAP-21. These represent potential funding sources to support the recommendations in this Study Report. As of this writing, the Lake Tahoe area has already secured two FLAP allocations. Federal Lands Access Program (FLAP) The FLAP was established in 23 U.S.C. 204 to improve transportation facilities that provide access to, are adjacent to, or are located within federal lands. FLAP supplements state and local resources for public roads, transit systems, and other transportation facilities, with an emphasis on high-use recreation sites and economic generators. Federal Lands Transportation Program (FLTP) This program was established in 23 U.S.C. 203 to improve multi-modal access within national parks, national forests, national wildlife areas, Bureau of Land Management (BLM) lands, and U.S. Army Corps of Engineers facilities. The FLTP complements the FLAP. Where the FLAP provides funds for state and local roads that access the federal estate, the FLTP focuses on the transportation infrastructure owned and maintained by federal lands management agencies. Note: The use of FLTP funds does not affect the overall responsibility for construction, maintenance, and operations of facilities. That responsibility continues to lie with the owner of the facility. FSR-5. It is recommended that transportation planning and project delivery agencies within the Study Area explore opportunities to apply for FLAP and/or FLTP funding for eligible projects within the Study Area, consistent with the project recommendations in this Study Report. Additional Recommendation Whether or not one, or better yet a regional partnership of entities within the Study Area, decides to pursue Funding Strategy FSR-3, it is recommended that a dialogue be opened with officials at SACOG and MTC and presentations be made regarding the findings and recommendations in this Study Report. Clearly, Study Area communities are serving many of the same constituents served by SACOG and MTC. Study authors believe the development of such metro-rural relationships is timely. We encourage interested persons to read the book Megapolitan America, by Arthur C. Nelson, FAICP, and Robert E. Lang, published by the American Planning Association (APA) in 2011, giving particular attention to Chapter 12, about the Sierra Pacific Megapolitan Area. Here are some excerpts from that chapter: The Sierra Pacific megapolitan area is the highly populated agglomeration of metropolitan areas stretching from the Pacific Coast south of San Francisco to Sacramento, in the middle of the Central Valley, to Reno, just east of the Sierra Nevada range (Figure 12-1). Appendix 12.1 lists the counties in the Sierra Pacific megapolitan area.* We offer a vignette of this megapolitan area in terms of major demographic and housing trends, employment and development projections, the extent of economic October
89 dependency, and attractiveness characteristics. We conclude with an assessment of major planning and development challenges. (Page 135). California s planning rigor is legendary. Although the state ranks 12th on the Nelson-Lang Planning Index, it is at the local government level where planning is rigorous. California jurisdictions routinely win national planning awards and pioneer new planning ideas. Perhaps the limiting factor in California s planning environment is truly regional-scale planning, let alone planning done at the megapolitan scale. (Page 142). * The list of Sierra Pacific counties includes El Dorado, Placer, and Nevada counties. Authors of the Bay to Basin Study report believe a case can be made that Amador County should also be included. 6.5 BACKGROUND Existing Transportation Funding Sources The availability of funding for transportation was evaluated in the Needs Assessment completed by the CTC. Many existing funding sources are strained, in decline, or are not adequate to fund existing transportation needs within the State of California. Below is a high-level overview of the various funding sources: Gasoline Tax (State): Funds at the state level available for transportation systems are generated from a state excise tax on gasoline and diesel fuels and weight fees imposed on commercial vehicles. This is a result of a revision to state transportation taxes, through a swap in law of the relevant tax bases done in The Fuel Tax Swap provided for a combination of lowering the sales and use tax rate applicable to sales of motor vehicle fuel, excluding aviation gasoline, and simultaneously raised the state excise motor vehicle fuel tax. Additionally, the Fuel Tax Swap raised the sales tax rate applicable to sales of diesel fuel and simultaneously lowered the state excise tax on diesel fuel. State revenues provide approximately 22 percent ($53.1 billion) of the total funds devoted to transportation infrastructure. However, the Tax Swap increment is reliant on an annual true-up that seeks to maintain revenue neutrality with what the Proposition 42 sales tax on gas would have provided; thus, this is a potentially volatile revenue source that will fluctuate with overall price and total gallon sales. This will further exacerbate revenues that fund the STIP (RTIPs and ITIP), as well as the State Highway Account, which funds the State Highway Operation and Protection Program (SHOPP). 37 It is estimated that through 2016 to 2017, revenues will increase by about 1.8 percent for gasoline and 2.8 percent for diesel, each year. However, as discussed previously, under the Tax Swap, the application of the true-up mechanism in the Fuel Tax Swap program has reflected that the economic reality that growth in fuel sales is not matching the CTC projection. It is unknown, whether this is attributable to ongoing economic malaise, traveler behavioral adjustments, or more efficient vehicles or alternative fueled vehicles. As such, it is anticipated that fuel sales will continue to remain flat or decline. 38 Weight Fees: Truck weight fees account for almost $1 billion in annual revenue and were originally put in place to offset the damage that heavy trucks cause. Through 2016 to 2017, weight fee revenues are anticipated to increase by a rate of 2.3 percent. This is consistent with the ten year growth rate. 37 Smith, Watts, and Martinez, LLC. Bay to Basin Funding Analysis, Ibid. October
90 However, these revenues are no longer available to fund state SHOPP projects as they have been legislatively designated to provide state General Fund relief through their dedication to offset General Fund costs of bond debt service for Proposition 1B and 1A. 39 Federal Obligation Authority (OA), MAP-21: On July 6, 2012, MAP-21 was signed into law; which reauthorized the nation s surface transportation laws at current spending levels through September The law went into effect on October 1, Under MAP-21, the Transportation Enhancements program is re-named the Transportation Alternatives Program (TAP), with the 12 eligible project categories consolidated into six categories. The bill eliminated the bike/pedestrian safety and education programs, transportation museums, and the acquisition of scenic and historic easements categories. TAP now includes the SRTS program and the Recreational Trails Program. MAP-21 focuses on the following goals: safety, infrastructure condition, congestion reduction, system reliability, freight movement and economic vitality, environmental sustainability, and reduced project deliver delays. State and local transportation agencies benefit from annual allotments from the federal government, based on formula distributions from federal taxes on fuels. If future federal funding levels remain at the current level, California is projected to receive $30.9 billion in federal transportation funds over the tenyear time period (2011 to 2020); which amounts to 13 percent of total funding identified as needed for the state s transportation system. However, until future federal re-authorization legislation is approved the specific amount of federal transportation funding that will be allocated to California is unknown. 40 The Congestion Mitigation and Air Quality (CMAQ) funds are included in MAP-21 and are targeted at transportation projects that benefit both congestion and air quality. Projects must undergo an air quality analysis demonstrating emissions reductions. In general, projects that add capacity are not eligible under this program. Projects previously approved for CMAQ funds, include the purchase of transit vehicles, High Occupancy Vehicle (HOV) lanes, rail stations, signal interconnects, and pedestrian and bicycle infrastructure. The approval of MAP-21 in 2012, essentially extended the SAFETEA-LU funding level, consistent with the CTC projections. The CTC projected that California s share of the annual August redistribution of federal OA is assumed to be $109 million per year based on the average received from 2007 to 2008 through 2009 to Proposition 42: Proposition 42 was placed on the ballot by the Legislature, and approved by the voters in March 2002, as part of an agreement to address the state s budget deficit. Proposition 42 made permanent a five-year temporary transfer of the sales taxes paid on motor vehicle fuels, originally approved by the Legislature in Proposition 42 constitutionally dedicated these funds to transportation programs, including street and highway construction and maintenance and transit operations. Proposition 42 allows the Legislature to suspend the transfer by a two-thirds vote subject to a gubernatorial declaration that the transfer would have a negative impact on the state s finances. Although repayment of pre-proposition 42 loans (2003) of transportation funds made to the State General Fund, which could amount to more than $1 billion, are not anticipated in the near term, a limited amount of loan repayments will occur consistent with state statute; albeit, closer to the end of this decade. 39 Ibid. 40 Smith, Watts, and Martinez, LLC. Bay to Basin Funding Analysis, 2014 October
91 However, by way of an update to this information, Governor Brown s State Budget proposed to accelerate $350 million in repayments of outstanding General Fund obligations to fiscal year ; these would not otherwise be due until The Governor s proposal was included in the State Budget Act, and, in fact, was augmented by the Legislature with an additional $140 million, dedicated to city and county road repairs, for a total of nearly $500 million. Local Revenue Sources (Local): Local municipalities utilize a variety of funding sources to construct transportation related improvements; which may include: dedicated sales taxes, redevelopment funds, special grants, general funds and other sources. These sources of revenue range from a statewide 0.25 percent tax on the sale of all goods and services for transit purposes, locally approved sales taxes, traffic impacts fees that are typically dedicated to addressing traffic associated impacts of specific developments and a very limited amount of local property taxes, and transit fares. According to the CTC Needs Assessment, Local funds account for about 65 percent of all revenues for transportation infrastructure. Local transportation sales taxes, requiring local voter approval of an expenditure plan and the accompanying tax rate, have proven to be an important feature of California s transportation funding landscape, providing a total of more than $4 billion annually, and accounting for more than half of the funding for improvements to the state highway system. However, the counties within the Bay To Tahoe Basin Study Area do not have a transportation sales tax measure, approved by voters. One challenge that is faced by smaller rural counties is that due to low population the amount of revenue that can be estimated is inherently limited by a smaller level of economic activity. Another challenge faced by counties that would like to present a transportation sales tax to voters, is the requirement for a two-thirds majority voting in favor of the measure. Counties that have a voter approved transportation sales tax are considered Self Help Counties. Self Help Counties have an advantage when presenting extensions to the transportation sales tax measures to the voters by demonstrating the tangible success of the project constructed under the original tax program. Counties that are approaching voters for the first time with a new tax measure do not have this success of previous tax measures to rely on to prove the importance of such a measure to voters as of this writing. Reduction of the required voter threshold for the creation of new tax programs is unlikely to receive legislative approval or statewide voter approval. In Nevada County, the Town of Truckee, Grass Valley, and Nevada City all have adopted local sales tax measures with a transportation component. A portion of Grass Valley s and Nevada City s sales tax measures can used for maintenance and rehabilitation of roadways. The Town of Truckee s sales tax measure can be utilized both for maintenance and rehabilitation of roadways and construction or roadway improvements. Transportation Funding Programs Transportation funding is distributed throughout the state through a variety of federal, state, and local funding programs. Funding resources that support many of the funding are severely limited, running out, or are significantly strained by the large number of projects that require funding. Below is an evaluation of the availability of existing programs and the availability of funds. Surface Transportation Program (Federal): MAP-21 establishes the Surface Transportation Program (STP). The STP is intended to fund a wide range of transportation projects, from capital improvements to October
92 planning activities. Projects previously approved for STP funds include freeway interchanges, roadway widening, signal installation, road rehabilitation, and planning studies. Once each State s total Federalaid apportionment is calculated, amounts are set aside for Metropolitan Planning and the Congestion Mitigation and Air Quality Improvement Program, and the remainder is divided among the rest of the formula, which is primarily based on population. Federal Statewide Transportation Improvement Program (FSTIP)/Federal Transportation Improvement Program (FTIP): All federally funded projects and regionally significant projects (regardless of funding) must be listed in an FSTIP/FTIP per federal law. The various Metropolitan Planning Organization (MPOs) are responsible for developing and maintaining the FTP. The SACOG, as the federally designated Metropolitan Planning Organization (MPO) for the six-county Sacramento Region, and as such the SACOG prepares and adopts the Metropolitan Transportation Improvement Program (MTIP) MTIP every two years. The MTIP covers a four-year period and must be financially constrained by year, meaning that the amount of dollars committed to the projects (also referred to as programmed ) must not exceed the amount of dollars estimated to be available. 41 The MTIP feeds into the FTIP. Within the Study Area, El Dorado and Placer Counties are members of SACOG, the MPO for the Sacramento Region. Within the Lake Tahoe Basin, TRPA is the identified MPO. A project is not eligible to be programmed in the FSTIP/FTIP until it is programmed by the CTC in the STIP, or approved through an MPO for inclusion into the FTIP. Projects located in non-mpo rural areas are directly listed in the FSTIP. State Transportation Improvement Program (STIP) (State): STIP projects are capital projects needed to improve transportation. Typical STIP-funded projects, include state highway and local road improvements, public transit, pedestrian and bicycle facilities, grade separations, transportation system management, transportation demand management, sound walls, inter-modal facilities, safety, and environmental enhancement and mitigation. The STIP is a multi-year capital improvement program of transportation projects on and off the state highway system, funded with revenues from the Transportation Investment Fund and other funding sources. STIP programming generally occurs every two years. The programming cycle begins with the release of a proposed fund estimate in July of odd-numbered years, followed by CTC adoption of the fund estimate in August (odd years). 42 State resources for the STIP area severely deficient to fund the amount of planned projects and needed improvements. According to the February 28, 2014 STIP Staff Recommendation completed by the CTC, the new STIP program will have approximately $3.45 billion when added to the base of the programming in the prior STIP. This adds about $1.232 billion in new STIP funding capacity with two new years of programming, 2017 to 2018 and 2018 to Although there is an overall increase, the 2014 STIP Fund Estimate indicated negative capacity for some program; while only the flexible funds from the State Highway Account provided positive program capacity. Even with the added capacity, the STIP is over programmed in the first three years of the STIP period (2014 to 2015 through 2016 to 2017) by about $83 million Sacramento Area Council of Governments, A Guide to 2013/2016 Metropolitan Transportation Improvement Program 42 California Department of Transportation, 43 California Transportation Commission, 2014 STIP Staff Recommendation, February 28, 2014 October
93 Interregional Transportation Improvement Program (ITIP): The ITIP is the 25 percent reservation of STIP resources under direct programming control of Caltrans, subject to approval by the CTC. The IRRS serves the movement of people and goods between regions and consists of a list of the state highway routes included in the system. There currently are 87 IRRS routes in statute, seven of which were added by legislation since the original system plan was developed. In intervening years since the IRRS was enacted, Caltrans has built on the IRRS to develop the Interregional Transportation System Plan (ITSP); which relies on a focus on High Emphasis Routes, of which there are 34. Of the 34 High Emphasis Routes, a sub-set of 10 Focus Routes was identified; which receive the highest attention for programming of ITIP funds. The ITSP, presently being updated, lays out a recommended course of actions and considerations for the Interregional Improvement Program (IIP) for the 20-year planning period of 2012 to The following highways within the Study Area are considered High Emphasis Routes: SR 20, SR 49, SR 50, I-80, SR 89, SR 28, SR 89, and SR 267. However, except for SR 20 and SR 49, none of these are considered Focus Routes and consequently would not likely receive programming recommendations from Caltrans, particularly in the absence of supplemental funding. 44 As discussed below, the state resources available for the STIP, and therefore, the ITIP, are severely restricted looking forward. Consequently, unless substantial new revenue sources are made available or funding criteria are changed to reflect the Study Area User Population recommended in this report, not even upgrading any of the designated IRRS routes in the Study Area to a Focus category would, in and of itself, provide capital relief. SHOPP and Minor Program (State): The SHOPP Plan provides input for the funding distribution in the STIP fund estimate. The purpose of the SHOPP is to maintain and preserve the investment in the state highway system and its supporting infrastructure. Projects in the SHOPP are limited to capital improvements relative to maintenance, safety, and rehabilitation of State highways and bridges, capital improvements that do not add a new traffic lane to the system. The sole funding source for the SHOPP is the State Highway Account (SHA), which is funded primarily through excise taxes on gasoline and diesel fuel. SHA funding is declining as a result of reduced fuel consumption, funding shortfalls in the Federal Highway Trust Fund, and redirection of funding for highway maintenance. As stated in the Caltrans 2011 SHOPP Plan, the projected SHA funding available for the SHOPP is $1.8 billion a year, which is 24 percent of the estimated need. Because funding is insufficient to preserve and maintain the existing transportation infrastructure, Caltrans has stated that they will focus available resources on the most critical categories of projects in the SHOPP (safety, bridge, and pavement preservation). As such, the state highway system will continue to deteriorate. Caltrans also states indicated that the percentage of lane miles of highway pavement in a distressed condition is projected to increase from 26 percent to 40 percent during the next ten years. 45 Regional Surface Transportation Program (RSTP) (State): The RSTP was established by California State Statute, utilizing Surface Transportation Program Funds that are identified in Section 133 of Title 23 of the United States Code. A RSTP project is required to be approved by the MPO for inclusion on the FTIP. 44 Smith, Watts, and Martinez, LLC. Bay to Basin Funding Analysis, California Department of Transportation, 2011 Ten-Year State Highway Operation and Protection Program Plan Fiscal Years Through , January 2011 October
94 Projects eligible for funding from the RSTP include: Bay To Tahoe Basin Recreation and Construction, reconstruction, rehabilitation, resurfacing, restoration, and operational improvements on Federal-aid highways and bridges. Mitigation of damage to wildlife, habitat, and ecosystems caused by a transportation project funded under RSTP. Capital costs for transit projects eligible for assistance under the Federal Transit Act and publicly owned intracity or intercity bus terminals and facilities. Carpool projects, fringe and corridor parking facilities and programs, and bicycle transportation and pedestrian walkways on any public roads in accordance with Section 217 of Title 23, U.S.C. Highway and transit safety improvements and programs, hazard elimination, projects to mitigate hazards caused by wildlife, and railway-highway grade crossings. Safety improvements are eligible on public roads of all functional classifications. Highway and transit research and development and technology transfer programs. Capital and operating costs for traffic monitoring, management and control facilities and programs. Surface transportation planning programs. Transportation enhancement activities. Transportation control measures listed in Section 108 (f)(1)(a) (other than clauses xii & xvi) of the Clean Air Act. Development and establishment of management systems under Section 303 of Title 23, U.S.C. Wetlands mitigation efforts related to RSTP projects. October

95 7 PERFORMANCE MEASURES Given funding constraints and other considerations, there is a clear trend toward to the use of performance measures as a way to quantify the benefits of transportation project and program expenditures. More than ever, it is imperative that transportation agencies plan, build, and operate transportation systems that not only achieve the important goals of mobility and safety, but also effectively support a variety of economic, environmental, GHG reduction and other air quality improvements, and community objectives. During the course of developing this Study Report, performance measures were identified that are focused on the characteristics and needs of the transportation network within the Study Area. The measures are presented in the context of the urban travel patterns that result from the significant percentage of tourism related travel documented in the Study Area. An initial list of performance measures was presented to the PAC for review, refinement, and, ultimately, for endorsement. A set of guiding principles and strategies was also developed. These are intended to serve as a framework for implementation. 7.1 RECOMMENDED PERFORMANCE MEASURES The Performance Measures in Table 7-1, below, include both quantitative measures (LOS, time travel, VMT reduction and others) and qualitative measures (traveler perception, community perception; others). It is recommended that these Performance Measures be utilized to measure the applicability and success of specific projects, programs, and strategies intended to address tourism traveled related improvements within the Study Area, both current and future. October
6.10 Recreational Travel
 6.10 Recreational Travel This chapter documents recreational travel and tourism data for Placer County and transportation facility needs and services to accommodate this important segment of travel. EXISTING
Gold Coast. Rapid Transit. Chapter twelve Social impact. Chapter content
 Gold Coast Rapid Transit Chapter twelve Social impact Chapter content Social impact assessment process...235 Existing community profile...237 Consultation...238 Social impacts and mitigation strategies...239
13.1 REGIONAL TOURISM ISSUES AND SUMMARY OF FINDINGS
 13 REGIONAL TOURISM T he County of Mariposa s recreation needs and facilities fall within two categories: regional tourism and local recreation. This Element focuses on regional tourism issues related
WESTERN EL DORADO COUNTY SHORT AND LONG-RANGE TRANSIT PLAN Executive Summary
 WESTERN EL DORADO COUNTY SHORT AND LONG-RANGE TRANSIT PLAN Executive Summary Prepared for the El Dorado County Transportation Commission Prepared by The El Dorado County Transportation Commission (EDCTC)
CHAPTER 2 COUNTY PROFILE
 COUNTY PROFILE CHAPTER 2: COUNTY PROFILE This chapter provides a profile of Amador County, California, in the planning context of parks and recreation services. This profile includes a description of the
CHAPTER 5. Chapter 5 Recreation Element
 CHAPTER 5 Recreation Element Chapter 5 Recreation Element The Recreation Element of the Meyers Area Plan is a supplement to the Recreation Element of the TRPA Regional Plan and the El Dorado County General
Resort Municipality Initiative Annual Report 2015
 Resort Municipality Initiative Annual Report 2015 Submitted by: City of Rossland in association with Tourism Rossland Prepared by: Deanne Steven Acknowledgements The City of Rossland would like to thank
TWENTY-SECOND MEETING OF THE ASIA/PACIFIC AIR NAVIGATION PLANNING AND IMPLEMENTATION REGIONAL GROUP (APANPIRG/22)
") INTERNATIONAL CIVIL AVIATION ORGANIZATION TWENTY-SECOND MEETING OF THE ASIA/PACIFIC AIR NAVIGATION PLANNING AND IMPLEMENTATION REGIONAL GROUP (APANPIRG/22) Bangkok, Thailand, 5-9 September 2011 Agenda
INTERNATIONAL CIVIL AVIATION ORGANIZATION TWENTY-SECOND MEETING OF THE ASIA/PACIFIC AIR NAVIGATION PLANNING AND IMPLEMENTATION REGIONAL GROUP (APANPIRG/22) Bangkok, Thailand, 5-9 September 2011 Agenda
COUNTY COMPREHENSIVE PLAN
 50 : Policy Statement Lewis County has a unique and attractive rural character, which makes it a wonderful place to visit and explore. The region abounds with recreation opportunities that attract visitors
CHAPTER FIVE PROSPECTS FOR FUTURE ECONOMIC DEVELOPMENT
 CHAPTER FIVE PROSPECTS FOR FUTURE ECONOMIC DEVELOPMENT 5.1 GENERAL The recommended type and location of future land uses in Alpine should, in part, consider potential opportunities for future economic
2009 Muskoka Airport Economic Impact Study
 2009 Muskoka Airport Economic Impact Study November 4, 2009 Prepared by The District of Muskoka Planning and Economic Development Department BACKGROUND The Muskoka Airport is situated at the north end
The Economic Contributions of Agritourism in New Jersey
 The Economic Contributions of Agritourism in New Jersey Bulletin E333 Cooperative Extension Brian J. Schilling, Extension Specialist in Agricultural Policy Kevin P. Sullivan, Institutional Research Analyst
Department of Agricultural and Resource Economics, Fort Collins, CO
 July 2007 EDR 07-16 Department of Agricultural and Resource Economics, Fort Collins, CO 80523-1172 http://dare.colostate.edu/pubs CO LORADO S AGRITOURISTS: WHO ARE THE ADVENTURERS, THE SEEKERS AND THE
Business Growth (as of mid 2002)
") Page 1 of 6 Planning FHWA > HEP > Planning > Econ Dev < Previous Contents Next > Business Growth (as of mid 2002) Data from two business directories was used to analyze the change in the number of businesses
Page 1 of 6 Planning FHWA > HEP > Planning > Econ Dev < Previous Contents Next > Business Growth (as of mid 2002) Data from two business directories was used to analyze the change in the number of businesses
MONTEREY REGIONAL AIRPORT MASTER PLAN TOPICAL QUESTIONS FROM THE PLANNING ADVISORY COMMITTEE AND TOPICAL RESPONSES
 MONTEREY REGIONAL AIRPORT MASTER PLAN TOPICAL QUESTIONS FROM THE PLANNING ADVISORY COMMITTEE AND TOPICAL RESPONSES Recurring topics emerged in some of the comments and questions raised by members of the
Airport Planning Area
 PLANNING AREA POLICIES l AIRPORT Airport Planning Area LOCATION AND CONTEXT The Airport Planning Area ( Airport area ) is a key part of Boise s economy and transportation network; it features a multi-purpose
JOSLIN FIELD, MAGIC VALLEY REGIONAL AIRPORT DECEMBER 2012
 1. Introduction The Federal Aviation Administration (FAA) recommends that airport master plans be updated every 5 years or as necessary to keep them current. The Master Plan for Joslin Field, Magic Valley
NAPA VALLEY VISITOR INDUSTRY 2016 Economic Impact Report
 NAPA VALLEY VISITOR INDUSTRY 2016 Economic Impact Report Research prepared for Visit Napa Valley by Destination Analysts, Inc. Table of Contents S E C T I O N 1 Introduction 2 S E C T I O N 2 Executive
Project Deliverable 4.1.3d Individual City Report - City of La Verne
 Pomona Valley ITS Project Project Deliverable 4.1.3d Individual City Report - City of La Verne Prepared by: April 19, 2002 099017000.1 Copyright 2002, Kimley-Horn and Associates, Inc TABLE OF CONTENTS
Economic Impact Analysis. Tourism on Tasmania s King Island
 Economic Impact Analysis Tourism on Tasmania s King Island i Economic Impact Analysis Tourism on Tasmania s King Island This project has been conducted by REMPLAN Project Team Matthew Nichol Principal
Treasure Island Supplemental Information Report Addendum
 1 1 1 1 0 1 0 1 0 1 Treasure Island Supplemental Information Report Addendum Introduction Purpose The purpose of this Supplemental Information Report (SIR) Addendum is to determine if the current land
PREFACE. Service frequency; Hours of service; Service coverage; Passenger loading; Reliability, and Transit vs. auto travel time.
 PREFACE The Florida Department of Transportation (FDOT) has embarked upon a statewide evaluation of transit system performance. The outcome of this evaluation is a benchmark of transit performance that
NAPA VALLEY VISITOR INDUSTRY 2012 Economic Impact Report
 Join Visit Napa Valley NAPA VALLEY VISITOR INDUSTRY 2012 Economic Impact Report Research prepared for Visit Napa Valley by Destination Analysts, Inc. Table of Contents SECTION 1 Introduction 2 SECTION
Interview with Mr. Aaron Mahr, superintendent of the National Park Service s (NPS) National Trails, U.S.A. Route 66
 National Trails, U.S.A. Route 66") Interview with Mr. Aaron Mahr, superintendent of the National Park Service s (NPS) National Trails, U.S.A Route 66 1. Please introduce yourself, your role, your organization and the historic route you
Interview with Mr. Aaron Mahr, superintendent of the National Park Service s (NPS) National Trails, U.S.A Route 66 1. Please introduce yourself, your role, your organization and the historic route you
STUDY OVERVIEW MASTER PLAN GOALS AND OBJECTIVES
 INTRODUCTION An Airport Master Plan provides an evalua on of the airport s avia on demand and an overview of the systema c airport development that will best meet those demands. The Master Plan establishes
NAPA VALLEY VISITOR INDUSTRY 2014 Economic Impact Report
 NAPA VALLEY VISITOR INDUSTRY 2014 Economic Impact Report Research prepared for Visit Napa Valley by Destination Analysts, Inc. Table of Contents SECTION 1 Introduction 2 SECTION 2 Executive Summary 5 SECTION
Department of Agricultural and Resource Economics, Fort Collins, CO
 June 2007 EDR 07-15 Department of Agricultural and Resource Economics, Fort Collins, CO 80523-1172 http://dare.colostate.edu/pubs OF WINE AND WILDLIFE: ASSESSING MARKET POTENTIAL FOR COLORADO AGRITOURISM
Interstate 90 and Mercer Island Mobility Study APRIL Commissioned by. Prepared by
 Interstate 90 and Mercer Island Mobility Study APRIL 2017 Commissioned by Prepared by Interstate 90 and Mercer Island Mobility Study Commissioned by: Sound Transit Prepared by: April 2017 Contents Section
Department of Agricultural and Resource Economics, Fort Collins, CO
 May 2016 EDR 16-01 Department of Agricultural and Resource Economics, Fort Collins, CO 80523-1172 http://dare.colostate.edu/pubs MAPPING THE WESTERN U.S. AGRITOURISM INDUSTRY: HOW DO TRAVEL PATTERNS VARY
5 Rail demand in Western Sydney
 5 Rail demand in Western Sydney About this chapter To better understand where new or enhanced rail services are needed, this chapter presents an overview of the existing and future demand on the rail network
Chapter 1: Introduction Draft
 Chapter 1: Draft TABLE OF CONTENTS 1... 4 1.6.1 Stakeholder Engagement Plan... 10 Chapter 1 Page 2 TABLE OF EXHIBITS Exhibit 1.1-1 ABIA Annual Growth Since 1993... 5 Exhibit 1.4-1: ABIA Location Map...
Introduction DRAFT March 9, 2017
 Chapter Overview The City of Redmond (City) initiated an update to the Airport Master Plan ( Plan ) to assess the facility and service needs of the Redmond Municipal Airport ( the Airport ) throughout
Colorado Springs & Pikes Peak Region Destination Master Plan
 Colorado Springs & Pikes Peak Region Destination Master Plan Overview June 19, 2018 DESTINATION MASTER PLAN What is Destination Master Planning? Focus on infrastructure, facilities, services, attractions
Agritourism in Missouri: A Profile of Farms by Visitor Numbers
 Agritourism in Missouri: A Profile of Farms by Visitor Numbers Presented to: Sarah Gehring Missouri Department of Agriculture Prepared by: Carla Barbieri, Ph.D. Christine Tew, MS candidate April 2010 University
Baku, Azerbaijan November th, 2011
 Baku, Azerbaijan November 22-25 th, 2011 Overview of the presentation: Structure of the IRTS 2008 Main concepts IRTS 2008: brief presentation of contents of chapters 1-9 Summarizing 2 1 Chapter 1 and Chapter
30 th January Local Government s critical role in driving the tourism economy. January 2016 de Waal
 30 th January 2016 Local Government s critical role in driving the tourism economy January 2016 de Waal Contents Local Government can make or break tourism in their jurisdiction... 3 TNQ Tourism Vision...
2014 NOVEMBER ECONOMIC IMPACTS AND VISITOR PROFILE. Prepared By:
 2014 NOVEMBER ECONOMIC IMPACTS AND VISITOR PROFILE Prepared By: Sisters Folk Festival Economic Impacts and Visitor Profile September 5-7, 2014 November 2014 Prepared for Sisters Folk Festival, Inc. Sisters,
2016 Regional Transportation Alternatives Program (TAP) Grant Application
 Grant Application") 2016 Regional Transportation Alternatives Program (TAP) Grant Application PROJECT TITLE: Yelm-Tenino Trail Extension Feasibility Study TRPC use only GENERAL PROJECT INFORMATION Agency or Organization City
2016 Regional Transportation Alternatives Program (TAP) Grant Application PROJECT TITLE: Yelm-Tenino Trail Extension Feasibility Study TRPC use only GENERAL PROJECT INFORMATION Agency or Organization City
Proof of Concept Study for a National Database of Air Passenger Survey Data
 NATIONAL CENTER OF EXCELLENCE FOR AVIATION OPERATIONS RESEARCH University of California at Berkeley Development of a National Database of Air Passenger Survey Data Research Report Proof of Concept Study
Considering an Agritourism Enterprise?
 Considering an Agritourism Enterprise? Part of a How-To Guide for Successful Agritourism Enterprises Prepared for The University of Georgia s Center for Agribusiness and Economic Development and North
Westover Metropolitan Airport Master Plan Update
 Westover Metropolitan Airport Master Plan Update June 2008 INTRODUCTION Westover Metropolitan Airport (CEF) comprises the civilian portion of a joint-use facility located in Chicopee, Massachusetts. The
The Sunshine Coast is part of the global community and generates wealth through export, high-value industries and new investment.
 3.2 Strategic intent 3.2.1 Shaping growth an overview In 2031, the Sunshine Coast is renowned for its vibrant economy, ecological values, unique character and strong sense of community. It is Australia
FORECASTING FUTURE ACTIVITY
 EXECUTIVE SUMMARY The Eagle County Regional Airport (EGE) is known as a gateway into the heart of the Colorado Rocky Mountains, providing access to some of the nation s top ski resort towns (Vail, Beaver
Part Three : COMMUNITY PLAN AREAS AND SPECIAL STUDY AREAS SACRAMENTO 2030 GENERAL PLAN. Introduction
 Special study Areas Part Three : COMMUNITY PLAN AREAS AND SPECIAL STUDY AREAS SACRAMENTO 2030 GENERAL PLAN Introduction Beyond the boundaries of the 2030 General Plan, the City has defined Special Study
Gold Coast: Modelled Future PIA Queensland Awards for Planning Excellence 2014 Nomination under Cutting Edge Research category
 Gold Coast: Modelled Future PIA Queensland Awards for Planning Excellence 2014 Nomination under Cutting Edge Research category Jointly nominated by SGS Economics and Planning and City of Gold Coast August
Proposal to Redevelop Lower Kananaskis River-Barrier Lake. Bow Valley Provincial Park
 Frequently Asked Questions Proposal to Redevelop Lower Kananaskis River-Barrier Lake Bow Valley Provincial Park Frequently Asked Questions What has been decided? What are the details of the plan? What
PROPOSAL TO DEVELOP AGRITOURISM IN AUSTRALIA
 PROPOSAL TO DEVELOP AGRITOURISM IN AUSTRALIA Synopsis Traditionally thought of as being simply farm stays and winery visits, the term agritourism now encompasses a wide variety of activities where agriculture
The Government s Aviation Strategy Transport for the North (TfN) response
 response") The Government s Aviation Strategy Transport for the North (TfN) response Transport for the North Background Good transport links are a crucial part of a strong economy supporting labour markets and delivering
The Government s Aviation Strategy Transport for the North (TfN) response Transport for the North Background Good transport links are a crucial part of a strong economy supporting labour markets and delivering
Section II. Planning & Public Process Planning for the Baker/Carver Regional Trail began in 2010 as a City of Minnetrista initiative.
 Section II Planning & Public Process Planning for the began in 2010 as a City of initiative. city staff began discussions with the Park District on the possibility of a north/south regional trail connection
BACKCOUNTRY TRAIL FLOOD REHABILITATION PROGRAM
 BACKCOUNTRY TRAIL FLOOD REHABILITATION PROGRAM Backcountry Trail Flood Rehabilitation A June 2013 Flood Recovery Program Summary In June 2013, parts of Southern Alberta were devastated from significant
Chapter 1: Introduction
 Chapter 1: TABLE OF CONTENTS 1... 4 1.1 Master Plan Study Content... 4 1.2 Purpose and Scope of Master Plan Study... 4 1.3 Airport History and Role... 6 1.4 Airport Location and Service Area... 6 1.5 ABIA
Temecula Valley Travel Impacts p
 Temecula Valley Travel Impacts 2000-2017p photo courtesy of Temecula Valley Convention and Visitors Bureau May 2018 Prepared for the Temecula Valley Convention and Visitors Bureau Temecula, California
Meeting Presentation. Sacramento International Airport Master Plan Update October 30, 2012
 Meeting Presentation Master Plan Update October 30, 2012 Agenda We encourage open discussion during today s meeting Team Goals Background (Airport Master Plans) Areas of Emphasis Schedule Special Concerns
Estimating Tourism Expenditures for the Burlington Waterfront Path and the Island Line Trail
 A report by the University of Vermont Transportation Research Center Estimating Tourism Expenditures for the Burlington Waterfront Path and the Island Line Trail Report # 10-003 February 2010 Estimating
Blueways: Rivers, lakes, or streams with public access for recreation that includes fishing, nature observation, and opportunities for boating.
 Parks, Open Space and Trails PRINCE WILLIAM COUNTY 2008 COMPREHENSIVE PLAN TRAILS PLAN CONTENTS The components of the trails plan are: Intent Definitions Goals, Policies, and Action Strategies Trails Map
Chapter 2: El Dorado County Characteristics and Demographics
 Chapter 2: El Dorado County Characteristics and Demographics 2.1 Geographic Area and Demographics El Dorado County comprises 1,805 square miles with over half of the area in the Eldorado National Forest
RE: Access Fund Comments on Yosemite National Park Wilderness Stewardship Plan, Preliminary Ideas and Concepts
 September 30, 2016 Superintendent Yosemite National Park Attn: Wilderness Stewardship Plan P.O. Box 577 Yosemite, CA 95389 RE: Access Fund Comments on Yosemite National Park Wilderness Stewardship Plan,
Like many transit service providers, the Port Authority of Allegheny County (Port Authority) uses a set of service level guidelines to determine
 uses a set of service level guidelines to determine") Transit service consists of two fundamental elements: frequency (how often service operates) and service span (how long service runs during the day). Combined, these two factors measure how much service
Transit service consists of two fundamental elements: frequency (how often service operates) and service span (how long service runs during the day). Combined, these two factors measure how much service
CHAPTER ONE LITERATURE REVIEW
 CHAPTER ONE LITERATURE REVIEW LITERATURE REVIEW This chapter summarizes the most recently published community impact studies and articles that relate to multiuse trails. The review focuses on publications
Evaluating Lodging Opportunities
 Evaluating Lodging Opportunities This section explores market opportunities for new lodging accommodations in the downtown area. It will help you understand travel and visitation trends, existing competition,
SENATE, No STATE OF NEW JERSEY. 217th LEGISLATURE INTRODUCED FEBRUARY 8, 2016
 SENATE, No. STATE OF NEW JERSEY th LEGISLATURE INTRODUCED FEBRUARY, 0 Sponsored by: Senator ROBERT W. SINGER District 0 (Monmouth and Ocean) Senator JOSEPH F. VITALE District (Middlesex) SYNOPSIS Establishes
WELLINGTON $422 MILLION $614 MILLION $83 MILLION 22% SPEND $1.9 BILLION
 WELLINGTON WELLINGTON $1.9 BILLION FORECAST TOTAL WELLINGTON INVESTMENT The Wellington region s transport challenges are dominated by the region s concentration of population in the metropolitan cities,
Performance Clackamas Clackamas County Strategic Plan
 June 2017 update Performance Clackamas Clackamas County Strategic Plan Strategic Goals and Milestones This is the June 2017 update to Performance Clackamas, the Clackamas County Strategic Plan. The plan
Longmont to Boulder Regional Trail Jay Road Connection DRAFT FINAL REPORT
 Longmont to Boulder Regional Trail Jay Road Connection DRAFT FINAL REPORT December 2018 Project Summary Boulder County, Colorado, in partnership with the City of Boulder, is evaluating options for multi-use
TOURISM AS AN ECONOMIC ENGINE FOR GREATER PHILADELPHIA
 TOURISM AS AN ECONOMIC ENGINE FOR GREATER PHILADELPHIA 2015 Visitation and Economic Impact Report FINAL REPORT SUBMITTED TO: VISIT PHILADELPHIA 30 S. 17 th St, Suite 2010 Philadelphia, PA 19103 FINAL REPORT
Analysis of the impact of tourism e-commerce on the development of China's tourism industry
 9th International Economics, Management and Education Technology Conference (IEMETC 2017) Analysis of the impact of tourism e-commerce on the development of China's tourism industry Meng Ying Marketing
DIRECTOR, ENVIRONMENT, FLEET, & SOLID WASTE UPDATE: REGIONAL RIDESHARE PROGRAM RECOMMENDATION
 Agenda Item # Page # 1 TO: FROM: SUBJECT: CHAIR AND MEMBERS CIVIC WORKS COMMITTEE MEETING ON APRIL 20, 2015 JAY STANFORD DIRECTOR, ENVIRONMENT, FLEET, & SOLID WASTE UPDATE: REGIONAL RIDESHARE PROGRAM RECOMMENDATION
AIRPORT OF THE FUTURE
 AIRPORT OF THE FUTURE Airport of the Future Which airport is ready for the future? IATA has launched a new activity, working with industry partners, to help define the way of the future for airports. There
Tourism Report Spring A Report Prepared by the Sonoma County Economic Development Board. Ben Stone, Director
 Tourism Report Spring A Report Prepared by the Sonoma County Economic Development Board Ben Stone, Director Though long renowned for its picturesque scenery, Sonoma County has steadily gained recognition
EAST WEST RAIL EASTERN SECTION. prospectus for growth
 EAST WEST RAIL EASTERN SECTION prospectus for growth September 2018 executive summary The East West Rail Consortium, a partnership of local authorities, rail operators and Network Rail, continues to promote
METROBUS SERVICE GUIDELINES
 METROBUS SERVICE GUIDELINES In the late 1990's when stabilization of bus service was accomplished between WMATA and the local jurisdictional bus systems, the need for service planning processes and procedures
HOUSEHOLD TRAVEL SURVEY
 HOUSEHOLD TRAVEL SURVEY Household Travel Survey i TABLE OF CONTENTS Page 1.0 INTRODUCTION... 1 2.0 SUMMARY OF TRAVEL... 2 2.1 All-Day Travel Patterns... 2 2.1.1 Automobile Availability... 2 2.1.2 Trip
1.0 BACKGROUND NEW VETERANS CHARTER EVALUATION OBJECTIVES STUDY APPROACH EVALUATION LIMITATIONS... 7
 New Veterans Charter Evaluation Plan TABLE CONTENTS Page 1.0 BACKGROUND... 1 2.0 NEW VETERANS CHARTER EVALUATION OBJECTIVES... 2 3.0 STUDY APPROACH... 3 4.0 EVALUATION LIMITATIONS... 7 5.0 FUTURE PROJECTS...
Evaluating your resources
 Evaluating your resources Is agricultural tourism for you? Penny Leff UC SAREP Agritourism is: Any incomegenerating activity conducted on a working farm or ranch for the enjoyment and education of visitors.
HOW TO OPERATE A PRODUCT DEVELOPMENT FAMILIARIZATION TOUR MANUAL FINAL REPORT FOR DEPARTMENT OF TOURISM & CULTURE
 HOW TO OPERATE A PRODUCT DEVELOPMENT FAMILIARIZATION TOUR MANUAL FINAL REPORT FOR DEPARTMENT OF TOURISM & CULTURE August 2008 1.0 PROJECTAPPLICANT Kluane Inc. Geordan Clark, General Manager Box 20, Burwash
COMMUNICATIONS DEPARTMENT (Lisa Belsanti, Director) (Joshua Schare, Public Information Officer)
 (Joshua Schare, Public Information Officer)") CITY COUNCIL UNFINISHED BUSINESS AUGUST 21, 2017 SUBJECT: INITIATED BY: SUNSET STRIP ENTERTAINMENT SHUTTLE - PILOT PROGRAM HUMAN SERVICES & RENT STABILIZATION DEPARTMENT (Elizabeth Savage, Director) 'fj1f'..
CITY COUNCIL UNFINISHED BUSINESS AUGUST 21, 2017 SUBJECT: INITIATED BY: SUNSET STRIP ENTERTAINMENT SHUTTLE - PILOT PROGRAM HUMAN SERVICES & RENT STABILIZATION DEPARTMENT (Elizabeth Savage, Director) 'fj1f'..
Agritourism Industry Development in New Jersey
 Agritourism Industry Development in New Jersey Brian J. Schilling Associate Director, Rutgers Food Policy Institute Delaware Valley Regional Planning Commission, Land Use and Housing Committee The Delaware
FNORTHWEST ARKANSAS WESTERN BELTWAY FEASIBILITY STUDY
 FNORTHWEST ARKANSAS WESTERN BELTWAY FEASIBILITY STUDY EXECUTIVE SUMMARY The 2030 Northwest Arkansas Regional Transportation Plan developed by the Northwest Arkansas Regional Planning Commission (NWARPC)
Oregon 2009 Visitor Report June, 2010
 Oregon 2009 Visitor Report June, 200 Table of Contents Introduction...... 3 Methodology.. 4 U.S. Travel Market Size & Structure.. 5 Oregon s Travel Market Size & Structure...... Overnight Trip Detail............
PURPOSE AND NEED (CONCURRENCE POINT 1) NEW CANADA ROAD PROJECT FROM STATE ROUTE 1 (U.S. HIGHWAY 70) TO U.S. INTERSTATE 40
 NEW CANADA ROAD PROJECT FROM STATE ROUTE 1 (U.S. HIGHWAY 70) TO U.S. INTERSTATE 40") PURPOSE AND NEED (CONCURRENCE POINT 1) NEW CANADA ROAD PROJECT FROM STATE ROUTE 1 (U.S. HIGHWAY 70) TO U.S. INTERSTATE 40 Project Description The primary purpose of this project is to improve the major
PURPOSE AND NEED (CONCURRENCE POINT 1) NEW CANADA ROAD PROJECT FROM STATE ROUTE 1 (U.S. HIGHWAY 70) TO U.S. INTERSTATE 40 Project Description The primary purpose of this project is to improve the major
N4 Carrick-on-Shannon to Dromod Road Project. 2.1 Introduction
 Chapter 2 Need for the Scheme 2.1 Introduction The National Primary Route N4, Dublin to Sligo is a strategic corridor from Dublin to the northwest and border counties (See RCSR 101 in Volume 2). The National
CAMPER CHARACTERISTICS DIFFER AT PUBLIC AND COMMERCIAL CAMPGROUNDS IN NEW ENGLAND
 CAMPER CHARACTERISTICS DIFFER AT PUBLIC AND COMMERCIAL CAMPGROUNDS IN NEW ENGLAND Ahact. Early findings from a 5-year panel survey of New England campers' changing leisure habits are reported. A significant
DISTRICT EXPRESS LANES ANNUAL REPORT FISCAL YEAR 2017 JULY 1, 2016 JUNE 30, FloridaExpressLanes.com
 DISTRICT EXPRESS LANES ANNUAL REPORT FISCAL YEAR 2017 JULY 1, 2016 JUNE 30, 2017 FloridaExpressLanes.com This page intentionally left blank. TABLE OF CONTENTS List of Figures... ii List of Tables.... ii
Economic Impact of Tourism in South Dakota, December 2018
 Economic Impact of Tourism in South Dakota, 2018 December 2018 1) Key Findings Growth rebounds in 2018 as a strong hunting season drives tourism growth Key facts about South Dakota s tourism sector Key
Implementation Strategy for the Lethbridge Destination Management Organization (LDMO)
") Implementation Strategy for the Lethbridge Destination Management Organization (LDMO) IMPLEMENTATION AND TRANSITION STRATEGY LDMO MANDATE: To establish a destination management organization that provides
Implementation Strategy for the Lethbridge Destination Management Organization (LDMO) IMPLEMENTATION AND TRANSITION STRATEGY LDMO MANDATE: To establish a destination management organization that provides
ROYAL GORGE PARK and RECREATION AREA. A Feat of Natural and Man-Made Engineering
 ROYAL GORGE PARK and RECREATION AREA A Feat of Natural and Man-Made Engineering As Growth Resumed in the 1870 s Town Leaders Began to Envision a Tourist Industry. The Arkansas River Canyon was advertised
Crown Corporation Business Plans. Trade Centre Limited
 Crown Corporation Business Plans Trade Centre Limited Contents Message from the CEO and the Chair... 5 Mandate... 7 Alignment with Government s Priorities... 7 Core Responsibilities... 9 Budget Context...
The Economic Impact of Tourism in Buncombe County, North Carolina
 The Economic Impact of Tourism in Buncombe County, North Carolina 2017 Analysis September 2018 Introduction and definitions This study measures the economic impact of tourism in Buncombe County, North
Accountability Report
 2017-2018 Accountability Report Tourism Nova Scotia Contents Accountability Statement... 3 Message from the Chair & CEO... 4 Financial Results... 6 Measuring Our Performance... 7 Accountability Statement
TOWN PLANNING SUBMISSION TO THE GREATER SYDNEY COMMISSION LANDS AT ARTARMON
 TOWN PLANNING SUBMISSION TO THE GREATER SYDNEY COMMISSION LANDS AT ARTARMON March 2017 TABLE OF CONTENTS 1.0 INTRODUCTION 3 2.0 THE SUBJECT SITE 4 3.0 STRATEGIC PLANNING CONTEXT 6 4.0 SUMMARY AND CONCLUSIONS
Oregon 2011 Visitor Final Report
 Oregon 0 Visitor Final Report Table of Contents Introduction...... 3 Methodology.. U.S. Travel Market Size & Structure..... 5 Oregon Travel Market Size & Structure... Overnight Trip Detail............
TORONTO TRANSIT COMMISSION REPORT NO. SUBJECT: TORONTO-YORK SPADINA SUBWAY EXTENSION STATION NAMES IN THE CITY OF VAUGHAN
 TORONTO TRANSIT COMMISSION REPORT NO. MEETING DATE: February 29, 2011 SUBJECT: TORONTO-YORK SPADINA SUBWAY EXTENSION STATION NAMES IN THE CITY OF VAUGHAN ACTION ITEM RECOMMENDATIONS It is recommended that
Crown Corporation BUSINESS PLANS FOR THE FISCAL YEAR Trade Centre Limited. Table of Contents. Business Plan
 Crown Corporation BUSINESS PLANS FOR THE FISCAL YEAR 2014 2015 Trade Centre Limited Business Plan 2014 2015 Table of Contents Message from the CEO and the Chair... Mission... Planning Context... Strategic
HOV LANE PERFORMANCE MONITORING: 2000 REPORT EXECUTIVE SUMMARY
 Final Report Research Project Agreement No. T1803, Task 4 HOV Monitoring V HOV LANE PERFORMANCE MONITORING: 2000 REPORT EXECUTIVE SUMMARY by Jennifer Nee TRAC Research Engineer John Ishimaru TRAC Senior
People. Product. Promotion. Tourism Industry Priorities for Election 2018
 People. Product. Promotion. Tourism Industry Priorities for Election 2018 Introduction Tourism in Ontario Tourism is a growth market, projected to generate more than $31 billion in visitor spending in
Cedar Rapids Area Convention and Visitors Bureau Visitor Study
 Cedar Rapids Area Convention and Visitors Bureau Visitor Study 2003-2004 University of Northern Iowa Sustainable Tourism & The Environment Program www.uni.edu/step Project Directors: Sam Lankford, Ph.D.
MRO 2017 Stakeholder Survey
 MRO 2017 Stakeholder Survey Summary Results Conducted in October 2017 MIDWEST RELIABILITY ORGANIZATION 380 St. Peter Street, Ste.800 St. Paul, MN 55102 P: 651.855.1760 F: 651.855.1712 www.midwestreliability.org
Lake Placid Assessment Updated November 2008
 Lake Placid Assessment Updated November 2008 Intro Statement Years ago, Lake Placid took its tourism future in its own hands. It took a blossoming Adirondack resort destination and went out and convinced
IATOS 2003 Outdoor Enthusiast Survey CTC Market Research March, 2003
 IATOS 2003 Outdoor Enthusiast Survey CTC Market Research March, 2003 The IATOS Expo (International Adventure Travel and Outdoor Sports Show, Chicago, February 2003) provided the CTC s Outdoor Product Development
Final Environmental Impact Statement for the Merced Wild and Scenic River. Comprehensive Management Plan, Yosemite National Park, Madera and Mariposa
 This document is scheduled to be published in the Federal Register on 02/26/2014 and available online at http://federalregister.gov/a/2014-04061, and on FDsys.gov DEPARTMENT OF THE INTERIOR 4312-FF NATIONAL