Census 2011 Constituency results: United Kingdom
|
|
|
- Jason Pierce
- 5 years ago
- Views:
Transcription
1 Census 2011 Constituency results: United Kingdom 26 February 2014 This paper presents 2011 Census summary data for the 650 parliamentary constituency areas in the UK. It covers key census statistics for the resident population of each area and includes a summary of constituencies with the highest and lowest ratios for these variables. Supplementary tables with data for all constituencies are available on-line. Richard Cracknell Nick Duckworth Oliver Hawkins John Wood
2 Recent House of Commons Library Research Papers /73 Germany s 2013 election: shaping the future? /74 Unemployment by Constituency, December /01 Water Bill: Committee Stage Report /02 Economic Indicators, January /03 European Union (Approvals) Bill [HL] [Bill 119 of ] /04 Unemployment by Constituency, January /05 Consumer Rights Bill [Bill 161 of ] /06 Deregulation Bill [Bill 162 of ] /07 Economic Indicators, February /08 Criminal Justice and Courts Bill [Bill 169 of ] /09 Unemployment by Constituency, February Research Paper 14/10 Contributing Authors: Richard Cracknell, Social & General Statistics Section Nick Duckworth, Social & General Statistics Section Oliver Hawkins, Social & General Statistics Section Matt Keep, Social & General Statistics Section This information is provided to Members of Parliament in support of their parliamentary duties and is not intended to address the specific circumstances of any particular individual. It should not be relied upon as being up to date; the law or policies may have changed since it was last updated; and it should not be relied upon as legal or professional advice or as a substitute for it. A suitably qualified professional should be consulted if specific advice or information is required. This information is provided subject to our general terms and conditions which are available online or may be provided on request in hard copy. Authors are available to discuss the content of this briefing with Members and their staff, but not with the general public. We welcome comments on our papers; these should be ed to papers@parliament.uk. ISSN
3 Contents Recent House of Commons Library Research Papers 2 Summary 1 1 Introduction Census Continuity with earlier Censuses New questions for Questions to improve population and migration statistics 5 Visitors 5 Second residence 6 Month and year of entry into the UK, and intended length of stay 6 Citizenship (passports) Other new questions 6 National identity 6 Language 6 Bedrooms 7 Type of central heating Changed questions 7 Ethnic group 7 Civil partnerships Topics not included in the Census 7 Income 7 Sexual identity 8 3 Censuses in Wales, Scotland and Northern Ireland Census questions 10 4 Constituency Results 12 Excel spreadsheet: 12 PDF reports index: 12 Tableau visualisations: Where can I find more census data? KS 101 Population and population density KS102 Age 16
4 4.4 KS105 Household Composition KS106 Households where no adults are in employment KS201 Ethnic Group of residents KS204 Country of birth Table KS205: Passports held* 26 * England, Wales and Northern Ireland only KS206 Households: English/Welsh Language KS209 Religion KS301 Self assessed health KS402 Housing tenure KS404 Cars and vans KS 501 Qualifications KS 605 Industry KS 611 Socio-economic classification (NSSec) 42 Appendix 1 Constituency report on-line: specimen tables Cities of London and Westminster constituency 44 Appendix 2 Table Definitions 62
5 Summary Population censuses in the UK have been held nearly every 10 years since In 2011 a Census was carried out on Sunday 27 March. On 17 December 2012, the ONS announced that the population of the United Kingdom on Census day (27 March 2011) was 63,181,775, comprising: England 53,012,456 (83.9%) Wales 3,063,456 (4.8%) Scotland 5,295,000 (8.4%) Northern Ireland 1,810,863 (2.9%) The 2011 Census included many questions that have been included previously, and to these were added new questions, many of which aimed to better understand changes in migration and social diversity which had taken place in the previous decade. Constituency census results for the whole of the UK became available in December The census provides a unique source of information about the social composition of these areas. The Research Paper is supplemented by on-line resources, including a set of standard tables for each constituency area. It largely replaces an earlier Research Paper which looked at census results for constituencies in England and Wales, Research Paper 13/20 Census 2011 Constituency results: England & Wales. However, that paper has some information not presented here, where topics were not covered in the 2011 Census to allow UK-wide comparisons. 1
6 1 Introduction The 2011 Census was carried out by the Office for National Statistics (ONS) in England and Wales, the General Register Office for Scotland (now National Records Scotland) and the Northern Ireland Statistics and Research Agency on Sunday 27 March On 17 December 2012, the ONS announced that the population of the United Kingdom on Census day (27 March 2011) was 63,181,775, comprising: England 53,012,456 (83.9%) Wales 3,063,456 (4.8%) Scotland 5,295,000 (8.4%) Northern Ireland 1,810,863 (2.9%) 1 Censuses in the UK have been held nearly every 10 years since The Census is the most comprehensive source of demographic and social statistics in the UK today. Almost all public bodies and many private companies, organisations and individuals use the Census for information on the number and characteristics of people and households, especially at local level. The Census is often a unique source of data for parliamentary constituencies as robust data is not always available for this geography from statistics derived from surveys and administrative records. The legislation governing the Census, Census Act 1920, applies to Great Britain, but there are provisions for separate censuses to be carried out in Scotland. Since 1998 the census has been a devolved matter in Scotland 3. In Wales in 2011, for the first time, Welsh Ministers made the Census Regulations. Separate legislation covers the census in Northern Ireland the Census Act (Northern Ireland) Census 2.1 Continuity with earlier Censuses Questions about age, sex, birthplace, occupation, housing and marital status were present in the 2011 schedule, as they have been in most cases continuously since the first Census in the UK. Questions on place of work, ethnicity and availability of cars were also present in 2011 and can be compared with earlier Censuses, albeit only those from more recent time ONS Statistical Bulletin 2011 Census: Population Estimates for the United Kingdom, 27 March 2011 dated 17 December 2012 Regular censuses have taken place, with few exceptions, every ten years since The main exception being 1941 because of the Second World War; in 1966 there was an interim sample Census Scotland Act 1998 (ch. 46) Census Act (Northern Ireland) 1969 (ch. 8) (Act of the Northern Ireland Parliament) 2
7 Topic coverage of the Census of Population in England and Wales, Age Sex Marital Status Birthplace Nationality/national identity Ethnicity Religion Usual residence Second address Migration Main language Passport Economic position Journey to work Occupation Industry Time since last employment Size of workforce Place of work Supervisor status Qualifications Fertility within marriage Marriage duration Housing (number) Rooms/bedrooms (number) Tenure Lowest floor level of accommodation Household amenities (inc type of central heating) Access to motor vehicles Self-assessed general health Infirmity Provision of unpaid personal care Limiting long-term illness Note: this was a sample census (see p.7) Source: Angela Dale and Catherine Marsh The 1991 Census: A User's Guide (1993); Office for National Statistics 3
8 2.2 New questions for 2011 The main difference in the 2011 Census questionnaire over the 2001 version was in the topics covered. There were eight new topics in England and Wales: Number of bedrooms, Type of central heating, Second address, Month and year of arrival in the UK, Intended length of stay in the UK, National Identity, Passports held, and Main language. Three topics in 2001 were not included in 2011: number of employees in workplace, household access to WC/bath/shower, and lowest floor level of dwelling. The question about central heating was changed to be more specific. The 2011 questionnaire included 26 topics about individuals, and 11 about households. The 2001 questionnaire included 21 topics about individuals, and 11 about households. Generally, it is possible to compare statistics for 2011 and 2001 where the topics were included in both years. Table 1 and Table 2 compare the topics covered in the 2001 Census with those used for the 2011 Census. 5 Table 1: Content for individual pages in England and Wales Topic Name Yes Yes Sex Yes Yes Date of birth Yes Yes Marital or civil partnership status [2011] Yes Yes Students in full-time education and term-time address Yes Yes Country of birth Yes Yes Address one year ago Yes Yes Ethnic Group Yes Yes Religion Yes Yes Knowledge of Welsh (Wales only) Yes Yes Health status Yes Yes Long-term illness or disability Yes Yes Carer information Yes Yes Qualifications Yes Yes Economic activity status Yes Yes National Statistics Socio-economic Classification (self-employed, occupation, supervisor status, ever worked) Industry/name of employer Yes Yes Workplace address Yes Yes Transport to place of work Yes Yes Yes Yes 5 The 2011 Census: Final questionnaire content for England and Wales 4
9 Hours worked Yes Yes Second residence No Yes Main Language and English Language Proficiency No Yes Month/year of entry into UK No Yes Intended length of stay in UK No Yes Citizenship (passports held) No Yes National identity No Yes Number of employees at the workplace Yes No Table 2: Content for household pages in England and Wales Topic Usual residence Yes Yes Household and family relationships Yes Yes Accommodation type Yes Yes Dwellings and self-contained accommodation Yes Yes Number of rooms Yes Yes Household tenure Yes Yes Type of landlord Yes Yes Number of vehicles Yes Yes Visitor information No Yes Number of bedrooms No Yes Type of central heating 6 No Yes Central heating Yes No Bath/shower and toilet access Yes No Lowest floor level Yes No Questions to improve population and migration statistics There had been considerable controversy about the quality of migration and population statistics over the past few years. The Treasury Select Committee held an inquiry and produced a report Counting the population in May This included a role for the Census in statistics on migration and population, and a number of new questions were included with this aim. 8 Visitors In 2011 there were questions in the Census about visitors staying with each household. In 1991, everyone staying at an address on Census night, including visitors, was counted in the Census. However, in 2001 the Census counted persons at their place of residence whether or not they were actually present there on Census night, and did not count visitors. According to ONS, there is some evidence that failure to attempt to capture visitors and 6 The question on whether or not a household has central heating is replaced by the question on what type of central heating the household has. 7 House of Commons Treasury Committee Counting the population Eleventh Report of Session For further information on these questions see Final recommended questions 2011 Migration 5
10 confusion as to where visitors should be recorded, were factors that led to under-coverage in the 2001 Census. To minimise under-reporting, ONS included questions to collect information on visitors present in households on Census night in 2011, as well as counting people where they were usually resident. The number of visitors present at the address on Census night was recorded, along with their age, sex and usual address, so that each person can be linked to their usual residence. Second residence To improve coverage in the Census and to better understand the reasons for undercoverage, ONS introduced further questions on residence arrangements, particularly multiple residence. Together with the information on usual address, responses to these new questions should enable ONS to better allocate the population to the most appropriate area of usual residence determined by the living patterns of households, and will help reconcile the Census counts with the mid-year population estimates. The information could also be useful for housing and transport planning, and to local authorities who want to know the numbers of people who stay within their area and use local services during the week but whose usual residence is elsewhere. Month and year of entry into the UK, and intended length of stay There were new questions on month and year of entry into the UK, and intended length of stay, for all those persons born outside UK. These questions aimed to provide a means of better establishing whether people were short or long term migrants, and a better understanding of how long migrants stay in the UK. The results should feed into better estimates of long-term and short-term residents in an area. Citizenship (passports) A new question to identify citizenship (as measured by the passports a person holds), along with the traditional question on country of birth, provides estimates of the numbers and circumstances of immigrant communities. 2.3 Other new questions National identity In order to make provision for those people, regardless of their broad ethnic group, to indicate their identity as being British, English or Welsh (or Scottish or Northern Irish, etc), a new additional and separate component to the ethnicity question was asked about national identity. 9 Language Although a question on Welsh language has been asked in Wales for many years, there has not been a Census question on languages before. ONS introduced new questions in the 2011 Census on language. People were asked the main language they use and their ability in speaking English. This allowed respondents to record their main language (including sign languages) if this was not English (or English or Welsh in Wales). Responses provide an 9 More information about this question can be found in Final recommended questions for the 2011 Census in England and Wales - National identity 6
11 indication of areas and communities where foreign language service provision might be necessary, and better understanding of the diversity of the population in different areas. 10 Bedrooms A new question on the number of bedrooms was included, to form part of a measure of overcrowding. 11 Type of central heating A question on the type of central heating replaced the previous one on whether households had central heating or not. This was intended to provide an indicator of basic housing standards, and is expected to be used by central government, local authorities and other users to facilitate work on fuel poverty and deprivation Changed questions Ethnic group The format of the question on ethnic group in England and Wales was more detailed than in 2001, to reflect changing needs and the dynamic profile of different ethnic groups. New response categories for Gypsy or Irish Traveller and Arab were introduced. 13 Civil partnerships Following legislation in 2004, the question on marital status was expanded to include response categories for civil partners. 2.5 Topics not included in the Census Income and sexual identity are discussed below. According to ONS, other topics considered were not proposed for inclusion because: the case for them was not considered strong enough to displace one or more of the proposed topics, tests had showed that the quality of the information obtained from a Census question would not be fit for purpose, or questions would place too great a burden on the public. 14 Income ONS has said that the user requirements for an income question were less than those expressed for other topics successfully competing for space on the 2011 Census questionnaire. In addition, when ONS tested a question on income in the 2007 Census Test, they found that including the question led to a 2.7 percentage point reduction in the response rate. This drop in the number of people filling in forms was judged as outweighing the benefits of including the question. 10 More information about this question can be found in Final recommended questions Language 11 Helping to shape tomorrow: The 2011 Census of Population and Housing in England and Wales 12 Helping to shape tomorrow: The 2011 Census of Population and Housing in England and Wales 13 Final recommended questions Ethnic group 14 Helping to shape tomorrow: The 2011 Census of Population and Housing in England and Wales 7
12 A question on household income was proposed and tested in Scotland, but was not included in the final Order approved by the Scottish Parliament. Sexual identity Consultation with users, particularly during the 2005 programme, indicated a strong requirement for the Census to seek to collect information on sexual identity in order to provide a benchmark against which equality monitoring policies could be better assessed. There are however concerns about the accuracy of the results of a question on sexual identity in the Census and ONS decided not to include a question on sexual identity in the Census. However in recognition of the importance of collecting this information for equality monitoring, it started a project to develop a question on sexual identity which will be both acceptable and ensure that high quality data is collected when used in national surveys. Other areas of controversy Question on religion Consultation with users had suggested that the form of the 2001 question on religion would not meet all their requirements. 15 In particular the case was argued that: the Christian and Muslim categories were too broad there was a need for information on additional religions and specific nonreligious beliefs the concept of religious practice should be distinguished from affiliation/ identity ONS argued that space constraints mean that it is unable to provide additional tick boxes for other religions or to further break down existing categories. It acknowledges that the proposed question did not measure religious practice, but stated that it did not believe that a single religion question could be developed in such a way that would capture this information suitably and in a way that would justify losing comparability with It had also been argued that the proposed question on religion What is your religion? is potentially leading as some respondents may feel that they are expected to identify with a religion. To reduce the potential bias, ONS placed none as the first response option in order that respondents would realise they did not have to answer the question by identifying with a religion. Note that as in 2001 the religion question in the Census was voluntary the Census (Amendment) Act 2000 amended the Census Act 1920 to permit the inclusion of a question on religion but lifted the penalty for not responding to this question. Bedroom snooping There were a number of media reports mentioning intrusive questions in the Census. In particular, concerns have been raised about the questions on the number of bedrooms in people's homes, and asking for the details of overnight visitors. In response to these reports, the National Statistician explained why the ONS was collecting this information: 16 Proposed questions about the number of bedrooms and the number of people who live in a household will allow local councils to establish whether accommodation in 15 Final recommended questions Religion 16 See `Website link 8
13 their area is overcrowded. Plans to meet any additional housing needs can then be better defined for that area. Quite separately, the proposed questions also include details of visitors on Census night to ensure that people away from home are included in the Census, even if they are not recorded on their home questionnaire. This will enable more accurate estimates of the whole population to facilitate effective planning and funding decisions. Calls for further ethnicity tick boxes (including Sikh, Kashmiri) User consultations identified requests for additional ethnic group response categories than could fit on the Census questionnaire. In England and Wales, ONS said that there was only room for an additional two tick-boxes. 17 The additional tick-boxes which were requested fell broadly in two categories: a) Those groups which had nowhere obvious to tick in 2001, and so selected other and wrote in (for example Arab, eastern European, Gypsy and Irish Traveller, Iranian, Kurdish, Sri Lankan, Vietnamese) b) Those who had a relevant tick-box in 2001, but were aggregated with other groups (for example Cornish, east African Asian, Kashmiri, Sikh, specific African groups). Following a prioritisation exercise, new response categories for Gypsy or Irish Traveller and Arab were introduced. Other new categories were not included, although where a person filling in a Census form felt that their ethnicity was not appropriately described by a tick box, they could write-in their ethnicity on the form. Among the categories not included, requests for Kashmiri and Sikh identity to be recognised were particularly prominent. In the proposed Census questions, Sikh was included as an option in the religion question. It was not however included as an option in the ethnicity question. Following consultation, ONS carried out research into the inclusion of a Kashmiri tick box. Their focus groups and interviews suggested that most Kashmiris did not have strong feelings about the need for a tick-box. Participants of Kashmiri, Pakistani and Indian ethnicity raised concerns about the potential confusion arising from the inclusion of a Kashmiri tickbox. After consideration of the available evidence, ONS recommended against the addition of a specific Kashmiri tick-box in the ethnic group question for the 2011 Census. 18 During the process for the Parliamentary approval of key elements of the Census Order, there was a division on a proposal that people be able to tick a box to record themselves as Cornish. This proposal was rejected. 3 Censuses in Wales, Scotland and Northern Ireland The Census is a devolved matter in Scotland and Northern Ireland. The General Register Office for Scotland 19 and the Northern Ireland Research and Statistics Agency were responsible for making arrangements for taking the Census in their countries. The Scottish 17 Final recommended questions Ethnic group 18 Kashmiri research project Final report 19 Since April 2011 merged with National Archives Scotland to form National Records Scotland 9
14 Parliament and Northern Ireland Assembly are responsible for approving or rejecting the secondary legislation for the Census (the Census Orders and Regulations). In Wales the Census Regulations (but not the Census Order, which is for the UK Parliament, after consultation with the Welsh Ministers) was a matter for the Welsh Assembly. ONS led on the Census for Wales, and made arrangements to ensure that Census materials were available in Welsh and field staff were bilingual, especially in areas with higher than average proportions of Welsh speakers. The statistical offices of England and Wales, Scotland, and Northern Ireland agreed to conduct Censuses simultaneously throughout the UK in 2011 (subject to approval by the UK Parliament, the Scottish Parliament and the Northern Ireland Assembly). 20 The Offices aim was to promote UK harmonisation and to produce consistent and coherent outputs for the UK and for each component country. 3.1 Census questions Differences in questions between countries There were some differences in questions between the different countries. For example, the Scottish Census included questions not asked in England and Wales on household income and the nature of long-term health conditions (blindness, deafness etc) 21, and omitted other questions, for example on number of bedrooms and citizenship (passports held). There were also some differences in the details of the questions asked, for example the Scottish census asked about Polish and Indian national identity. The three Census offices, however, agreed that common questions should be adopted wherever possible, diverging only in response to clear user needs, and maximising the scope for cross-comparison. In the final 2011 Census there were 65 questions asked in at least one of the questionnaires across the UK. These included questions relevant to only one country, such as knowledge of Welsh in Wales or proficiency in Gaelic in Scotland. There were 43 questions which were asked throughout the UK and in 33 of these the wording of the question and the response options was identical. Of the remaining ten where the question wording or response options differed, seven could be aggregated to provide consistent statistics across the UK. 22 Certain differences from previous Censuses were maintained for example more detailed questions on religion in Scotland, which make a distinction between different types of Christianity (Roman Catholic, Church of Scotland and other Christian). In Scotland, five new questions were introduced in 2011: long term health conditions, two questions on language, and questions on national identity and month/year of arrival in the UK. In Northern Ireland, there were questions on speaking Irish or Ulster-Scots (analogous to the Welsh Language question) together with more detailed questions on long-term health conditions and religion. While questions about religion and ethnic group are asked in the rest 20 Harmonisation documents can be found on the website of Northern Ireland Statistics and Research Agency 21 Also asked in Northern Ireland 22 The Conduct of the 2011 Censuses in the United Kingdom (UK): Statement of Agreement of the National Statistician and the Registrars General for Scotland and Northern Ireland (Feb 2011) 10
15 of the UK, the wording is different in Northern Ireland. Some Northern Ireland-specific questions were newly introduced in These included questions on migration, adapted accommodation, nature of disability and voluntary work. 11
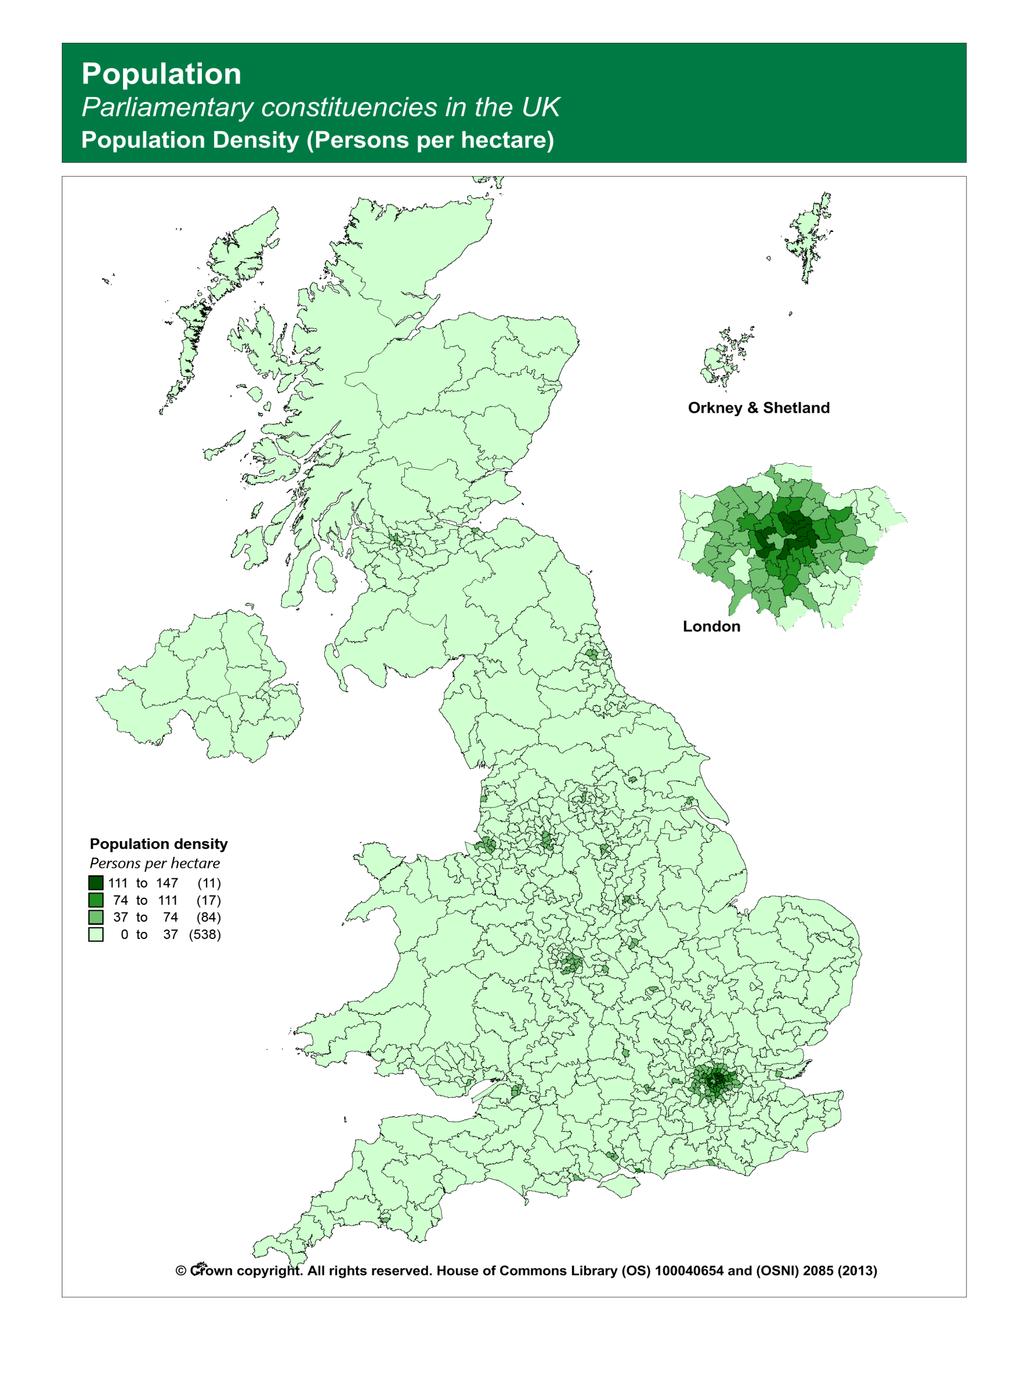
16 4 Constituency Results The tables and maps that follow draw on the set of Key Statistics (KS) tables produced by the Office for National Statistics (England and Wales), the Northern Ireland Statistics and Research Agency and National Records Scotland. For each of the topics: a map illustrates how one of the variables is distributed across parliamentary constituency areas. Maps show constituencies in one of four categories these groups are equal ranges between the highest and lowest constituency values. The key for each map shows how many of the 650 constituencies in the United Kingdom are in each range. Tables showing the constituencies with the twenty highest or twenty highest and lowest are shown alongside the maps for a selection of variables within each topic. In most cases constituencies are ranked on percentage values: 1= highest; 650 =lowest. The exception is table KS101 where rankings are shown for total population and population per hectare. The tables and maps are a subset of data presented in a set of standard reports for each constituency available online, (a specimen set of these tables is in Appendix 1). These show the values for constituencies and present a comparison for the percentage rates in the constituency with those for the county as a whole and the relevant region. These can be accessed either using Microsoft Excel or by accessing individual pdf reports for each constituency via the following links: Excel spreadsheet: ConstituencyProfile-uk.xlsx (Each topic is shown under a separate tab within the workbook) PDF reports index: Additional interactive versions of the tables and graphical presentation of the data, including comparisons of more than one constituency area are available at the following link: Tableau visualisations: Tableau.pdf 4.1 Where can I find more census data? Further Census data for parliamentary constituencies in England and Wales can be accessed from the Office for National Statistics Neighbourhood Statistics website or its National On-line Manpower Information Service which includes a facility to download data for different variables, tables for one or more constituencies. For Scotland the website provides 2011 Census data, including for Westminster (2005) parliamentary constituencies. The Northern Ireland Statistics and Research Agency (NISRA) makes census data available via its Neighbourhood Statistics website (NINIS)
17 Parliamentary constituencies for Westminster cover the same areas as Northern Ireland Assembly Areas (AAs) which is one of the standard NISRA census geographies. 13
18 4.2 KS 101 Population and population density Population Constituency People Rank West Ham 158,142 1 East Ham 149,842 2 Isle of Wight 138,265 3 Brent Central 137,438 4 Croydon North 136,044 5 Holborn and St Pancras 135,642 6 Manchester Central 134,326 7 Slough 134,048 8 Leeds Central 132,877 9 Ilford South 131, Hampstead and Kilburn 129, Tottenham 129, Poplar and Limehouse 128, Brentford and Islew orth 128, Brent North 128, Hackney North and Stoke New ington 128, Milton Keynes South 127, Birmingham, Ladyw ood 126, Bermondsey and Old Southw ark 126, Hornsey and Wood Green 125, Population Constituency People Rank Low est Na h-eileanan an Iar 27, Orkney and Shetland 44, Aberconw y 56, Arfon 60, Dw yfor Meirionnydd 61, Caithness, Sutherland and Easter Ross 62, Montgomeryshire 63, Aberavon 66, Ross, Skye and Lochaber 67, Cynon Valley 68, Brecon and Radnorshire 69, Wirral West 69, Rhondda 69, Ynys Môn 69, Blaenau Gw ent 69, Delyn 70, Wrexham 70, Carmarthen East and Dinefw r 71, Vale of Clw yd 71, Clw yd South 71, Population density (people per hectare)* Constituency People Rank Westminster North Hackney North and Stoke New ington Islington North Islington South and Finsbury Bethnal Green and Bow Vauxhall Kensington Chelsea and Fulham Bermondsey and Old Southw ark Poplar and Limehouse Hackney South and Shoreditch Streatham Camberw ell and Peckham Hammersmith Battersea Holborn and St Pancras Hampstead and Kilburn Tottenham Tooting Lew isham, Deptford Population density (people per hectare) Constituency People Rank Low est Ross, Skye and Lochaber Hexham Penrith and The Border Dw yfor Meirionnydd Montgomeryshire Dumfriesshire, Clydesdale and Tw eedd Inverness, Nairn, Badenoch and Straths Carmarthen East and Dinefw r Ludlow Thirsk and Malton Skipton and Ripon Penrith and The Border Preseli Pembrokeshire Torridge and West Devon Central Devon North Herefordshire Berw ick-upon-tw eed North Cornw all Louth and Horncastle Ceredigion
19 15
20 4.3 KS102 Age 0 to to 24 Birmingham, Hodge Hill Sheffield Central Bradford East Cardiff Central Barking New castle upon Tyne East Bradford West Nottingham South Birmingham, Hall Green Liverpool, Riverside Edmonton Leeds North West Ilford South Manchester Central Blackburn Leeds Central Erith and Thamesmead Bristol West Blackley and Broughton Oxford East Slough Portsmouth South East Ham Glasgow North Birmingham, Yardley Glasgow Central Hayes and Harlington Manchester, Gorton Luton North Leicester South Sheffield, Brightside and Hillsborough Cambridge Oldham West and Royton Sw ansea West Enfield North Canterbury Birmingham, Perry Barr Plymouth, Sutton and Devonport Birmingham, Ladyw ood Coventry South to to 64 Battersea Ross, Skye and Lochaber Tooting Derbyshire Dales Poplar and Limehouse Hexham Vauxhall Berw ick-upon-tw eed Streatham South East Cornw all Bermondsey and Old Southw ark Penrith and The Border Hammersmith Totnes Putney Beverley and Holderness Hampstead and Kilburn Buckingham Islington North Dumfriesshire, Clydesdale and Tw eeddale Hackney South and Shoreditch Stone Bethnal Green and Bow Torridge and West Devon Islington South and Finsbury East Dunbartonshire Cities of London and Westminster Ludlow Westminster North Central Devon Chelsea and Fulham Berw ickshire, Roxburgh and Selkirk Hackney North and Stoke New ington Argyll and Bute Hornsey and Wood Green Caithness, Sutherland and Easter Ross Lew isham, Deptford Maldon Edinburgh North and Leith Thirsk and Malton and older Constituency % Rank Christchurch Clacton North Norfolk New Forest West Bexhill and Battle East Devon West Dorset Worthing West Louth and Horncastle Totnes Suffolk Coastal Dw yfor Meirionnydd Tiverton and Honiton Westmorland and Lonsdale Chichester West Worcestershire Lew es Aberconw y Sefton Central Brecon and Radnorshire
21 17
22 4.4 KS105 Household Composition One person: Aged 65 and older One person: Aged Under 65 Clacton Glasgow Central Christchurch Cities of London and Westminster New Forest West Liverpool, Riverside Worthing West Kensington Dw yfor Meirionnydd Edinburgh North and Leith Bexhill and Battle Glasgow North North Norfolk Leeds Central East Devon Islington South and Finsbury Totnes Birmingham, Ladyw ood West Dorset Manchester Central Eastbourne Westminster North Chichester Bristol West Wirral West Nottingham East Aberconw y Edinburgh East Bognor Regis and Littlehampton Holborn and St Pancras Suffolk Coastal Chelsea and Fulham Lew es Glasgow North West Southport Hammersmith Sefton Central Poplar and Limehouse Westmorland and Lonsdale Glasgow North East One person: Aged 65 and older One person: Aged Under 65 Low est Low est Poplar and Limehouse Harrow East Lew isham, Deptford Christchurch East Ham Sefton Central Hackney North and Stoke New ington Chesham and Amersham Bethnal Green and Bow Rayleigh and Wickford Vauxhall Castle Point Battersea South Holland and The Deepings Birmingham, Ladyw ood Mid Dorset and North Poole Bermondsey and Old Southw ark York Outer Streatham Central Suffolk and North Ipsw ich West Ham South West Norfolk Bristol West South West Devon Tooting Haltemprice and How den Ilford South Buckingham Brent Central North East Hampshire Tottenham Henley Camberw ell and Peckham South Staffordshire Dulw ich and West Norw ood Saffron Walden Manchester Central Tonbridge and Malling Hackney South and Shoreditch New Forest West One family: Of which lone parent with dependent children Constituency % Rank Belfast West Edmonton Barking Foyle Croydon North Nottingham North Belfast North Tottenham Liverpool, Walton Enfield North Erith and Thamesmead Know sley Birmingham, Hodge Hill Glasgow East Croydon Central Birmingham, Erdington Liverpool, West Derby Camberw ell and Peckham Dagenham and Rainham Birkenhead One family: Of which lone parent with dependent children Constituency % Rank Low est Cities of London and Westminster Wimbledon Christchurch Aberdeen South Westmorland and Lonsdale The Cotsw olds Henley Sheffield, Hallam North East Hampshire Gordon South East Cambridgeshire Mole Valley South West Surrey Wyre and Preston North South Cambridgeshire North Norfolk Rayleigh and Wickford Ludlow Guildford Cambridge
23 19
24 4.5 KS106 Households where no adults are in employment With dependent children Without dependent children Birmingham, Hodge Hill Clacton Belfast West Christchurch Edmonton North Norfolk Barking New Forest West Foyle Louth and Horncastle Birmingham, Ladyw ood Sw ansea West Nottingham North Totnes Tottenham Dundee West Sheffield, Brightside and Hillsborough Blackpool North and Cleveleys Blackley and Broughton Bexhill and Battle Enfield North Worthing West Middlesbrough Glasgow North East Bradford East East Devon Belfast North Rhondda Ilford South Dw yfor Meirionnydd East Ham Inverclyde Wolverhampton North East North Ayrshire and Arran Liverpool, Walton West Dorset Manchester, Gorton Ayr, Carrick and Cumnock Hackney South and Shoreditch Glasgow East With dependent children Without dependent children Low est Low est Wyre and Preston North Battersea Sheffield, Hallam Tooting Westmorland and Lonsdale Poplar and Limehouse York Outer Streatham West Aberdeenshire and Kincardine Hornsey and Wood Green Haltemprice and How den Slough Gordon Lew isham, Deptford Henley Ilford South North East Hampshire East Ham Orkney and Shetland Putney Penrith and The Border Hayes and Harlington The Cotsw olds Vauxhall South Cambridgeshire Dulw ich and West Norw ood Buckingham Ealing, Southall Skipton and Ripon Wimbledon Kenilw orth and Southam Brentford and Islew orth Winchester Walthamstow Mid Sussex Brent North Mole Valley Harrow West South Northamptonshire Bermondsey and Old Southw ark
25 21
26 4.6 KS201 Ethnic Group of residents White Constituency % Rank Caithness, Sutherland and Easter Ross West Tyrone Na h-eileanan an Iar North Antrim South Dow n North Ayrshire and Arran Mid Ulster Workington Banff and Buchan Penrith and The Border Dumfriesshire, Clydesdale and Tw eeddale New ry and Armagh Strangford Ross, Skye and Lochaber Ayr, Carrick and Cumnock Moray North West Durham Angus Montgomeryshire Orkney and Shetland White Constituency % Rank Low est East Ham Ilford South Brent North Birmingham, Ladyw ood Ealing, Southall Leicester East West Ham Croydon North Birmingham, Hall Green Birmingham, Hodge Hill Bradford West Brent Central Harrow East Birmingham, Perry Barr Harrow West Hayes and Harlington Poplar and Limehouse Camberw ell and Peckham Feltham and Heston Slough Mixed/multiple ethnic groups Asian/Asian British Nottingham East Leicester East Dulw ich and West Norw ood Ilford South Croydon North Bradford West Lew isham, Deptford East Ham Streatham Brent North Lew isham West and Penge Ealing, Southall Nottingham North Birmingham, Hodge Hill Vauxhall Birmingham, Hall Green Lew isham East Harrow East Islington North Harrow West Hackney South and Shoreditch Poplar and Limehouse Tottenham Feltham and Heston Camberw ell and Peckham Birmingham, Ladyw ood Croydon Central Slough Hornsey and Wood Green Bethnal Green and Bow Hackney North and Stoke New ington Bradford East Kensington Birmingham, Perry Barr Islington South and Finsbury Blackburn Hampstead and Kilburn Leicester South Birmingham, Ladyw ood Hayes and Harlington Black/African/Caribbean/Black British Other ethnic group Camberw ell and Peckham Westminster North Croydon North Cities of London and Westminster Lew isham, Deptford Kensington Edmonton Ealing Central and Acton Hackney South and Shoreditch Edmonton Tottenham Hammersmith Lew isham East Ealing North Erith and Thamesmead Finchley and Golders Green Brent Central Brent Central Dulw ich and West Norw ood Hackney North and Stoke New ington Vauxhall Tottenham Streatham Hampstead and Kilburn West Ham Hendon Birmingham, Ladyw ood Brent North Lew isham West and Penge Birmingham, Hall Green Barking Ealing, Southall Bermondsey and Old Southw ark Walthamstow Greenw ich and Woolw ich Hackney South and Shoreditch Hackney North and Stoke New ington Enfield, Southgate Walthamstow Chelsea and Fulham
27 23
28 4.7 KS204 Country of birth United Kingdom Constituency % Rank Low est Brent North East Ham Brent Central Westminster North Ealing, Southall Kensington Tottenham West Ham Cities of London and Westminster Harrow East Harrow West Ilford South Ealing Central and Acton Ealing North Hampstead and Kilburn Poplar and Limehouse Hammersmith Hendon Feltham and Heston Chelsea and Fulham United Kingdom Constituency % Rank Houghton and Sunderland South Know sley Islw yn Rhondda Blaenau Gw ent North Durham Easington Redcar Neath Staffordshire Moorlands Blyth Valley Ogmore North East Derbyshire Workington Wansbeck Jarrow Bishop Auckland Wentw orth and Dearne Washington and Sunderland West St Helens North Ireland Other European Union Fermanagh and South Tyrone Tottenham Foyle Kensington New ry and Armagh Cities of London and Westminster West Tyrone Chelsea and Fulham Brent Central Ealing Central and Acton Islington North Enfield, Southgate Belfast South Leyton and Wanstead Hammersmith Ealing North Hampstead and Kilburn Brent Central Ealing Central and Acton Westminster North Islington South and Finsbury Hornsey and Wood Green Luton North Walthamstow Coventry North West West Ham Ealing North Finchley and Golders Green Holborn and St Pancras Streatham Manchester, Withington Hammersmith South Dow n Peterborough Vauxhall Hampstead and Kilburn Luton South Vauxhall Birmingham, Erdington Hendon Other European Union Other European Union Member states in March 2001 Accession states: April 2001 to March 2011 Kensington Tottenham Cities of London and Westminster Ealing North Chelsea and Fulham Enfield, Southgate Westminster North Walthamstow Vauxhall Leyton and Wanstead Hammersmith West Ham Hampstead and Kilburn Peterborough Holborn and St Pancras Ealing Central and Acton Islington South and Finsbury Brent Central Battersea Hendon Bermondsey and Old Southw ark Edmonton Streatham Hornsey and Wood Green Cambridge Boston and Skegness Bethnal Green and Bow Brent North Islington North Finchley and Golders Green Richmond Park Mitcham and Morden Hackney South and Shoreditch Luton South Ealing Central and Acton Slough Putney East Ham Poplar and Limehouse Brentford and Islew orth
29 25
30 4.8 Table KS205: Passports held* * England, Wales and Northern Ireland only United Kingdom Republic of Ireland Cheadle Foyle Sefton Central Belfast West North East Hampshire New ry and Armagh Rayleigh and Wickford South Dow n Beckenham West Tyrone Brentw ood and Ongar Mid Ulster Old Bexley and Sidcup Fermanagh and South Tyrone Sheffield, Hallam Belfast South Sutton Coldfield Belfast North Mole Valley Upper Bann Chesham and Amersham East Londonderry Altrincham and Sale West South Antrim Rushcliffe North Antrim Maldon Lagan Valley Orpington East Antrim Epsom and Ew ell Strangford Arundel and South Dow ns Belfast East East Surrey North Dow n Horsham Brent Central Leeds North West Islington North Other Europe: EU countries Other Europe: Non EU countries Kensington Cities of London and Westminster Cities of London and Westminster Edmonton Tottenham Kensington Chelsea and Fulham Tottenham Brent Central Hackney South and Shoreditch Westminster North Hackney North and Stoke New ington Ealing Central and Acton Chelsea and Fulham Ealing North Enfield North West Ham Westminster North Leyton and Wanstead Hornsey and Wood Green Walthamstow Islington South and Finsbury Streatham Enfield, Southgate Hammersmith Hampstead and Kilburn Vauxhall Islington North Hampstead and Kilburn Poplar and Limehouse Finchley and Golders Green Finchley and Golders Green Brent North Wimbledon Hornsey and Wood Green Bermondsey and Old Southw ark Peterborough Holborn and St Pancras Putney Hammersmith No passport Constituency % Rank Walsall North Dw yfor Meirionnydd Blaenau Gw ent Nottingham North Great Grimsby Camborne and Redruth Great Yarmouth Ynys Môn Telford Wolverhampton North East Louth and Horncastle Stoke-on-Trent North Boston and Skegness Preseli Pembrokeshire Ashfield Wolverhampton South East Carmarthen East and Dinefw r Montgomeryshire West Bromw ich West Waveney
31 27
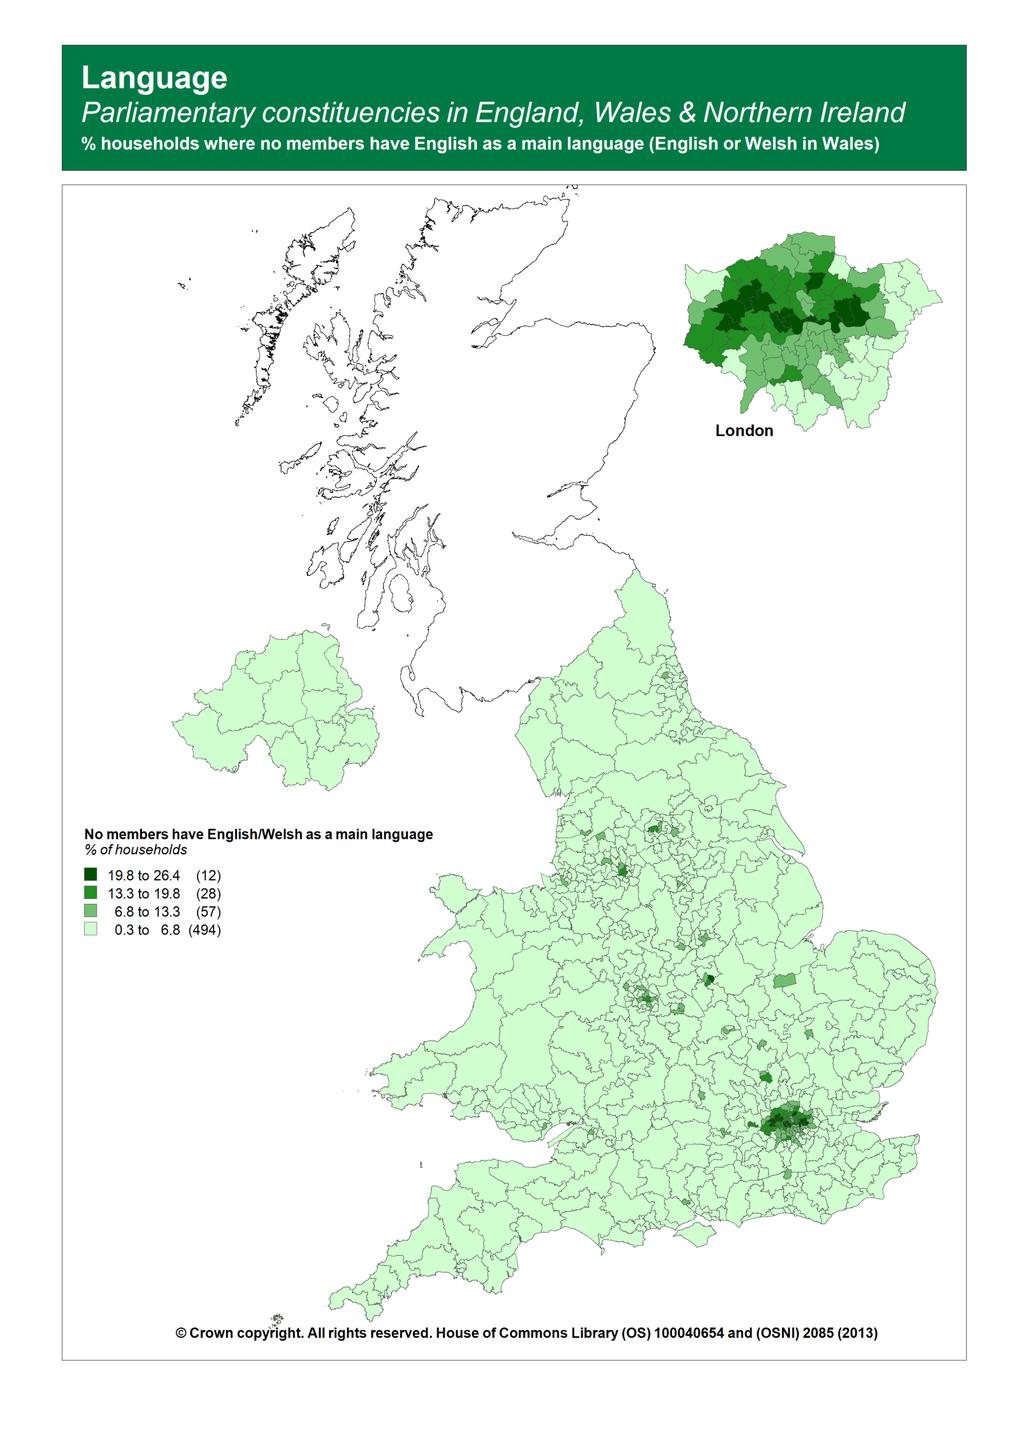
32 4.9 KS206 Households: English/Welsh Language England, Wales & Northern Ireland only All people aged 16 and over in household have English as a main language (English or Welsh in Wales) At least one but not all people aged 16 and over in household have English as a main language (English or Welsh in Wales) Know sley Ealing, Southall Redcar East Ham Bishop Auckland Ilford South Islw yn Bradford West Blyth Valley Brent North Ogmore Birmingham, Hall Green Rhondda Birmingham, Hodge Hill Wansbeck Bethnal Green and Bow North East Derbyshire West Ham Houghton and Sunderland South Brent Central Louth and Horncastle Harrow East North Durham Tottenham Neath Leicester East Workington Poplar and Limehouse Sefton Central Leyton and Wanstead Torfaen Walthamstow Sedgefield Feltham and Heston Staffordshire Moorlands Slough Penistone and Stocksbridge Harrow West Berw ick-upon-tw eed Birmingham, Perry Barr All people aged 16 and over in household have English as a main language (English or Welsh in Wales) At least one but not all people aged 16 and over in household have English as a main language (English or Welsh in Wales) Low est Low est East Ham Rhondda Ealing, Southall Know sley Brent North Blaenau Gw ent Tottenham Bishop Auckland Ilford South Houghton and Sunderland South Leicester East Blyth Valley Brent Central Staffordshire Moorlands West Ham Sedgefield Poplar and Limehouse Cynon Valley Bradford West Ogmore Westminster North Islw yn Bethnal Green and Bow Workington Ealing North Louth and Horncastle Feltham and Heston Wansbeck Harrow East Washington and Sunderland West Edmonton Wentw orth and Dearne Birmingham, Ladyw ood Redcar Walthamstow Halton Kensington Torfaen Harrow West North Durham No people in household have English as a main language (English or Welsh in Wales) Constituency % Rank East Ham Brent North Ealing, Southall Leicester East Tottenham Brent Central West Ham Westminster North Cities of London and Westminster Kensington Poplar and Limehouse Ealing North Ealing Central and Acton Edmonton Feltham and Heston Birmingham, Ladyw ood Ilford South Leicester South Bethnal Green and Bow Hendon No people aged 16 and over in household but at least one person aged 3 to 15 has English as a main language (English or Welsh in Wales) Constituency % Rank East Ham Ilford South Edmonton Tottenham Hayes and Harlington Brent North Ealing, Southall Brent Central Ealing North West Ham Harrow West Barking Poplar and Limehouse Leicester East Walthamstow Birmingham, Ladyw ood Birmingham, Hodge Hill Hendon Feltham and Heston Harrow East
33 29
Census data for the new parliamentary constituencies in England & Wales: Summary and overview
 Census data for the new parliamentary constituencies in England & Wales Summary and overview Research Paper 95/94-I (Part 1 of 2 vols.) 21 August 1995 This paper, in two volumes, summarises the results
Workless households for areas across the UK in 2010
 Workless households for areas across the UK in 2010 Coverage: UK Date: 08 September 2011 Geographical Area: Local Authority County Theme: Labour Market Animated YouTube Video A short video podcast explaining
S31 Grant determination for a high needs strategic planning fund in : DCLG ref 31/2916
 S31 Grant determination for a high needs strategic planning fund in 2016-17: DCLG ref 31/2916 Purpose of the fund Local authorities can use this fund to carry out a strategic review of their high needs
School improvement monitoring and brokering grant provisional allocations for illustrative purposes
 School improvement monitoring and brokering grant provisional allocations for illustrative purposes The school improvement monitoring and brokering grant was announced on 30 November 2016. This grant of
PQ Local Authorities with exceedances of NO 2 annual mean limit value (based on 2015
 PQ 47949 - Local Authorities with exceedances of NO 2 annual mean limit value (based on 2015 compliance assessment) Local Authorities with exceedances of NO 2 annual mean limit value (based on 2015 compliance
Healthwatch is the independent champion for people who use health and social care services.
 B R I E F I N G State of Support Local Healthwatch Funding 2017/18 30 November 2017 Overview Healthwatch is the independent champion for people who use health and social care services. Across the country
East Dunbartonshire Area Profile
 East Dunbartonshire Area Profile May 2014 Contents Executive Summary.. page 3 Introduction.. page 6 Population page 7 Age Structure. page 9 Population Projections page 11 Life Expectancy page 12 Ethnicity.
Numbers achieving 3 A grades in specific A-Level combinations by school type and LEA
 Numbers achieving 3 A grades in specific A-Level combinations by school type and LEA Statistics Report Series No. 9 Joanne L. Emery February 2009 Research Division Statistics Group Assessment, Research
Compilation of child poverty local indicators, update to September 2017
 Compilation of child poverty local indicators, update to September 2017 Laura Valadez-Martinez and Donald Hirsch, Centre for Research in Social Policy, Loughborough University Where child poverty is highest
Planned Expenditure by Local Authorities: Services for Young People
 Planned Expenditure by Local Authorities: Services for Young People Section 251 Under Section 251 of the Apprenticeships, Skills, Children and Learning Act 2009, local authorities are required to submit
East Dunbartonshire Area Profile
 East Dunbartonshire Area Profile May 2015 Contents Executive Summary.. page 3 Introduction.. page 6 Population page 7 Age Structure. page 9 Population Estimates..page 11 Population Projections page 13
Q Embargoed until March 2010
 www.nationwide.co.uk/hpi Embargoed until 0700 30 March 2010 London mini-boom leads UK price growth UK house prices increased by 1.6% quarter-on-quarter in Q1 London saw the strongest growth in the quarter
Most regions saw price falls during 2012
 www.nationwide.co.uk/hpi Embargoed until 0700 Thurs 3 Jan 2013 Most regions saw price falls during 2012 11 out of 13 UK regions saw annual price falls during 2012 London best performing region in 2012
Regional Volunteer registration form
 Regional Volunteer registration form Please clearly complete all sections of this form, sign the agreement and return it along with a passport-sized photograph to: War Memorials Trust, 1 st Floor, 14 Buckingham
Initial proposals for new Parliamentary constituency boundaries in London
 Initial proposals for new Parliamentary constituency boundaries in London Contents Summary 3 1 What is the Boundary Commission for England? 5 2 Background to the 2018 Review 7 3 Initial proposals for London
STAMP IDENTIFICATION NUMBERS
 STAMP IDENTIFICATION NUMBERS DEPARTMENT OF TRADE AND INDUSTRY WEIGHTS AND MEASURES (PRESCRIBED STAMP) REGULATIONS 1968 LIST OF IDENTIFICATION NUMBERS National Weights and Measures Laboratory Stanton Avenue
House prices in London continue to climb
 www.nationwide.co.uk/hpi Q2 2014 Embargoed until 0700 Wed 2 Jul 2014 House prices in London continue to climb All UK regions saw annual price rises in Q2 2014 London continues to lead, with annual price
House prices fall in most regions during the third quarter
 www.nationwide.co.uk/hpi Q3 2010 Embargoed until 0700 Thurs 30 Sep 2010 House prices fall in most regions during the third quarter House prices fell in nine out of thirteen UK regions in the third quarter
Embargoed until 30/03/2012
 The Halifax Rural Areas Quality of Life Survey tracks where living standards are highest in Great Britain by ranking local performance across key indicators covering the labour market, the housing market,
City employment: An overview from the Business Register & Employment Survey (BRES)
") employment September 2012 employment: An overview from the Business Register & Employment Survey (BRES) Rachel Smith, September 2012 On 28 September, the latest employment estimates for 2011, taken from
employment September 2012 employment: An overview from the Business Register & Employment Survey (BRES) Rachel Smith, September 2012 On 28 September, the latest employment estimates for 2011, taken from
Research Note th June Council liabilities
 Research Note 136 26th June 2014 Council liabilities Public sector debt is forecast by the Office for Budgetary Responsibility to exceed 1.3 trillion in 2014-15. 1 However, as explained by previous TaxPayers
Census 2011: City snapshot
 Census Snapshot September 2012 Census 2011: snapshot Rachel Smith, September 2012 On 16 July 2012 the first outputs from the Census 2011 for England and Wales were released, followed on 19 September 2012
Happy and healthy Hart tops 2012 Quality of Life Survey
 NOT FOR BROADCAST OR PUBLICATION BEFORE 00.01HRS Saturday 22 nd December 2012 The seventh annual Halifax Quality of Life Survey tracks where living standards are highest in the United Kingdom by ranking
NHS South Warwickshire CCG
 1 West Midlands South Worcestershire, Redditch, Bromsgrove & Wyre Forest (Fast Track with 2 & 3) NHS Redditch and Bromsgrove Worcestershire West Midlands NHS South Worcestershire NHS Wyre Forest 2 West
Your views matter and we hope you will help us to shape the future of fire and rescue in Scotland.
 SCOTTISH FIRE AND RESCUE SERVICE Draft Strategic Plan 2016-19 Overview The Scottish Fire and Rescue Service invites views on its draft Strategic Plan 2016-19. A cornerstone of our ongoing development of
Winners of the Exemplar Awards 2016
 Winners of the Exemplar Awards 2016 Winner of the Exemplar Award 2016 Leeds City Council Winner of the Peer Award 2016 David Lloyd, Huntingdonshire District Council Data Quality & Performance Awards 2016
Annex 3: CCGs confirmed for waves 1, 2, 3 and 4 for authorisation
 Annex 3: s confirmed for waves 1, 2, 3 and 4 for authorisation Below is a list of the clinical commissioning groups (s) which will be put forward for authorisation in wave 1, split by Commissioning Board
Supplementary information for Parliamentary Questions UIN : VOA Closures and UIN : VOA Staff. 15 December 2017
 Supplementary information for Parliamentary Questions UIN 117327: VOA Closures and UIN 117328: VOA Staff 15 December 2017 Notes about this release All dates shown in the attached pack are provisional and
Population analysis of North West London for John Lyon s Charity
 Population analysis of North West London for John Lyon s Charity This note summarises the findings of our population analysis for the eight north west London boroughs in which John Lyon s Charity is active.
Patterns of housing wealth inequality in Wales, Scotland and Northern Ireland
 Briefings No Appendix August 1 Housing Wealth and Household Welfare BRIEFINGS Patterns of housing wealth inequality in Wales, Scotland and Northern Ireland Appendix This appendix provides additional tables
Council Tax since
 27 December 2015 Council Tax since 1996-97 Since 2010, central government has offered grants to local authorities to freeze or cut Council Tax. Additionally, local authorities wishing to Council Tax by
BBC Local Democracy Reporter allocation
 BBC Local Democracy Reporter allocation Map shows distribution of reporters by BBC Nation and Region see page two, Table B for detail Page The distribution of reporters in Northern Ireland will be undertaken
2016-BASED HOUSEHOLD PROJECTIONS
 2016-BASED HOUSEHOLD PROJECTIONS PLANNING DESIGN ENVIRONMENT PEGASUSGROUP.CO.UK ECONOMICS 2016-BASED HOUSEHOLD PROJECTIONS The Office for National Statistics (ONS) released its 2016-household projections
Technical specification: BS 4449:2005 GRADE B500B BAR AND COIL
 BS 4449:2005 GRADE B500B BAR AND COIL DIAMETER SIZE EXTRA* COIL EXTRA* 8 mm 40.00 15.00 10 mm 25.00 15.00 12 mm 20.00 15.00 Base price + the following extras per size and/or format (coil) 16 mm - 15.00
2018 TOWN HALL RICH LIST. Theo Hutchinson April 2018
 2018 TOWN HALL RICH LIST Theo Hutchinson April 2018 For the eleventh comprehensive list of local authority employees in the United Kingdom whose total annual 6-17 financial year, the most recent full year
Council Performance Ratings 2010
 Council Performance Ratings 2010 Tameside Metropolitan Borough Council North West 4 - Performs excellently Wandsworth Borough Council London 4 - Performs excellently City of Westminster Council London
The RSPB National Swift Inventory Annual Report 2014
 The RSPB National Swift Inventory Annual Report 2014 Welcome to our first annual report outlining the data collated from the public and birding groups around the UK on common swifts Apus apus. We hope
Chapter 1: The Population of NHS Greater Glasgow and Clyde
 Population Estimate (thousands) Chapter 1: The Population of NHS Greater Glasgow and Clyde Population Trends and Projections National Records of Scotland estimated (NRS SAPE) 1 the 2013 NHS Greater Glasgow
CAA Passenger Survey Report 2017
 Business Intelligence (CAA Strategy & Policy Department) CAA Passenger Survey Report 2017 A survey of passengers at Birmingham, East Midlands, Gatwick, Heathrow, Leeds Bradford, Liverpool, London City,
Electoral Statistics 2012
 Electoral Statistics 2012 Standard Note: SN/SG/6258 Last updated: 10 July 2013 Author: Aliyah Dar Section Social and General Statistics This note provides data on electorates of parliamentary constituencies
Uttlesford takes the crown as Britain s best rural area to live
 Uttlesford takes the crown as Britain s best rural area to live The Halifax Rural Areas Quality of Life Survey tracks where living standards are highest in Great Britain by ranking local performance across
Unemployment by constituency, July 2014
 Unemployment by constituency, July 2014 RESEARCH PAPER 14/40 16 July 2014 This paper contains labour market figures for parliamentary constituencies, as well as a summary of the latest national and regional
Not for broadcast or publication before 00:01 Hrs on Monday 18th April 2011
 Press Release Embargoed until: 00:01 18.04.11 Not for broadcast or publication before 00:01 Hrs on Monday 18th April 2011 The Halifax Rural Areas Quality of Life Survey tracks where living standards are
Suitability of the subsurface for infiltration SuDS in Great Britain
 The British Geological Survey Suitability of the subsurface for in Great Britain Infiltration Drainage Ground stability Groundwater protection What are? Infiltration SuDS are sustainable drainage systems
England screening uptake rates
 England screening uptake rates The average screening uptake rate in England is 58% In some cases it is as low as 33% 44% of s in England are below the national average Seven out of ten of the worst areas
Happiness is a town called Harrogate destination named happiest place to live for THIRD year running
 Rightmove plc 3 rd & 4 th Floor 33 Soho Square London W1D 3QU Under embargo until 00.01 Thursday 6 th August Happiness is a town called Harrogate destination named happiest place to live for THIRD year
Census Briefing Paper One. Housing Tenure Structure in England (2001)
") 1 Census Briefing Paper One Housing Tenure Structure in England (2001) Summary The aim of this briefing paper is to provide an accessible summary of information from the 2001 census. The main objective
1 Census Briefing Paper One Housing Tenure Structure in England (2001) Summary The aim of this briefing paper is to provide an accessible summary of information from the 2001 census. The main objective
YouGov PlaceIndex results
 YouGov PlaceIndex results PlaceIndex is an exciting new way of scoring Britain s major cities. It can help understand why people want to visit, work and live in certain cities and this information can
Proforma Portfolio Summary Big Yellow Stores
 Strategic Report (continued) Proforma Portfolio Summary Big Yellow Stores 2016 2015 Mature (1) Established Developing Total Mature Established Developing Total Number of stores (2) 56 11 4 71 56 11 2 69
*** STRICTLY EMBARGOED UNTIL 7.00AM THURSDAY 2 APRIL 2009 *** Price falls across all regions in Q1 2009
 Price falls across all regions in 2009 Northern Ireland sees first moderation in price falls in two years Scotland saw prices fall sharply during but still the most resilient market Wales sees biggest
WAVERLEY TOPS ANNUAL RURAL AREAS QUALITY OF LIFE SURVEY
 NOT FOR BROADCAST OR PUBLICATION BEFORE 00.01HRS 29 TH MARCH 2013 The Halifax Rural Areas Quality of Life Survey tracks where living standards are highest in Great Britain by ranking local performance
The local elections of
 The local elections of 17 MAY 99 6 May 1999 This paper provides a brief summary of the local elections which took place in most parts of Great Britain on 6 May 1999. In the interest of producing the paper
356,500 people commuted to jobs in the City of London. 40 per cent from inner London, 29 per cent from outer London, 31 per cent from outside London
 CIS 2014-11 Commuting in London July 2014 The 2011 Census recorded the place of work and method of travel to work of all respondents aged 16 or over. The Special Workplace Statistics dataset provides information
Three in a row for Hart as it hangs on to title of best place to live
 NOT FOR BROADCAST OR PUBLICATION BEFORE 00.01HRS 21 DECEMBER 2013 The eighth annual Halifax Quality of Life Survey tracks where living standards are highest in the United Kingdom by ranking local performance
RAC Foundation for Motoring Local Authority Parking Finances in Scotland
 RAC Foundation for Motoring Local Authority Parking Finances in Scotland 2015-16 This note covers parking finances for the 32 local authorities in Scotland. Local authorities are required to submit details
CoStar Awards Submission Criteria & Market Boundaries
 Submission Criteria & Market Boundaries Agency Awards 2015 Table of Contents 1. Key Dates 2. How to Submit Data 3. Award Categories & Exclusions 4. Terms & Conditions 5. Market Boundaries & Definitions
Regional Spread of Inbound Tourism
 Regional Spread of Inbound Tourism Foresight issue 164 VisitBritain Research, January 2019 1 Contents Introduction Summary Key metrics by UK area Analysis by UK area Summary of growth by UK area Scotland
CCG Annual Assessment 2017/18
 Annual Assessment 2017/18 annual assessment 2017/18 Publications Gateway reference number: 08247 Version number: 3.0 First published: 12 July 2018 Prepared by: NHS England Assessment Team Classification:
Workplace Population: Key Facts
 : Key Facts May 2014 Introduction Friday 23 rd May saw release 5.2 of 2011 Census data. Included in this release were the first statistics on the workplace population and the first data provided at the
Affordability of city homes hits ten-year low
 NOT FOR BROADCAST OR PUBLICATION BEFORE 00.01 HRS FRIDAY 2 FEBRUARY Affordability of city homes hits ten-year low Affordability in cities has worsened with the ratio between house prices and average annual
2011 Census Snapshot: Migration flows
 CIS2014-10 July 2014 The 2011 Census asked respondents to state their address one year before the census if it was different from their current address. This dataset provides information on migration in
Actions to save bees by constituency
 Actions to save bees by constituency The list below shows how many actions to save bees have been taken in each UK constituency as part of the Bee Cause campaign. If the figure s high about 80 or more
Home affordability in cities at its worst since 2008
 NOT FOR BROADCAST OR PUBLICATION BEFORE 00.01 HRS SATURDAY 25 TH FEBRUARY 2017 Home affordability in cities at its worst since 2008 Average city house prices outpace earnings growth over last five years
Table 1. Employment loss across parliamentary constituencies in Great Britain due to a 'no deal' Brexit
 Table 1. loss across parliamentary constituencies in Great Britain due to a 'no deal' Brexit Workplace-basis workers workers who live elsewhere Residence-basis residents who work elsewhere residents workers
UCAS main scheme applications,
 UCAS main scheme applications, 2011-12 Notes on the data The main scheme relates to applications before June 30 each year (so principally excludes applications through clearing). Individuals can submit
Independent Age estimates - Pension Credit *ONS population data (2017) **Using DWP data (2016/17)
 **Using DWP data (2016/17)") Independent Age estimates - Pension Credit *ONS population data (2017) **Using DWP data (2016/17) Constituency Total 75+* Number of 75+ households eligible for Pension Credit that are not claming** Aberavon
Independent Age estimates - Pension Credit *ONS population data (2017) **Using DWP data (2016/17) Constituency Total 75+* Number of 75+ households eligible for Pension Credit that are not claming** Aberavon
Visitor Attractions Trends in England 2017
 Visitor Attractions Trends in England 2017 Annual Report for Heritage Counts Prepared for Historic England Report Contents 1. Introduction and Background 2 1.1 Visitor Attraction Definition 2 1.2 Research
The Future of Air Transport
 The Future of Air Transport Summary December 2003 The White Paper and the Government s role The White Paper sets out a strategic framework for the development of airport capacity in the United Kingdom
Table 1 - For full-time employee jobs a : United Kingdom, 2018
 United Kingdom K02000001 2,916 14.7 Great Britain K03000001 2,803 14.6 Key Statistical robustness England and Wales K04000001 2,608 14.9 CV
#element of bullying / harassment South West 2gether NHS FT Mental Health Small
 1 South West 2gether NHS FT Mental Health Small 3 2 0 3 0 Aintree University Hospital NHS FT Yorks and Humber Airedale NHS FT Combined Acute and Community Small 28 0 8 7 1 North West Alder Hey Children's
Quarterly Statistics for New Businesses
 Quarterly Statistics for New Businesses 2006 Scottish Business Statistics Business Start-up Statistics are produced quarterly by The Committee of Scottish Clearing Bankers (CSCB), which incorporates Bank
Results of Devolution Referendums (1979 & 1997)
") Results of Devolution Referendums (1979 & 1997) Research Paper No 97/113 10 November 1997 This paper presents the results of the recent referendums in Scotland and Wales at a local level and compares voting
Results of Devolution Referendums (1979 & 1997) Research Paper No 97/113 10 November 1997 This paper presents the results of the recent referendums in Scotland and Wales at a local level and compares voting
grade A space grade a location FOR SALE TO LET
 grade A space grade a location FOR SALE TO LET www.lancashire.gov.uk/lancsbusinesspark Grade A space Grade A location A MAJOR NEW DEVELOPMENT Lancashire Business Park is one of the North West s premier
2011 Census Update: Online Completion in London
 2011 Census Update: Online Completion in London The 2011 Census, conducted on the 27 th March 2011, was the first census in England and Wales to allow respondents to complete online. This update provides
Transitions into and out of unpaid care
 Transitions into and out of unpaid care Constituency statistics The carer population is not static it is changing all the time. New analysis by Michael Hirst 1, published in Carers UK s report Need to
Visitor Attractions Trends in England 2014
 Visitor Attractions Trends in England 2014 Annual Report for Heritage Counts Prepared for Historic England 1. Introduction and Background This report presents key tables from the historic properties element
Child Trust Fund: Accounts opened by Westminster Parliamentary Constituencies
 Westminster Parliamentary Constituencies opened England Aldershot 5,219 4,266 953 81.7% Aldridge-Brownhills 2,825 2,167 658 76.7% Altrincham and Sale West 3,901 3,109 792 79.7% Amber Valley 3,386 2,693
Visitor Attractions Trends in England 2016
 Visitor Attractions Trends in England 2016 Annual Report for Heritage Counts Prepared for England 1. Introduction and Background This report presents key tables from the properties element of the Survey
Strategic Estate Advisers Contact Details
 Strategic Estate Advisers Midlands & East of CCG Basildon & Brentwood Ian Greggor i.greggor@communityhealthpartnerships.co.uk Bedfordshire Anthony Smith anthony.smith@property.nhs.uk Birmingham Cross City
Quarterly Statistics for New Businesses
 Quarterly Statistics for New Businesses 2007 Scottish Business Statistics Business Start-up Statistics are produced quarterly by The Committee of Scottish Clearing Bankers (CSCB), which incorporates Bank
RSN Economic Profiling Service
 RSN Economic Profiling Service Introduction The RSN has developed an economic profiling service for its members. Information will be provided based on the indicators and to the frequency set out in the
Child Trust Fund: Accounts opened by Westminster Parliamentary Constituencies
 ENGLAND Aldershot 5,865 4,487 1,378 76.5% Aldridge-Brownhills 3,141 2,231 910 71.0% Altrincham and Sale West 4,094 3,073 1,021 75.1% Amber Valley 3,767 2,832 935 75.2% Arundel and South Downs 3,415 2,685
Electorate statistics 2009
 Electorate statistics 2009 Standard Note: SN/SG/5423 Last updated: 1 April 2010 Author: Edmund Tetteh Social and General Statistics This Note provides data on the number of electors and attainers in each
00: Not for broadcast or publication before 00:01 Hrs Monday 20th June 2011
 Press Release Embargoed until: 00:01 20.06.11 Not for broadcast or publication before 00:01 Hrs Monday 20th June 2011 This is the Halifax review of economic and price performance at a local level. The
The Changing Demography of Scotland. Kirsty MacLachlan National Records of Scotland
 The Changing Demography of Scotland Kirsty MacLachlan National Records of Scotland People (millions) Scotland s population, 1855 to 2009 6 5 4 3 2 1 0 1855 1870 1885 1900 1915 1930 1945 1960 1975 1990
Specialised perinatal community team that meets Perinatal Quality Network Standards Type 1
 7 DATA UK Health Teams (Provision in 7) Specialised perinatal community team that meets Perinatal Quality Network Standards Type http://bit.ly/jouvad http://bit.ly/ahavex More than in women develop a mental
Unemployment by Constituency, February 2000
 15 MARCH 2000 Unemployment by Constituency, February 2000 This paper shows the number of unemployed claimants recorded as resident in each constituency in the United Kingdom in February 2000, with comparisons
The Geography of Tourism Employment
 The Geography of Tourism Employment Coverage: UK Date: 23 November 2012 Geographical Area: European (NUTS) Theme: People and Places Theme: Labour Market Key Points There were 2.7 million persons with jobs
Oriel 2018 (2019intake) Hospital and Health Board Employers
 Hospital and Health Board Employers") Oriel 2018 (2019intake) Hospital and Health Board Employers Employer Name ABERTAWE BRO MORGANNWG UNIVERSITY HEALTH BOARD AINTREE UNIVERSITY HOSPITAL NHS FOUNDATION TRUST AIREDALE NHS FOUNDATION TRUST ALDER
Oriel 2018 (2019intake) Hospital and Health Board Employers Employer Name ABERTAWE BRO MORGANNWG UNIVERSITY HEALTH BOARD AINTREE UNIVERSITY HOSPITAL NHS FOUNDATION TRUST AIREDALE NHS FOUNDATION TRUST ALDER
System Improvements & Future Needs
 June 2005 System Improvements & Future Needs Ian Coles - Data & Systems Coordinator JMP Consulting 2005 JMP Consulting on behalf of the TRICS Consortium TRICS System Improvements & Future Needs New features
Sixth Form University Open Days
 Sixth Form Open Days 2017-2018 A of Aberdeen Abertay Aberystwyth Anglia Ruskin Saturday 7 th Wednesday 8 th Saturday 11 th Aston Saturday 7 th Saturday 4 th B Bangor Sunday 15 th Bath Spa of Bedfordshire
CHAPLAINCY COSTS SURVEY, ENGLAND
 CHAPLAINCY COSTS SURVEY, ENGLAND APRIL 2009 Mental Health & Care Trusts, NHS & Foundation Trusts & Primary Care Trusts Trust Salaries per annum ( )* Staff - Whole time Equivalent 2gether NHS Foundation
Where to live Britain s best country life
 01/04/2018 @HalifaxBankNews NOT FOR BROADCAST OR PUBLICATION BEFORE 00.01 HRS ON SUNDAY 1 APRIL 2018 Where to live Britain s best country life Orkney Islands retains crown as Britain s best rural place
NOT FOR BROADCAST OR PUBLICATION BEFORE 00:01, TUESDAY 1 MARCH 2016
 PRESS RELEASE NOT FOR BROADCAST OR PUBLICATION BEFORE 00:01, TUESDAY 1 MARCH 2016 The Bank of Scotland Rural Quality of Life Survey tracks where living standards are highest in Great Britain by ranking
More transplants new lives
 More transplants new lives Transplant Activity in the UK 2002-2003 Executive Summary Transplantation is one of the successes of modern medicine. During 2002-2003, 2,780 people had their life saved or improved
Management Information
 Management Information National Stop and Search Database: Quarterly Report June December 2015/16 Contents Commentary Notes 2 Definition of a Stop and Search, a Seizure and a Refusal 3 Statuory Stop and
Graduates and Regional Productivity. Graham Gudgin Regional Forecasts Ltd
 Graduates and Regional Productivity Graham Gudgin Regional Forecasts Ltd Extensive Literature in Economics linking Education and productivity: Private returns to Education Cross-Country Studies Private
LOCAL GOVERNMENT AND TRANSPORT COMMITTEE PETITION PE This paper invites the Committee to consider for the third time the following Petition:
 LOCAL GOVERNMENT AND TRANSPORT COMMITTEE PETITION PE 568 Introduction 1. This paper invites the Committee to consider for the third time the following Petition: PE 568 by the Scottish Accessible Transport
T bu ab l u a lar statement r s
 Yearly Yearly Meeting Meeting of of the the Religious Religious Society Society of of Friends Friends (Quakers) (Quakers) in in Britain Britain Tabular statement Compiled for Yearly Meeting Gathering,
UK Universities Quick Dial
 UK Universities Quick Dial To use the abbreviated dialling codes, press *11 on your handset followed by the appropriate code below. There is no need key 9 for an outside line. University Telephone No Abbreviated