North Carolina (Statewide) 2016 Prosperity Zone Data Books
|
|
|
- Cameron Cox
- 5 years ago
- Views:
Transcription

1 North Carolina (Statewide) 2016 Prosperity Zone Data Books

2 2 North Carolina Prosperity Zones


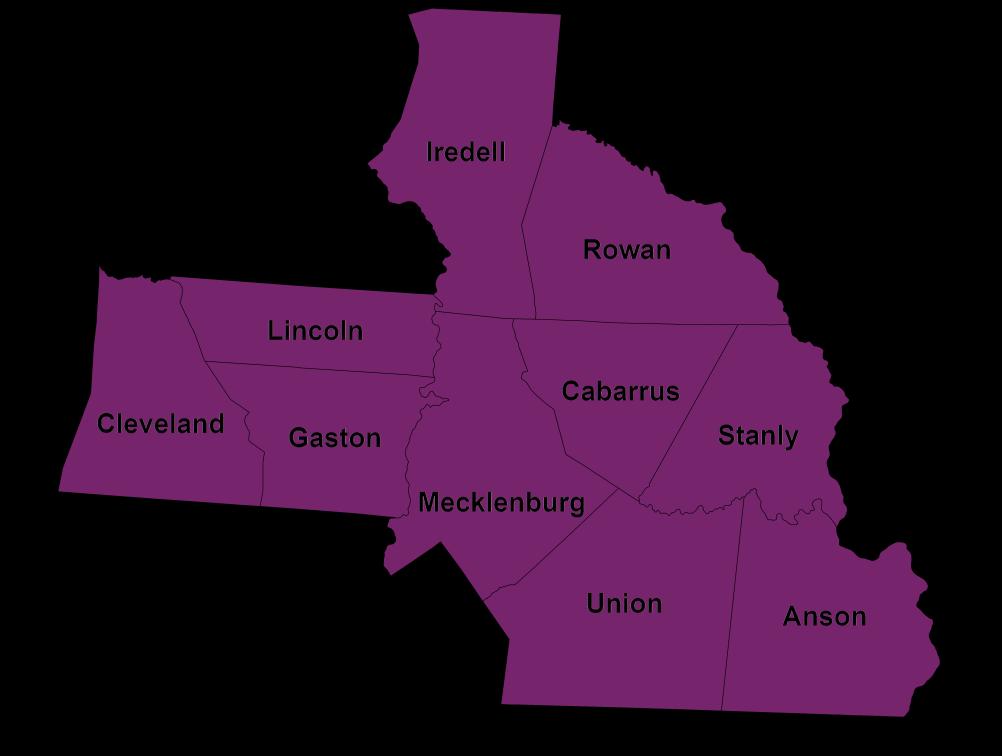
3 Western North Carolina Prosperity Zones Northwest Region Piedmont-Triad Region Western Region Southwest Region 3


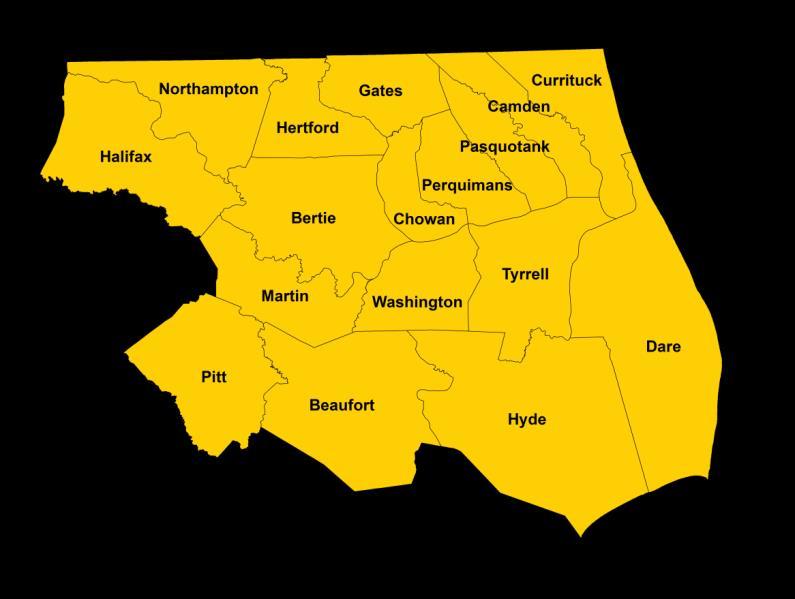
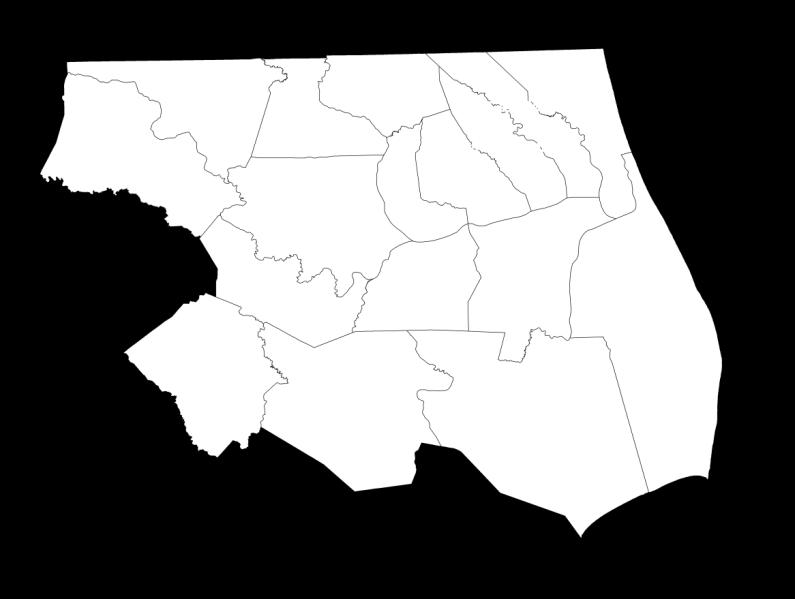
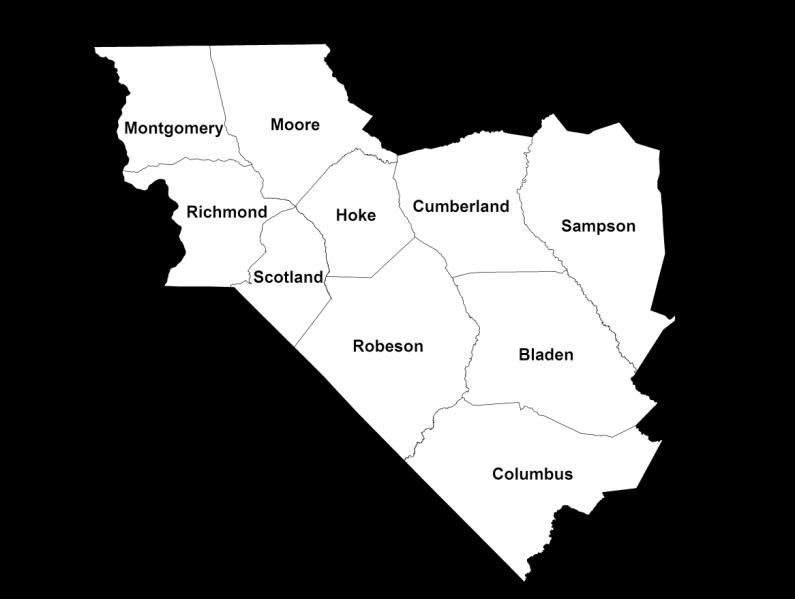
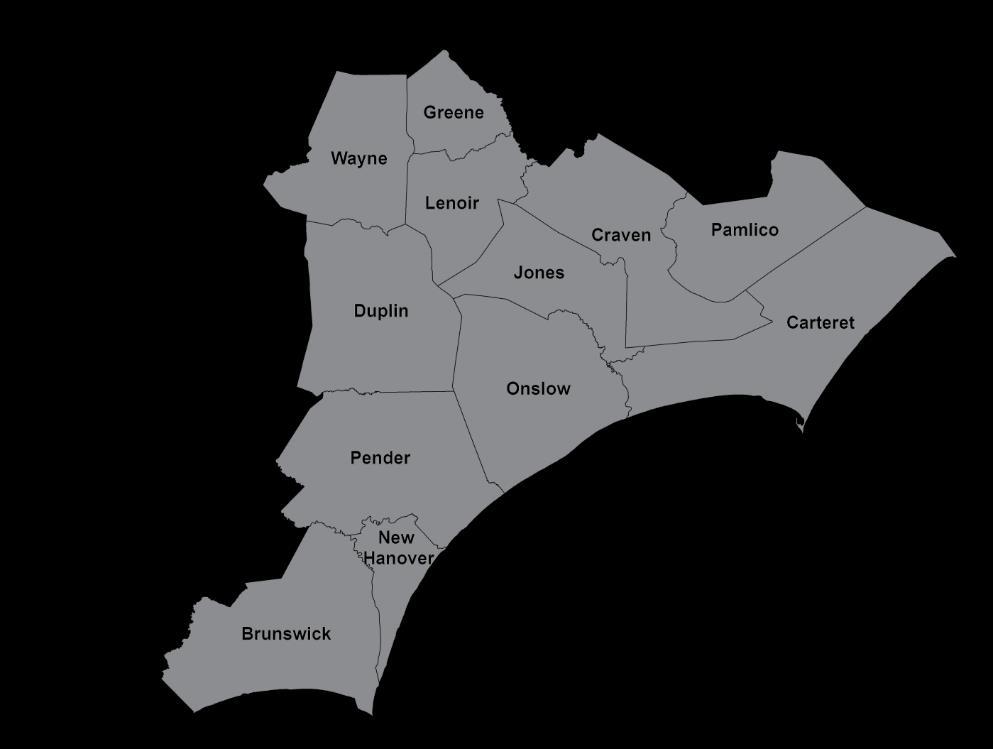
4 Eastern North Carolina Prosperity Zones North Central Region Northeast Region Sandhills Region Southeast Region 4
5 Prosperity Zone Population Estimates 2014 Source: North Carolina Office of State Budget and Management 5
6 Population by Age Group to to to to and Older North Central 24% 10% 28% 26% 12% Northeast 21% 12% 24% 27% 16% Northwest 20% 11% 23% 28% 18% Piedmont-Triad 23% 10% 25% 27% 15% Sandhills 25% 10% 25% 25% 14% Southeast 22% 12% 25% 25% 16% Southwest 24% 9% 28% 26% 12% Western 19% 8% 23% 27% 22% North Carolina 23% 10% 26% 26% 15% Source: North Carolina Office of State Budget and Management 6
7 Population Growth 2009 Population 2014 Population Population Change North Central 2,130,787 2,308, % Northeast 531, , % Northwest 617, , % Piedmont-Triad 1,597,445 1,655, % Sandhills 852, , % Southeast 991,038 1,047, % Southwest 2,041,124 2,202, % Western 674, , % North Carolina 9,435,396 9,953, % Source: North Carolina Office of State Budget and Management 7
8 Components of Population Growth 2010 to 2014 Natural Growth Net Migration North Central 56,000 85,518 Northeast 2,270 1,237 Northwest -1,643 4,710 Piedmont-Triad 15,400 27,518 Sandhills -2,645 20,130 Southeast Southwest 20,466 47,031 32,115 88,408 Western -4,811 26,292 North Carolina 154, ,153-40% -20% 0% 20% 40% 60% 80% 100% Source: North Carolina Office of State Budget and Management Note: Migration calculated relative to most recent Census year (2010). 8
9 Labor Force Change 2010 Labor Force 2015 Labor Force Labor Force Change North Central 1,093,828 1,171, % Northeast 249, , % Northwest 295, , % Piedmont-Triad 801, , % Sandhills 352, , % Southeast 442, , % Southwest 1,062,289 1,146, % Western 318, , % North Carolina 4,616,690 4,769, % Source: Local Area Unemployment Statistics (LAUS), NC Dept. of Commerce 9
10 Job Holders by Age Group North Central 11% 21% 24% 24% 16% 5% Northeast 12% 20% 21% 22% 18% 6% Northwest 13% 18% 22% 24% 18% 6% Piedmont-Triad 12% 20% 22% 24% 17% 6% Sandhills 12% 21% 22% 23% 16% 5% Southeast 13% 21% 21% 22% 17% 6% Southwest 12% 21% 24% 23% 15% 5% Western 13% 21% 22% 22% 17% 6% North Carolina 12% 21% 23% 23% 16% 5% Source: Quarterly Workforce Indicators, US Census Bureau 10
11 Percent of Total Employment, Age 55+ Western Prosperity Zones % 23.3% 20.1% 22.7% 17.3% 19.7% 21.4% 23.2% 18.9% 21.4% Northwest Piedmont-Triad Southwest Western North Carolina Source: Quarterly Workforce Indicators, US Census Bureau 11
12 Percent of Total Employment, Age 55+ Eastern Prosperity Zones % 20.7% 20.0% 23.5% 19.0% 21.8% 19.7% 22.5% 18.9% 21.4% North Central Northeast Sandhills Southeast North Carolina Source: Quarterly Workforce Indicators, US Census Bureau 12
13 Percent of Total Employment, 24 and Younger Western Prosperity Zones % 11.8% 11.5% 11.7% 11.7% 11.6% 12.4% 12.6% 11.8% 11.8% Northwest Piedmont-Triad Southwest Western North Carolina Source: Quarterly Workforce Indicators, US Census Bureau 13
14 Percent of Total Employment, 24 and Younger Eastern Prosperity Zones % 10.9% 13.0% 12.4% 12.5% 12.4% 13.8% 13.4% 11.8% 11.8% North Central Northeast Sandhills Southeast North Carolina Source: Quarterly Workforce Indicators, US Census Bureau 14
15 Average Annual Wages 2010 Average Annual Wages 2015 Average Annual Wages Change North Central $47,050 $51, % Northeast $33,298 $36, % Northwest $32,463 $35, % Piedmont-Triad $38,756 $43, % Sandhills $34,017 $36, % Southeast $34,187 $36, % Southwest $47,264 $53, % Western $33,746 $36, % North Carolina $41,580 $46, % Source: Quarterly Census of Employment & Wages (QCEW), NC Dept. of Commerce 15
16 Community College Enrollment 200, Enrollments Enrollments 180, , , , ,000 80,000 60,000 40,000 20,000 0 North Central Northeast Northwest Piedmont-Triad Sandhills Southeast Southwest Western Source: NC Community Colleges, Statistical Reports Note: Enrollments represent unduplicated headcount of students enrolled in curriculum and continuing education courses. 16
17 Educational Attainment, Age Year Estimates, Less Than High School High School or Equivalent Some College or Associate Degree Bachelor s Degree North Central 12% 23% 28% 37% Northeast 17% 31% 32% 20% Northwest 20% 31% 30% 18% Piedmont-Triad 16% 29% 30% 25% Sandhills 17% 29% 34% 19% Southeast 14% 28% 35% 23% Southwest 13% 25% 31% 31% Western 13% 28% 32% 28% North Carolina 15% 27% 31% 28% Source: US Census, American Community Survey, 5-year estimates 17
18 Unemployment Rate Trends Western Prosperity Zones 13.2% % 11.6% 10.9% 10.5% 10.6% 9.9% 9.7% 10.6% 10.3% 8.5% 8.0% 7.8% 7.4% 7.9% 5.7% 5.7% 5.4% 5.3% 5.7% Northwest Piedmont-Triad Southwest Western North Carolina Source: Local Area Unemployment Statistics (LAUS), NC Dept. of Commerce 18
19 Unemployment Rate Trends Eastern Prosperity Zones % 9.1% 11.8% 11.3% 10.4% 10.5% 10.0% 9.3% 9.6% 9.9% 10.6% 10.3% 7.1% 6.9% 7.4% 8.0% 7.9% 5.4% 6.0% 5.7% North Central Northeast Sandhills Southeast North Carolina Source: Local Area Unemployment Statistics (LAUS), NC Dept. of Commerce 19
20 Change in Employed Workers 2010 Employed 2015 Employed Change North Central 990,777 1,108, ,765 Northeast 221, ,076 5,258 Northwest 258, ,902 9,681 Piedmont-Triad 711, ,188 45,855 Sandhills 311, ,036 6,273 Southeast 398, ,082 27,055 Southwest 938,183 1,083, ,518 Western 285, ,951 22,438 North Carolina 4,115,628 4,495, ,845 Source: Local Area Unemployment Statistics (LAUS), NC Dept. of Commerce 20
21 Change in Employed Workers Western Prosperity Zones 18% 16% 14% Southwest 12% 10% 8% 6% 4% Western Piedmont-Triad Northwest 2% 0% Source: Local Area Unemployment Statistics (LAUS), NC Dept. of Commerce 21
22 Change in Employed Workers Eastern Prosperity Zones 14% 12% North Central 10% 8% 6% Southeast 4% 2% Northeast Sandhills 0% -2% Source: Local Area Unemployment Statistics (LAUS), NC Dept. of Commerce 22
23 Change in Business Establishments 2010 Establishments 2015 Establishments Change North Central 56,322 60, % Northeast 13,489 12, % Northwest 14,254 13, % Piedmont-Triad 38,285 38, % Sandhills 16,331 16, % Southeast 24,230 24, % Southwest 57,891 62, % Western 19,363 19, % North Carolina 252, , % Source: Quarterly Census of Employment & Wages (QCEW), NC Dept. of Commerce 23
24 Job Change Relative to 2009 Western Prosperity Zones % 8.8% 7.0% 6.9% 2.7% 4.0% 2.8% 3.9% 0.1% 1.2% 1.4% 0.3% -1.1% -0.7% -0.7% Northwest Piedmont-Triad Southwest Western North Carolina Source: Quarterly Census of Employment & Wages (QCEW), NC Dept. of Commerce 24
25 Job Change Relative to 2009 Eastern Prosperity Zones % 8.8% 4.7% 4.6% 3.9% 0.7% 1.5% 0.3% -1.3% -0.1% -1.4% -0.3% -0.7% -0.9% -2.7% North Central Northeast Sandhills Southeast North Carolina Source: Quarterly Census of Employment & Wages (QCEW), NC Dept. of Commerce 25
26 Private Sector Industry Employment, 2015 Western Prosperity Zones Northwest 15% 15% 29% 11% 6% 3% 4% 5% 2% 12% Piedmont- Triad 16% 13% 17% 10% 10% 4% 5% 5% 4% 16% Southwest 10% 13% 11% 11% 9% 7% 6% 6% 7% 21% Western 20% 17% 12% 16% 6% 4% 6% 3% 2% 14% North Carolina 14% 14% 13% 11% 8% 6% 5% 5% 5% 18% 0% 10% 20% 30% 40% 50% 60% 70% 80% 90% 100% Health Care and Social Assistance Manufacturing Admin & Support, Waste Mgmt, and Remediation Construction Finance and Insurance Retail Trade Accommodation and Food Services Professional, Scientific, and Technical Services Wholesale Trade All Other Source: Quarterly Census of Employment & Wages (QCEW), NC Dept. of Commerce 26
27 Private Sector Industry Employment, 2015 Eastern Prosperity Zones North Central 15% 14% 11% 11% 8% 9% 6% 5% 4% 17% Northeast 15% 19% 12% 16% 6% 3% 5% 4% 3% 16% Sandhills 19% 17% 17% 13% 7% 3% 5% 3% 2% 14% Southeast 14% 18% 11% 15% 7% 5% 6% 4% 3% 17% North Carolina 14% 14% 13% 11% 8% 6% 5% 5% 5% 18% 0% 10% 20% 30% 40% 50% 60% 70% 80% 90% 100% Health Care and Social Assistance Manufacturing Admin & Support, Waste Mgmt, and Remediation Construction Finance and Insurance Retail Trade Accommodation and Food Services Professional, Scientific, and Technical Services Wholesale Trade All Other Source: Quarterly Census of Employment & Wages (QCEW), NC Dept. of Commerce 27
28 Concentration of Industry Employment Western Prosperity Zones Northwest Piedmont- Triad Southwest Western 2015 Industry Rank #1 - #5 Location Quotient Jobs 2015 Industry Rank #6 - #10 Location Quotient 1 Furniture and Related Product Manufacturing ,132 6 Paper Manufacturing ,057 2 Textile Mills ,288 7 Plastics and Rubber Products Manufacturing ,088 3 Electrical Equipment, Appliance, and Component Manufacturing ,158 8 Food Manufacturing ,383 4 Wood Product Manufacturing ,413 9 State Government ,359 5 Chemical Manufacturing , Nonmetallic Mineral Product Manufacturing ,128 1 Textile Mills ,292 6 Paper Manufacturing ,202 2 Apparel Manufacturing ,714 7 Textile Product Mills ,232 3 Furniture and Related Product Manufacturing ,002 8 Electrical Equipment, Appliance, and Component Manufacturing ,600 4 Beverage and Tobacco Product Manufacturing ,296 9 Wood Product Manufacturing ,453 5 Plastics and Rubber Products Manufacturing , Chemical Manufacturing ,534 1 Textile Mills ,381 6 Broadcasting (except Internet) ,080 2 Data Processing, Hosting, and Related Services ,423 7 Credit Intermediation and Related Activities ,606 3 Air Transportation ,160 8 Textile Product Mills ,591 4 Performing Arts, Spectator Sports, and Related Industries ,450 9 Plastics and Rubber Products Manufacturing ,510 5 Management of Companies and Enterprises , Securities, Commodity Contracts, and Other Financial Investments ,045 1 Textile Mills ,357 6 Accommodation ,240 2 Electrical Equipment, Appliance, and Component Manufacturing ,874 7 Nursing and Residential Care Facilities ,351 3 Museums, Historical Sites, and Similar Institutions ,225 8 Food and Beverage Stores ,603 4 Paper Manufacturing ,101 9 Building Material and Garden Equipment and Supplies Dealers ,464 5 Plastics and Rubber Products Manufacturing , Hospitals ,571 Jobs Source: Economic Modeling Specialists International Notes: To qualify for this list, each 3-digit NAICS industry was required to have at least 1,000 jobs in the region. Location Quotient is a ratio that illustrates the state s employment concentration within a particular industry compared to the nation. Calculated as: (NC x industry employment / NC total employment) / (US x industry employment / US total employment) 28
29 Concentration of Industry Employment Eastern Prosperity Zones North Central Northeast Sandhills Southeast Location 2015 Industry Rank #1 - #5 Jobs 2015 Industry Rank #6 - #10 Quotient Location Quotient 1 Chemical Manufacturing ,602 6 Publishing Industries (except Internet) ,617 2 Computer and Electronic Product Manufacturing ,362 7 Telecommunications ,621 3 Textile Mills ,234 8 Electrical Equipment, Appliance, and Component Manufacturing ,019 4 State Government ,353 9 Educational Services ,715 5 Beverage and Tobacco Product Manufacturing , Professional, Scientific, and Technical Services ,490 1 Chemical Manufacturing ,329 6 Support Activities for Agriculture and Forestry ,326 2 Paper Manufacturing ,456 7 Real Estate ,836 3 Crop Production ,837 8 Local Government ,528 4 State Government ,984 9 Gasoline Stations ,113 5 Wood Product Manufacturing , Food Manufacturing ,343 1 Textile Mills ,122 6 Paper Manufacturing ,943 2 Federal Government ,658 7 Plastics and Rubber Products Manufacturing ,518 3 Animal Production and Aquaculture ,330 8 Wood Product Manufacturing ,880 4 Apparel Manufacturing ,172 9 Gasoline Stations ,971 5 Food Manufacturing , Support Activities for Agriculture and Forestry ,619 1 Federal Government ,256 6 Crop Production ,434 2 Animal Production and Aquaculture ,643 7 Nonmetallic Mineral Product Manufacturing ,642 3 Food Manufacturing ,640 8 Motor Vehicle and Parts Dealers ,082 4 Electrical Equipment, Appliance, and Component Manufacturing ,362 9 State Government ,941 5 Utilities , Building Material and Garden Equipment and Supplies Dealers ,397 Jobs Source: Economic Modeling Specialists International Notes: To qualify for this list, each 3-digit NAICS industry was required to have at least 1,000 jobs in the region. Location Quotient is a ratio that illustrates the state s employment concentration within a particular industry compared to the nation. Calculated as: (NC x industry employment / NC total employment) / (US x industry employment / US total employment) 29
30 Largest Manufacturing Industries Western Prosperity Zones Northwest Piedmont-Triad Southwest Western Top Manufacturing Industries Employment Employment Change Furniture and Related Product 16,228 15, % Food 5,243 4, % Textile Mills 4,436 4, % Chemical 3,918 3, % Furniture and Related Product 12,047 10, % Textile Mills 9,533 9, % Plastics and Rubber Products 9,036 6, % Fabricated Metal Product 8,917 7, % Transportation Equipment 11,587 8, % Machinery 11,285 9, % Fabricated Metal Product 11,225 9, % Food 9,298 8, % Electrical Equip., Appliance, Comp. 3,505 3, % Plastics and Rubber Products 3,298 2, % Transportation Equipment 2,155 1, % Fabricated Metal Product 2,136 2, % Source: Quarterly Census of Employment & Wages (QCEW), NC Dept. of Commerce 30
31 Largest Manufacturing Industries Eastern Prosperity Zones North Central Northeast Sandhills Southeast Top Manufacturing Industries Employment Employment Change Computer and Electronic Product 22,849 22, % Chemical 19,034 20, % Machinery 7,921 6, % Fabricated Metal Product 6,612 5, % Food 3,704 3, % Chemical 2,932 2, % Machinery 1,763 1, % Paper 1,567 1, % Food 12,243 12, % Plastics and Rubber Products 3,329 3, % Textile Mills 2,996 2, % Paper 2,012 2, % Food 10,653 8, % Transportation Equipment 3,522 2, % Fabricated Metal Product 2,796 2, % Electrical Equip., Appliance, Comp. 2,457 2, % Source: Quarterly Census of Employment & Wages (QCEW), NC Dept. of Commerce 31
32 Taxable Retail Sales Growth Inflation-adjusted dollars FY (in millions) FY (in millions) Change % of FY NC Retail Sales North Central $20.7 $ % 24.5% Northeast $4.9 $ % 5.3% Northwest $4.6 $ % 4.9% Piedmont-Triad $13.6 $ % 15.2% Sandhills $6.5 $ % 6.7% Southeast $8.8 $ % 10.0% Southwest $21.9 $ % 26.3% Western $6.2 $ % 7.2% North Carolina $87.2 $ % N/A Source: NC Department of Revenue, State Sales and Use Tax Reports by Fiscal Year, Table 3 32
33 Impacts of the Tourism Industry 2014 Expenditures (millions) Payroll (millions) Employment State Tax Receipts (millions) North Central $3,880 $945 39,010 $192 Northeast $1,770 $327 18,480 $84 Northwest $991 $178 9,000 $50 Piedmont-Triad $2,776 $547 24,480 $148 Sandhills $1,321 $240 12,450 $69 Southeast $2,061 $381 19,620 $99 Southwest $6,265 $1,850 59,950 $298 Western $2,259 $456 21,950 $112 North Carolina $21,323 $4, ,940 $1,052 Source: Economic Development Partnership of North Carolina, Travel Economic Impact Model (TEIM). 33


34 34
Annual Report of Business Information for the City of Saskatoon
 Annual Report of Business Information for the City of Saskatoon 2016 Business License Program Annual Report 2016 The Community Standards Division, Business License Program, licenses all businesses operating
The Economic Impact of Tourism in North Carolina. Tourism Satellite Account Calendar Year 2013
 The Economic Impact of Tourism in North Carolina Tourism Satellite Account Calendar Year 2013 Key results 2 Total tourism demand tallied $26 billion in 2013, expanding 3.9%. This marks another new high
Temecula Valley Travel Impacts
 Temecula Valley Travel Impacts 2000-2013p photo courtesy of Temecula Valley Convention and Visitors Bureau June 2014 Prepared for the Temecula Valley Convention and Visitors Bureau Temecula, California
MONTEREY COUNTY TRAVEL IMPACTS P
 MONTEREY COUNTY TRAVEL IMPACTS 1992-2015P April 2016 Prepared for the Monterey County Convention and Visitors Bureau MONTEREY COUNTY TRAVEL IMPACTS, 1992-2015P Prepared for the Monterey County Convention
The Economic Base of Colfax County, NM. PREPARED BY: The Office of Policy Analysis at Arrowhead Center, New Mexico State University.
 The Economic Base of Colfax County, NM PREPARED BY: The Office of Policy Analysis at Arrowhead Center, New Mexico State University DATE: July 2016 The Economic Base of Colfax County, New Mexico Introduction
The Economic Impact of Tourism in North Carolina. Tourism Satellite Account Calendar Year 2015
 The Economic Impact of Tourism in North Carolina Tourism Satellite Account Calendar Year 2015 Key results 2 Total tourism demand tallied $28.3 billion in 2015, expanding 3.6%. This marks another new high
HEALTH SECTOR ECONOMIC INDICATORS REPORT
 HEALTH SECTOR ECONOMIC INDICATORS REPORT For: Mid North Coast Local Health District Report prepared by: April 2013 Table of Contents Introduction 3 Executive Summary 4 Output 5 Value-Added 7 Workforce
Tourism Satellite Account Calendar Year 2010
 The Economic Impact of Tourism in Georgia Tourism Satellite Account Calendar Year 2010 Highlights The Georgia visitor economy rebounded in 2010, recovering 98% of the losses experienced during the recession
The Economic Impact of Tourism in Maryland. Tourism Satellite Account Calendar Year 2016
 The Economic Impact of Tourism in Maryland Tourism Satellite Account Calendar Year 2016 County Results Washington County, Visitors Washington County Visitors (thousands) Year Overnight Day Total Growth
MINING IN TASMANIA: DINOSAUR OR DELIVERER?
 MINING IN TASMANIA: DINOSAUR OR DELIVERER? PRESENTATION TO A FORUM HOSTED BY THE ACADEMY OF TECHNOLOGICAL SCIENCES AND ENGINEERING (ATSE) FOR NATIONAL SCIENCE WEEK RACV APARTMENT HOTEL, HOBART 3 RD AUGUST
County of Dufferin Economic Development Strategy and Action Plan
 County of Dufferin Economic Development Strategy and Action Plan Strategic Plan Background Report Information for Those Involved in Stakeholder Consultations About the Dufferin County Economic Development
COMPARATIVE INDICATORS TO OTHER HAMPTON ROADS CITIES. David Bradley
 COMPARATIVE INDICATORS TO OTHER HAMPTON ROADS CITIES David Bradley July 14, 2017 EXPENDITURES BY CATEGORY - FY 2015-16 ALL FUNDS 100.0% 8.1% 4.1% 7.2% 9.2% 5.8% 8.6% 6.9% 80.0% 60.0% 45.0% 49.1% 36.1%
Figure 1.1 St. John s Location. 2.0 Overview/Structure
 St. John s Region 1.0 Introduction Newfoundland and Labrador s most dominant service centre, St. John s (population = 100,645) is also the province s capital and largest community (Government of Newfoundland
Wyoming Travel Impacts
 Wyoming Travel Impacts 2000-2014 Wyoming Office of Tourism April 2015 Prepared for the Wyoming Office of Tourism Cheyenne, Wyoming The Economic Impact of Travel on Wyoming 2000-2014 Detailed State and
Temecula Valley Travel Impacts p
 Temecula Valley Travel Impacts 2000-2017p photo courtesy of Temecula Valley Convention and Visitors Bureau May 2018 Prepared for the Temecula Valley Convention and Visitors Bureau Temecula, California
The Economic Impact of Tourism in Hillsborough County. July 2017
 The Economic Impact of Tourism in Hillsborough County July 2017 Table of contents 1) Key Findings for 2016 3 2) Local Tourism Trends 7 3) Trends in Visits and Spending 12 4) The Domestic Market 19 5) The
The Economic Impact of Tourism in Jacksonville, FL. June 2016
 The Economic Impact of Tourism in Jacksonville, FL June 2016 Highlights Visitor spending surpassed $2.0 billion in 2015, growing 4.4%. As this money flowed through Duval County, the $2.0 billion in visitor
Washington County, TN. Hotel, Restaurant, and Travel Industries: Economic Profile and Business Trends, Washington County (Jonesborough area)
") Washington County, TN Washington County (Jonesborough area) Hotel, Restaurant, and Travel Industries: Economic Profile and Business Trends, Steve Morse, Ph.D. Director & Economist Tourism Institute University
Washington County, TN Washington County (Jonesborough area) Hotel, Restaurant, and Travel Industries: Economic Profile and Business Trends, Steve Morse, Ph.D. Director & Economist Tourism Institute University
Wyoming Travel Impacts
 Wyoming Travel Impacts 2000-2013 Wyoming Office of Tourism April 2014 Prepared for the Wyoming Office of Tourism Cheyenne, Wyoming The Economic Impact of Travel on Wyoming 2000-2013 Detailed State and
Colorado Travel Impacts
 Colorado Travel Impacts 1996-2013 Image Credit: Matt Inden/Miles July 2014 Prepared for the Colorado Tourism Office Denver, Colorado THE ECONOMIC IMPACT OF TRAVEL ON COLORADO 1996-2013 July 2014 prepared
The Economic Impact of Tourism in Maryland. Tourism Satellite Account Calendar Year 2015
 The Economic Impact of Tourism in Maryland Tourism Satellite Account Calendar Year 2015 MD tourism economy reaches new peaks The Maryland visitor economy continued to grow in 2015; tourism industry sales
Loudon County, TN. Hotel, Restaurant, and Travel Industries: Economic Profile and Business Trends, Loudon County (Loudon and Lenoir City areas)
") Loudon County, TN Loudon County (Loudon and Lenoir City areas) Hotel, Restaurant, and Travel Industries: Economic Profile and Business Trends, Steve Morse, Ph.D. Director & Economist Tourism Institute
Loudon County, TN Loudon County (Loudon and Lenoir City areas) Hotel, Restaurant, and Travel Industries: Economic Profile and Business Trends, Steve Morse, Ph.D. Director & Economist Tourism Institute
2nd Quarter. AEDC is pleased to present the Anchorage Quarterly Economic Indicators Report for the second quarter of 2010.
 2010 AEDC is pleased to present the Anchorage Quarterly Economic Indicators Report for the second quarter of 2010. This report summarizes recently updated data from the Anchorage Economic Indicators Database,
Maury County, TN. Hotel, Restaurant, and Travel Industries: Economic Profile and Business Trends, Maury County (Columbia and Spring Hill area)
") Maury County, TN Maury County (Columbia and Spring Hill area) Hotel, Restaurant, and Travel Industries: Economic Profile and Business Trends, 06 Steve Morse, Ph.D. Director & Economist Tourism Institute
Maury County, TN Maury County (Columbia and Spring Hill area) Hotel, Restaurant, and Travel Industries: Economic Profile and Business Trends, 06 Steve Morse, Ph.D. Director & Economist Tourism Institute
Asheville Metro Economic Report nd Quarter
 Asheville Metro Economic Report 2017 2nd Quarter Johnson Price Sprinkle PA provides Asheville Metro Economic Report - 2017 Second Quarter. JPS is a sixty-year-old accounting firm serving Western North
THE 2006 ECONOMIC IMPACT OF TRAVEL & TOURISM IN INDIANA
 THE 2006 ECONOMIC IMPACT OF TRAVEL & TOURISM IN INDIANA A Comprehensive Analysis Prepared by: In Partnership with: PREPARED FOR: Carrie Lambert Marketing Director Indiana Office of Tourism Development
The Economic Impact of Tourism in Hillsborough County, June 2018
 The Economic Impact of Tourism in Hillsborough County, 2017 June 2018 Table of contents 1) Key Findings for 2017 3 2) Local Tourism Trends 7 3) Trends in Visits and Spending 12 4) The Domestic Market 19
Economic Impacts of Campgrounds in New York State
 Economic Impacts of Campgrounds in New York State June 2017 Report Submitted to: Executive Summary Executive Summary New York State is home to approximately 350 privately owned campgrounds with 30,000
Major Groups. Food & beverages Percentage Change. Dec-12. Sep-13. Jun-13. Mar-13 SEPTEMBER 2013 QTR KEY POINTS
 2.5 2.0 1.5 1.0 0.5 0.0-0.5-1.0 Movement of Consumer Price Index Sep-12 Dec-12 Mar-13 Jun-13 Sep-13 Major Groups QTR on QTR YR on YR %Change Food & Beverage -0.3 3.4 Alcohol, tobacco & betel nut -2.0 1.9
Travel & Tourism Sector Ranking South Korea
 Travel & Tourism Sector Ranking South Korea Summary of Findings, November 2013 Introduction Sector Ranking Analysis In order to better understand the importance of the Travel & Tourism industry in a global
BREA. Contribution of Cruise Tourism to the Economies of Europe 2011 Country Report Germany. The European Cruise Council.
 BREA Business Research Economic Advisors Contribution of Cruise Tourism to the Economies of Europe 2011 Country Report Prepared for The European Cruise Council July 2012 participates in all aspects of
8.7% 3.9% California. California MFG job growth continues to lag the country Percent change since Rest of United States. April Jan.
 MFG job growth continues to lag the country Percent change since Rest of United States 8.7% Jan 10: 10,211,600 Apr 17: 11,098,100 886,500 April 2017 3.9% Jan 10: 1,248,400 Apr 17: 1,297,900 49,500 Jan.
Cheatham County, TN. Hotel, Restaurant, and Travel Industries: Economic Profile and Business Trends, 2006
 Cheatham County, TN Cheatham County (Kingston Springs & Ashland City areas) Hotel, Restaurant, and Travel Industries: Economic Profile and Business Trends, Steve Morse, Ph.D. Director & Economist Tourism
Economic Impact of Tourism in South Dakota, December 2018
 Economic Impact of Tourism in South Dakota, 2018 December 2018 1) Key Findings Growth rebounds in 2018 as a strong hunting season drives tourism growth Key facts about South Dakota s tourism sector Key
AVIATION. January Aviation INDUSTRY PROFILE. for Arapahoe & Douglas Counties Colorado WIOA Central Planning Region
 January 2017 Aviation INDUSTRY PROFILE for Arapahoe & Douglas Counties Colorado WIOA Central Planning Region Background The Metro Denver region ranks 14th among the nation s 0 largest metro areas for aviation
ISRAEL- COUNTRY FACTS
 ISRAEL- COUNTRY FACTS ISRAEL-NEIGHBOURING COUNTRIES AND POLITICAL MAP Area: 22,072 sq. km Land area: 21,643 sq. km. Fast Facts Area of lakes: 429 sq. km. (Sea of Galilee 164 sq. km., the Dead Sea - 265
Sevier County, TN. Hotel, Restaurant, and Travel Industries: Economic Profile and Business Trends, 2006
 Sevier County, TN Sevier County (Gatlinburg, Pigeon Forge, Sevierville areas) Hotel, Restaurant, and Travel Industries: Economic Profile and Business Trends, Steve Morse, Ph.D. Director & Economist Tourism
The Yorke & Mid North (State Govt) Region. Workforce Wizard Region Report
 Region. Workforce Wizard Region Report") The Yorke & Mid North (State Govt) Region Workforce Wizard Region Report Table of Contents Executive Summary 3 Population and Social Characteristics 4 Current Population 4 Age Groups 4 Key Populations
The Yorke & Mid North (State Govt) Region Workforce Wizard Region Report Table of Contents Executive Summary 3 Population and Social Characteristics 4 Current Population 4 Age Groups 4 Key Populations
Hamilton County, TN. Hotel, Restaurant, and Travel Industries: Economic Profile and Business Trends, Hamilton County (Chattanooga area)
") Hamilton County, TN Hamilton County (Chattanooga area) Hotel, Restaurant, and Travel Industries: Economic Profile and Business Trends, Steve Morse, Ph.D. Director & Economist Tourism Institute University
Hamilton County, TN Hamilton County (Chattanooga area) Hotel, Restaurant, and Travel Industries: Economic Profile and Business Trends, Steve Morse, Ph.D. Director & Economist Tourism Institute University
Blount County, TN. Hotel, Restaurant, and Travel Industries: Economic Profile and Business Trends, 2006
 Blount County, TN Blount County (Alcoa, Maryville, Rockford, Seymour, Townsend areas) Hotel, Restaurant, and Travel Industries: Economic Profile and Business Trends, Steve Morse, Ph.D. Director & Economist
South Dakota Tourism IHS Consulting
 South Dakota Tourism 2014 IHS Consulting Advancing Decisions that Advance the World More than 6,000 colleagues, in 30 countries, speaking 50 languages all working each day to: Serve businesses and governments
Regional Economic Conditions
 Regional Economic Conditions Jason Bram, Research Officer Community Advisory Group Meeting March 29, 2018 The views expressed here are those of the presenter and do not necessarily represent those of the
BREA. Contribution of Cruise Tourism to the Economies of Europe Country Report Italy. The European Cruise Council Euroyards. Business Research &
 BREA Business Research Contribution of Cruise Tourism to the Economies of Europe 2011 Country Report Prepared for The European Cruise Council Euroyards July 2012 continues to be the major centre for cruise
BREA. Contribution of Cruise Tourism to the Economies of Europe 2011 Country Report France. The European Cruise Council.
 BREA Business Research Economic Advisors Contribution of Cruise Tourism to the Economies of Europe 2011 Country Report Prepared for The European Cruise Council July 2012 receives significant economic benefits
Economic Impact Analysis. Tourism on Tasmania s King Island
 Economic Impact Analysis Tourism on Tasmania s King Island i Economic Impact Analysis Tourism on Tasmania s King Island This project has been conducted by REMPLAN Project Team Matthew Nichol Principal
Tourism in Israelan. & Employment in Tourism Industries. outline
 & Employment in Tourism Industries Tourism in Israelan outline "Committee on Statistics and Macroeconomic Analysis in Tourism" 8th meeting 26-28/3/2007 Esther Sultan Israel Ministry of Tourism, Tilda Khait
Benchmarking Travel & Tourism in Australia
 Benchmarking Travel & Tourism in Australia How does Travel & Tourism compare to other sectors? Sponsored by: Summary of Findings, November 2013 Outline Introduction... 3 Australia summary..... 8 Data sources
The Economic Impact of Tourism in Buncombe County, North Carolina
 The Economic Impact of Tourism in Buncombe County, North Carolina 2017 Analysis September 2018 Introduction and definitions This study measures the economic impact of tourism in Buncombe County, North
Manawatu District Economic Profile
 Manawatu District Economic Profile Our community Population has grown by 1,000 residents since 2014 to reach 29,800. Population is 86.4% European, with Maori 14.3% of the population. This compares with
Quarterly Bulletin of Statistics
 QUARTERLY BULLETIN OF STATISTICS 2nd Quarter Q2 GOVERNMENT OF BERMUDA Department of Statistics Quarterly Bulletin of Statistics Q2 Highlights Imports The value of imports decreased 15.8 per cent to $299.1
Purdue University Industry Report
 Purdue University Industry Report SET-Yampa White River Economic Modeling Specialists, Int. www.economicmodeling.com Page 1/14 Region Info - SET-Yampa White River Three counties region of SET in Colorado.
Quarterly Bulletin of Statistics
 Q2 QUARTERLY BULLETIN OF STATISTICS 2nd Quarter GOVERNMENT OF BERMUDA Cabinet Office Department of Statistics Quarterly Bulletin of Statistics Q2 Highlights Air Arrivals: Bermuda hosted 75,013 tourists.
ECONOMIC PROFILE PARK CITY & SUMMIT COUNTY, UTAH
 ECONOMIC PROFILE PARK CITY & SUMMIT COUNTY, UTAH Prepared by the Park City Chamber of Commerce & Visitors Bureau PO Box 1630, Park City, UT 84060 1.800.453.1360 p. 1 The following is the Tourism Section
ECONOMIC PROFILE PARK CITY & SUMMIT COUNTY, UTAH
 ECONOMIC PROFILE PARK CITY & SUMMIT COUNTY, UTAH Prepared by the Park City Chamber of Commerce & Visitors Bureau PO Box 1630, Park City, UT 84060 1.800.453.1360 Economic Profile Packet Sections 1. Introduction
The Economic Impact of Tourism in Walworth County, Wisconsin. July 2013
 The Economic Impact of Tourism in Walworth County, Wisconsin July 2013 Key themes for 2012 The Walworth County, Wisconsin visitor economy continued its brisk growth in 2012. Visitor spending rose 11% after
Economic Impact of Tourism in South Dakota, December 2017
 Economic Impact of Tourism in South Dakota, 2017 December 2017 1) Key findings 1) Growth continues in 2017 but pales against the event driven years of 2015 and 2016 in South Dakota Key facts about South
The Economic Impact of Travel in Kansas. Tourism Satellite Account Calendar Year 2013
 The Economic Impact of Travel in Kansas Tourism Satellite Account Calendar Year 2013 Who we are Tourism Economics Union of industry expertise and economic disciplines Real world insights based on quantitative
Colorado Travel Impacts p
 Colorado Travel Impacts 1996-2016p Image Credit: Matt Inden/Miles June 2017 Prepared for the Colorado Tourism Office Denver, Colorado THE ECONOMIC IMPACT OF TRAVEL ON COLORADO 1996-2016P June 2017 prepared
Travel & Tourism Sector Ranking United Kingdom. Summary of Findings, November 2013
 Travel & Tourism Sector Ranking United Kingdom Summary of Findings, November 2013 Introduction Sector Ranking Analysis In order to better understand the importance of the Travel & Tourism industry in a
Puerto Ricans in Connecticut, the United States, and Puerto Rico, 2014
 Issued April 2016 Centro DS2016US-8 Puerto Ricans in Connecticut, the United States, and Puerto Rico, 2014 In 2014, Connecticut was the 6th state with most Puerto Ricans (301,182) in the United States.
The Economic Contribution of Cruise Tourism to the Southeast Asia Region in Prepared for: CLIA SE Asia. September 2015
 BREA Business Research & Economic Advisors The Economic Contribution of Cruise Tourism to the Southeast Asia Region in 2014 Prepared for: CLIA SE Asia September 2015 Business Research & Economic Advisors
The Economic Impact of Tourism in: Dane County & Madison, Wisconsin. April 2017
 The Economic Impact of Tourism in: Dane County & Madison, Wisconsin April 2017 Key themes for 2016 Visitor spending continued growing in Dane County, Wisconsin in 2016, growing 5.2% to surpass $1.2 billion.
ECONOMIC PROFILE. Tourism
 ECONOMIC PROFILE Tourism Park City & Summit County Utah Prepared by Park City Chamber of Commerce Convention & Visitors Bureau P.O. Box 1630 ~ Park City, UT 84060-1630 800.453.1360 ~ 435.649.6100 ~ fax
Spotlight on the U.S. Market. Kentucky
 Market Analysis By AmCham s Research Department Spotlight on the U.S. Market Kentucky With a strong manufacturing base, Kentucky has achieved sustained economic growth in excess of 5% and offers many export
Nevada s Tourism, Gaming, and Entertainment Sector
 Nevada s Tourism, Gaming, and Entertainment Sector Emsi Q4 2018 Data Set www.economicmodeling.com 1 Industry Summary for Tourism, Gaming, and Entertainment 428,652 12.5% $38,553 Jobs (2018) % Change (2010-2018)
Economic Impact of Tourism in Hillsborough County September 2016
 Economic Impact of Tourism in Hillsborough County - 2015 September 2016 Key findings for 2015 Almost 22 million people visited Hillsborough County in 2015. Visits to Hillsborough County increased 4.5%
NUNAVIK'S LABOUR MARKET AND EDUCATIONAL ATTAINMENT PARADOX
 NUNAVIK'S LABOUR MARKET AND EDUCATIONAL ATTAINMENT PARADOX Andrew Sharpe and Jasmin Thomas Presentation prepared for Mapping the Road Together to Sustainable Employment; Celebrating 25 Years. Katittavik
The Economic Impact of Tourism on Guam. Tourism Satellite Account Calendar Year 2016
 The Economic Impact of Tourism on Guam Tourism Satellite Account Calendar Year 2016 Highlights! 2016 was a banner year for tourism on Guam, with visitation to Guam surpassing 1.5 million and visitor spending
The Economic Impact of Tourism in The Appalachian Region of Ohio. June 2014
 The Economic Impact of Tourism in The Appalachian Region of Ohio June 2014 Appalachia Region Tourism Summary Total Tourism Impact Appalachian Region Sales Wages Taxes Employment $4.9 billion $1.2 billion
The Economic Impact of Tourism on Galveston Island, Texas
 The Economic Impact of Tourism on Galveston Island, Texas 2017 Analysis Prepared for: Headline Results Headline results Tourism is an integral part of the Galveston Island economy and continues to be a
Oregon Travel Impacts p
 Oregon Travel Impacts 1991-2013p April 2014 Prepared for Oregon Tourism Commission Salem, Oregon OREGON TRAVEL IMPACTS, 1991-2013P STATEWIDE PRELIMINARY ESTIMATES DETAILED COUNTY ESTIMATES OVERNIGHT VISITOR
The Economic Impact of Tourism in The Appalachian Region of Ohio. June 2016
 The Economic Impact of Tourism in The Appalachian Region of Ohio June 2016 Appalachian Region tourism summary Total Tourism Impact Appalachian Region, Ohio Sales Wages Taxes Employment $5.3 billion $1.3
Key Stats. Of 11 peer cities assessed, Calgary has the second highest level of economic power comparing GDP per capita
 economy 20 Key Stats Of 11 peer cities assessed, Calgary has the second highest level of economic power comparing GDP per capita - Deloitte, Benchmarking Calgary s Competitiveness, 2015 Of 11 peer cities
Provincial Review 2016: KwaZulu-Natal KwaZulu-Natal
 Provincial Review 2016: KwaZulu-Natal KwaZulu-Natal KwaZulu-Natal has a strong role in South Africa s manufacturing and agriculture, and has its largest port and main North-South freight corridor. Its
The 2001 Economic Impact of Connecticut s Travel and Tourism Industry
 The 2001 Economic Impact of Connecticut s Travel and Tourism Industry EXECUTIVE SUMMARY Fred V. Carstensen, Director Stan McMillen, Manager, Research Projects Murat Arik, Research Associate Hulya Varol,
The Economic Impact of Tourism on Galveston Island, Texas Analysis
 The Economic Impact of Tourism on Galveston Island, Texas 2012 Analysis Headline Results Headline results Tourism is a significant contributor to business sales, employment, and taxes on Galveston Island.
CITY OF COTATI: LOCAL ECONOMIC REPORT
 EDB Sonoma County Economic Development Board Cotati Chamber of Commerce economy 2010-11 CITY OF COTATI: LOCAL ECONOMIC REPORT E c o n o m i c D e v e l o p m e n t B o a r d 4 0 1 C o l l e g e Av e n
Buffalo and New York City Since the Great Recession
 Buffalo and New York City Since the Great Recession for the Workshop on Economic Restructuring in the Rust Belt, Buffalo New York Cornell University Worker Institute James A. Parrott, Dir., Economic &
Profile of Livingston County
 Profile of Livingston County ---- 50 West Main Street ~ Suite 8107 Rochester, New York 14614 www.gflrpc.org 585.454.0190 Prepared for the Livingston County Planning Department April 2004 Mission Statement
Data Digest: Florida. August 2013
 Data Digest: Florida August 2013 The economic performance for Florida and the United States has been improving since the end of 2010. However, the nation has been improving at a faster rate than Florida.
447 Route 28 West Yarmouth MA 02673
 CAREY COMMERCIAL, INC. BUSINESS & INVESTMENT PROPERTY 146 MAIN STREET HYANNIS, MA 02601 for sale 2 ACRES OF COMMERCIAL LAND 447 Route 28 West Yarmouth MA 02673 Contact: Chuck Carey 508-790-8900 Ext. 11
September Dear Readers,
 JEDC.org 612 West Willoughby Ave. Suite A Juneau, AK 99801 Phone 907-523-2300 Fax 907-463-3929 September 2014 Dear Readers, The Juneau Economic Development Council is pleased to present the 2014 edition
Asheville Metro Economic Report 2014 Second Quarter
 Asheville Metro Economic Report Johnson Price Sprinkle PA HIGHLIGHTS: ASHEVILLE METRO The Asheville metro area gained 2,400 more jobs than one year earlier, averaging a growth rate of 1.4 percent, continuing
SLOW GROWTH OF SOUTHERN NEVADA ECONOMY
 NEVADA S ECONOMY A monthly report produced for Commerce Real Estate Solutions by Stephen P. A. Brown, PhD, Center for Business & Economic Research, University of Nevada, Las Vegas To receive an electronic
October Dear Readers,
 aklitho JEDC.org 612 W. Willoughby Ave., Suite A Juneau, AK 99801 Phone 907 523 2300 October 2012 Dear Readers, The Juneau Economic Development Council (JEDC) is pleased to make our 2012 edition of local
Benchmarking Travel & Tourism in Russia
 Benchmarking Travel & Tourism in Russia How does Travel & Tourism compare to other sectors? Sponsored by: Summary of Findings, November 2013 Outline Introduction... 3 Russia summary..... 8 Data sources
Contents Manningham at a Glance... 6 Location and Area... 6 Manningham Activity Centres... 6 Manningham Suburbs... 6 Population... 8 Forecast... 9 For
 Contents Manningham at a Glance... 6 Location and Area... 6 Manningham Activity Centres... 6 Manningham Suburbs... 6 Population... 8 Forecast... 9 Forecast 2011 2036... 9 Population Forecast... 9 Gross
Mining and Manufacturing
 Mining and Manufacturing Mining and Manufacturing Mining and Manufacturing 269 Unit : each, person, million won Total Year ( ) Number of Number of workers Value of Inventories Major Value of tanestablish-
Region Business Profile
 Business Profile ZRENJANIN Short Summary. Zrenjanin is located in the northeast part of Serbia and represents the largest city of the Serbian part of the Banat. It is also a regional political, cultural
East Lothian. Skills Assessment January SDS-1154-Jan16
 East Lothian Skills Assessment January 2016 SDS-1154-Jan16 Acknowledgement The Regional Skills Assessment Steering Group (Skills Development Scotland, Scottish Enterprise, the Scottish Funding Council
Classification of products and productive activities for tourism
 Classification of products and productive activities for tourism Developing National Systems of Tourism Statistics: Challenges and Good Practices Regional Workshop for the CIS countries, 29 June 2 July
Economy at a glance: Calgary s advantages
 Economy at a glance: Calgary s advantages Slide 1 Where is Calgary? Strategic location Western Canada s business centre 136 head offices in Calgary Western Canada s distribution hub Highway 1 and Canamex
The Economic Impact of Travel in Minnesota Analysis
 The Economic Impact of Travel in Minnesota 2013 Analysis Overview 2013 Highlights Traveler Spending Traveler spending of $10.3 billion generated $17.6 billion in total business sales in 2013 as travel
Region Business Profile
 Business Profile Novi Pazar Short Summary Novi Pazar is situated on the river Raska and is a part of the Raska district located in the southeast of Serbia tucked between the Golija and Rogozna mountains.
Puerto Ricans in Rhode Island, the United States, and Puerto Rico, 2013
 Issued September 2016 Centro DS2015US-07 Puerto Ricans in Rhode Island, the United States, and Puerto Rico, 2013 In 2013 an estimated 36,217 Puerto Ricans lived in Rhode Island and accounted for at least
Mexico. How does Travel & Tourism compare to other sectors? GDP. Size. Share. Mexico GDP Impact by Industry. Mexico GDP Impact by Industry
 Mexico Chapultepec Castle in Mexico City Agriculture Automotive Manufacturing Banking Chemicals Manufacturing Communications Education Financial Services Mining Other Service Exports Retail (without wholesale)
United Kingdom. How does Travel & Tourism compare to other sectors? GDP. Size. Share. UK GDP Impact by Industry. UK GDP Impact by Industry
 United Kingdom Stonehenge in Wiltshire Agriculture Automotive Banking Chemicals Communications Education Financial Mining Other Service Manufacturing Manufacturing Services Exports Retail (without wholesale)
The Economic and Fiscal Impacts of the Renovation, Expansion, and Annual Operation of the Balsams Grand Resort and Wilderness Ski Area
 The Economic and Fiscal Impacts of the Renovation, Expansion, and Annual Operation of the Balsams Grand Resort and Wilderness Ski Area Prepared by: February 2015 bgottlob@poleconresearch.com Table of Contents
North Lanarkshire. Skills Assessment January SDS-1163-Jan16
 North Lanarkshire Skills Assessment January 2016 SDS-1163-Jan16 Acknowledgement The Regional Skills Assessment Steering Group (Skills Development Scotland, Scottish Enterprise, the Scottish Funding Council
Queensland Economic Update
 Queensland Economic Update Chamber of Commerce & Industry March 2018 cciq.com.au Queensland Economic Update: Summary National Accounts GDP expanded 2.3% during calendar year 2017. QLD state final demand