CAPITAL CITY ECONOMIES LESSONS FOR WASHINGTON S ECONOMIC FUTURE
|
|
|
- Silas Hensley
- 5 years ago
- Views:
Transcription
1 CAPITAL CITY ECONOMIES LESSONS FOR WASHINGTON S ECONOMIC FUTURE [ 1 ]
2 By Erran Carmel, Professor of Information Technology and Director, Center for Business in the Capital, Kogod School of Business, American University and Jason Miller, CEO, Greater Washington Partnership Executive Summary Washington, D.C. is one of the most recognized cities in the world as the capital of the United States of America, but it is not like most other political capitals. In most countries, the political capital is also the economic and business capital. In fact, capital cities like Tokyo and London have regional economies that are larger and more economically important than most countries in the world. This paper compares Washington, D.C. to other capital cities regional economies to identify the key traits and characteristics of different types of political capitals in order to unveil themes as Washington and the broader Capital Region seek to move towards becoming a major economic and business capital. Washington, D.C. sits at the center of the Capital Region, a super-regional economy stretching from Baltimore to Richmond. With $697 billion in GDP, the Capital Region is today the third largest regional economy in the United States and the seventh largest in the world. Washington, D.C. represents nearly two-thirds of economic output within the larger Capital Region, or super-region. The super-region s growth over the last several decades has made it one of the larger regional economies, but it is not perceived nor is it yet performing as a business capital of the United States. Our analysis shows that capital cities generally fall into three categories of interest. The first is the Hegemonic Capital City, the most common occurrence, where the capital is also the most important business city. The second is the Peer Capital City, where the nation has two principal business cities one of which is the political capital. The third category, Secondary Capital City, includes Washington D.C. In this category, the capital is a second-tier business city compared to the nation s business capital. The Hegemonic Capital category is by far the largest, with 93 capitals 74 percent of the capitals included in this study. While there are only six Peer City Capitals, some can serve as more fitting examples for the potential Washington, D.C. can achieve. One such model is Delhi, India, which has ascended in recent decades to become a peer to Mumbai in terms of economic impact, generating similar GDP, and attracting the headquarters of large multinational corporations. Washington, D.C. is one of 15 Secondary Capital Cities, in which the political capital is a second-tier business city within its country (such as Ottawa, Canberra, Brasilia, and Ankara). These cities tend to have smaller populations and lower population densities than their respective country s economic capital; they have lower concentration of business headquarters; and they tend not to be major transportation hubs. Additionally, these capitals have high income levels compared to the national average, highly educated populations, strong university presence, and a strong high-tech presence. [ 2 ]

3 Washington is one of just two Secondary Capital Cities that have made meaningful progress in narrowing the gap with their nations major business cities, the other being Berlin. The Capital Region, with Washington as its anchor, has the underlying potential for strengthening its relative global position and becoming a political and economic capital. While there are limited examples in the modern era of political capitals that emerged to also becoming an economic and business capital, this analysis of capital cities demonstrates two different levers that may serve to expand Washington s economic performance and economic prominence, and in turn further close the gap and reach recognized prominence as a political and economic capital. First, several capitals have expanded their geographic footprint in different ways, leveraging the related assets and scale of surrounding communities. Second, political capitals tend to have unique strengths linked back to the role of government in the twenty-first century, in particular a highly educated and technologically savvy population and workforce that may be a comparative advantage given global economic trends. [ 3 ]


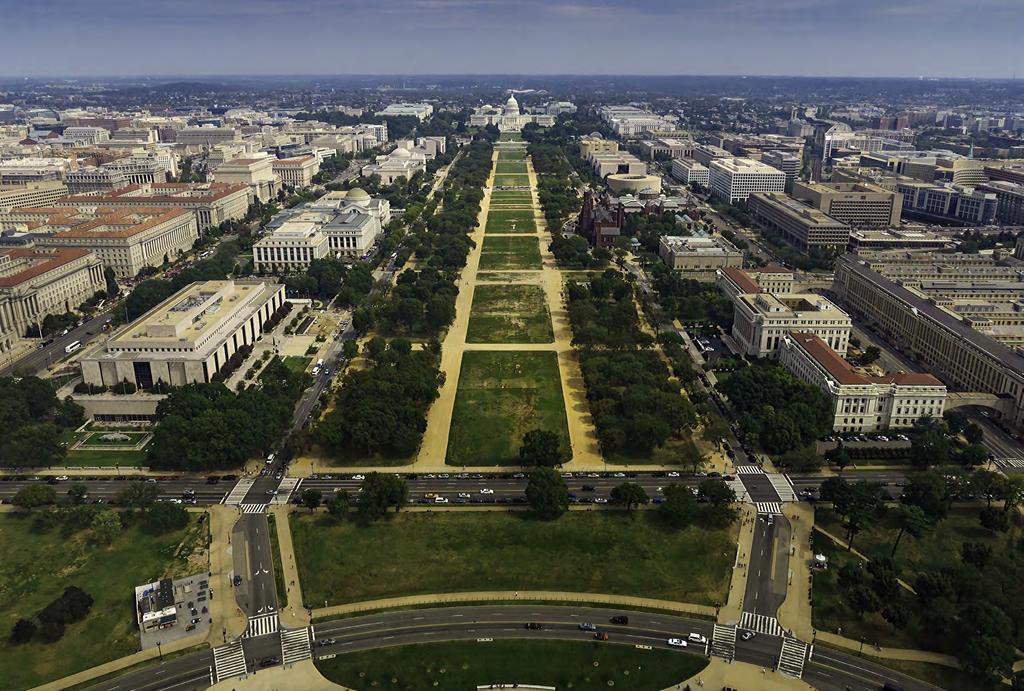
4 Section 1. Washington, D.C. and the Capital Region With a GDP of $697 billion1 and 10.3 million residents2, the Capital Region of Baltimore, Washington, and Richmond is the third largest economy in the United States and the seventh largest economy in the world. Representing nearly two-thirds of the region s economic output and 60 percent of the population, Washington, D.C. is at the heart of the super-region. The graph on the next page demonstrates the relative performance of the three metropolitan areas that make up the super-region compared to other major metropolitan areas over a 15-year period. The Washington metro area economy expanded by 35% over that period, although its growth has begun to slow since the start of the economic recovery in 2010 and 2011 compared to the U.S. average and other metropolitan areas.3 Some of this performance can be attributed to a smaller downturn in the Great Recession and some can be attributed to reduced federal spending beginning in Baltimore, MD Washington, DC. Map of the Capital Super-Region Richmond, VA Moreover, the relative performance of Washington, Baltimore and Richmond has been converging in recent years. Baltimore and Washington have historically followed similar growth patterns, while Richmond's relationship with Washington has been slightly weaker. This relationship has strengthened in recent years; since 2011, the growth gap between the Washington and Richmond metro areas is half that of the previous decade. [!4 ]
5 Relative GDP Growth, Real GDP Growth (Indexed 2002 = 100) Baltimore Metro Area Chicago Metro Area Los Angeles Metro Area New York Metro Area Richmond Metro Area San Francisco Metro Area Washington, D.C. Metro Area All US Metro Areas The super-region's 3.3 percent unemployment and 70 percent labor force participation rate are indicators of a strong labor market. The super-region outperforms both the national 3.9 percent unemployment and 63 percent labor force participation rate. 4 The super-region is relatively well connected, with hundreds of thousands of daily commuters moving up and down the corridor and the business ecosystems in key industry verticals developing across jurisdictional and metropolitan area boundaries. The superregion has deep and broad assets, including four international airports and two ports, 53 Fortune 1000 companies 5, 115 federal labs and federally-funded research and development centers, and a skilled labor force of 5.5 million people. 6 The Capital Region has become a significant regional economy, but it is not yet the model for a dual political and business capital. [ 5 ]
6 The Super-Region vs. its Sub-Regions 7 The table below provides a breakdown of the super-region's assets across its three metropolitan areas. As further described in the next section, these assets are similar to those of other capitals in the Secondary Capital Cities category (in which the capital is a second-tier business city), while at the same time, the Capital Region is stronger than its class. The Super- Region (as a whole) Washington Metropolitan Area Baltimore Metropolitan Area Richmond Metropolitan Area Population 10,318,968 6,216,589 2,808,175 1,294,204 Population Density 769 people per square mile 995 people per square mile 1,080 people per square mile 283 people per square mile Business Headquarters 53 Fortune 1000 business headquarters (DC, MD, VA) 49 Fortune 1000 business headquarters (super-region) 31 Fortune 1000 business headquarters 7 Fortune 1000 business headquarters 11 Fortune 1000 business headquarters Transportation 4 major airports 2 major ports 2 major airports 1 major airport 1 major port 1 major airport 1 major port Education 46% of the population holds a bachelor s degree or higher 50% of the population holds a bachelor s degree or higher 40% of the population holds a bachelor s degree or higher 36% of the population holds a bachelor s degree or higher University Presence 1 top 20 university 0 top 20 universities (on a consistent basis) 1 top 20 university 0 top 20 universities [ 6 ]

7 Section 2. A Comparison of Capital Cities Capital cities play the central role in a country s political life, housing the national government and serving as the political connection point with other countries. An analysis of the largest 125 countries by population from China s 1.4 billion to Liberia s 4.3 million in total representing 98 percent of the world s population demonstrates that capital cities generally fall into three stylized groups. The complete list of capitals appears in Appendix A. Categorization of the world s capital cities as the top business city within their countries Count Percent Group 1 Hegemonic Capital. The Capital is Also the Most Important Business City 93 74% Group 2 Peer Capital. The Capital is a First-Tier Business City along with another First-Tier Business City 6 5% Group 3 Secondary Capital City. The Capital is a Second-Tier Business City (This includes Washington D.C.) 15 12% Other Special & Exception Cases (see Appendix B) 11 9% [ 7 ]
8 Hegemonic Capital Cities: The Capital is Also the Most Important Business City For 93 of the world s largest 125 countries 74 percent the political capital also serves as the center of the country s economic and business activity. London is perhaps the foremost example that comes to mind. London dominates British life in business, finance, transportation, the arts, population, and GDP. This pattern repeats for many of the other 93 cities. The capital city in these cases is the hegemonic city. Other examples of major capitals include Tokyo, Mexico City, Cairo, Paris, and Moscow. The capital city tends to also be the dominant business city disproportionally in nations of less than 15 million in population (e.g., Managua in Nicaragua or Prague in the Czech Republic), obeying Zipf s Law. 8 That is, in smaller countries those with a population of fewer than 15 million 87 percent have a hegemonic capital of business and politics. Selected Hegemonic Capital Cities Asia Seoul, Tokyo, Manila, Bangkok, Jakarta, Taipei, Kuala Lumpur Latin America Buenos Aires, Bogota, Mexico City, Santiago, Lima Middle East and Africa Cairo, Tehran, Algiers, Beirut, Nairobi, Addis Ababa, Accra, Riyadh Europe Moscow, Lisbon, Copenhagen, Stockholm, London, Paris, Madrid, Warsaw, Athens, Budapest, Vienna, Brussels Peer Capital Cities: The Capital City is a Peer, First-Tier Business City In some nations, the political capital is one of two first-tier business cities, effectively acting as a peer city from an economic standpoint to another dominant business city. There are six nations in which this occurs. Examining these six peer cities offers some insights for Washington D.C. and the super-region. First, there are two cases within this group Delhi and La Paz where there has been movement in their relative power within the last generation: Delhi moved up and La Paz moved down. If Washington, D.C. were to expand its relative position, the shift would be towards a peer city model with New York City and Los Angeles, rather than towards a single hegemonic political and business capital. [ 8 ]
9 Country China India Italy Vietnam Bolivia Libya First-tier peer business cities Beijing-Shanghai Delhi-Mumbai Rome-Milan Hanoi-Saigon (HCM City) La Paz-Santa Cruz Tripoli-Benghazi The first three large nation cases China, India, and Italy offer the most relevant lessons to Washington, D.C. and the Capital Region. First, in all three countries there are expanding geographic governance structures around the peer cities both the capital and the business city. The three capitals have all expanded geographically. Rome expanded in 2015 into the Metropolitan City of Rome, which includes over 4 million people. Beijing is continuing its expansion and now planning an expansion into a true supercity labeled Jing-Jin-Ji that includes Xiongan New Area. It will be a staggering 212,000 square kilometers (81,854 square miles). Delhi is part of the National Capital Region, of 58,000 square kilometers (22,394 square miles), which expands every few years, most recently in 2015 (meanwhile its peer Mumbai cannot expand further into Back Bay and into the Arabian Sea). The growth via expansion is significant in Rome, Beijing, and Delhi. While governance expansion or annexation which has been the mechanism these three cities have used is not a viable strategy for U.S. cities and regions, the Capital Region can draw lessons from Rome, Beijing, and Delhi by enhancing geographic integration of assets and the economy (this point is further discussed in Section 4). Rome, Beijing, and Delhi have all been the capitals of major empires over time, and empires often treated their political capitals as hubs of economic activity, bringing back the bounty of the empire to political rulers. Washington does not share these three capitals unique characteristic and like many of the Secondary Capital Cities, it is a relatively new city. The stories of these three cities are inevitably stories of national rivalry: China: Shanghai and the Chinese capital of Beijing have a century-old rivalry. Shanghai is more like New York City acting as the financial center and home to the country s major [ 9 ]

10 banks. Beijing, on the other hand, is the heart of media and technology, a combination of China s Hollywood and Silicon Valley. Beijing s high-tech concentration is typical of most capital cities, with educated populations and government-funded technology projects. In general, Beijing has grown economically stronger since World War II, largely due to Communist Party-political power. One of the outcomes is that Shanghai's cultural predominance has been eclipsed by Beijing. India: While Mumbai is typically viewed as India s business city serving as the center for the country s financial sector, including the stock exchange Delhi has now risen, in the last 25 years, to be a peer business city. Both cities now generate roughly the same GDP, $400 billion each. Many of the largest businesses are headquartered in Mumbai, but Delhi has the state-owned enterprises, such as Indian Railways, employing more than one million people. MNCs, such as Google and Samsung, set up headquarters in the capital to be close to the regulators and in proximity to Delhi s strong human capital. Italy: Rome has a well-known and storied history as one of Europe s largest cities at various points in time over the past 2,500 years. Today, Milan serves as the financial center and Italy s premier business and fashion destination. However, Rome still carries economic heft as a first-tier business city within Italy. It holds the offices of many global corporations operating in Italy, and houses some of the headquarters of Italy s largest companies. The Peer Capital Cities include three more pairings. Bolivia, although a relatively smaller and poorer nation, has seen an interesting dynamic of its capital city. La Paz, the capital, was Bolivia s dominant business city and then lost its hegemony status about 20 years ago to Santa Cruz 9 due, in part, to political radicalization that led to business flight. Santa Cruz has been growing faster and is viewed as the more dynamic of the two cities. The case of Vietnam, came about, at least in part, because its peer cities were separated by war and ideology for three decades. Ho Chi Minh City (Saigon) had been Vietnam s commercial center since the 1800s, but the capital of Hanoi houses the large banks and State-Owned Enterprises. Libya, since 2011 a failed state, does not offer lessons at this point. [ 10 ]
11 Secondary Capital Cities: The City is a Second-Tier Business City Washington is such a recognizable center of world political power that it is useful to frame where it is economically. That is, it is most similar in its characteristics to 14 capital cities that are not their respective nations major economic capitals and not the first-tier business cities within their nations. Together, these Secondary Capital Cities and their nations appear in the following table. These nations are evenly spread across all continents, without any one region being noteworthy in its concentration or absence of such cities. Notably, there are many former British colonies. Four are English-speaking nations (USA, Australia, Brazil, and Canada) that created federated governments and tended to choose political capitals that were not major commercial centers. Additionally, because of this political governance arrangement, many of the capitals, such as Washington, are relatively new cities. Country Capital Major Business City USA Washington D.C. New York Canada Ottawa Toronto Australia Canberra Sydney New Zealand Wellington Auckland Brazil Brasilia Sao Paulo Ecuador Quito Guayaquil Switzerland Bern Zurich Germany Berlin Frankfurt/Munich/Hamburg 10 Turkey Ankara Istanbul Israel Jerusalem Tel Aviv Pakistan Islamabad Karachi Morocco Rabat Casablanca Nigeria Abuja Lagos Cameroon Yaounde Douala Malawi Lilongwe Blantyre [ 11 ]
12 Section 3. Washington and Secondary Capital Cities Analysis of 125 capital cities around the world reveals that fifteen capital cities, including Washington, have similar characteristics as primary political capitals that do not exhibit the traits of the country s leading economic hubs. They are categorized as Secondary Capital Cities a term which emerged recently from scholars at the University of Bern. 10 There are meaningful differences among these capital cities, and they have vastly different cultures and histories, yet they portend potential growth in today's economy due to certain shared strengths. The characteristics these cities generally share are: 1. They are new relative to other national cities. 2. They have lower populations and lower population densities than first-tier business cities. 3. They do not have a high concentration of business headquarters. 4. They are not major transportation hubs. 5. They have a highly educated populations and strong university presence. 6. They have a high-tech presence. More detail about each characteristic as it relates to these 15 cities is below and in Table A. Characteristic 1: New Relative to Their Major Business Cities Secondary Capital Cities are relatively new cities/capitals, meaning the capital was moved or recently founded as a capital city (refer to Table A). Five of these capitals are post-world War II era; nine are post-1900; and all are post The first table in Appendix D notes when the city became the capital. In a few cases, the capital was established by the colonial power, such as Rabat in Morocco, but in most cases, the capital was established by the sovereign nation at the point of independence, soon after independence, or well after independence. Of the cities, most have not moved significantly or have declined in their business status within the last century. 11 In other words, the capitals in this group are stuck in their secondtier status. There are two interesting exceptions. The first is the relative decline of Wellington, New Zealand s capital, which lost much of its business importance in the post-world War II era due to government cutbacks in the 1980s. These cutbacks reduced government employment and drove many businesses to relocate to Auckland. [ 12 ]

13 The second case is Berlin, which became the political capital of a unified Germany once again in 1989 after being divided for 41 years. Berlin is a highly particular case. Once it was no longer divided, no longer isolated, and once again the capital, it quickly began to ascend as a business city. Besides Berlin, none of these capitals are on a trajectory to rise to become a Peer Capital City in the next 10 to 20 years. The other Secondary Capital Cities do not exhibit expected outsized economic performance that would enable them to meaningfully change their relative commercial position. Instead, the Secondary Capital Cities will continue to be what their label describes: secondary. [ 13 ]
14 Characteristic 2: Lower Populations and Population Densities Than First-Tier Business Cities As illustrated in the bar graphs below, Secondary Capital Cities usually have lower populations and lower population densities in comparison with first-tier business cities (the exceptions evident below are Berlin, Germany; Yaounde, Cameroon; and Lilongwe, Malawi). 100% Capital City Population as a Proportion of Business City Population 75% 50% 25% 0% Malawi Cameroon Nigeria Morocco Pakistan Israel Turkey Germany Switzerland Ecuador Brazil New Zealand Australia Canada USA 100% Capital City Population Density as a Proportion of Business City Population 75% 50% 25% 0% Malawi Cameroon Nigeria Morocco Pakistan Israel Turkey Germany Switzerland Ecuador Brazil New Zealand Australia Canada USA The first ratio is of the absolute population in the two metropolitan areas. If the population of the capital city is one million and the business city is three million, then the ratio is 33.3%. The second ratio is of the population density of the two metropolitan areas. Thus, if the population density of the capital city is 1,000 people per km 2 and the business city is 3,000 per km 2, then the ratio is 33.3%. [ 14 ]
15 Characteristic 3: Limited Concentration of Business Headquarters Secondary Capital Cities do not have a high concentration of business headquarters (refer to Table A). This paper examines three categories: (1) whether the capital houses major banks; (2) whether the capital has the largest corporations; and (3) whether the capital has the important foreign multi-national corporations. The three categories tend to be highly correlated. Secondary Capital Cities also tend to house defense firms (e.g., the USA and Turkey). The larger cities also house State-Owned Enterprises (SoE) also known as Government-Owned Corporations. Since the SoE influence is of importance to the analysis, several examples are noted from both Peer Capital Cities and from Secondary Capital Cities: Beijing: Nine of the largest nine Chinese corporations are here and all are SoE. Berlin: Deutsche Bahn, the national rail firm, is here. Delhi: Indian Railways, the largest Indian company, is here. Ottawa: Two large Crown Corporations are here Canada Mortgage & Housing; Canada Post Rome: Four of 10 largest Italian companies are here; two of them are SoE and other two are former SoE. Washington: Financial SoE include Freddie Mac, Fannie Mae, OPIC, Ex-Im Bank; Other SoE include Amtrak, USPS. Characteristic 4: Not Major Transportation Hubs Most of Secondary Capital Cities are not major transportation hubs. One exception is Washington, D.C., which has three major airports. Looking past the boundaries of the Washington metropolitan area to the entire super-region, there are a total of four airports and two ports, which are critical assets for trade, tourism, and travel. This characteristic sets Washington apart from the other Secondary Capital Cities. Characteristic 5: Highly Educated Population and Strong University Presence Many of the Secondary Capital Cities have highly-educated populations, explained in part by the proximity to government. Ottawa, Wellington, and Washington, D.C. have extremely high education levels. Given the high average education levels in capital cities in general, it is not surprising that these cities tend to also have at least some strength in universities, with some capitals (Quito, Rabat, Ankara, Islamabad, and Berlin) having a leading national position in universities. Washington appears to be somewhat unique. While it has a large university population and many respected universities, it does not house any of the consistently top-ranked American universities and none of its universities are considered world-class in technology and engineering fields. [ 15 ]
.")
16 Characteristic 6: High-Tech Presence The Secondary Capital Cities possess several characteristics which are conducive to hightech concentrations: they house educated populations and they are closer to government s largesse focused on innovation activities or IT (see the innovation city rankings in Appendix C). Capital cities housed the legacy telecommunications organizations, which were once regulated monopolies. For example, Washington housed the very first satellite organization (Intelsat, an international consortium, strongly influenced by its key founder, the USA). Larger nations also cluster defense tech and aerospace around the capital as is the case in Ankara and Washington. Berlin s technology sector has developed rather differently: in the recent decade it has emerged as hip European startup hub focused on services and media. Despite the above high-tech strengths, none of these capitals, with the possible exception of Berlin, has sufficient high-tech critical mass to drive the city into peer status with the business capital (see more detail in Appendix D). [ 16 ]
17 Table A: Comparison of Secondary Capital Cities 12 Capital Relatively New? High concentration of business HQs? Major transportation hub? Is the capital population more educated than most national locations? Has top universities in the nation? High-tech city/ center of innovation? USA Washington D.C. Y S Y Y S Y Canada Ottawa Y Y S Y Australia Canberra Y Y S New Zealand Wellington Y S Y S S Brazil Brasilia Y Ecuador Quito Y Y Switzerland Bern S Germany Berlin S S Y Y Turkey Ankara Y S Y Y Y S Israel Jerusalem S S Pakistan Islamabad Y Y Y Morocco Rabat S Y Nigeria Abuja Y S S Cameroon Yaounde Y S Y S Malawi Lilongwe Y Y S Y Y = Yes S = Somewhat [ 17 ]
18 Section 4. Lessons for the Capital Super-Region Breakout Potential for the Super-Region? Washington, D.C., and more broadly the Capital Region, is not currently projected to close the gap between itself and the top U.S. economic regions without a change in trajectory relative to recent economic performance. The superregion's average GDP growth rate over the past 5 years was 1.0%, a slower pace than the 2.1% metropolitan area average. Historically, there has been relatively limited upward movement in the business dominance of capital cities, due to the stickiness of agglomeration forces and the existing ecosystems of cities. That said, this analysis of capital cities shows that it is possible for cities to rise over time. To close the gap, the super-region has lessons to learn from other capitals. There are two potential levers that this analysis brings to light for the Washington superregion to become a dual political and business capital. The first is expanding the geographic footprint of a region. Three major peer city capitals from Peer Capital Cities namely, Delhi, Beijing, and Rome maintain their position, in part, by expanding their geographic governance. In the super-region, this can be accomplished through jurisdictional cooperation and leveraging shared assets across the larger geographic footprint. There is already a level of jurisdictional cooperation, with three major jurisdictions governing aspects of the Washington metropolitan area. A recent example of regional jurisdictional cooperation is the $500 million in dedicated annual funding for the Washington Metropolitan Area Transit Authority (WMATA), an achievement that required the governments of Maryland, Virginia, and the District working closely together. This major success benefited both residents and businesses. In Virginia, proximity to Metrorail increases property value by 7 to 9 percent and generates $3.1 billion annually in property tax revenues. 13 Businesses flock to transit-adjacent locations 85 percent of the commercial development pipeline is located within one quarter mile of a Metrorail station and 92 percent of commercial leases over 20,000 square feet signed in the last few years were within one-half mile of a Metrorail station. 14 An economic impact study conducted in Virginia shows that the presence of Metrorail and Virginia Railway Express (VRE) results in more than $600 million in sales and income tax revenue and that estimate is only for one of the three jurisdictions. 15 Securing dedicated funding for WMATA will have significant economic impact and is a necessary ingredient to enabling the region to become a dual political and business capital. Continuing to leverage shared assets and work cooperatively across jurisdictional lines, both on additional transportation opportunities and other issues, will lead the super-region closer towards achieving breakout trajectory. However, more can be done, including limiting any unnecessary frictions and inconsistencies across the three major jurisdictions going forward. The second lever is harnessing a highly educated population combined with a strong tech sector. This analysis shows that capitals tend to have more highly educated populations and [ 18 ]

19 stronger tech sectors than in other cities. A notable example of a successful Secondary Capital City is Berlin, which has become, by some rankings, the #1 European technology hub. It is the fastest-growing startup ecosystem in Europe and received the most venture capital investment of any European city in some recent years more than London or Stockholm. It is drawing companies and talented tech people from all over Europe. The Berlin branding of being low-cost, slightly gritty, artsy, hip, and cultural, have all come together for it in recent years. Washington and the Capital Region have much to learn from other successful capitals, but it is already making some strides towards improving its economic outcomes. Increasing cooperation while enhancing its geographic connectedness and working towards attracting and retaining a talented workforce that supports a robust tech sector will improve the economy in the super-region. Pulling these two levers expansion of geographic governance and maintaining an educated population with a strong tech sector will help the superregion increase its economic performance and move towards achieving breakout trajectory. [ 19 ]

20 Acknowledgements We thank the following for their rich local knowledge: Benoni Belli on Brazil; Engin Cakici on Turkey; Michael Fahy on Morocco; Sanal Mazvancheryl on India; Valentina Bruno on Italy; Alan Sullivan and Philippe Lagasse on Canada; Benoit Aubert on New Zealand; David Kaufmann on Germany; Robert Albro on Bolivia. Additionally, we would like to thank Zaynab Malik and Natnaell Mammo for their contributions to this report. [ 20 ]
21 Appendix A: 125 largest nations and their respective political and business capitals Country Pop (M) Political Capital Business Capital(s) Category 1 China Beijing Beijing - Shanghai Peer 2 India Delhi Delhi - Mumbai Peer 3 USA Washington D.C. New York City Secondary Capital City 4 Indonesia Jakarta Jakarta Hegemonic 5 Pakistan Islamabad Karachi Secondary Capital City 6 Brazil Brasilia Sao Paulo Secondary Capital City 7 Nigeria Abuja Lagos Secondary Capital City 8 Bangladesh Dhaka Dhaka Hegemonic 9 Russia Moscow Moscow Hegemonic 10 Japan Tokyo Tokyo Hegemonic 11 Mexico Mexico City Mexico City Hegemonic 12 Philippines Manila Manila Hegemonic 13 Egypt 96.0 Cairo Cairo Hegemonic 14 Ethiopia 94.4 Addis Ababa Addis Ababa Hegemonic 15 Vietnam 93.7 Hanoi Hanoi-SaigonHCMC Peer 16 Germany 82.8 Berlin Fra/ Muc / Ham Secondary Capital City 17 Congo (DRC) 81.3 Kinshasa Kinshasa Hegemonic 18 Iran 80.9 Tehran Tehran Hegemonic 19 Turkey 80.7 Ankara Istanbul Secondary Capital City 20 Thailand 69.0 Bangkok Bangkok Hegemonic 21 France 67.2 Paris Paris Hegemonic 22 UK 65.6 London London Hegemonic 23 Italy 60.5 Rome Rome- Milan Peer 24 Tanzania 57.3 Dodoma Dar es Salaam Special case: recency, proxim. 25 South Africa 56.5 Pretoria Johannesburg Special case: recency, proxim. 26 Myanmar 53.4 Naypyidaw Yangon Special case: recency, proxim. 27 South Korea 51.4 Seoul Seoul Hegemonic 28 Kenya 49.7 Nairobi Nairobi Hegemonic [ 21 ]
22 Country Pop (M) Political Capital Business Capital(s) Category 29 Colombia 49.5 Bogota Bogota Hegemonic 30 Spain 46.5 Madrid Madrid Hegemonic 31 Argentina 44.0 Buenos Aires Buenos Aires Hegemonic 32 Ukraine 42.4 Kiev Kiev Hegemonic 33 Algeria 41.7 Algiers Algiers Hegemonic 34 Sudan 40.8 Khartoum Khartoum Hegemonic 35 Poland 38.4 Warsaw Warsaw Hegemonic 36 Iraq 38.3 Baghdad Baghdad Hegemonic 37 Uganda 37.7 Kampala Kampala Hegemonic 38 Canada 36.7 Ottowa Toronto Secondary Capital City 39 Morocco 34.5 Rabat Casablanca Secondary Capital City 40 Saudi Arabia 34.1 Riyadh Riyadh Hegemonic 41 Uzbekistan 32.3 Tashkent Tashkent Hegemonic 42 Malaysia 32.3 Putrajaya Kuala Lampur Special case: recency, proxim. 43 Peru 31.8 Lima Lima Hegemonic 44 Venezuela 31.4 Caracas Caracas Hegemonic 45 Afghanistan 29.7 Kabul Kabul Hegemonic 46 Ghana 29.0 Accra Accra Hegemonic 47 Nepal 28.8 Kathmandu Kathmandu Hegemonic 48 Angola 28.4 Luanda Luanda Hegemonic 49 Yemen 28.3 Sanaa Sanaa-Aden Special case: recency, proxim. 50 Mozambique 27.1 Maputu Maputu Hegemonic 51 Madagascar 25.6 Antananarivo Antanarivo Hegemonic 52 North Korea 25.5 Pyonyang Pyonyang Hegemonic 53 Australia 24.7 Canberra Sydney Secondary Capital City 54 Côte d'ivoire 24.7 Yamoussoukro Abidjan Special case: recency, proxim. 55 Taiwan 23.6 Taipei Taipei Hegemonic 56 Cameroon 23.2 Yaounde Douala Secondary Capital City 57 Niger 21.5 Niamey Niamey Hegemonic [ 22 ]
23 Country Pop (M) Political Capital Business Capital(s) Category 58 Sri Lanka 21.2 Sri- Jayawardenepura Colombo Special case: recency, proxim. 59 Romania 19.6 Bucharest Bucharest Hegemonic 60 Burkina Faso 19.6 Ouagadougou Ouagadougou Hegemonic 61 Malawi 18.6 Lilongue Biantyre Secondary Capital City 62 Mali 18.5 Bamako Bamako Hegemonic 63 Syria 18.3 Damascus Damascus Hegemonic 64 Kazakhstan 18.1 Astana Almaty Special case: recency, proxim. 65 Chile 17.4 Santiago Santiago Hegemonic 66 Netherlands 17.2 Hague Rotterdam -Ams dam Special case: recency, proxim. 67 Ecuador 16.8 Quito Guayaquil Secondary Capital City 68 Zambia 16.4 Lusaka Lusaka Hegemonic 69 Guatemala 16.2 Guatemala City Guatemala City Hegemonic 70 Cambodia 15.8 Phnom Penh Phnom Penh Hegemonic 71 Senegal 15.3 Dakar Dakar Hegemonic 72 Chad 14.9 Ndjamena Ndjamena Hegemonic 73 Somalia 14.7 Mogadishu Mogadishu Hegemonic 74 Zimbabwe 14.5 Harare Harare Hegemonic 75 Guinea 12.7 Conakry Conakry Hegemonic 76 South Sudan 12.6 Juba Juba Hegemonic 77 Rwanda 11.8 Kigali Kigali Hegemonic 78 Belgium 11.4 Brussels Brussels Hegemonic 79 Tunisia 11.3 Tunis Tunis Hegemonic 80 Cuba 11.2 Havana Havana Hegemonic 81 Bolivia 11.1 La Paz Santa Cruz La Paz Peer 82 Benin 11.0 Porto Novo Cotonou Special case: recency, proxim. 83 Haiti 10.9 Port au Prince Port au Prince Hegemonic 84 Greece 10.8 Athens Athens Hegemonic 85 Czech Rep Prague Prague Hegemonic 86 Burundi 10.4 Bujumbura Bujumbura Hegemonic [ 23 ]
24 Country Pop (M) Political Capital Business Capital(s) Category 87 Portugal 10.3 Lisbon Lisbon Hegemonic 88 Dominican Rep Santa Domingo Santa Domingo Hegemonic 89 Sweden 10.1 Stockholm Stockholm Hegemonic 90 Jordan 10.0 Amman Amman Hegemonic 91 Azerbaijan 9.9 Baku Baku Hegemonic 92 Hungary 9.8 Budapest Budapest Hegemonic 93 Belarus 9.5 Minsk Minsk Hegemonic 94 UAE 9.4 Abu Dhabi Dubai Special case: recency, proxim. 95 Honduras 8.9 Tegucigalpa Tegucigalpa Hegemonic 96 Tajikistan 8.8 Dushanbe Dushanbe Hegemonic 97 Austria 8.8 Vienna Vienna Hegemonic 98 Israel 8.8 Jerusalem Tel Aviv Secondary Capital City 99 Switzerland 8.4 Bern Zurich Secondary Capital City 100 Papua N.G. 8.2 Port Moresby Port Moresby Hegemonic 101 Togo 7.2 Lomé Lomé Hegemonic 102 Bulgaria 7.1 Sofia Sofia Hegemonic 103 Sierra Leone 7.1 Freetown Freetown Hegemonic 104 Serbia 7.1 Belgrade Belgrade Hegemonic 105 Paraguay 7.0 Asuncion Asuncion Hegemonic 106 El Salvador 6.6 San Salvador San Salvador Hegemonic 107 Laos 6.5 Vientiane Vientiane Hegemonic 108 Libya 6.4 Tripoli Tripoli- Benghazi Peer 109 Nicaragua 6.3 Managua Managua Hegemonic 110 Kyrgyzstan 6.1 Bishkek Bishkek Hegemonic 111 Lebanon 6.1 Beirut Beirut Hegemonic 112 Denmark 5.8 Copenhagen Copenhagen Hegemonic 113 Turkmenistan 5.8 Ashgabat Ashgabat Hegemonic 114 Singapore 5.6 Singapore Singapore Hegemonic 115 Finland 5.5 Helsinki Helsinki Hegemonic 116 Slovakia 5.4 Bratislava Bratislava Hegemonic [ 24 ]
25 Country Pop (M) Political Capital Business Capital(s) Category 117 Norway 5.3 Oslo Oslo Hegemonic 118 Congo (ROC) 5.3 Brazzaville Brazzaville Hegemonic 119 CAR 4.7 Bangui Bangui Hegemonic 120 Eritrea 5.1 Asmara Asmara Hegemonic 121 Costa Rica 4.9 San Jose San Jose Hegemonic 122 New Zealand 4.8 Wellington Auckland Secondary Capital City 123 Ireland 4.8 Dublin Dublin Hegemonic 124 Oman 4.6 Muscat Muscat Hegemonic 125 Liberia 4.3 Monrovia Monrovia Hegemonic Appendix B: Special Cases of Capital Cities Eleven capital cities are special cases that do not fit into the three aforementioned categories. These are cases that fall into one of these two reasons: Proximity. These are capitals that are part of another major metropolitan area. Relocation. That is, there was a recent capital relocation, or attempted capital relocation. A few of the special cases are noted here (the complete list is in Appendix A). Proximity South Africa has the city pair of Pretoria (capital) and Johannesburg (the major business city) that are proximate (50 kilometers). Netherlands capital of The Hague is much smaller than Amsterdam, but The Hague is essentially one big metropolitan area together with Rotterdam (a major global port) and Delft (a university and tourist town). Thus, it also has some attributes of the Peer Capitals group. Recency Côte d'ivoire has not been successful in moving its capital to a new capital of Yamoussoukro from its major city of Accra. Kazakhstan s capital has been Astana, a new capital, since the late 1990s, after moving the capital from Almaty. Both Proximity and Recency Malaysia began moving some of its government functions to a new city on the fringes of the Kuala Lumpur capital. [ 25 ]
26 Appendix C: Secondary Cities as Innovation Cities Are Secondary Capital Cities more innovative than their respective major business cities? To answer that question, we examined the Innovation Cities ranking of 500 cities. 16 The answer is mostly No. In the table below the business city is ranked significantly above the political capital in innovation. For example, New York City is ranked 2 nd, while Washington is only ranked 27 th. There are two important exceptions: In Germany and New Zealand, the capital is ranked relatively close to the major business city. Country Capital Ranking in Innovation Cities 2016 (lower is better) Major business city Ranking in Innovation Cities 2016 (lower is better) USA Washington D.C. 27 New York 2 Canada Ottawa 131 Toronto 8 Australia Canberra 169 Sydney 14 New Zealand Wellington 108 Auckland 89 Brazil Brasilia 365 Sao Paulo 76 Ecuador Quito 424 Guayaquil 471 Switzerland Bern 225 Zurich 52 Germany Berlin 17 Fra/Muc/Ham 41/15/40 Israel Jerusalem 268 Tel Aviv 37 Pakistan Islamabad NC Karachi 386 Turkey Ankara 330 Istanbul 81 Morocco Rabat NC Casablanca 382 Nigeria Abuja NC Lagos 479 Cameroon Yaounde Douala Malawi Lilongwe Blantyre [ 26 ]
27 Appendix D: Detailed Tables about Secondary Capital Cities When the Cities Became Capital Cities Capital When it became a Capital City USA Washington D.C. 1800, soon after national independence Canada Ottawa 1857, before the nation s full independence Australia Canberra 1927, soon after national independence New Zealand Wellington 1865, well before the nation s full independence Brazil Brasilia 1960, well after national independence Ecuador Quito Well before national independence Switzerland Bern 1848, well after national independence Germany Berlin 1871, at unification Turkey Ankara 1923, soon after national independence Israel Jerusalem 1948, at national independence Pakistan Islamabad 1960s, more than a decade after independence Morocco Rabat 1912, well before nation s full independence Nigeria Abuja 1991, well after national independence Cameroon Yaounde 1922, before the nation s full independence Malawi Lilongwe 1975, more than a decade after independence [ 27 ]
28 Business HQs in the Secondary Capital Cities Capital Does the capital have a high concentration of business headquarters? USA Washington D.C. Limited. 15 of Fortune 500 have HQ here, with several in defense Canada Ottawa No. None of the Top 20 firms are HQ here. Australia Canberra No New Zealand Wellington No Brazil Brasilia No Ecuador Quito No Switzerland Bern No Germany Berlin Limited. National rail + one of Siemens HQ Turkey Ankara Limited. Defense firms, and 1 of 3 big telcomms companies. Israel Jerusalem No Pakistan Islamabad No. Although some state-owned enterprises have HQ here. Morocco Rabat No Nigeria Abuja No Cameroon Yaounde Yes. 5 of the 15 notable firms are HQ here. Malawi Lilongwe Yes. 4 of the 16 notable firms are HQ here. [ 28 ]
29 Education Levels in Secondary Capital Cities Capital Is the capital population more educated than most national locations? USA Washington D.C. Yes. Highest ratio of post-grad workers in USA. Canada Ottawa Yes. Ottawa has the highest per capita concentration of engineers, scientists, and residents with PhDs in Canada. Australia Canberra Yes New Zealand Wellington Yes. Highest proportion of people with university degrees, 28% have a university degree or equivalent. Brazil Brasilia No Ecuador Quito Yes Switzerland Bern No Germany Berlin No. At 24.3%, Berlin is lower than 27.2% in Frankfurt and 29.9% in Munich. Turkey Ankara Yes Israel Jerusalem No Pakistan Islamabad Yes. Highest literacy in country. 10% have a university degree. Morocco Rabat N/A Nigeria Abuja No. Literacy rate is almost 30% lower than in Lagos. Cameroon Yaounde Yes. High literacy rates compared with the rest of the nation. Malawi Lilongwe N/A [ 29 ]
30 University Presence in Secondary Capital Cities Capital Does the Capital have the top universities in the nation? USA Washington D.C. No. None of the Top 20 are here (consistently). Canada Ottawa Limited. One of the Top 15 (U15) is here. Australia Canberra Limited. One of the Top 10 is here. New Zealand Wellington Limited. One of the Top 5 is here. Brazil Brasilia No Ecuador Quito Yes Switzerland Bern Limited. One of the Top 10 is here. Germany Berlin Yes, 2 of the Top 10 are here. Turkey Ankara Yes. 2 of the nation s best are here. Israel Jerusalem Limited. One of the top 7 universities is here. Pakistan Islamabad Yes. Some of the Top 5 are here. Morocco Rabat Yes Nigeria Abuja No Cameroon Yaounde Limited Malawi Lilongwe Yes. [ 30 ]
31 High-Tech and Innovation Presence in Secondary Capital Cities Capital Is the capital a high-tech city? A center of innovation? USA Washington D.C. Yes. A competitor alongside other U.S. tech cities with Silicon Valley. Strengths in telecommunications, satellites, cybersecurity, life sciences; defense tech. Canada Ottawa Yes, especially around the year 2000 when a number of firms became dominant, albeit briefly. At the time the city was labeled Silicon Valley of the North. Australia Canberra No New Zealand Wellington Somewhat. Houses legacy telecommunications firms; has vibrant startup community and media-tech. Brazil Brasilia No Ecuador Quito No Switzerland Bern No Germany Berlin Yes, 15% of nation s startups are here. Startup culture. Turkey Ankara Somewhat. Big tech park; telecommunications firms. Israel Jerusalem Somewhat. Recent success in vehicle-ai. Pakistan Islamabad No Morocco Rabat No Nigeria Abuja Somewhat Cameroon Yaounde No Malawi Lilongwe No [ 31 ]
32 Endnotes 1 Bureau of Economic Analysis. 2 Chmura Economics & Analytics. 3 Bureau of Economic Analysis. 4 Chmura Economics & Analytics. 5 As of Fortune 1000 companies in DC, MD, and VA are included. 6 Chmura Economics & Analytics. 7 Chmura Economics & Analytics, Fortune, U.S. News. 8 Zipf s Law is a peculiarity in mathematics that applies beautifully to cities. The number one ranked size is twice as large as the second size, which in turn is twice as large as the third size, etc. The rank vs. frequency rule applies nicely to the sizes of cities in a country. The city with the largest population in any country is generally twice as large as the nextbiggest, and so on. 9 EconomiaBolivia.net. 10 The Bern scholars work led to a book on that topic by David Kaufmann. Kaufmann, David (2018). Varieties of Capital Cities: the competitiveness challenge for secondary capitals. Cheltenham, UK: Edward Elgar Publishing. 11 These cases are complex and do not smoothly fall into some categories. For example, Jerusalem, capital of Israel, was not a formidable business center under the Ottoman empire that crumbled in In parallel, Tel Aviv was born in 1909 and rapidly became the hegemonic business city of Israel. 12 The details of each column appear in the detailed tables in Appendix D 13 Goldfarb, Dan and Andrew D huyvetter and Nobuhiko Daito. The Value of Metrorail and Virginia Railway Express to the Commonwealth of Virginia. Arlington: Northern Virginia Transportation Commission, Accessed May 14, Connect Greater Washington. Washington, D.C.: WMATA, Accessed May 14, Posting.pdf. 15 Goldfarb, Dan et. al, ibid. 16 Innovation Cities Index compiled by Australia-based 2thinknow [ 32 ]
33
TRANSIT TIMES CANNOT BE GUARANTEED
 Guide This guide is not definitive and may be subject to change. The transit times stated here are for documents. Transit times may be longer for non-document items travelling outside the EU. (Non-documents
WORLD PRESS FREEDOM INDEX 2012
 WORLD PRESS FREEDOM INDEX 2012 1 Finland -10,00 = - Norway -10,00 = 3 Estonia -9,00 - Netherlands -9,00 5 Austria -8,00 6 Iceland -7,00 - Luxembourg -7,00 8 Switzerland -6,20 9 Cape Verde -6,00 10 Canada
21st ACI AFRICA REGION ANNUAL ASSEMBLY CONFERENCE AND EXHIBITION
 21st ACI AFRICA REGION ANNUAL ASSEMBLY CONFERENCE AND EXHIBITION LIVINGSTONE, ZAMBIA 28 AUGUST 2012 Angela Gittens Director General ACI World 1 Airports Council International ACI AFRICA ACI World 577 members
Membership & Voting Strength - 1 October September 2020
 ship & Voting Strength - 1 October 2016-30 September 2020 Assessment Period - 1 October 2012-30 September 2016 Junior Team Championships Junior - Championships Junior - Championships Junior - Africa 1
Central Bank of Different Countries
 Country name Afghanistan Albania Algeria Argentina Armenia Aruba Australia Austria Azerbaijan Bahamas Bahrain Bangladesh Barbados Belarus Belgium Belize Benin Bermuda Bhutan Bolivia Bosnia Botswana Brazil
REPUBLIC OF KOREA. Table 1. FDI flows in the host economy, by geographical origin. (Millions of US dollars)
") Table 1. FDI flows in the host economy, by geographical origin World 4 130 3 395 4 383 8 980 7 050 4 950 2 629 8 409 7 501 8 117 10 247 11 117 Developed economies 3 123 2 385 2 949 7 185 5 743 3 423-275
Table 1. FDI flows in the host economy, by geographical origin World 4 130 3 395 4 383 8 980 7 050 4 950 2 629 8 409 7 501 8 117 10 247 11 117 Developed economies 3 123 2 385 2 949 7 185 5 743 3 423-275
HKS on the Road In-Person Information Sessions
 HKS on the Road 2016 In-Person Information Sessions United States San Francisco, California - January 5 New Orleans, LA - June 26 (student-led session) Detroit, MI - July 7 San Francisco, California -
REPORT ON HUMAN RESOURCES IN WHO IN THE AFRICAN REGION. Information Document CONTENTS INTRODUCTION... 1
 AFR/RC56/INF.DOC/3 12 July 2006 REGIONAL COMMITTEE FOR AFRICA ORIGINAL: ENGLISH Fifty-sixth session Addis Ababa, Ethiopia, 28 August 1 September 2006 Provisional agenda item 10.4 REPORT ON HUMAN RESOURCES
REPORT ON WHO STAFF IN THE AFRICAN REGION. Information Document CONTENTS
 10 July 2009 REGIONAL COMMITTEE FOR AFRICA ORIGINAL: ENGLISH Fifty-ninth session Kigali, Republic of Rwanda, 31 August 4 September 2009 Provisional agenda item 9.5 REPORT ON WHO STAFF IN THE AFRICAN REGION
LIST OF STATES WHICH THE LAO PDR HAS ESTABLISHED DIPLOMATIC RELATIONS SINCE 1950
 LIST OF STATES WHICH THE LAO PDR HAS ESTABLISHED DIPLOMATIC RELATIONS SINCE 1950 No Countries Capital Dated Representative Residence 1 Afghanistan Kabul AS 11.03.1983 Embassy New York 2 Albania Tirana
National Days. 1 January Cuba Liberation Day. 1 January Haiti National Day. 1 January Sudan Independence Day (1956)
") s 1 January Cuba Liberation Day 1 January Haiti 1 January Sudan (1956) 4 January Burma (Myanmar) 26 January Australia Australia Day 26 January India Republic Day (1950) 4 February Sri Lanka 6 February
s 1 January Cuba Liberation Day 1 January Haiti 1 January Sudan (1956) 4 January Burma (Myanmar) 26 January Australia Australia Day 26 January India Republic Day (1950) 4 February Sri Lanka 6 February
Country Visa required Allowed stay
 Country Allowed stay Afghanistan Albania Visa not required 90 days Algeria Andorra Angola Antigua and Barbuda Visa not required 30 days Argentina Visa not required 90 days Armenia evisa / Visa on arrival
Accounting Basis by Country
 Accounting Basis by Country Egypt Africa Northern Africa Morocco Africa Northern Africa Sudan Africa Northern Africa Western Sahara Africa Northern Africa Angola Africa Sub-Saharan Africa Benin Africa
STANDARD MULTICARRIER AWARD TICKETS
 STANDARD MULTICARRIER AWARD TICKETS The Standard Multicarrier Award Ticket allows you to reach many destinations around the world, with the possibility to book mixed itineraries combining the Alitalia
Financial Reporting Standards Adoption by Country
 Financial Reporting Standards Adoption by Country Egypt Africa Northern Africa Morocco Africa Northern Africa Sudan Africa Northern Africa Western Sahara Africa Northern Africa Angola Africa Sub-Saharan
International ISBN Agency - Range Message Printed: Apr 5, Last Change: Apr 4, 2018
 978 International ISBN Agency 0-5 600-649 7-7 80-94 950-989 9900-9989 9999 979 International ISBN Agency 10-12 978-0 English language 00-19 200-227 2280-2289 229-638 6390-6398 6399000-6399999 640-647 6480000-6489999
PART 1: EXISTING AND EVOLVING GLOBAL FARE COLLECTION INDUSTRY Introduction Transit ticketing industry 6
 Contents PART 1: EXISTING AND EVOLVING GLOBAL FARE COLLECTION INDUSTRY 1 1.1 Introduction 2 1.2 Transit ticketing industry 6 1.2.1 Overview 6 1.2.2 System components and value chain 7 1.2.3 Market size
E-Government Development Index (EGDI)
") E-Government Development Index (EGDI) 171 Afghanistan Low 0.2313 0.3043 0.1066 0.2830 82 Albania High 0.5331 0.5942 0.3530 0.6520 150 Algeria Medium 0.2999 0.0652 0.1934 0.6412 55 Andorra High 0.6302 0.5072
E-Government Development Index (EGDI) 171 Afghanistan Low 0.2313 0.3043 0.1066 0.2830 82 Albania High 0.5331 0.5942 0.3530 0.6520 150 Algeria Medium 0.2999 0.0652 0.1934 0.6412 55 Andorra High 0.6302 0.5072
RAF Country/Group Allocation Utilization Report*
 RAF Allocation Utilization Report* Country Biodiversity Summary for Biodiversity Countries with Individual Allocation Countries in Group Regional/Global Exclusion 782.650 314.448 74.807 144.300 43.334
Country (A - C) Local Number Toll-Free Premium Rates
 Local Number Toll-Free Premium Rates") Choose a number from the provided list based on the country that you re calling from. Numbers with Premium Rates are only available to Enterprise Groups that are subscribed to the BlueJeans Premium Calling
Choose a number from the provided list based on the country that you re calling from. Numbers with Premium Rates are only available to Enterprise Groups that are subscribed to the BlueJeans Premium Calling
REPORT ON WHO STAFF IN THE AFRICAN REGION. Information Document CONTENTS
 6 September 2013 REGIONAL COMMITTEE FOR AFRICA ORIGINAL: ENGLISH Sixty-third session Brazzaville, Republic of Congo, 2 6 September 2013 Agenda item 20.1 REPORT ON WHO STAFF IN THE AFRICAN REGION Information
COUNTRY & TERRITORY PROFILES A Summary of Oil Spill Response Arrangements & Resources Worldwide
 3. COUNTRY & TERRITORY PROFILES (including date of update) A Albania August 2010 Antigua January 2009 Algeria May 2011 Argentina December 2015 Angola May 2009 Aruba April 2008 Anguilla November 2005 Australia
Country (A - C) Local Number Toll-Free Premium Rates
 Local Number Toll-Free Premium Rates") Choose a number from the provided list based on the country that you re calling from. Numbers with Premium Rates are only available to Enterprise Groups that are subscribed to the BlueJeans Premium Calling
Choose a number from the provided list based on the country that you re calling from. Numbers with Premium Rates are only available to Enterprise Groups that are subscribed to the BlueJeans Premium Calling
Africa. Display Transparency 6 on the overhead. Explain to students that Africa is the
 3S 4S 1S 2S 3N 4N Banjul Bissau SIERRA LEONE 5N MADEIRA IS. CANARY IS. (SPAIN) (disputed) Dakar Freetown (PORTUGAL) GAMBIA Bamako Conakry Monrovia Rabat BURKINA FASO 1W Accra Lomé ~ Niamey BENIN Algiers
Calendar of Events. This calendar lists WBI events scheduled for the next three months. It lists events organized:
 Calendar of Events This calendar lists WBI events scheduled for the next three months. It lists events organized: - By the topic where they are to take place The following information is given for each
1. Average Gini on urban by region 2. Average Gini on cities by region. Eastern Europe & CIS (18 cities)
") 1. Average Gini on urban by region 2. Average Gini on cities by region Region total Region total gini n. gini n. (16 countries) 6 16 (26 cities) 4 26 (11 countries) 9 11 (38 cities) 0 39 (15 countries)
1. Average Gini on urban by region 2. Average Gini on cities by region Region total Region total gini n. gini n. (16 countries) 6 16 (26 cities) 4 26 (11 countries) 9 11 (38 cities) 0 39 (15 countries)
Parties to the Convention July 2018
 FOR 1 Afghanistan */ - - - - - - - - - - 2 Albania - - - - - - - - - - 3 Algeria - - - - - - - - - - 4 Andorra - - - - - - - - - - 5 Angola */ - - - - - - - - - - 6 Antigua & Barbuda - - - - - - - - -
PRIDE OF OWNERSHIP.
 CONSORTIUM OF LOCALLY OWNED PARTNERSHIPS We understand the fundamental role that pride of ownership plays in inspiring the highest work ethic, quality and professionalism. Each icore office is a locally
TURKISH CARGO NETWORK: YOUR KEY HUB TO GLOBAL SUPPLY CHAIN November 2017
 TURKISH CARGO NETWORK: YOUR KEY HUB TO GLOBAL SUPPLY CHAIN November 2017 01 Turkish Cargo Network TURKISH CARGO TIMELINE Turkish Airlines was founded in 1933. In the meantime, Turkish Airlines carried
Cargo Market & Turkish Cargo. Network & Fleet. Products Development and Future Plans
 Turkish Airlines & Turkish Cargo in Brief Cargo Market & Turkish Cargo Network & Fleet Products Development and Future Plans Turkish Airlines & Turkish Cargo in Brief Cargo Market & Turkish Cargo Network
5.3. Cannabis: Wholesale and Street Prices and Purity Levels
 5. Prices: Cannabis 5.3. Cannabis: Wholesale and Street Prices and Purity Levels HERBAL CANNABIS Africa East Africa Ghana 51.0 39.2-62.7 1999 Kenya 0.2 0.1-0.3-2002 119.8-1996 Madagascar 1.3 1.1-1.4 100.0
KINGDOM OF CAMBODIA NATION RELIGION KING 3
 KINGDOM OF CAMBODIA NATION RELIGION KING 3 TOURISM STATISTICS REPORT October 2015 MINISTRY OF TOURISM Statistics and Tourism Information Department No. A3, Street 169, Sangkat Veal Vong, Khan 7 Makara,
S/No Country Requirement 1 Afghanistan Visa required prior to travel. 2 Albania Visa for sixty days on arrival 3 Algeria Visa for two weeks on
 S/No Country Requirement 1 Afghanistan Visa required prior to travel. 2 Albania Visa for sixty days on arrival 3 Algeria Visa for two weeks on arrival 4 Andorra Visa for sixty days on arrival 5 Angola
ADCAL LABELS LTD INTERNATIONAL CARRIAGE PRICE LIST
 ADCAL LABELS LTD INTERNATIONAL CARRIAGE PRICE LIST Weight A B C D E F G H I J K L M N KG DOX/NDX DOX/NDX DOX/NDX DOX/NDX DOX/NDX DOX/NDX DOX/NDX DOX/NDX DOX/NDX DOX/NDX DOX NDX DOX NDX DOX NDX DOX NDX
WORLD HEALTH ORGANIZATION Assessed contributions overview for all Member States As at 31 May assessment (A) 31-Dec-17 (B)
 31-Dec-17 (B)") WORLD HEALTH ORGANIZATION Assessed contributions overview for all Member States As at 31 May 2018 and Associate Prior financial periods collection less rescheduled Total outstanding Balance for prior years
WORLD HEALTH ORGANIZATION Assessed contributions overview for all Member States As at 31 May 2018 and Associate Prior financial periods collection less rescheduled Total outstanding Balance for prior years
International Students Headcount & Credit Hour Enrollment Summary
 International Students & Credit Hour Enrollment Summary by Student Classification Fall & Fall // - Census - - -.%.% -.%.% Student Type: First-time First Time-PreCollege First Time-New in College First
WORLD HEALTH ORGANIZATION Assessed contributions overview for all Member States As at 31 December 2017
 WORLD HEALTH ORGANIZATION Assessed contributions overview for all Member States As at 31 December 2017 and Associate Biennial Assessment Prior financial periods collection less rescheduled Total outstanding
Programme planning levels for regular resources in 2017 (10 January 2017)
") planning for regular resources in (10 January ) In accordance with Executive Board decision 2008/15, following is the country breakdown of regular resources planning for. The planning have been computed
planning for regular resources in (10 January ) In accordance with Executive Board decision 2008/15, following is the country breakdown of regular resources planning for. The planning have been computed
KINGDOM OF CAMBODIA NATION RELIGION KING 3
 KINGDOM OF CAMBODIA NATION RELIGION KING 3 TOURISM STATISTICS REPORT March 2014 MINISTRY OF TOURISM Statistics and Tourism Information Department No. A3, Street 169, Sangkat Veal Vong, Khan 7 Makara, Phnom
KINGDOM OF CAMBODIA NATION RELIGION KING 3
 KINGDOM OF CAMBODIA NATION RELIGION KING 3 TOURISM STATISTICS REPORT September 2014 MINISTRY OF TOURISM Statistics and Tourism Information Department No. A3, Street 169, Sangkat Veal Vong, Khan 7 Makara,
KINGDOM OF CAMBODIA NATION RELIGION KING 3
 KINGDOM OF CAMBODIA NATION RELIGION KING 3 TOURISM STATISTICS REPORT June 2014 MINISTRY OF TOURISM Statistics and Tourism Information Department No. A3, Street 169, Sangkat Veal Vong, Khan 7 Makara, Phnom
Per Capita Income Guidelines for Operational Purposes
 FROM: The President May 30,2012 Per Capita Income Guidelines for Operational Purposes The per Gross National Income (GNI) guidelines covering the Civil Works Preference, IDA Eligibility, IBRD Terms and
How much will the SDGs cost and can developing countries afford them? Chris Hoy, Independent Consultant and PhD Econ. Candidate
 How much will the SDGs cost and can developing countries afford them? Chris Hoy, Independent Consultant and PhD Econ. Candidate To implement the SDGs, national governments and aid donors need to know 1.
Secretariat. United Nations ST/ADM/SER.B/755. Assessment of Member States contributions to the United Nations regular budget for the year 2009
 United Nations Secretariat Distr.: General 24 December 2008 Original: English Assessment of s contributions to the United Nations regular budget for the year 2009 Contents I. Basis of of s contributions
 10 to 24 year olds as proportion of total population in this Population aged group of countries, Region 10 to 24 years per cent Least developed countries 274,842,000 32.2 Less developed regions 1,595,761,000
TABLE A7 SEAT-BELT AND CHILD RESTRAINT LAWS, ENFORCEMENT AND WEARING RATES BY COUNTRY/AREA
 TABLE A7 SEAT-BELT AND CHILD RESTRAINT LAWS, ENFORCEMENT AND WEARING RATES BY COUNTRY/AREA Country/area Seat-belt law Effectiveness There is a The law applies of seat-belt law National seat-belt to front
COUNTRY DSA(US$) MAX RES RATE MAX TRV RATE EFFECTIVE DATE OF %
 MAX RES RATE MAX TRV RATE EFFECTIVE DATE OF %") MAXIMUM MONTHLY STIPEND RATES FOR FELLOWS AND SCHOLARS (IN U.S. DOLLARS FOR COST ESTIMATE) COUNTRY DSA(US$) MAX RES RATE MAX TRV RATE EFFECTIVE DATE OF % Afghanistan $90 $405 $608 1 March 1989 Albania
MAXIMUM MONTHLY STIPEND RATES FOR FELLOWS AND SCHOLARS (IN U.S. DOLLARS FOR COST ESTIMATE) COUNTRY DSA(US$) MAX RES RATE MAX TRV RATE EFFECTIVE DATE OF % Afghanistan $90 $405 $608 1 March 1989 Albania
Secretariat. United Nations. Status of contributions as at 31 March The Biological Weapons Convention (BWC)
") Status of contributions of BWC, CCW, CCM, OTW as at 31 March 2018 United Nations Secretariat Distr.: General 31 March 2018 Status of contributions as at 31 March 2018 The Biological Weapons Convention
Status of contributions of BWC, CCW, CCM, OTW as at 31 March 2018 United Nations Secretariat Distr.: General 31 March 2018 Status of contributions as at 31 March 2018 The Biological Weapons Convention
Secretariat. United Nations. Status of contributions as at 31 August The Biological Weapons Convention (BWC)
") Status of contributions of BWC, CCW, CCM, OTW as at 31 August 2018 United Nations Secretariat Distr.: General 31 August 2018 Status of contributions as at 31 August 2018 The Biological Weapons Convention
Status of contributions of BWC, CCW, CCM, OTW as at 31 August 2018 United Nations Secretariat Distr.: General 31 August 2018 Status of contributions as at 31 August 2018 The Biological Weapons Convention
Secretariat. United Nations. Status of contributions as at 30 September The Biological Weapons Convention (BWC)
") Status of contributions of BWC, CCW, CCM, OTW as at 30 September 2018 United Nations Secretariat Distr.: General 30 September 2018 Status of contributions as at 30 September 2018 The Biological Weapons
Status of contributions of BWC, CCW, CCM, OTW as at 30 September 2018 United Nations Secretariat Distr.: General 30 September 2018 Status of contributions as at 30 September 2018 The Biological Weapons
REPORT ON WHO STAFF IN THE AFRICAN REGION. Information Document CONTENTS
 11 July 2014 REGIONAL COMMITTEE FOR AFRICA ORIGINAL: ENGLISH Sixty-four session Cotonou, Republic of Benin, 1 5 September 2014 Provisional agenda item 18.1 REPORT ON WHO STAFF IN THE AFRICAN REGION Information
THE THIRTY-EIGHTH GENERAL ASSEMBLY: ALL VOTES ~
 II THE THIRTY-EIGHTH GENERAL ASSEMBLY: ALL VOTES ~--...-- A Note on Methodology The tables contained in this section reflect percent coincidence of countries' votes with the u.s. in the 38th UN General
- 5 - Status January 15, 2018
 - 5 - Status January 15, 2018 Date on which Latest Act 1 of the to which is party Afghanistan... May 14, 2017 Stockholm: May 14, 2017 Albania... October 4, 1995 Stockholm: October 4, 1995 Algeria... March
Appendix D2 amendments 27 November 2018:
 Appendix D2 amendments 27 November 2018: Deleted from the list of Countries and Territories Azerbaijan Burkina Faso Cuba Kazakhstan Malawi Moldova West Bank Gaza Zambia Added to the List of Countries and
Financing Sustainable Transport in LLDCs in Africa High Level Meeting October Santa Cruz, Bolivia
 Gylfi Palsson, Lead Transport Specialist and Acting Manager for the LAC Region, World Bank Financing Sustainable Transport in LLDCs in Africa High Level Meeting 13-14 October 2016 - Santa Cruz, Bolivia
APPENDIX VI - GRAPH 6.2: PRICE OF PACK OF MOST SOLD AND CHEAPEST BRANDS OF CIGARETTES IN INTERNATIONAL DOLLARS
 WHO REPORT ON THE GLOBAL TOBACCO EPIDEMIC, 2011 APPENDIX VI - GRAPH 6.2: PRICE OF PACK OF MOST SOLD AND CHEAPEST BRANDS OF CIGARETTES IN INTERNATIONAL DOLLARS Globally Africa The Americas South-East Asia
COUNTRY DSA(US$) MAX RES RATE MAX TRV RATE EFFECTIVE DATE OF %
 MAX RES RATE MAX TRV RATE EFFECTIVE DATE OF %") MAXIMUM MONTHLY STIPEND RATES FOR FELLOWS AND SCHOLARS (IN U.S. DOLLARS FOR COST ESTIMATE) COUNTRY DSA(US$) MAX RES RATE MAX TRV RATE EFFECTIVE DATE OF % * Afghanistan $90 $405 $608 1 March 1989 * Algeria
MAXIMUM MONTHLY STIPEND RATES FOR FELLOWS AND SCHOLARS (IN U.S. DOLLARS FOR COST ESTIMATE) COUNTRY DSA(US$) MAX RES RATE MAX TRV RATE EFFECTIVE DATE OF % * Afghanistan $90 $405 $608 1 March 1989 * Algeria
Secretariat. United Nations. Status of contributions as at 28 February The Biological Weapons Convention (BWC)
") Status of contributions of BWC, CCW, CCM, OTW as at 28 February 2017 United Nations Secretariat Distr.: General 28 February 2017 Status of contributions as at 28 February 2017 The Biological Weapons Convention
Status of contributions of BWC, CCW, CCM, OTW as at 28 February 2017 United Nations Secretariat Distr.: General 28 February 2017 Status of contributions as at 28 February 2017 The Biological Weapons Convention
Summer Work Travel Season Program Dates by Country
 The program dates are windows of opportunity for program participation. Within this timeframe, students are still subject to their university's official academic break schedule. Even though the window
Calls to premium rate numbers and other non-geographic numbers (which can vary over time) are not included.
 are not included.") EE PAY MONTHLY 250 UK to ROW mins & SMS Add-on Add-ons To get the Add-On below you ll have to be on a selected pay monthly 4GEE, 4GEE Essentials, 4GEE Max, EE or EE Extra plan and pass our standard credit
EE PAY MONTHLY 250 UK to ROW mins & SMS Add-on Add-ons To get the Add-On below you ll have to be on a selected pay monthly 4GEE, 4GEE Essentials, 4GEE Max, EE or EE Extra plan and pass our standard credit
Copyrights Statistics Botswana 2016
 STATISTICS BOTSWANA TOURISM STATISTICS ANNUAL REPORT 2014 Copyrights Statistics Botswana 2016 Statistics Botswana. Private Bag 0024 Botswana Tel: (267) 367 1300. Fax: (267) 395 2201.Email: info@statsbots.org.bw
ENHANCING AIR TRANSPORT CONNECTIVITY. Section 7: Taxes, Fees and Charges. Dr. Elijah Chingosho Secretary General AFRICAN AIRLINES ASSOCIATION
 ENHANCING AIR TRANSPORT CONNECTIVITY Section 7: Taxes, Fees and Charges By Dr. Elijah Chingosho Secretary General AFRICAN AIRLINES ASSOCIATION 22 SEPTEMBER 2013 Montreal, Canada INTRODUCTION On average,
FROM: The President May 27, Per Capita Income Guidelines for Operational Purposes
 FROM: The President May 27, 2014 Per Capita Income Guidelines for Operational Purposes The Gross National Income (GNI) guidelines covering the Civil Works Preference, IDA Eligibility, IBRD Terms and the
Global DNA Profiling Survey Results 2016
 Global DNA Profiling Survey Results 2016 TABLE OF CONTENTS Summary of results... 2 List of INTERPOL member countries that use DNA profiling in criminal investigations... 3 List of INTERPOL member countries
Cargo Market & Turkish Cargo. Network & Fleet. Fleet. Africa Routes. America Routes. Asia Pacific Routes. Central & Southern Europe Routes
 AGENDA 01 02 03 04 05 Turkish Cargo & Turkish Airlines in Brief Cargo Market & Turkish Cargo Network & Fleet Products Development & Future Plans Turkish Cargo Timeline Tonnage Shares Of Regions Fleet Special
Summer Work Travel Season Program Dates by Country
 The program dates are windows of opportunity for program participation. Within this timeframe, students are still subject to their university's official academic break schedule. Even though the window
FAMILY PLANNING TRENDS IN SUB SAHARAN AFRICA:
 FAMILY PLANNING TRENDS IN SUB SAHARAN AFRICA: PROGRESS, PROSPECTS AND LESSONS LEARNED Mona Sharan, Saifuddin Ahmed, John May & Agnes Soucat Background : Sub Saharan Africa Highest TFR (5.1) compared to
Africa Levant Land of Endless Opportunity. Yvon le Roux Vice President Africa and Levant
 Africa Levant Land of Endless Opportunity Yvon le Roux Vice President Africa and Levant JANUARY 2010 Egypt and Cisco Enabling Transformation A top reformer in the ease of doing business, Egypt is transforming
Summer Work Travel 2019 Season Program Dates by Country For External Use - Updated 11/13/2018
 The program dates are windows of opportunity for program participation. Within this timeframe, students are still subject to their university's official academic break schedule. Even though the window
GEF Evaluation Office MID-TERM REVIEW OF THE GEF RESOURCE ALLOCATION FRAMEWORK. Quintile Analysis
 GEF Evaluation Office MID-TERM REVIEW OF THE GEF RESOURCE ALLOCATION FRAMEWORK Quintile Analysis Statistical Annex #3, Rev.1 19 November 2008 Contents A quintile in this paper means one fifth or 20% of
Vision Atlas Global Action Plan Indicators
 John Trevelyan Spread 1 of 8 Personnel South Asia Southeast Asia, East Asia and Oceania l South Asia Bangladesh 155,257 1,193 6 8 District/City ECSAT 3 3 3 l South Asia Bhutan 744 1,553 73 11 5 83 National
MONTHLY NATURAL GAS SURVEY. November 2009
 MONTHLY NATURAL GAS SURVEY November 2009 INTERNATIONAL ENERGY AGENCY INTERNATIONAL ENERGY AGENCY Next Release: 12 March 2010 MONTHLY NATURAL GAS SURVEY - 1 CONTENTS TABLE 1 Natural Gas Balances in OECD
Intra-African Air Services Liberalization
 Intra-African Air Services Liberalization James Wiltshire Senior Economist, www.iata.org/economics To represent, lead and serve the airline industry Aviation connects African businesses to world markets
Summer Work Travel Season Program Dates by Country
 Albania 1-Jul 30-Sep 3 Months Argentina 1-Dec 1-Apr 4 Months Armenia 1-Jun 31-Aug 3 Months Australia 15-Nov 8-Mar 3.5 Months Visa Waiver Country Austria 1-Jul 30-Sep 3 Months Visa Waiver Country Azerbaijan
LIST OF COUNTRIES. DAILY FLAT-RATE ALLOWANCES for short-term missions (as from ) Daily flat-rate allowances ( )
 Daily flat-rate allowances ( )") LIST OF COUNTRIES DAILY FLAT-RATE ALLOWANCES for short-term missions (as from 2017.10.01) COUNTRIES CITIES Daily flat-rate allowances ( ) AFGHANISTAN All destinations 50.00 ALBANIA All destinations 40.00
LIST OF COUNTRIES DAILY FLAT-RATE ALLOWANCES for short-term missions (as from 2017.10.01) COUNTRIES CITIES Daily flat-rate allowances ( ) AFGHANISTAN All destinations 50.00 ALBANIA All destinations 40.00
LIST OF COUNTRIES. DAILY FLAT-RATE ALLOWANCES for long-term missions (as from ) Daily flat-rate allowances ( )
 Daily flat-rate allowances ( )") LIST OF COUNTRIES DAILY FLAT-RATE ALLOWANCES for long-term missions (as from 2017.10.01) COUNTRIES CITIES Daily flat-rate allowances ( ) AFGHANISTAN All destinations 30.00 ALBANIA All destinations 24.00
LIST OF COUNTRIES DAILY FLAT-RATE ALLOWANCES for long-term missions (as from 2017.10.01) COUNTRIES CITIES Daily flat-rate allowances ( ) AFGHANISTAN All destinations 30.00 ALBANIA All destinations 24.00
Composition of the staff of the Office of the United Nations High Commissioner for Human Rights
 United Nations General Assembly Distr.: General 25 January 2013 Original: English A/HRC/22/69 Human Rights Council Twenty-second session Agenda item 2 Annual report of the United Nations High Commissioner
QRC RICE INSPECTION CELL KARACHI,LAHORE,QUETTA & TCP COUNTRY WISE POSITION OF EXPORT OF BASMATI RICE JULY, 2014 TO JUNE, 2015
 QRC RICE INSPECTION CELL KARACHI,LAHORE,QUETTA & TCP COUNTRY WISE POSITION OF EXPORT OF BASMATI RICE JULY, 2014 TO JUNE, 2015 NAME OF SUPER BASMATI PARBOILED RICE BASMATI RICE BROWN RICE FOB PER COUNTRY
Visa Requirements for Jamaicans Traveling Overseas
 Visa Requirements for Jamaicans Traveling Overseas and Foreigners Entering Jamaica (PTA- Prior To Arrival / POE Port Of Entry) COUNTRY AFGHANISTAN ALBANIA ALGERIA ANDORRA ANGOLA ANTIGUA & BARBUDA (commonwealth)
Air Transportation Management, M.Sc. Programme. Air Law, Regulation and Compliance Management. Liberalisation, Open Skies, and Beyond Open Skies
 Air Transportation Management, M.Sc. Programme Air Law, Regulation and Compliance Management Course material: Liberalisation, Open Skies, and Beyond Open Skies Modules 19 to 21 Excerpt from: U.S. Department
Table S6: Total researchers and researchers per million inhabitants,
 Table S6: and researchers per, 2009 and 2013 Researchers in full time equivalents North America Canada 150 220 4 451 156 550-1 4 494-1 United States of America 1 250 984 r 4 042 r 1 265 064-1,r 3 984-1,r
Secretariat. United Nations. Status of contributions as at 30 June The Biological Weapons Convention (BWC)
") Status of contributions of BWC, CCW, CCM, OTW as at 30 June 2018 United Nations Secretariat Distr.: General 30 June 2018 Status of contributions as at 30 June 2018 The Biological Weapons Convention (BWC)
Status of contributions of BWC, CCW, CCM, OTW as at 30 June 2018 United Nations Secretariat Distr.: General 30 June 2018 Status of contributions as at 30 June 2018 The Biological Weapons Convention (BWC)
Travelling to Liverpool
 Travelling to Liverpool 2 International Airports within 45 minutes of Liverpool City Centre Travelling by Air Liverpool and Manchester Airports provide a combined 4,175 flights per week by 77 airlines.
The World Pasta Industry in 2011
 The World Pasta Industry in 2011 Survey The World Pasta Industry in 2011 25 October 2012 1 Like every year, we have completed our Annual Survey on the World Pasta Industry. We would like to thank all the
THE AFRICAN DEVELOPMENT BANK GROUP. At the centre of Africa s transformation
 THE AFRICAN DEVELOPMENT BANK GROUP At the centre of Africa s transformation African Development Bank Group At the centre of Africa s transformation The African Development Bank Group is a multilateral
Exports of Canadian Grain and Wheat Flour
 Canadian Grain Commission Commission canadienne des grain APRIL CROP YEAR - Exports of Canadian Grain and Wheat Flour 2005- - date Tonnes (millions) 14.0 12.0 10.0 8.0 6.0 4.0 2.0 0.0 5.0 4.5 4.0 3.5 3.0
Let s Work: Value Chain Based Job Creation. Study Design Report. Volume 1 Annex: Background and Market Trends
 Volume 1 Annex: Background and Market Trends Prepared for More & Better Jobs in Mozambique Prepared by Global Development Solutions, LLC May 2016 All Rights Reserved Global Development Solutions, LLC 11921
ARTIGIANO IN FIERA Key Points
 ARTIGIANO IN FIERA 2016 Key Points THE FAIR Analysis and figures THE LARGEST TRADE FAIR (B2C) IN THE WORLD Key Points AF 2016 The fair 3 9 HALLS: THE INTERNATIONAL CRAFTS SELLING EXHIBITION Key Points
THE AFRICAN DEVELOPMENT BANK GROUP. At the centre of Africa s transformation
 THE AFRICAN DEVELOPMENT BANK GROUP At the centre of Africa s transformation African Development Bank Group The African Development Bank Group is a multilateral development finance institution. It was established
TABLE A5 DRINKING AND DRIVING LAWS, ENFORCEMENT AND ROAD TRAFFIC DEATHS ATTRIBUTED TO ALCOHOL BY COUNTRY/AREA
 TABLE A5 DRINKING AND DRIVING LAWS, ENFORCEMENT AND ROAD TRAFFIC DEATHS ATTRIBUTED TO ALCOHOL BY COUNTRY/AREA Country/area drink driving law Drink driving is defined by BAC or equivalent BrAC For the general
Table 9D: Consolidated foreign claims of reporting banks - ultimate risk basis
 Table 9D: Consolidated foreign claims of reporting banks - ultimate risk basis On individual countries by nationality of reporting banks / Amounts outstanding In millions of US dollars Total of 24 European
FINLAND. Table 1. FDI flows in the host economy, by geographical origin. (Millions of US dollars)
") Table 1. FDI flows in the host economy, by geographical origin World 3 732 8 046 3 319 2 823 4 750 7 652 12 451-1 144 718 7 359 2 550 4 158 Developed economies 3 638 8 003 2 382 2 863 4 934 7 258 12 450-855
Table 1. FDI flows in the host economy, by geographical origin World 3 732 8 046 3 319 2 823 4 750 7 652 12 451-1 144 718 7 359 2 550 4 158 Developed economies 3 638 8 003 2 382 2 863 4 934 7 258 12 450-855
DAILY FLAT-RATE ALLOWANCES for long missions (from )
") LIST OF COUNTRIES DAILY FLAT-RATE ALLOWANCES for long missions (from 01.04.2015) COUNTRIES CITIES Daily flat-rate allowances ( ) AFGHANISTAN All destinations 43.00 ALBANIA All destinations 58.00 ALGERIA
LIST OF COUNTRIES DAILY FLAT-RATE ALLOWANCES for long missions (from 01.04.2015) COUNTRIES CITIES Daily flat-rate allowances ( ) AFGHANISTAN All destinations 43.00 ALBANIA All destinations 58.00 ALGERIA
Yoram Shiftan Transportation Research Institute, Technion - Israel Institute of Technology. Brno May 2016
 Yoram Shiftan Transportation Research Institute, Technion - Israel Institute of Technology Brno May 2016 Improving accessibility of non auto modes public transportation Auto restrain policies (parking
Pistachio Industry Inventory Shipment Report Pounds Crop Year
 Pistachio Industry Inventory Shipment Report Pounds March 2017 Year to Date Summary - Pounds 2016-2017 Crop Year Open Inshell AO Closed Shell Shelling Stock Total 8/31/16 Carryover 46,956,408 41,224,713
IMD World Talent Report Factor 1 : Investment and Development
 THAILAND 2012 2013 2014 2015 2016 Overall Investment & Development Appeal Rank 2016 37 42 24 Readiness 49 of 61 Factor 1 : Investment and Development Total Public Expenditure on Education Percentage of
PROTOCOL RELATING TO AN AMENDMENT TO THE CONVENTION ON INTERNATIONAL CIVIL AVIATION ARTICLE 83 bis, SIGNED AT MONTREAL ON 6 OCTOBER Parties.
 PROTOCOL RELATING TO AN AMENDMENT TO THE CONVENTION ON INTERNATIONAL CIVIL AVIATION ARTICLE 83 bis, SIGNED AT MONTREAL ON 6 OCTOBER 1980 Entry into force: The Protocol entered into force on 20 June 1997.
1. ENTRY VISA REQUIREMENTS FOR INTERNATIONAL ORGANISATIONS PERSONNEL ACCREDITED TO ZAMBIA
 The Period of stay in Zambia shall be determined by an Immigration Officer at the port of entry. The validity of the visa is NOT the period in which the holder is entitled to remain in the country but
HOTEL ADDRESS ROOM RATE. Boulevard Hassan II, Cocody Tel :
 HOTEL RESERVATIONS The host country has kindly arranged preferential rates at the following hotels in Abidjan. Delegates are respectfully requested to make their own hotel reservations directly and to
Annual Average ODA for Water, by Country, 1990 to 2004 (Total and Per Capita)
") D A T A T A B L E 6 Annual Average, by Country, 1990 to 2004 (Total and Per Capita) Description The annual is listed here, by countries receiving such assistance, averaged from 1990 to 2004 (in 2003 constant
D A T A T A B L E 6 Annual Average, by Country, 1990 to 2004 (Total and Per Capita) Description The annual is listed here, by countries receiving such assistance, averaged from 1990 to 2004 (in 2003 constant