The 11 th Annual JP Morgan Asia Pacific Conference, New York
|
|
|
- Percival Hodges
- 5 years ago
- Views:
Transcription

1 The 11 th Annual JP Morgan Asia Pacific Conference, New York Kirby Adams, Managing Director and Chief Executive Officer 25 to 27 September 2006 ASX Code: BSL
2 Important notice THIS PRESENTATION IS NOT AND DOES NOT FORM PART OF ANY OFFER, INVITATION OR RECOMMENDATION IN RESPECT OF SECURITIES. ANY DECISION TO BUY OR SELL BLUESCOPE STEEL LIMITED SECURITIES OR OTHER PRODUCTS SHOULD BE MADE ONLY AFTER SEEKING APPROPRIATE FINANCIAL ADVICE. RELIANCE SHOULD NOT BE PLACED ON INFORMATION OR OPINIONS CONTAINED IN THIS PRESENTATION AND, SUBJECT ONLY TO ANY LEGAL OBLIGATION TO DO SO, BLUESCOPE STEEL DOES NOT ACCEPT ANY OBLIGATION TO CORRECT OR UPDATE THEM. THIS PRESENTATION DOES NOT TAKE INTO CONSIDERATION THE INVESTMENT OBJECTIVES, FINANCIAL SITUATION OR PARTICULAR NEEDS OF ANY PARTICULAR INVESTOR. TO THE FULLEST EXTENT PERMITTED BY LAW, BLUESCOPE STEEL AND ITS AFFILIATES AND THEIR RESPECTIVE OFFICERS, DIRECTORS, EMPLOYEES AND AGENTS, ACCEPT NO RESPONSIBILITY FOR ANY INFORMATION PROVIDED IN THIS PRESENTATION, INCLUDING ANY FORWARD LOOKING INFORMATION, AND DISCLAIM ANY LIABILITY WHATSOEVER (INCLUDING FOR NEGLIGENCE) FOR ANY LOSS HOWSOEVER ARISING FROM ANY USE OF THIS PRESENTATION OR RELIANCE ON ANYTHING CONTAINED IN OR OMITTED FROM IT OR OTHERWISE ARISING IN CONNECTION WITH THIS. Page 2

3 Introduction Page 3
4 Our Bond what we value Our customers are our partners Our people are our strength Our shareholders are our foundations Our communities are our homes Page 4
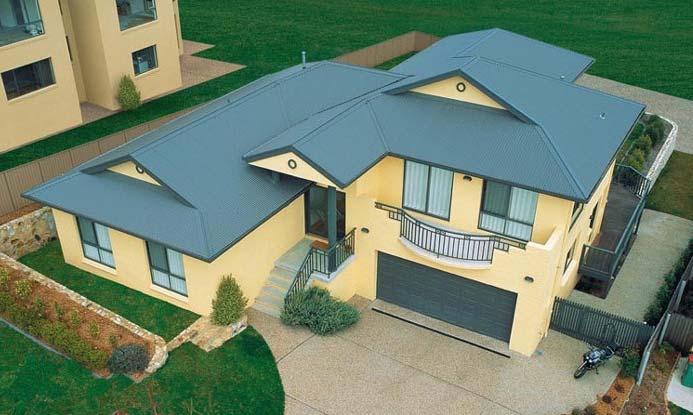
5 Our customers serving them in over 20 countries Over 30,000 customers using BlueScope Steel products with confidence Americas 20% Exports 40% Europe / Africa 6% Geographic markets (tonnes by destination) FY2006 North America- NSBSS + C&BPNA 15% Asia 14% Asia 9% Australia 32% New Zealand / Pacific 4% Painted 13% Global Product Mix ($ Revenue) FY2006 PEB/Roll formed 27% Metal Coated 20% Slab 8% CRC 3% Plate 5% HRC 24% PRODUCT OFFER Services Solutions Technical support Warranty Just In Time Delivery Transport & Logistics Design / Build / Install Information systems - web based - connectivity million tonnes Indicative Page 5
6 Our employees - zero harm is our goal for our team and communities Lost Time Injury Frequency Rate Medically Treated Injury Frequency Rate Lost time injuries per million man-hours worked Reported performance for IISI member companies Medically treated injuries per million man-hours worked Includes Contractor performance from 1996 Includes Butler performance from May 2004 Includes Contractor performance from 2004 Includes Butler performance from May ,000 Employees, 91 manufacturing sites, 17 countries Page 6
7 Our shareholders - continuing to reward our shareholders as we grow Share Buybacks Public listing to 30 June 2006 Purchased and cancelled 116m shares on market 90m shares off market 26m shares Shares on issue 699 million Dividend reinvestment scheme Effective from and including final FY2006 ordinary dividend Total return to shareholders since BSL s public listing (July 2002): Share buybacks $ 707m 30% Dividends paid $ 1,109m Final dividend 54% (to be paid 24 Oct 06) $ 168m $ 1,984m 84% $2.67 share or 84% payout ratio (NPAT) Dividends All fully franked (ordinary / special) Cents Per Share / / / / FY2003-1H FY2003-2H FY2004-1H FY2004-2H FY2005-1H FY2005-2H FY2006-1H FY2006-2H Interim Final Special Page 7
8 Our communities the world s largest and fastest growing construction markets with over 3 billion people Asia 20 Roll forming 5 sites India (50:50 JV with Tata Steel) MC 250kt (100%) Painting 150kt (100%) 2 Roll forming sites 1 Butler PEB Thailand Cold Rolling 300kt Metal Coating 375kt Painting 90kt Malaysia Metal Coating 160kt Painting 70kt Australia 7 Service Centres 31 Lysaght Sites 7 BlueScope Water Indonesia Metal Coating 100kt Painting42kt Western Port Hot Rolling 1.43mt Cold Rolling 1.0mt MC (3 lines) 830kt + Painting (2 lines) 330kt + * To be reallocated when business closed China MC 250kt Painting 150kt 3 Butler PEB Vietnam MC 125kt Painting 50kt Brisbane Painting 90kt Sydney Paint Line (1 line) 120 kt Coated and Building Products North America North Star JV Hot Rolling 1.80mt (100%) Castrip JV Port Kembla / Springhill Raw Steel 5.1mt Hot Rolling 2.4mt +400kt Plate 360kt Cold Rolling 930kt [Tinplate/Black plate 450kt*] MC (3 lines) 750kt + PL (2 lines) 207kt + New Zealand / Pacific Iron sand Mining Raw Steel 625kt Hot Rolling 750kt Cold Rolling360kt Metal Coating 230kt + Painting 60kt Hollow Sections 45kt Pacific Roll forming sites 4 Page 8
 0.9 6.6 Cost curve (HRC) - PKSW & NZS - lowest quartile - NS - most efficient EAF Turnover (FY2006) - PKSW A$3,472m - North Star BlueScope (50%) A$712m Performance FY2006 vs.")
9 Upstream steel making Capability Products Statistics Port Kembla Steelworks NSW, Australia New Zealand Steel North Star BlueScope Ohio, USA Slab Hot Rolled Coil Plate Raw steel capacity (mtpa) - PKSW NZS NS (50%) Cost curve (HRC) - PKSW & NZS - lowest quartile - NS - most efficient EAF Turnover (FY2006) - PKSW A$3,472m - North Star BlueScope (50%) A$712m Performance FY2006 vs. FY PKSW higher raw material costs and lower steel prices - NZ lower raw materials but lower prices - North Star BlueScope lower spread Markets - Australia, NZ, Americas and Asia Operations - excellent performance apart from New Zealand Page 9
 -Indonesia - Malaysia - Thailand - Vietnam - China Research & Development Technical Support COLORBOND ZINCALUME CLEAN COLORBOND GALVASPAN Capacity (ktpa) growing Asia FY06 FY07 FY09 -")

10 Midstream cold rolled, metallic coating and painting network Capability Products Statistics Australia: - Western Port, Vic - Illawarra Coated Products, NSW - Queensland - Sydney New Zealand Asia: - India JV (Tata) -Indonesia - Malaysia - Thailand - Vietnam - China Research & Development Technical Support COLORBOND ZINCALUME CLEAN COLORBOND GALVASPAN Capacity (ktpa) growing Asia FY06 FY07 FY09 - Cold Rolled Coil Metallic Coating Painting Australia - Cold Rolled Coil 1,930 1,930 1, Metallic Coating 1,580 1,580 1, Painting NZ - Cold Rolled Coil Metallic Coating Painting Feed source of Hot Rolled Coil and Cold Rolled Coil - Asia local suppliers and internal - Australia & NZ internal Customers - Principally construction, manufacturing & auto Markets - In market local supplier - + exports Page 10
 BlueScope Water Market leader in - Australia -")
 Feed - Australia - internal - Asia - internal - NZ internal - NA external / internal Customers - Principally")
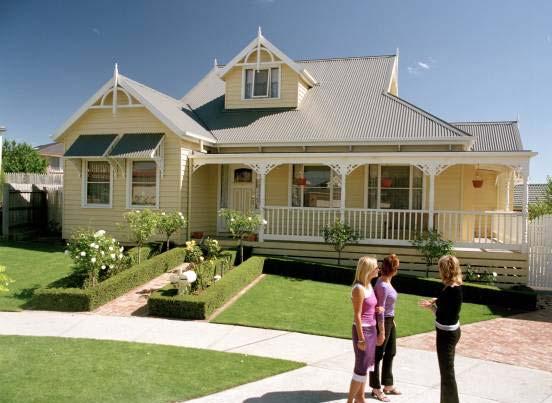
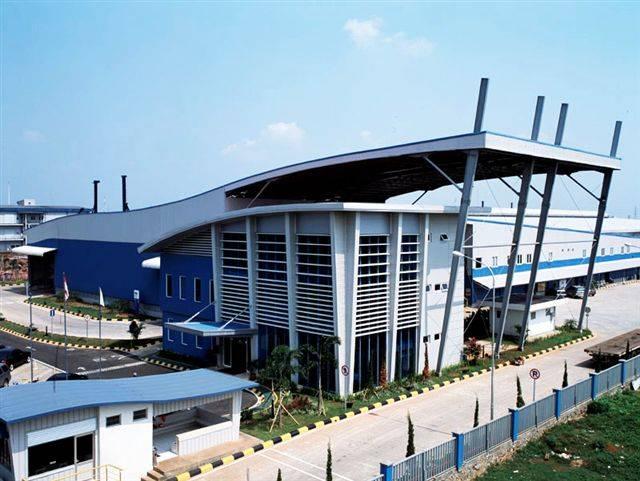
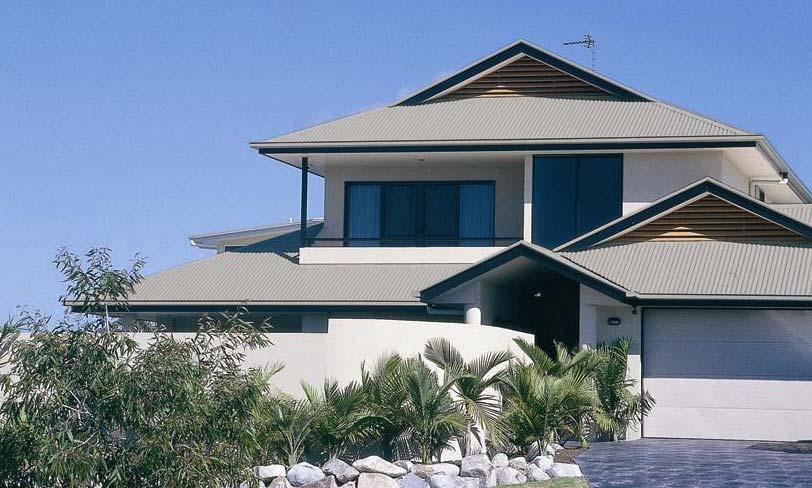
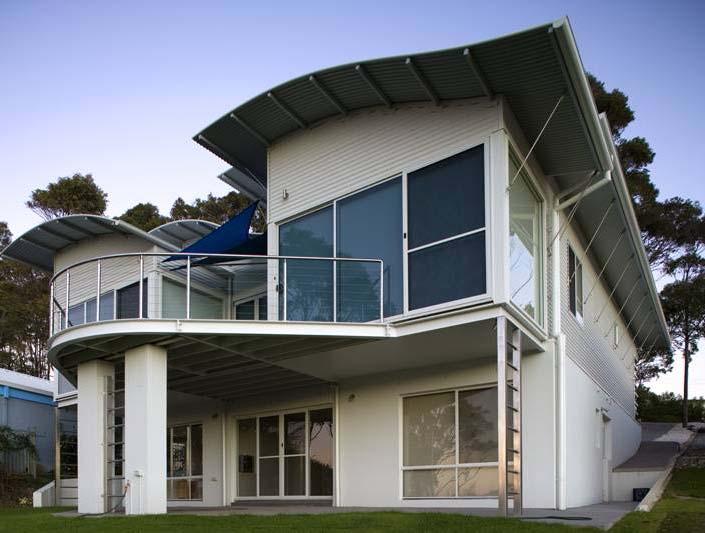
11 Downstream - metal building products and solutions Capability Products Statistics Australia New Zealand & Pacific Asia North America Lysaght roll formed steel components Butler Pre-Engineered Buildings (PEB) BlueScope Water Market leader in - Australia - China - South East Asia - and No. 2 in USA (PEB) Feed - Australia - internal - Asia - internal - NZ internal - NA external / internal Customers - Principally construction sector Markets - In market local supplier - Branded products - Supply, install and fix Page 11
12 Our strategy remains unchanged and is focused on growing value and diversification and a more stable revenue / earnings profile GROWTH PROJECTS FY2006 Completed FY2007 FY2008 Downstream Asia India - start-up PEB and Lysaght facilities at Pune China Guangzhou buildings start-up USA Successful turnaround of Tennessee facility. Vistawall expansion Asia Thailand start up PEB facility (1Q) India start up Lysaght facility at Chennai & New Delhi (2Q) China new panels, residential plants & new beam facility Midstream Asia Thailand start-up second metal coating line (MCL2) ramp up CRC Vietnam start-up metal coating (MCL) and paint line (PL) China start-up paint line (PL) Asia Thailand MCL2 & CRC Ramp up Vietnam MCL & PL ramp up China start up MCL (1Q), ramp up MCL & PL Australia Sydney Colorbond plant start up (2H) Asia India new MCL & PL construction Indonesia MCL2 & PL2 (project deferred) Upstream USA North Star BlueScope best ever operating performance Australia 400kt HSM expansion at PKSW Start-up 1Q New Zealand Front end study USA North Star BlueScope new bag house Australia BF No 5 reline (TBA FY2008 or FY2009) MCL: Metallic Coating Line PL: Paint Line Page 12
13 Global group revenue sales mix growing downstream quadruples in size FY2003 FY2006 Downstream A$589M A$2,366M +300% Midstream A$3,026M A$3,383M +12% Upstream A$3,346M A$4,321M +29% Less internal / other Total revenue (A$1,689M) A$5,272M (A$2,057M) A$8,013M +52% Page 13
14 Pricing over the cycle Indicative Selling Price $ PEB Paint ZAL Galv CRC HRC Slab Time Page 14
15 Acquisition of stake in Smorgon Steel The Global steel industry is consolidating and BlueScope Steel has repeatedly stated the existing Australian structure works effectively and that we would not initiate a change A change is now occurring Smorgon Steel has indicated a preparedness to sell and break-up its business The proposed merger of OneSteel and Smorgon Steel, in its current form, is not in the interests of BlueScope Steel s shareholders BlueScope Steel has acquired approximately 19.9% of the outstanding shares in Smorgon Steel at an average price of $1.77 per share at a total cost of approximately $320m A revised Scheme of Arrangement may represent an opportunity for BlueScope Steel to acquire businesses which: fit our strategy and portfolio of businesses add value to commodity HRC and other flat steel products, and provide improved channels to market BlueScope Steel has no intention to acquire further Smorgon Steel shares, but reserves the right to do so in different circumstances Page 15

16 FY2006 In review Page 16
17 Group financial headlines FY2006 vs. FY2005 Revenue A$8,031 million Up 1% External despatches 7.5 million metric tonnes Up 5% EBITDA A$850 million Down 49% EBIT A$556 million Down 59% NPAT A$338 million Down 66% EPS Reported 48 Down from 134 Before June 06 one-off restructuring 67 Down from 134 Underlying operational EPS 80 Down from 154 After tax Return on Invested Capital 8.5% Down from 26% After tax Return on Equity 10.4% Down from 31% Net operating Cashflow before capex $803 million Down 35% after capex / investments $10 million Down 98% Dividend final ordinary 24 per share Constant full year 44 per share Up 5% (fully franked) Gearing (net debt) 38% 33% (Dec 05) including SOR Page 17
18 Underlying FY06 BSL financial performance EBIT A$m June 06 restructuring includes: A$m - PP impairment and closure costs Staff and executive restructuring 32 - Taiwan closure 8 - CPL7 closure 13 - Rail operation outsourcing 9 -Other Other unusual and one-off adjustments include: Reported Results June 06 Restructuring Results B4 Restructure Costs Other One-off & unusual Underlying Results NPAT EPS Business development and pre-operating costs 40 - Western Port fire 40 - Losses from Packaging Products and Taiwan business to be closed 43 - Asset sales (Myaree & Galesburg) (14) -Other Total 300 Page 18


 o Delta, Ohio Pre-eminent global designer / supplier")
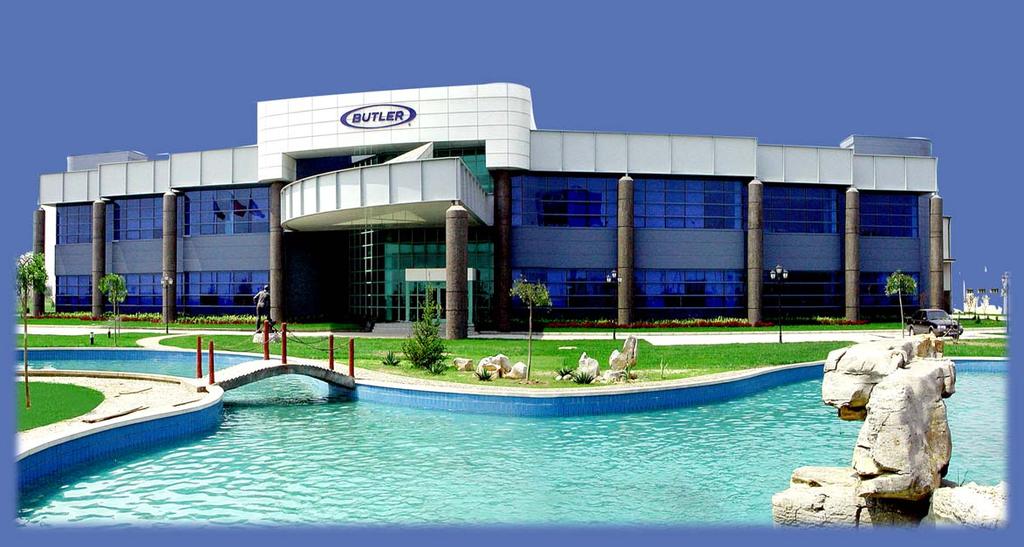
19 New reporting business segments Corporate / Group Australia New Zealand Asia North America Hot Rolled Products Australia Coated & Building Products Australia New Zealand & Pacific Steel Products Coated & Building Products Asia Hot Rolled Products North America Coated & Building Products North America Lowest quartile producer Leading supplier of flat steel in Australia Global scale o Port Kembla Steelworks Largest supplier of metallic coated and painted steel in Australia Leading market shares in most key products o Western Port o Springhill o Lysaght Australia o Service Centres Only fully integrated flat steel maker in New Zealand Leading domestic market share of flat products o Pacific Islands o Glenbrook, NZ Pre-eminent seller of branded steel in Asia Lower cost backward integration growth strategy o Indonesian, Malaysian, Thailand and Vietnamese operations o Lysaght Asia o China, including Butler o India Tata BlueScope JV 50:50 joint venture with Cargill Inc. Again voted no. 1 flat rolled steel supplier in North America (Jacobson Survey) o Delta, Ohio Pre-eminent global designer / supplier Pre-engineered buildings No 2 position in North America and no. 1 in China o Butler buildings o Vistawall Page 19
20 EBIT A$ Millions EBIT variance FY2005 to FY2006 by reporting business segment ,358 Net Price (506) 1200 Net raw materials (286) (693) (15) (84) (84) (11) FY 2005 EBIT movements Hot Rolled Products Australia Coated & Building Products Australia New Zealand & Pacific Steel Products Coated & Building Products Asia Hot Rolled Products North America Coated & Building Products North America Corporate & Group FY 2006 From (FY2005) $1,149M $(183M) $189M $83M $199M $(18M) $(61M) To (FY2006) $456M $(198M) $105M $(1M) $188M $27M $(21M) Issues Iron Ore + Coal costs Steel prices down WP fire Zn & AL Tin mill performance Reliability Production NZ market Stocks Growth Taiwan Scrap spread Production record Restructured Jackson fixed Margin growth Lower profit in inventory Page 20
21 EBIT A$ Millions Hot Rolled Products Australia (PKSW) higher raw material costs and lower prices FY2006 vs. FY2005 Sales revenue down 7% to A$3,472m EBIT down 60% to A$456m FY2006 return on net assets (pre-tax) 24% , (286) (446) (25) (60) (30) 0 FY June 03 FY June 04 FY June 05 Raw Material Costs Export Prices (Slab, HRC) Domestic Prices (HRC, Plate) Volume Mix Conversion & Oth Costs Other FY2006 Pre One-offs One-offs FY June 06 FY2006 vs. FY Lower steel prices - Higher coal and iron ore prices - Unfavourable sales mix - Lower domestic pipe and tube sales - Annual production records, incl m slab - Successful cost reduction programme Page 21
22 Hot Rolled Products Australia markets and business improvement initiatives Lower conversion costs $ of day S&A Conversion Costs Despatch & Freight Raw Materials Markets Slab - Global demand and prices stronger in Q4 HRC - Tight global market and stronger prices in Q4 Plate - Domestic demand stronger, but domestic sales down due to: - offshore fabrication - lower priced imports - project deferral Business improvement initiatives No5 Blast Furnace Reline Work continues in FY2007 to prepare for the planned reline late CY2007. Spent $56M to 30/06/06 Restructuring program Significant cost savings will be realised following implementation of the recent announcements in staff and management positions. Sinter Plant Upgrade Feasibility work is well advanced to expand capacity of the sinter plant. Additional high grade sinter will reduce the cost of raw material feed. Supply Chain Velocity Work has commenced on initiatives to further lower working capital. Continued conversion cost focus Targeted programs to further reduce cost base. Page 22
23 EBIT A$ Millions Coated and Building Products Australia (excluding Packaging Products) another difficult year (35) (18) (18) (3) (89) FY June 03 FY June 04 FY June 05 Export Prices Domestic Prices Mix Conversion & Oth Costs (67) Raw Materials - Zinc & Aluminium Raw Materials - Steel / Other Other FY2006 Pre One-offs One-offs FY June 06 FY2006 vs. FY2005 Lower export prices and steel input costs reflecting lower average global steel prices Total despatch volumes consistent with last year, but shift to export (record despatches in Q4) Significant increase in zinc and aluminium costs (mainly H2) Conversion costs mainly Western Port HSM fire Improved domestic pricing in building market One-offs reflect restructuring, including exiting Solid Block Painting Page 23
24 EBIT A$ Millions Coated and Building Products Australia Packaging Products Closure of tin mill announced 29 June 0 FY June 03 FY June 04 FY June 05 Prices Volume Conversion & Oth Costs Other FY2006 Pre One-offs One-offs FY June (41) (45) (185) (31) (11) (172) (23) (195) -250 FY2006 vs. FY2005 Significant impairment and restructuring in both years - $120M in 2006, $97M in 2005 Improved domestic pricing, but lower domestic volumes and No. 2 Electrolytic Tinning Line closure affect conversion costs Closure Decision on 29 June to exit tinplating business Timing to follow discussions with customers Approx 250 positions redundant Pickle line and cold mill to continue Page 24
25 EBIT A$ Millions New Zealand and Pacific Steel Products second best year FY2006 vs. FY2005 Sales revenue down 5% to A$709m EBIT down 44% to A$105m second best year ever FY2006 return on net assets (pre-tax) 32% $189m ($28m) ($12m) ($30m) $3m $105m $49m $62m ($17m) FY June 03 FY June 04 FY June 05 Prices Volume Conversion & Oth Costs Raw Material Costs Other FY June 06 FY2006 vs. FY2005 Softer NZ residential market Lower steel prices and volumes in export markets Higher electricity costs due to drought Lower vanadium sales prices Production issues Higher zinc and aluminium costs Page 25
26 EBIT A$ Millions Coated and Building Products Asia it is time to deliver FY2006 vs. FY2005 Sales revenue up 5% to A$1,075m, including A$227m from BlueScope Butler China EBIT down 101% to (A$1m) FY2006 return on net assets annualised (pre-tax) 0% EBIT variance analysis Main variances Lower sales prices across Asia Higher unit costs from ramp-up of new facilities (Thailand, Vietnam & China) Higher zinc and aluminium costs Taiwan performance and closure Partly offset lower HRC & CRC feed costs (41) (3) (2) 0-20 (46) FY June 03 FY June 04 FY June 05 Prices Volume / Mix Conversion & Oth Costs Raw Material Costs Other FY2006 Pre One-offs (26) (1) One-offs FY June 06 Page 26
27 Our Asian Coating / Painting / Roll-Forming / PEB Capacity to double by FY2009 (k tonnes) FY2006 FY2007 FY2008 FY2009 Metal coating By Region X 2 X 2.4 Painting 420 Page 27
28 EBIT A$ Millions Hot Rolled Products North America another excellent year New reporting segment comprising: North Star BlueScope Steel (50% interest) Castrip LLC and North American and European sales offices FY2006 vs. FY2005 EBIT variance analysis (25) 188 FY2006 vs. FY2005 (North Star BlueScope 50% only) Sales revenue down 7% to A$712m EBIT down 13% to A$169m lower scrap / HRC spread FY2006 return on net assets (pretax) 63% Other headlines (North Star BlueScope Steel) Record annual production and despatches of 1.9mt (100%) Paid dividends to BSL of A$168m in FY FY June 03 FY June 04 FY June 05 Trading offices North Star FY June 06 Page 28
29 EBIT A$ Millions Coated and Building Products North America acquisition turnaround Comprises: Butler buildings Vistawall FY2006 vs FY2005 EBIT variance (19) (28) (18) 5 FY June 03 FY June 04 FY June 05 Volume Net Price Raw Materials Conversion & Other Costs (9) Performance FY2006 vs. FY2005 Buildings Increased despatches Higher transition costs associated with closing Galesburg and opening new Tennessee plant Vistawall Higher sales Partly offset by higher aluminium and energy costs 27 FY June 06 Sales revenue up 7% to A$1,213m EBIT to A$27m (turnaround) FY2006 return on net assets (pre-tax) 12% Page 29
30 Balance sheet BlueScope to focus on working capital As at A$ Millions 30 June December 2005 Assets Cash Receivables 1,344 1,081 Inventory 1,329 1,439 Other Assets Net Fixed Assets 3,743 3,592 Total Assets 7,261 6,923 Liabilities Creditors Interest Bearing Liabilities 1,952 1,709 Provisions & other Liabilities 1,265 1,207 Total Liabilities 4,176 3,644 Net Assets 3,085 3,279 Net Debt / (Net Debt + Equity) 38.0% 33.2% Page 30
31 Cash - $551 million to shareholders and $816 million in capex A$ millions 2002 (1) H H 2006 Cash from operations 795 1,012 1, Working Capital Movement (31) (94) (432) (222) 122 (100) Net operating cashflow before borrowing costs and income tax , Net investing cashflows - Capital expenditure & Investments - Other (162) 8 (209) 44 (585) 7 (663) 41 (381) 15 (435) 8 (816) 23 Net cashflow before financing & tax (19) Net financing cashflow (468) Payment of income tax (29) (119) (312) (240) (116) (356) Share buy-back (26) (259) (327) (74) (21) (95) Dividends - ordinary (75) (191) (273) (174) (140) (314) - special - (53) (75) (142) - (142) Net increase in cash held 1 27 (22) (7) (18) (25) (1) 2002 normalised. (2) All periods normalised to reflect sale of receivables program cash flow movements as debt. Page 31
32 Global steel industry currently squeezed by China s increased steel making capacity and higher raw material costs Million tonnes China Crude Steel Production Sources: IISI, BSL Research $700 Asian HRC Benchmark Price SBB HRC East Asia Import CFR 70 JSM Benchmark Prices, Lump Iron Ore ( ) $ $ US$/mt $400 $ $ $100 Source: Steel Business Briefing $0 Jan-00 Jul-00 Jan-01 Jul-01 Jan-02 Jul-02 Jan-03 Jul-03 Jan-04 Jul-04 Jan-05 Jul-05 Jan-06 Jul US$ / DMT. Lump trend indicative of all iron ore types. Source: CRU Page 32
33 Million Tonnes World crude steel production to 2005 China driving growth Compound Annual Growth Rates 2.8% % 3.1% China: 9.1% % USSR: -4.1% World Excluding USSR: 1.1% World Excluding China: 1.2% ( ) Japan: 6.9% World Excluding Japan: 1.8% ( ) 200 ( ) Source: IISI, BSL Page 33
34 Global steel industry consolidation into mega companies mt GAP ,000 80,000 70,000 60,000 50,000 40,000 30,000 20,000 10,000 0 Page 34 Arcelor + Mittal POSCO JFE Nippon Steel Baosteel US Steel Nucor Corus Severstal Thyssen Krupp Evraz Gerdau Wuhan ChinaSteel Maanshan BlueScope CSN SSAB Tata Steel Base Production (Mt) Revenue (US$m)
35 Global steel industry our long term view has not changed Current industry issues: China s capacity growth / fragmentation Higher raw material costs Higher energy and other costs (coating metals) Increased volatility Steel availability Non-China steel world Continued production and capex discipline Continuing industry consolidation India growing steel requirements (3-5 years) Likely industry outcomes long term: China steel reform initiatives taken / exports discouraged China increased demand / steel displaces other materials Prices and spreads improve and then stabilise Raw material costs moderate steel industry backward integrates Other costs remain high Competition BUT on increased global demand Expansion programs being re-evaluated Consolidation continues Page 35

36 Value added solutions - we recently have had Olympic success in China Page 36
37 BlueScope Coated Steel China June 2006 Page 37
38 Questions Strong Strong Board Board & Management Team Team Profitable Profitable Through Through the the Cycle Cycle Dynamic Dynamic Global Global Steel Steel Market Market Value Value Added Added Branded Branded Products Products Growth Growth Opportunities in in Asia Asia A VERY DIFFERENT KIND OF STEEL COMPANY Strong Strong Operating Operating Track Track Record Record Strong Strong and and Flexible Flexible Capital Capital Structure Structure Consistently Strong Strong Cash Cash Flows Flows Geographic Geographic and and Product Product Diversity Diversity Low Low Cost Cost Producer Producer Page 38
39 The 11 th Annual JP Morgan Asia Pacific Conference, New York Kirby Adams, Managing Director and Chief Executive Officer 25 to 27 September 2006 ASX Code: BSL
40 Supporting Information Page 40
41 Employee profile by country China 1969 SE Asia June 2006 Other 70 North America 4066 Australia New Zealand and Pacific Islands Total 18,276 Page 41
42 Hot Rolled Products Australia - product flow (Indicative) FY2006 Approximately 50% sold externally Port Kembla Steelworks 5.3mt slab FY2006 (5.1mt slab FY2005) Approximately 50% Further processed internally Export Slab (1) 27% (20%) Hot Strip Mill (1) 49% (51%) Plate Mill 8% (8%) C&BP Australia (2) (Western Port) 16% (21%) Export HRC 25% (12%) Domestic HRC 21% (28%) C & BP Australia (2) (Springhill) 54% (60%) Notes: (1) +400kt HSM expansion was completed July Technically it will take approximately 6 months to ramp-up production by the additional 400kt. This will reduce slab sales by an equivalent amount. (2) C&BP Australia is Coated and Building Products Australia Page 42
43 New Zealand Steel product flow* (FY2006) Mine Sites Iron Sand Concentrate 2.1mt * Indicative annual prime production and sales (t) Export Iron Sand Concentrate 0.9mt Export Vanadium Slag 15 kt New Zealand Steel 0.6mt Slab 0.6mt Hot Rolled Export Hot Rolled 39% (28%+11%) Cold Strip Mill 49% Domestic Pipe 4% Domestic Hot Rolled 8% Export Cold Rolled 14% (8%+ 6%) Coating lines 75% Domestic Cold Rolled 11% Export Painted 7% (5%+2%) Export Metal Coated 17% (10% + 7%) Domestic Metal Coated 57% Domestic Painted 19% (External % + Internal %) Page 43
44 North Star BlueScope Steel EAF operational excellence Focus on energy management given recent spike in electricity and natural gas prices Natural Gas Consumption Electricity Consumption (MMBTU per ton, FY) (KWH per ton, FY) Tap to Tap Time (minutes) EAF Power on Time per Heat (Minutes of Power Used per heat)) Annual Steel Prod (mtonnes) (100%) Page 44
45 Castrip - scale comparison with current casting technologies 1-2m/minute Gas cutter Cooling mm thick Reheat furnace Conventional Slab Casting Rougher Coil box m Finisher Run out table cooling 1-10mm thick Coiler metric ton coil Thin-Slab Casting 4-6 m/minute Finisher Run out table cooling 1-10mm thick Strip Casting 50-60mm thick Holding furnace m Coiler metric ton coil Scale Control Chamber m/minute Run out table Mill cooling 60 m mm thick Coiler metric ton coil Page 45

 Temper Mill 2 2. Cold Reduction 5.")

46 Coated and Building Products Australia packaging products material flow chart 1. Pickling 4. Temper Rolling Single Reduce (TM1) or Double Reduce (TM2) Temper Mill 2 2. Cold Reduction 5. Electrolytic Tinning ET2 or ET3 3. Annealing 6. Final Processing Continuous or Cleaning....& Batch Page 46
47 From construction to production Major project capital spending profile All in A$million Total Est. Capex / Cost Actual to 30/6/05 Thailand Coating expansion Vietnam Coating / Painting (1) 136 Indonesia Coating / Painting (3) (deferred in April 2006) 116 Actual FY2006 FY2007 FY2008 FY China - Coating and Painting Facility (3) Guangzhou Butler / Lysaght (4) 33 India - Butler / Lysaght facilities (3)(5) Coating / Painting (3)(5) Western Sydney Colorbond Port Kembla: - HSM expansion Blast Furnace No. 5 Reline (6) 300 (4) Total spending on major projects 133 1, over 3 years - - (1) Key variation from total estimate to actual capex is currency movements. Original approved capital cost was $160m (2) Capital spent from approval to 30/06/06. (3) Estimated capital costs based on forecast exchange rate assumptions at time of project approval. (4) Key variation from total estimate to actual cost is better cost performance. Original approved capital cost was $35m (5) India developments represent BlueScope s 50% interest, noting these developments will be funded by the BlueScope Steel and Tata Steel joint venture. (6) Indicative, based on project study. Final cost and phasing confirmed later in CY2006 Page 47


48 India Pune Project operational ahead of schedule BUTLER PEB facility and Design Centre LYSAGHT rollforming facility Original scheduled completion second half CY2006 Commissioning commenced April 2006 First order despatched May 2006 Page 48
49 BlueScope Steel a global leader in adding value to hot rolled coil Will increase to 56% with recently announced CAPEX (India) VALUE-ADDING CAPABILITY (Metal Coating Capacity as % of HRC Capacity) A similarly strong downstream position in Painting #4 worldwide Rollforming #1 worldwide Pre Engineered Buildings #1 worldwide BlueScope TKS AK Steel Kobe Steel Stelco Salzgitter Rautaruukki Arcelor Dofasco CSN Duferco Nisshin USS Sumitomo Handan Riva Tata Voestalpine ISG JFE USIMINAS Nippon SSAB Mittal Nucor NOTE: Compiled from the largest 60 steelmakers (excluding those who do not have flat steel metal coating capacity) Corus Panzhihua Techint POSCO Baosteel Severstal Magnitogorsk Novolipetsk NISCO Benxi Erdimir China Steel SAIL Ilyich Anshan Wuhan Source: IISI World Steel in Figures 2005, CRU Steel Sheet Quarterly April 2005 Page 49


50 Continued focus on branding of products and the provision of solutions PRODUCT Market leading differentiated coated steel and building solutions POSITIONING Market leading steel inspired solutions provider PRICE Commands premium in targeted segments BLUESCOPE STEEL PEOPLE Quality and diverse talents across the region focus in-country & across Divisions PROMOTION PLACE Corporate and product brand leadership Multi segment with selected channels to market Page 50


51 Value-added solutions Graffiti Remover Page 51


 1 July 9 July 23")
52 Value added PEB solutions - speed, cost effectiveness, broad application Example: 110,000m 2 facility, erected in 28 working days Wal*Mart Stores Distribution Centre (Arkansas) 1 July 9 July July 30 August 6 4 Page 52

53 Metallic coated and painted value added products Framework for the future TRUECORE steel launched to market in July Product designed specifically for use in the Residential Framing market TRUECORE steel will become synonymous with the compelling value proposition for steel house frames. Page 53
54 Ongoing growth is also expected in South East Asia, supported by improving domestic demand, growing intra-asian trade and strong foreign investment 12 8 GDP - Thailand F cast 12 8 GDP - Malaysia F cast Annual % Change Annual % Change Annual % Change GDP - Indonesia and Vietnam Vietnam F cast Indonesia US$billion Inward Foreign Direct Investment [Thailand, Malaysia, Indonesia, and Vietnam] F cast e Sources: EIU, BlueScope Steel Economics. Notes: All charts include calendar year data Page 54
55 Industrial production growth in China and India has stabilised at a high level, maintaining pressure on demand for commodities and metals Annual % Change India China GDP F cast Annual % Change China India Industrial Production F cast Annual % Change Gross Fixed Investment F cast China India Inward Foreign Direct Investment Sources: EIU, Consensus Economics, BlueScope Steel Economics. Notes: Data is calendar year for China, and fiscal yr beginning April for India. Year 05 data for India are estimates US$billion F cast India (RHS) China (LHS) Page 55
56 Indonesia Our markets Construction sector accounts for 99% of sales Approximately 50/50 split between industrial & commercial and residential segments Market share is growing through industry leadership in intermaterial growth, ie steel replacing timber trusses and concrete roof tiles. Inter-material Share Construction Segment 2005 Construction Investment - Constant US$ Million Other 7% Steel 8% Residential Non-Residential Civil Engineering Timber 25% Concrete 60% Includes roof cladding, purlins, walling, partitions, cable tray, decking, frames, door/window frame, walling etc. Source: BlueScope Steel Economics Source: extrapolated from PT. Data Consult report Page 56
57 Thailand Our markets BlueScope Steel Thailand principally targets the industrial / commercial construction segment In FY05 approximately 55 % of domestic prime sales went to this segment, with the balance spread between manufacturing (30%) and residential (15%). This segment is expected to continue to grow in the medium term Area in '000m2 12,000 10,000 8,000 6,000 4,000 Approved Commercial and Industrial construction (Thailand Municipal Zone) F Cast Inter Material share (FY04/05) Roofing and walling for industrial / commercial construction Concrete 30% Steel 40% 2, Calendar Year Source: BIS Shrapnel Report Building and Construction in Asia 2005/ Asbestos Compressed Sheet 30% Page 57
58 Vietnam Our markets Vietnam Construction Growth 20% 17.9% 17.9% 15.4% 15% 12.9% 11.0% 9.2% 10% 5% 0% e 2007f'cast Source: General Statistics Office & Shrapnel Inter-material Share FY06 - Roofing & Walling Market Tiles, 5% Principally a residential (60%) and industrial / commercial /Govt (30%) construction market in Vietnam. Estimated FY 06 sales mix residential (55%) and industrial/commercial/govt (45%). Coated steel market is forecast to grow at 6.5% to 7% pa over coming decade. High steel share of cladding market (59%) with users very familiar with steel solutions. Increasing proportion of painted product, although unpainted products will continue to dominate the market. Expanding sales into residential markets through increasing penetration of steel truss and metal tiles solutions. Concrete, 20% Others, 16% (Asbestos/ Fibre Cement, Leaf) Steel, 59% Domestic Sourcing: Imports (1) Metal coated 80% 20% (2) Painted 70% 30% Source: Mekong Research, BlueScope Steel Vietnam estimates Page 58
59 India Our markets % GDP Rea Construction Sector Growth - India Asbestos Sheet 21% Others 5% Intermaterial Share* 2003/4 Reinforced Concrete 45% 0 June Q'04 Sep Q'04 Dec Q'04 Mar Q'04 June Q'05 Sep Q'05 Source: Reserve Bank of India Dec Q'05 Steel 29% * Industrial Building, Roofing and Walling (Source: Tata BlueScope Steel analysis) Industrial / commercial construction segment is the fastest growing but residential remains the biggest Industrial construction while only 10% of total construction investment, is expected to grow at CAGR of 33% over the next 5 years (source: CRIS Infac) Page 59
60 Our record since public listing revenue & EBITDA Revenue (A$ Billions) 8,800 8,000 7,200 6,400 5,600 4,800 4,000 3,200 2,400 1, Revenue (A$m) EBITDA (A$m) FY2003 FY2004 FY2005 FY2006 Despatches (net) Revenue (A$m) 5,302 5,770 7,965 8,031 EBITDA (A$m) 881 1,104 1, EBITDA (A$ Millions) Page 60
61 Australian despatches decline on weak manufacturing / strong A$ mt FY % Non-dwelling 22% (0.652) Dwelling 18% (0.534) Engineering 12% Manufacturing 16% Agriculture & Mining 12% Auto & Transport 11% Packaging 9% Sales Tonnes Construction FY % Non-dwelling 23% (0.546) Dwelling 22% (0.523) Engineering 12% Manufacturing 15% Agriculture & Mining 11% Auto & Transport 11% Packaging 6% Australian sales tonnes lower across all segments in FY2006 to varying degree. Western Port fire affected year. In sales volume terms: Dwelling (down 2%) Housing slower in NSW & Vic BSL sales tonnes down marginally on 2005 but o Colorbond sales strong o residential framing growth exceeding expectations Non-dwelling (down 16%) Steel demand remains strong BSL sales tonnes decline on galvanised imports Manufacturing (down 25%) Industry closures / off shoring Imports of tinned food by grocers mt Despatches 2.375mt Page 61
62 Huge increase in FY2006 Zinc and Aluminium costs Tonnes Zinc Aluminium AUSTRALIA Springhill 21,250 10,000 Western Port 17,500 9,500 Sub-total 38,750 19,500 NEW ZEALAND 6,500 3,500 NORTH AMERICA Vistawall - 30,000 ASIA 12,250 11,250 TOTAL 57,500 64,250 Note: In future years BSL Asia s usage will increase as new mid-stream projects come into operation and ramp-up to capacity Page 62
63 Port Kembla Steelworks despatches stronger production Australian external demand lower (ktonnes) External Product Sales Mix ,332 23% 2,589 32% 23% 20% 2,579 41% 16% 2,723 40% 15% 54% 48% 43% 45% FY05-1H FY05-2H FY06-1H FY06-2H Internal Domestic Exports * * Including BlueScope Steel Asia feed Slab 34% 51% 54% 42% HRC 48% 36% 35% 45% Plate/Other 18% 13% 11% 13% Page 63
64 EBIT remains sensitive to realised hot rolled coil prices and raw material costs both were adverse in FY2006 Estimated impact on forecast EBIT (A$mil) Assumption Full Year (current) Full Year (previous) +/ US$25 / tonne movement in BlueScope s average realised export HRC price (1) +/ 1 movement in Australian dollar / US dollar exchange rate (2) / US$10 / tonne movement in NSBSL HRC price to scrap spread +/ 2% movement in slab production in Australia, New Zealand & USA +/ US$10 / tonne movement in coal costs (3) / US$10 / tonne movement in iron ore costs (3) (1) The change in export HRC price assumes proportional effect on export slab, and flow on to domestic pipe and tube market and to other export products. This does not include the potential impact on Australian domestic coated product prices, as the flow on effect in the short term is less certain. (2) The movement in the Australian dollar/us dollar exchange rate includes the restatement of US dollar denominated receivables and payables and the impact of translating the earnings of offshore operations to A$. (3) Coal and iron ore US dollar prices are predominantly locked in for FY Page 64
65 Improved disclosure new Slab and HRC price benchmarks Previously recommended the Japan to Korea HRC price as being a reasonable public benchmark for BlueScope s domestic and Asian HRC sales still valid and Continue to recommend the following better benchmarks HRC Steel Business Briefing HRC East Asia Import CFR $700 $600 Asian HRC Benchmark Price SBB HRC East Asia Import CFR $500 $400 SLAB Steel Business Briefing Slab East Asia Import CFR US$/mt $300 $200 $100 Source: Steel Business Briefing $0 Jan-00 Jul-00 Jan-01 Jul-01 Jan-02 Jul-02 Jan-03 Jul-03 Jan-04 Jul-04 Jan-05 Jul-05 Jan-06 Jul-06 Page 65
66 The 11 th Annual JP Morgan Asia Pacific Conference, New York Kirby Adams, Managing Director and Chief Executive Officer 25 to 27 September 2006 ASX Code: BSL
Goldman Sachs JBWere Australasian Forum New York
 Goldman Sachs JBWere Australasian Forum 2007 New York Kirby Adams Managing Director and Chief Executive Officer 79 March 2007 ASX Code: BSL Important notice THIS PRESENTATION IS NOT AND DOES NOT FORM PART
Merrill Lynch Australasia Investment Conference, New York. ASX Code: BSL
 Merrill Lynch Australasia Investment Conference, New York ASX Code: BSL BlueScope Steel A Different Kind of Steel Company Page 2 We focus on total shareholder return - ASX Top 50 total shareholder return
AGM Presentation - Managing Director & CEO Update
 AGM Presentation - Managing Director & CEO Update Paul O Malley, Managing Director and Chief Executive Officer 13 November 28 ASX Code: BSL Safety Our target remains Zero Harm Lost time injuries per million
Institutional Roadshow Presentation
 LIMITED Institutional Roadshow Presentation Kirby Adams, Managing Director and Chief Executive Officer Brian Kruger, Chief Financial Officer June / July 2002 Originally issued by. On 17 November 2003 became
Annual Earnings Report 30 June 2002
 BHP STEEL LIMITED A.B.N. 16 000 011 058 Level 11, 120 Collins Street Melbourne, Victoria 3001 Ph: +61 3 9666 4000 Fax: +61 3 9666 4111 Website: www.bhpsteel.com 7 th August 2002 PLEASE NOTE Annual Earnings
The Manager Company Announcements Australian Stock Exchange Limited Sydney NSW Dear Sir. Demerger of BHP Steel
 The Manager Company Announcements Australian Stock Exchange Limited Sydney NSW 2000 Dear Sir Demerger of BHP Steel At the time of the announcement of the creation of the DLC between BHP Limited and Billiton
REVISED REPORTING SEGMENTS
 REVISED REPORTING SEGMENTS The Company will report its FY2008 financial results in the following segments: Reporting Segment Coated and Industrial Products Australia Distribution and Solutions Australia
23 February The Manager Market Announcements Australian Securities Exchange Limited 20 Bridge Street SYDNEY NSW 2000.
 Level 1 157 Grenfell Street Adelaide SA 5000 GPO Box 2155 Adelaide SA 5001 Adelaide Brighton Ltd ACN 007 596 018 Telephone (08) 8223 8000 International +618 8223 8000 Facsimile (08) 8215 0030 www.adbri.com.au
Ramsay Health Care Limited Results Briefing Half Year ended 31 December 2018
 Ramsay Health Care Limited Results Briefing Half Year ended 31 December 2018 Craig McNally, Group Managing Director & Bruce Soden, Group Finance Director 28 February 2019 ramsayhealth.com Agenda Group
Results Briefing Year ended 30 June 2013
 Ramsay Health Care Limited Results Briefing Year ended 30 June 2013 Christopher Rex, Managing Director 29 August 2013 AGENDA 1. Group Operational and Financial Highlights 2. Segment Operational and Financial
TRANSFORMING OUR BUSINESS
 TRANSFORMING OUR BUSINESS BLUESCOPE STEEL LIMITED ANNUAL REPORT 2005/06 PART 1 OF 2 TABLE OF CONTENTS PART 1 2 INVESTING FOR GROWTH 4 CHAIRMAN S MESSAGE 6 MANAGING DIRECTOR AND CEO S REPORT 10 OUR BOND
2012 Result. Mika Vehviläinen CEO
 2012 Result Mika Vehviläinen CEO 1 Agenda Market environment in Q4 Business performance and strategy execution Outlook Financials 2 Market Environment According to IATA, Global air travel continues to
2007/08 Full Year Results Investor Briefing
 2007/08 Full Year Results Investor Briefing Highlights of Result Profit before tax up 46% to $1,408 million Up 36% on the reported result Margin improvement $3 billion of Sustainable Future Benefits achieved
FY2015 2nd Quarter Business Results
 FY2015 2nd Quarter Business Results Project AH A MAY products Yamaha Corporation and Yamaha Motor Co., Ltd. make products by exchanging the design divisions and their design fields, and present a joint
BLUESCOPE STEEL LIMITED ANNUAL REPORT 2006/07 PART 1 OF 2
 BLUESCOPE STEEL LIMITED ANNUAL REPORT 2006/07 PART 1 OF 2 BLUESCOPE BUILDING A TEAM 02 03 04 05 06 07 TABLE OF CONTENTS PART 1 4 BLUEPRINT 6 CHAIRMAN S REPORT 8 MANAGING DIRECTOR AND CEO S REPORT 12 OUR
Q Earnings Financial Results for the Third Quarter Ended December 31, January 29, 2015 OMRON Corporation
 Q3 2014 Earnings Financial Results for the Third Quarter Ended December 31, 2014 January 29, 2015 OMRON Corporation Contents 1. Summary 2. Q1-Q3 Results P. 2 P. 4 3. Full-Year Forecast P. 13 4. Corporate
2003/04 Full Year Results Presentation to Investors
 2003/04 Full Year Results Presentation to Investors 19 August 2004 Geoff Dixon Chief Executive Officer Highlights 12 months to June 2004 12 months to June 2003 Increase/ (decrease) % Sales and operating
For personal use only
 ASX and Media Release QANTAS DELIVERS RECORD FIRST HALF PROFIT, INVESTS IN AIRCRAFT AND TRAINING Sydney, 22 February 2018 Underlying Profit Before Tax: $976 million (up 15%) Record results for Qantas Domestic,
For personal use only
 Automotive Holdings Group Limited 21 Old Aberdeen Place West Perth, WA 6005 www.ahgir.com.au ABN 35 111 470 038 PRESENTATION TO MACQUARIE CONFERENCE 7 th May 2015 The company advises the attached presentation
Ramsay Health Care Limited Results Briefing Year ended 30 June 2018
 Ramsay Health Care Limited Results Briefing Year ended 30 June 2018 Craig McNally, Managing Director & Bruce Soden, Group Finance Director 30 August 2018 ramsayhealth.com Agenda Group Performance Overview
HALF YEAR REPORT February Leighton Holdings Limited
 HALF YEAR REPORT February 2009 PRESENTATION OUTLINE Results highlights Operational update Financial statements Strategy and outlook 2 Half Year Report I 12 February 2009 I RESULTS HIGHLIGHTS 3 Half Year
December 2018 Quarterly Production Report
 31 January 2019 December 2018 Quarterly Production Report Fortescue Metals Group Limited (ASX: FMG, Fortescue) Fortescue has released its December 2018 quarterly production results, reporting total shipments
QANTAS DELIVERS STRONG FIRST HALF RESULT DESPITE HIGHER FUEL BILL
 ASX and Media Release Sydney, 21 February 2019 QANTAS DELIVERS STRONG FIRST HALF RESULT DESPITE HIGHER FUEL BILL Underlying Profit Before Tax: $780 million (down $179 million) Statutory Profit Before Tax:
Managing through disruption
 28 July 2016 Third quarter results for the three months ended 30 June 2016 Managing through disruption 3 months ended Like-for-like (ii) m (unless otherwise stated) Change 30 June 2016 30 June 2015 change
Virgin Australia Holdings Limited (ASX: VAH) H1 FY18 Results 1
 H1 FY18 Results 1") Virgin Australia Holdings Limited (ASX: VAH) H1 FY18 Results 1 Summary of H1 FY18 Group Outcomes 2 Group Underlying Profit Before Tax of $102.5 million up 142.3% Group Statutory Profit After Tax of $4.4
Virgin Australia Holdings Limited (ASX: VAH) H1 FY18 Results 1 Summary of H1 FY18 Group Outcomes 2 Group Underlying Profit Before Tax of $102.5 million up 142.3% Group Statutory Profit After Tax of $4.4
QANTAS HALF YEAR 2015 FINANCIAL RESULTS 1
 QANTAS HALF YEAR 2015 FINANCIAL RESULTS 1 Key points: Underlying Profit Before Tax: $367 million Statutory Profit After Tax: $206 million Transformation benefits: $374 million Comparable unit cost reduction:
Helloworld Travel Limited results announcement Half year ended 31 December 2017
 Helloworld Travel Limited results announcement Half year ended 31 December 2017 HIGHLIGHTS FOR THE HALF YEAR ENDED 31 DECEMBER 2017 Total Transaction Value (TTV) growth of 2.7% to $2.968 billion. Earnings
Crown Resorts Limited
 Crown Resorts Limited 2015 Full Year Results Presentation 13 August 2015 1 Crown Resorts Limited Results Overview Crown Resorts Limited (Crown) performance: Overall, the results for Crown s portfolio of
Whitehaven Coal Limited
 Whitehaven Coal Limited AUSTMINE Presentation by Paul Flynn, Managing Director and CEO SYDNEY, AUSTRALIA 1 OCTOBER 2015 Our goal To become Australia s leading independent coal company 2 // AUSTMINE - 1
Final Dividend 7.0 cents per share, full year payout of 10.0
 KATHMANDU HOLDINGS LIMITED ASX/NZX/Media Announcement 21 September 2011 Kathmandu Holdings Ltd announces record sales and earnings result for FY2011: NZ$ Denominated Result Sales up 24.5% to $306.1m, EBIT
For personal use only
 SMS Management & Technology Level 41 140 William Street Melbourne Victoria 3000 Australia T +61 1300 842 767 F +61 1300 329 767 www.smsmt.com Melbourne Sydney Brisbane Canberra Adelaide Hong Kong Vietnam
CROWN ANNOUNCES 2018 HALF YEAR RESULTS
 ASX / MEDIA RELEASE FOR IMMEDIATE RELEASE 22 February 2018 CROWN ANNOUNCES 2018 HALF YEAR RESULTS MELBOURNE: Crown Resorts Limited (ASX: CWN) ( Crown ) today announced its results for the half year ended
Qantas Group - Positioned for Growth and Sustainable Returns
 Qantas Group - Positioned for Growth and Sustainable Returns Tino La Spina, Qantas Group Chief Financial Officer Macquarie Australia Conference 3 May 2018 Third Quarter 1 FY18 Trading Update Q3 trading
Crown Resorts Limited
 Crown Resorts Limited 2016 Half Year Results Presentation 25 February 2016 1 Crown Resorts Limited Results Overview Crown Resorts Limited (Crown) performance: The 2016 First Half results across Crown s
PERFORMANCE OVERVIEW BLUESCOPE STEEL BUSINESS SEGMENTS
 18 PERFORMANCE OVERVIEW BLUESCOPE STEEL BUSINESS SEGMENTS AUSTRALIA HOT ROLLED PRODUCTS KEY CUSTOMERS Engineering, construction, mining and manufacturing industries and export customers who re-roll our
Media Release QANTAS RESULTS FOR THE HALF YEAR ENDED 31 DECEMBER 2004 HIGHLIGHTS. Fully franked interim dividend of 10 cents per share
 Media Release QANTAS RESULTS FOR THE HALF YEAR ENDED 31 DECEMBER 2004 HIGHLIGHTS Profit before tax of $601.3 million Net profit after tax of $458.4 million Revenue of $6.4 billion Fully franked interim
CROWN ANNOUNCES 2010 FULL YEAR RESULTS
 ASX / MEDIA RELEASE FOR IMMEDIATE RELEASE 26 August 2010 CROWN ANNOUNCES 2010 FULL YEAR RESULTS MELBOURNE: Crown Limited (ASX: CWN) today announced its results for the full year ended 30 June 2010: Normalised
Presentation on Results for the 2nd Quarter FY Idemitsu Kosan Co.,Ltd. November 14, 2018
 Presentation on Results for the 2nd Quarter FY 2018 Idemitsu Kosan Co.,Ltd. November 14, 2018 Table of Contents 1. FY 2018 2nd Quarter Financials (1) Overview (2) Segment Information 2. Reference Materials
Record Result. 2006/07 Full Year Results Investor Presentation. Moved on successfully following bid. Profit before tax % to $1,032 million
 2006/07 Full Year Results Investor Presentation August 16 2007 Record Result Moved on successfully following bid Profit before tax + 53.8% to $1,032 million Group returning above Cost of Capital 2 Key
Interim Report 6m 2014
 August 11, 2014 Interim Report 6m 2014 Investors and Analysts Conference Call on August 11, 2014 Joachim Müller, CFO Latest ad-hoc release (August 4, 2014) Reduction of forecast, primarily due to a further
M2 Group Ltd 2014 Interim Results
 M2 Group Ltd 2014 Interim Results 24 February 2014 Geoff Horth, CEO Presentation Content Record Financial Performance Strong Organic Growth FY14 Priorities and Guidance Slide 2, 24 February 2014 Record
Investor Briefings First-Half FY2016 Financial Results
 Cedar Woods Properties Limited Investor Briefings First-Half FY2016 Financial Results 26 February 2016 Cedar Woods Presentation 2 Snapshot of Achievements in FY2016 Extensive portfolio of residential estates
BHP Billiton: A Strategy of Diversification
 Olympic Dam, Australia BHP Billiton: A Strategy of Diversification Andrew Mackenzie Chief Executive Non-Ferrous 9 June 2010 Disclaimer Reliance on Third Party Information The views expressed here contain
Euroz Rottnest Investor Briefing
 Cedar Woods Properties Limited Euroz Rottnest Investor Briefing 15 March 2016 Cedar Woods Presentation 2 Snapshot of Achievements in FY2016 Extensive portfolio of residential estates in Perth and WA regions,
For personal use only
 ASX / MEDIA RELEASE FOR IMMEDIATE RELEASE 25 February 2016 CROWN ANNOUNCES 2016 HALF YEAR RESULTS MELBOURNE: Crown Resorts Limited (ASX: CWN) today announced its results for the half year ended 31 December
2004/05 Full Year Results Presentation to Investors
 Geoff Dixon Chief Executive Officer 2004/05 Full Year Results Presentation to Investors 18 August 2005 Group Highlights 12 months to June 2005 12 months to June 2004 Increase/ (decrease) % Sales and operating
Crown Resorts Limited
 Crown Resorts Limited Annual General Meeting 20 October 2016 1 Presentation Outline F16 Year in Review 2 Crown Resorts Limited Group Result F16 Normalised $m F15 Normalised $m Variance F/(U) F16 Actual
2016 Full-year Results Supplementary Information
 206 Full-year Results Supplementary Information Wednesday, 24 August 206 (to be read in conjunction with the 206 Full-year Results Briefing Presentation) Presentation outline Item Presenter Page Group
CROWN ANNOUNCES 2019 HALF YEAR RESULTS
 ASX / MEDIA RELEASE FOR IMMEDIATE RELEASE 20 February 2019 CROWN ANNOUNCES 2019 HALF YEAR RESULTS MELBOURNE: Crown Resorts Limited (ASX: CWN) ( Crown ) today announced its results for the half year ended
MAINFREIGHT LIMITED FULL YEAR RESULT TO MARCH 2015
 MAINFREIGHT LIMITED FULL YEAR RESULT TO MARCH 2015 Result Summary NET SURPLUS Net surplus after tax and before abnormal items up 7.7% to $83.48 million REVENUE EBITDA Revenue up 6.8% to $2.05 billion Excluding
Thank you for participating in the financial results for fiscal 2014.
 Thank you for participating in the financial results for fiscal 2014. ANA HOLDINGS strongly believes that safety is the most important principle of our air transportation business. The expansion of slots
BORAL ANNUAL GENERAL MEETING 2011
 BUILDING SOMETHING GREAT TM BORAL ANNUAL GENERAL MEETING 2011 Dr Bob Every, Chairman 3 November 2011 1 1 Dr Bob Every Annual General Meeting 2011 FINANCIAL HIGHLIGHTS - Continuing operations $4.7bn up
Christopher Rex, Managing Director
 Christopher Rex, Managing Director AGENDA FY2013 Year in Review Delivering on our Growth Strategy Development Update Outlook 2 3 RAMSAY HEALTH CARE 121 hospitals in five countries Circa 12,000 beds Employs
Land area 1.73 million km 2 Queensland population (as at 31 December 2017) Brisbane population* (preliminary estimate as at 30 June 2017)
 Brisbane population* (preliminary estimate as at 30 June 2017)") Queensland - 11 Queensland OVERVIEW Queensland is nearly five times the size of Japan, seven times the size of Great Britain, and two and a half times the size of Texas. Queensland is Australia s second
Queensland - 11 Queensland OVERVIEW Queensland is nearly five times the size of Japan, seven times the size of Great Britain, and two and a half times the size of Texas. Queensland is Australia s second
For personal use only. Merrill Lynch Emerging Stars Conference
 Merrill Lynch Emerging Stars Conference October 2013 Performance History Share Price Performance 12 Months 150 100 18.8% (3.6%) 14 Oct 2013 AHE ASX Small Ords Share price $3.72 2193.21 50 0 Oct-12 Dec-12
For personal use only
 HELLOWORLD TRAVEL LIMITED RESULTS ANNOUNCEMENT Highlights for the year ended 30 June 2018 Total Transaction Value (TTV) growth of 3.5% to $6.1 billion, underpinned by strong air ticket sales volume growth.
FY 2013 Nippon Paint Group Analysts' Meeting for Financial Results of First Half FY 2013
 FY 2013 Nippon Paint Group Analysts' Meeting for Financial Results of First Half FY 2013 November 18, 2013 Nippon Paint Co., Ltd. Disclaimer The forward-looking statements in this document are based on
CROWN ANNOUNCES 2017 FULL YEAR RESULTS
 ASX / MEDIA RELEASE FOR IMMEDIATE RELEASE 4 August 2017 CROWN ANNOUNCES 2017 FULL YEAR RESULTS MELBOURNE: Crown Resorts Limited (ASX: CWN) ( Crown ) today announced its results for the full year 30 June
HALCYONAGRI. Q Results. 5 December 2014
 HALCYONAGRI Q3 2014 Results 5 December 2014 Important notice This presentation has been prepared by Halcyon Agri Corporation Limited ( Company ) for informational purposes, and may contain projections
Presentation on Results for the 3rd Quarter FY Idemitsu Kosan Co.,Ltd. February 2, 2016
 Presentation on Results for the 3rd Quarter FY 2015 Idemitsu Kosan Co.,Ltd. February 2, 2016 Table of Contents 1. 3 rd Quarter FY 2015 Financials (1) Overview (2) Segment Information 2. Forecast for FY
Heathrow (SP) Limited
 Limited") 28 April 2014 Heathrow (SP) Limited Results for three months ended 31 March 2014 Strong operational and financial performance at the outset of the new regulatory period Highest ever passenger satisfaction
28 April 2014 Heathrow (SP) Limited Results for three months ended 31 March 2014 Strong operational and financial performance at the outset of the new regulatory period Highest ever passenger satisfaction
BlueScope Asia Day China Business. 29 June 2006
 BlueScope Asia Day China Business 29 June 2006 an integrated group of focused businesses Our Focus: derive maximum value from the growing China steel construction industry. The market will see improved
Alberto Calderon Group Executive and Chief Executive Aluminium, Nickel and Corporate Development
 Port Hedland, Iron Ore, Australia Alberto Calderon Group Executive and Chief Executive Aluminium, Nickel and Corporate Development Economic and Social Outlook Conference 1 November 2012 Disclaimer Forward
IAG results presentation. Quarter One th May 2018
 IAG results presentation Quarter One 2018 4 th May 2018 Highlights Willie Walsh, Chief Executive Officer Highlights Another strong quarter performance with an operating profit of 280m (5.6% margin, +2.3pts)
Presentation on Results for the 2nd Quarter FY Idemitsu Kosan Co.,Ltd. November 1, 2016
 Presentation on Results for the 2nd Quarter FY 2016 Idemitsu Kosan Co.,Ltd. November 1, 2016 Table of Contents 1. 2nd Quarter FY 2016 Financials (1) Overview (2) Segment Information 2. Reference Materials
AIRBUS H Roadshow Presentation. New York July 31 st, 2017
 AIRBUS H1 2017 Roadshow Presentation New York July 31 st, 2017 H1 2017 HIGHLIGHTS 2 Healthy commercial aircraft environment; robust backlog of 6,771 a/c supports ramp-up plans H1 financials reflect delivery
Land area 1.73 million km 2 Queensland population (as at December 2016) Brisbane population* (preliminary estimate as at 30 June 2016)
 Brisbane population* (preliminary estimate as at 30 June 2016)") Queensland - 11 Queensland OVERVIEW Queensland is nearly five times the size of Japan, seven times the size of Great Britain, and two and a half times the size of Texas. Queensland is Australia s second
Queensland - 11 Queensland OVERVIEW Queensland is nearly five times the size of Japan, seven times the size of Great Britain, and two and a half times the size of Texas. Queensland is Australia s second
BHP Billiton Iron Ore Western Australia. Iron Ore. Presentation to Analysts June Ian Ashby, President and COO BHP Billiton Iron Ore
 BHP Billiton Western Australia Presentation to Analysts June 2005 Ian Ashby, President and COO BHP Billiton BHP Billiton Overview Record 53.6Mt of iron ore produced in the first half of FY2005 On target
Presentation on Results for the 3rd Quarter FY Idemitsu Kosan Co.,Ltd. February 14, 2019
 Presentation on Results for the 3rd Quarter FY 2018 Idemitsu Kosan Co.,Ltd. February 14, 2019 Table of Contents 1. FY 2018 3rd Quarter Results (1) Overview (2) Segment Information 2. Forecast for FY 2018
Interim results. 11 May 2010
 Interim results 11 May 2010 Introduction Andy Harrison Chief Executive Officer Strong performance despite disruption Improvement in revenue, margins and cash Continued network improvement has driven better
Tabcorp 2011 full year results
 16 August 2011 Tabcorp 2011 full year results Highlights including demerged Casinos business Reported Net Profit After Tax (NPAT) $534.8 million, up 13.9% (includes oneoff demerger impacts) Normalised
Corporate Presentation 2012/13 Interim Results
 Corporate Presentation 2012/13 Interim Results 26 February 2013 0 Disclaimer The information contained in this presentation is intended solely for your personal reference. Such information is subject to
Results Briefing Half Year ended 31 December Christopher Rex Managing Director
 Results Briefing Half Year ended 31 December 2014 Christopher Rex Managing Director AGENDA 1. Group Operational and Financial Highlights 2. Segment Operational and Financial Highlights 3. Growth Strategy
For personal use only HILLS HOLDINGS HALF YEAR RESULTS FY2013
 HILLS HOLDINGS HALF YEAR RESULTS FY2013 TODAY KEY HIGHLIGHTS OUR FY13 FIRST HALF RESULTS GROUP PERFORMANACE FIRST HALF NPAT 1 $8.2M IN LINE WITH NOVEMBER AGM GUIDANCE. STRONG MANAGEMENT OF WORKING CAPITAL
FIRST QUARTER 2017 RESULTS. 4 May 2017
 FIRST QUARTER 2017 RESULTS 4 May 2017 A resilient start of the year, traffic up 4.2% 20.9 million passengers carried, up 5.2%, traffic (RPK) up 4.2%, capacity (ASK) up 3.3% and load factor up 0.7pts Confirmation
A n n u a l R e s u l t s
 2 0 1 3 A n n u a l R e s u l t s 27 February 2014 Overview Accounting Sales up 3%. Global Brand Sales down 2%. Sales mainly decline in China, Taiwan and Singapore offset by growth in other markets, particularly
QANTAS RESULTS FOR THE HALF YEAR ENDED 31 DECEMBER 2005 HIGHLIGHTS
 Media Release QANTAS RESULTS FOR THE HALF YEAR ENDED 31 DECEMBER 2005 HIGHLIGHTS Profit before tax of $483.5 million Net profit after tax of $352.6 million Revenue of $6.8 billion Interim dividend of 11
Land area 1.73 million km 2 Queensland population (December 2015) Brisbane population* (June 2015)
 Brisbane population* (June 2015)") Queensland - 18 Queensland OVERVIEW Queensland is nearly five times the size of Japan, seven times the size of Great Britain, and two and a half times the size of Texas. Queensland is Australia s second
Queensland - 18 Queensland OVERVIEW Queensland is nearly five times the size of Japan, seven times the size of Great Britain, and two and a half times the size of Texas. Queensland is Australia s second
Christopher Rex Managing Director 15 November 2011
 Christopher Rex Managing Director 15 November 2011 Agenda Overview What is important to us? FY 2011 Highlights - Group - Australia - United Kingdom - France Our Growth Strategy Brownfield Developments
MEDIA RELEASE JUST GROUP ACHIEVES FIRST HALF PROFIT INCREASE OF 25.2%
 MEDIA RELEASE 7 March 2006 JUST GROUP ACHIEVES FIRST HALF PROFIT INCREASE OF 25.2% Just Group today announced a record net profit of $36.4 million for the six months ending 28 January 2006, a rise of 25.2%.
USA Acquisition Summary. December 2010
 USA Acquisition Summary December 2010 www.roadbearrv.com Strategic Intent 1. To leverage the existing business capabilities in a significant sized and growing tourism market with a similar customer base.
2011 Full Year Result
 2011 Full Year Result 23 February 2012 CEO Brett Chenoweth CFO Peter Myers 1 Financial results for 2011 FY 2011 AUD millions 2011 2010 Δ% Revenue 1,072.4 1,059.1 1% EBITDA* 208.9 244.3 (14%) EBIT* 171.4
RAMSAY HEALTH CARE REPORTS 17.7% RISE IN FULL YEAR CORE EPS AND 16.8% RISE IN CORE NET PROFIT
 ASX ANNOUNCEMENT 30 August 2016 RAMSAY HEALTH CARE REPORTS 17.7% RISE IN FULL YEAR CORE EPS AND 16.8% RISE IN CORE NET PROFIT Financial Highlights Core net profit after tax 1 (Core NPAT) up 16.8% to $481.4
TUI GROUP INVESTOR PRESENTATION
 TUI GROUP INVESTOR PRESENTATION German Investment Conference UniCredit / Kepler Munich, 26-27 September 2012 Future-related statements This presentation contains a number of statements related to the future
KERRIE MATHER MANAGING DIRECTOR AND CHIEF EXECUTIVE OFFICER. Macquarie Conference 4 MAY 2016
 KERRIE MATHER MANAGING DIRECTOR AND CHIEF EXECUTIVE OFFICER Macquarie Conference 4 MAY 2016 Disclaimer General securities warning This presentation has been prepared by Sydney Airport Limited (ACN 165
Tiger Airways Holdings Limited FY11 Results
 Tiger Airways Holdings Limited FY11 Results May 2011 Financial Year Ended 31 March 2011 Disclaimer The information contained in this presentation (the "Information") is provided by Tiger Airways Holdings
AIRBUS. H Roadshow Presentation. July 2018
 AIRBUS H1 2018 Roadshow Presentation July 2018 H1 18 HIGHLIGHTS 2 Robust commercial aircraft environment Backlog of ~7,200 a/c underpins ramp-up plans H1 financials reflect mainly A350 performance and
QANTAS ANNOUNCES PROFIT RESULT YEAR ENDED 30 JUNE 2009
 QANTAS ANNOUNCES PROFIT RESULT YEAR ENDED 30 JUNE 2009 HIGHLIGHTS Profit before tax of $181 million, in a year when the International Air Transport Association forecast US$9 billion in losses for global
Interim Results- Highlights
 Who is FKP? FKP is a leading diversified property and investment group Core business: construction, development, retirement, and funds management Based in Queensland, but with operations in five states
FY 13 Results. February 26, FY 13 Results.
 February 26, 2014 www.atresmediacorporacion.com 1 FY 13 Highlights According to external sources, Total Ad market declined by -8.0% in 2013 (TV and Radio down by -6.2% and -11.0% yoy respectively) Atresmedia
Atlas Lifts Production Guidance and Lowers Cost Forecast After Record September Quarter
 18th October 2012 Atlas Lifts Production Guidance and Lowers Cost Forecast After Record September Quarter Highlights Record shipped tonnes and production physicals in the September Quarter Shipped tonnes
Presentation on Results for the 1st Quarter FY Idemitsu Kosan Co.,Ltd. August 14, 2017
 Presentation on Results for the 1st Quarter FY 2017 Idemitsu Kosan Co.,Ltd. August 14, 2017 Table of Contents 1. FY 2017 1st Quarter Financials (1) Overview (2) Segment Information 2. Reference Materials
MAINFREIGHT LIMITED FULL YEAR RESULT TO MARCH 2017
 MAINFREIGHT LIMITED FULL YEAR RESULT TO MARCH 2017 Result Summary NET SURPLUS Net surplus after tax and before abnormal items up 17.0% to $103.2 million REVENUE EBITDA Revenue up 2.1% to $2.33 billion
Outlook: FY13 EBITDA guidance $28M - $29M. Pursuing contracted 300MW in 2013 growth strategy. FY13 maiden franked dividend payment expected
 ASX CODE PEA ISSUED CAPITAL Ordinary Shares 360.8M Options 10.7M KPS CONTRACTED CAPACITY 240MW HYDRO CONTRACTED CAPACITY 6MW 14 February 2013 STRONG ORGANIC GROWTH UNDERPINS RECORD PACIFIC ENERGY RESULT
Presentation on Results for the 3rd Quarter FY Idemitsu Kosan Co.,Ltd. February 14, 2018
 Presentation on Results for the 3rd Quarter FY 2017 Idemitsu Kosan Co.,Ltd. February 14, 2018 Table of Contents 1. FY 2017 3rd Quarter Results (1) Overview (2) Segment Information 2. Forecast for FY2017
HK GAAP RESULTS RELEASE 25 February 2008 STAR CRUISES GROUP ANNOUNCES FOURTH QUARTER AND FULL YEAR RESULTS FOR 2007
 HK GAAP RESULTS RELEASE 25 February 2008 FOR IMMEDIATE RELEASE INTERNATIONAL STAR CRUISES GROUP ANNOUNCES FOURTH QUARTER AND FULL YEAR RESULTS FOR 2007 Key points for the quarter in comparison with 4Q
Analyst and Investor Conference Call Q Ulrik Svensson, CFO and Member of the Executive Board
 Analyst and Investor Conference Call Q2 2017 Ulrik Svensson, CFO and Member of the Executive Board Frankfurt, 2 August 2017 Disclaimer The information herein is based on publicly available information.
FY RESULTS ROADSHOW PRESENTATION
 1 FY RESULTS 2014 ROADSHOW PRESENTATION FY 2014 HIGHLIGHTS FOCUS ON EXECUTION 2 Strong financial performance Revenues: 61 bn, +5% vs. 2013 EBIT* before one off: 4.1 bn, +15% vs. 2013 EPS: 2.99, +61% vs.
Heathrow (SP) Limited
 Limited") Draft v2.0 10 Feb Heathrow (SP) Limited Results for year ended 31 December 2013 24 February 2014 Strong operational and financial performance in 2013 Passenger satisfaction at record high and over 72 million
Draft v2.0 10 Feb Heathrow (SP) Limited Results for year ended 31 December 2013 24 February 2014 Strong operational and financial performance in 2013 Passenger satisfaction at record high and over 72 million
LOCATED AT THE GATEWAY OF THE TROPICAL PROVINCE, RIDING ON THE GROWTH MOMENTUM OF THE COUNTRY, WE ARE ON THE RIGHT TRACK OF TAKING OFF.
 LOCATED AT THE GATEWAY OF THE TROPICAL PROVINCE, RIDING ON THE GROWTH MOMENTUM OF THE COUNTRY, WE ARE ON THE RIGHT TRACK OF TAKING OFF. MANAGEMENT DISCUSSION INDUSTRY REVIEW Civil Aviation Industry in