Goldman Sachs JBWere Australasian Forum New York
|
|
|
- Austen Leonard
- 5 years ago
- Views:
Transcription


1 Goldman Sachs JBWere Australasian Forum 2007 New York Kirby Adams Managing Director and Chief Executive Officer 79 March 2007 ASX Code: BSL
2 Important notice THIS PRESENTATION IS NOT AND DOES NOT FORM PART OF ANY OFFER, INVITATION OR RECOMMENDATION IN RESPECT OF SECURITIES. ANY DECISION TO BUY OR SELL BLUESCOPE STEEL LIMITED SECURITIES OR OTHER PRODUCTS SHOULD BE MADE ONLY AFTER SEEKING APPROPRIATE FINANCIAL ADVICE. RELIANCE SHOULD NOT BE PLACED ON INFORMATION OR OPINIONS CONTAINED IN THIS PRESENTATION AND, SUBJECT ONLY TO ANY LEGAL OBLIGATION TO DO SO, BLUESCOPE STEEL DOES NOT ACCEPT ANY OBLIGATION TO CORRECT OR UPDATE THEM. THIS PRESENTATION DOES NOT TAKE INTO CONSIDERATION THE INVESTMENT OBJECTIVES, FINANCIAL SITUATION OR PARTICULAR NEEDS OF ANY PARTICULAR INVESTOR. TO THE FULLEST EXTENT PERMITTED BY LAW, BLUESCOPE STEEL AND ITS AFFILIATES AND THEIR RESPECTIVE OFFICERS, DIRECTORS, EMPLOYEES AND AGENTS, ACCEPT NO RESPONSIBILITY FOR ANY INFORMATION PROVIDED IN THIS PRESENTATION, INCLUDING ANY FORWARD LOOKING INFORMATION, AND DISCLAIM ANY LIABILITY WHATSOEVER (INCLUDING FOR NEGLIGENCE) FOR ANY LOSS HOWSOEVER ARISING FROM ANY USE OF THIS PRESENTATION OR RELIANCE ON ANYTHING CONTAINED IN OR OMITTED FROM IT OR OTHERWISE ARISING IN CONNECTION WITH THIS. Page 2

3 Introduction and Headlines Page 3
4 BlueScope Steel Overview Global flat steel product solutions company spun out of BHP July 2002 EV at listing approximately A$3.0B today A$9.0B Unique production footprint and building products franchise in Australia / New Zealand China, SE Asia and India North America Leading regional positions in Metallic coating and painting of steel coil Rollformed steel building products roofing, walling, purlins and decking Preengineered steel buildings Financial metrics (1H FY2007) Revenue A$4.5B (A$4.9B inclusive of USA JV) EBIT A$635M ROE 24% Gearing (net debt) 35.6% Cash from operations strong $752M in 6 months. EBITDA A$794M Focus on rewarding shareholders as we grow 78% NPAT over 4.5 years Strategy midstream and downstream growth to create a more diversified and stable revenue / earnings profile Core Value is Care for employees, communities, customers and shareholders Page 4
5 Zero harm is our goal for our team and communities Lost Time Injury Frequency Rate Medically Treated Injury Frequency Rate Lost time injuries per million manhours worked Reported performance for IISI member companies (employee only) NSW Manufacturing 27.9 in H Medically treated injuries per million manhours worked H Includes Contractor performance from 1996 Includes Butler performance from May 2004 Includes Contractor performance from 2004 Includes Butler performance from May ,269 Employees, 98 manufacturing sites, 17 countries Page 5
6 Continuing to reward our shareholders as we grow Share Buybacks Public listing to 31 December 2006 Purchased and cancelled 116m shares on market 90m shares off market 26m shares Average price paid $6.10 per share Shares on issue As at 31 December million Dividend reinvestment scheme Effective from and including final FY2006 ordinary dividend Dividends All fully franked (ordinary / special) / / / Total return to shareholders since BSL s public listing (July 2002): Share buybacks $ 707m 26% Dividends paid $ 1,277m Interim dividend 52% (to be paid 02Apr07) $ 153m $ 2,137m 78% $2.89 per share or 78% payout ratio (NPAT) 44 / FY2003 FY2004 FY2005 FY2006 FY2007 Interim Final Special Page 6
7 Group financial headlines 1H FY2007 vs. 1H FY2006 Across the board improvements Six months ended 31 December Variance % Revenue A$4,528M A$3,892M Up 16% (record half year) External despatches 3.7M tonnes 3.5M tonnes Up 6% (record) EBITDA A$794M A$593M Up 34% EBIT A$635M A$449M Up 41% NPAT A$388M A$312M Up 24% EPS Reported Up 24% After Tax Return on Invested Capital 17.0% 14.6% Up 16% Return on Equity 24.0% 18.9% Up 27% Net Operating Cashflow From operating activities A$697M A$349M Up 100% After capex / investments A$133M A$(156)M Up 185% Dividend Interim ordinary (fully franked) 21 cps 20cps Up 5% Gearing (net debt) 35.6% 33.2% Down from 38% (June 06) Page 7
8 Record sales volumes, driven by strong demand for BlueScope s products 1H FY2005 1H FY2006 1H FY % Exports 23% 11% 5% External Despatches Key 4% 8% Exports Americas 16% 45% 3% 14% Exports 38% 21% 8% 4% 16% 34% Exports 31% 7% 9% 11% 15% Asia 4% Domestic sales (produced and sold within country) Exports Americas Exports Europe/Med/ME/India Exports Asia 3,457MT 3,544MT 3,741MT NZ North America Australia Record Half 15% 39% Exports Asia Exports Europe/Med/Middle East/India NA (NSBSS + C&BPNA) Australia New Zealand/Pacific Asia Page 8
9 EBIT A$ Millions EBIT variance 1H FY2006 to 1H FY2007 by item Higher export slab and HRC prices Recovery from Western Port fire and increased Asian despatches $164m $40m $11m Smorgon dividend 9 Lower redundancy 8 Prior period rebates 4 General employee share plan costs 12 Asset sales $133m $15m ($204m) ($11m) $38m $635m $449m Iron Ore (4) Coal (6) Opening Inventory (71) * Scrap (12) Coating Metals (112) Ext Steel Feed HY December 05 Export Prices Domestic Prices Volume / Mix North Star Spread Conversion & Other Costs Raw Material Costs Exchange Rates Other HY December 06 Note: (*) In late FY2005, BlueScope purchased kt of lower priced iron ore, noting iron ore fines increased by approximately 71.5% from 1 July An equivalent arrangement was not available at the end of FY2006. Page 9
10 Cashflow a real strength and point of differentiation First Half A$M FY2003 FY2006 FY2007 Source First full year of operations after listing Cashflow from operations Working capital movement (31) (214) (55) Strong operations performance Working capital improvement initiatives pay off Net cash from operations Application Capital Expenditure (165) (365) (245) Smorgon Steel shareholding (19.9%) (319) Statutory (tax) (29) (239) (126) Includes special dividend Returned to shareholders (101) (390) (169) Net Funding (468) (763) (356) (712) Greenfield capex program slowing $168M underwritten DRP and debt reduction / other ($21M) Closing cash increase / (decrease) 1 (7) (15) Page 10
11 Balance sheet working capital reductions and lower gearing improve financial flexibility As at A$ Millions 30 June December 2006 Assets Cash Receivables 1,344 1,181 Inventory 1,329 1,410 Other Assets 783 1,180 Net Fixed Assets 3,743 3,736 Total Assets 7,261 7,565 Liabilities Creditors Interest Bearing Liabilities 1,952 1,983 Provisions & other Liabilities 1,265 1,253 Total Liabilities 4,176 4,074 Net Assets 3,085 3,491 Net Debt / (Net Debt + Equity) 38.0% 35.6% (1) Includes BlueScope s 19.9% shareholding in Smorgon Steel (1) Total revenue up 9% BUT receivables down 12% Debt flat even with Smorgon 19.9% ($319M) 2.4 percentage point improvement in 6 months Page 11


12 Reporting Segment Performance Page 12


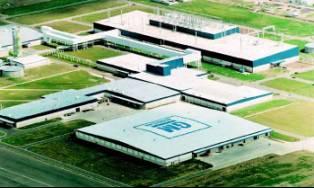
 o Delta, Ohio Preeminent global designer / supplier Preengineered buildings No 2")
13 Reporting business segments Corporate / Group Australia New Zealand Asia North America Hot Rolled Products Australia Coated & Building Products Australia New Zealand & Pacific Islands Products Coated & Building Products Asia Hot Rolled Products North America Coated & Building Products North America Lowest quartile producer Leading supplier of flat steel in Australia Global scale o Port Kembla Steelworks Largest supplier of metallic coated and painted steel in Australia Leading market shares in most key products o Western Port o Springhill o Lysaght Australia o Service Centres Only fully integrated flat steel maker in New Zealand Leading domestic market share of flat products o Pacific Islands o Glenbrook, NZ Preeminent seller of branded steel in Asia Lower cost backward integration growth strategy o Indonesian, Malaysian, Thailand and Vietnamese operations o China, including Butler o Lysaght Asia o India Tata BlueScope JV 50:50 joint venture with Cargill Inc. Again voted no. 1 flat rolled steel supplier in North America (Jacobson Survey) o Delta, Ohio Preeminent global designer / supplier Preengineered buildings No 2 position in North America and no. 1 in China o Butler buildings o Vistawall Page 13
14 EBIT A$ Millions All BlueScope business segments profitable and all growing revenue 700 EBIT variance 1H FY2006 to 1H FY2007 by reporting business segment 650 $9m $635m $13m $35m 600 $45m 550 $50m $29m $449m $28m ($23m) HY December 05 EBIT Movements Hot Rolled Products Australia Coated & Bldg Products Aust NZ & Pacif ic Islands Products Coated & Bldg Products Asia Hot Rolled Products Nth America Coated & Bldg Products Nth America Corporate & Group Discontinued Businesses From 1H FY2006 $410M $(30)M $66M $2M $67M $2M $(61)M $(6)M To 1H FY2007 $438M $20M $43M $31M $112M $37M $(48)M $3M HY December 06 Due to: 1H FY2007 Sales Revenue Higher export steel prices Higher domestic volumes $2,000M +10% Higher sales vols Higher zinc costs Improved operations Packaging loss $1,699M +19% Higher zinc costs Higher R&M $364M +1% Higher sales volumes Higher prices Lower oneoff costs $676M +46% Improved spread (North Star) Higher slab & HRC prices for trading office sales $661M (inc. NSBSS) +29% Higher sales vols Improved productivity Increased market share $656M +8% SSX dividend Lower employee share plan costs Taiwan closure Page 14
15 Unique production footprint in the world s fastest growing regions Pan Asia 24 Lysaght and Butler PEB sites India Metal Coating 250kt Painting 150kt Thailand Cold Rolling 350kt Metal Coating 375kt Painting 90kt Malaysia Metal Coating 150kt Painting 60kt Australia 7 Service Centres 37 Lysaght Sites 7 Bluescope Water (1) Facility to close (expected April 2007) Indonesia Metal Coating 100kt Painting 50kt Western Port Hot Rolling 1.43mt Cold Rolling 1.0mt MC (3 lines) 830kt + Painting (2 lines) 330kt + China MC 250kt Painting 150kt Vietnam MC 125kt Painting 50kt Brisbane Painting 90kt Sydney Paint Line (1 line) 120 kt Coated and Building Products Butler / Vistawall North Star BluescopeJV Hot Rolling 1.80mt (100%) Castrip JV with Nucor Port Kembla / Illawarra Raw Steel 5.2mt Hot Rolling 2.8mt (inc HSM Exp) Plate 360kt Cold Rolling 930kt Tinplate/Black plate 450k (1) MC (3 lines) 750kt + PL (2 lines) 207kt + New Zealand / Pacific Iron sand Mining Raw Steel 625kt Hot Rolling 750kt Cold Rolling360kt Metal Coating 230kt + Painting 60kt Hollow Sections 45kt Pacific Roll forming sites 3 Page 15
16 BlueScope Steel China 1H FY2007 REVENUE: A$210M EMPLOYEES: 1,926 INVESTED CAPITAL: A$433M BlueScope Steel in China 1 Metal Coating/Paint Line facility 4 Lysaght manufacturing facilities 2 Butler PEB manufacturing facilities 60 Lysaght / CSC sales offices 24 Butler district offices / sales offices Page 16
17 BlueScope Steel North America BlueScope Steel in North America 1 Regional Office 4 BlueScope Steel Sales Offices North Star Bluescope Delta OHIO 7 Butler Manufacturing Plants 12 Butler Sales / Engineering Offices 7 Vistawall Manufacturing / Fabrication Plants 12 Vistawall Sales Offices 1H FY2007 REVENUE: A$1,317M* EBITDA: A$159M* EMPLOYEES: 4,283* INVESTED CAPITAL: A$485M* (*INC NORTH STAR BLUESCOPE STEEL 50%) Page 17
18 Compound Annual Growth Rates 1400 STRATEGY % Downstream % Midstream % Global Steel Industry BlueScope s Strategy Industry Consolidation Upstream 50,000 45,000 40,000 35,000 30, , ,000 15, ,000 5, Arcelor + Mittal Nippon Steel POSCO JFE Corus + Tata Baosteel US Steel Nucor Thyssen Krupp Evraz Gerdau Severstal Wuhan ChinaSteel Maanshan BlueScope CSN SSAB Crude Steel Production (M tonnes) Revenue (US$m) Page 18
19 World crude steel production 1950 to 2006 China driving growth but slowing Million Tonnes Compound Annual Growth Rates % % % China: 21.5% % USSR: 4.1% World Excluding China: 2.1% ( ) 600 World Excluding USSR: 1.1% 400 Japan: 6.9% World Excluding Japan: 1.8% ( ) 200 ( ) Source: IISI, BSL Page 19
20 Our strategy remains unchanged. Focused on growing more diversified and stable revenue / earnings profile Revenue increased 1H 2006 vs. 1H 2007 GROWTH PROJECTS Major projects completed to 31 December 2006 To be completed 2H FY2007 FY % Downstream Asia India PEB and Lysaght facilities at Pune India Lysaght facility at Chennai & New Delhi USA Successful turnaround of Tennessee facility. Thailand PEB facility China Guangzhou (PEB and Lysaght) Lang Fang (Panels) Australia A$320M Smorgon Steel shareholding (19.9%) +27% Midstream Asia Thailand second metal coating line (MCL2) and ramp up in progress ramp up CRC Vietnam metal coating (MCL) and paint line (PL) and ramp up in progress China MCL and PL and ramp up in progress Asia India new MCL & PL construction (CY2009) Indonesia MCL2 & PL2 (project deferred) Australia Sydney Colorbond plant startup (around June 2007) +11% Upstream Australia 400kt HSM expansion at PKSW [New Zealand Front end study] Australia BF No 5 reline (expected March 2009) USA North Star BlueScope new bag house installed Page 20
21 Major project capital and investment spending profile All in A$million Total Est. Capex / Cost Actual to 30/6/06 1H FY2007 2H FY2007 FY2008 FY2009 PROJECTS Projects completed Thailand Coating expansion Vietnam Coating / Painting China Coating and Painting Facility Guangzhou Butler / Lysaght India Butler / Lysaght facilities Australia Port Kembla (PKSW) HSM expansion Sinter Plant Emissions WA Service Centre Projects to be completed / deferred India Coating / Painting (50% interest) Indonesia Coating / Painting (deferred) PKSW Blast Furnace No. 5 Reline Western Sydney Colorbond INVESTMENTS Butler Manufacturing Lysaght and water acquisitions Total capital spending 1,933 1, Page 21
22 Global group sales revenue mix mid and downstream sales revenue growth powering ahead 1H FY2003 1H FY2005 1H FY % A$1,350M 270.6% A$1,166M 19.0% A$1,413M Downstream A$315M 15.3% A$1,188M Midstream Upstream A$1,031M A$960M 28.9% A$1,238M 22.1% A$1,511M Discontinued/Other Businesses A$262M A$280M A$234M Total Sales Revenue A$2,568M A$3,872M A$4,508M +75.5% Page 22


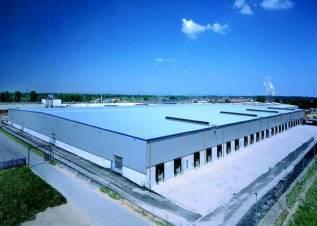
23 Butler Buildings North America Number 2 in PEBs Manufacturing Warehouse Retail Recreation Showroom Community Page 23
24 Global steel industry our long term view has not changed China s steel capacity growth rate slowing Raw material, energy and internal transport costs reducing relative competitiveness Steel reform initiatives evident with more promised Underlying demand in China is strong Longer term steel to progressively displace other building materials Steel export growth occurring Economic growth remains strong Japan record steel production likely in 2007 stoked by domestic demand Russia strong economy limits exports USA strong North American economy World Trade case against China Middle East and Europe strong demand Continued production discipline India growing steel requirements Increased alliance activity Increase in steel industry mining activity Global steel industry consolidation accelerating Page 24
25 Global steel industry consolidation increases pace Most companies shown announced intention to acquire or formed alliances What will happen in Asia and when? ,000 EU / Americas EU / Asia Asia Australia, Asia, Americas EU Americas ,000 40,000 35,000 30,000 25,000 20,000 15,000 10,000 5,000 0 Arcelor + Mittal Nippon Steel POSCO JFE Corus + Tata Baosteel US Steel Nucor Thyssen Krupp Evraz Gerdau Severstal Wuhan ChinaSteel Maanshan BlueScope CSN SSAB Crude Steel Production (M tonnes) Revenue (US$m) Page 25


26 In summary a very good 6 months Page 26
27 Questions and Answers Strong Strong Board Board & Management Team Team Profitable Profitable Through Through the the Cycle Cycle Dynamic Dynamic Global Global Steel Steel Market Market Value Value Added Added Branded Branded Products Products Growth Growth Opportunities in in Asia Asia A VERY DIFFERENT KIND OF STEEL COMPANY Strong Strong Operating Operating Track Track Record Record Strong Strong and and Flexible Flexible Capital Capital Structure Structure Consistently Strong Strong Cash Cash Flows Flows Geographic Geographic and and Product Product Diversity Diversity Low Low Cost Cost Producer Producer Page 27
28 Goldman Sachs JBWere Australasian Forum 2007 New York Kirby Adams Managing Director and Chief Executive Officer 79 March 2007 ASX Code: BSL
Merrill Lynch Australasia Investment Conference, New York. ASX Code: BSL
 Merrill Lynch Australasia Investment Conference, New York ASX Code: BSL BlueScope Steel A Different Kind of Steel Company Page 2 We focus on total shareholder return - ASX Top 50 total shareholder return
AGM Presentation - Managing Director & CEO Update
 AGM Presentation - Managing Director & CEO Update Paul O Malley, Managing Director and Chief Executive Officer 13 November 28 ASX Code: BSL Safety Our target remains Zero Harm Lost time injuries per million
The 11 th Annual JP Morgan Asia Pacific Conference, New York
 The 11 th Annual JP Morgan Asia Pacific Conference, New York Kirby Adams, Managing Director and Chief Executive Officer 25 to 27 September 2006 ASX Code: BSL Important notice THIS PRESENTATION IS NOT AND
Institutional Roadshow Presentation
 LIMITED Institutional Roadshow Presentation Kirby Adams, Managing Director and Chief Executive Officer Brian Kruger, Chief Financial Officer June / July 2002 Originally issued by. On 17 November 2003 became
REVISED REPORTING SEGMENTS
 REVISED REPORTING SEGMENTS The Company will report its FY2008 financial results in the following segments: Reporting Segment Coated and Industrial Products Australia Distribution and Solutions Australia
The Manager Company Announcements Australian Stock Exchange Limited Sydney NSW Dear Sir. Demerger of BHP Steel
 The Manager Company Announcements Australian Stock Exchange Limited Sydney NSW 2000 Dear Sir Demerger of BHP Steel At the time of the announcement of the creation of the DLC between BHP Limited and Billiton
Annual Earnings Report 30 June 2002
 BHP STEEL LIMITED A.B.N. 16 000 011 058 Level 11, 120 Collins Street Melbourne, Victoria 3001 Ph: +61 3 9666 4000 Fax: +61 3 9666 4111 Website: www.bhpsteel.com 7 th August 2002 PLEASE NOTE Annual Earnings
TRANSFORMING OUR BUSINESS
 TRANSFORMING OUR BUSINESS BLUESCOPE STEEL LIMITED ANNUAL REPORT 2005/06 PART 1 OF 2 TABLE OF CONTENTS PART 1 2 INVESTING FOR GROWTH 4 CHAIRMAN S MESSAGE 6 MANAGING DIRECTOR AND CEO S REPORT 10 OUR BOND
BLUESCOPE STEEL LIMITED ANNUAL REPORT 2006/07 PART 1 OF 2
 BLUESCOPE STEEL LIMITED ANNUAL REPORT 2006/07 PART 1 OF 2 BLUESCOPE BUILDING A TEAM 02 03 04 05 06 07 TABLE OF CONTENTS PART 1 4 BLUEPRINT 6 CHAIRMAN S REPORT 8 MANAGING DIRECTOR AND CEO S REPORT 12 OUR
For personal use only
 Automotive Holdings Group Limited 21 Old Aberdeen Place West Perth, WA 6005 www.ahgir.com.au ABN 35 111 470 038 PRESENTATION TO MACQUARIE CONFERENCE 7 th May 2015 The company advises the attached presentation
For personal use only
 ASX and Media Release QANTAS DELIVERS RECORD FIRST HALF PROFIT, INVESTS IN AIRCRAFT AND TRAINING Sydney, 22 February 2018 Underlying Profit Before Tax: $976 million (up 15%) Record results for Qantas Domestic,
Results Briefing Year ended 30 June 2013
 Ramsay Health Care Limited Results Briefing Year ended 30 June 2013 Christopher Rex, Managing Director 29 August 2013 AGENDA 1. Group Operational and Financial Highlights 2. Segment Operational and Financial
Ramsay Health Care Limited Results Briefing Half Year ended 31 December 2018
 Ramsay Health Care Limited Results Briefing Half Year ended 31 December 2018 Craig McNally, Group Managing Director & Bruce Soden, Group Finance Director 28 February 2019 ramsayhealth.com Agenda Group
For personal use only. Merrill Lynch Emerging Stars Conference
 Merrill Lynch Emerging Stars Conference October 2013 Performance History Share Price Performance 12 Months 150 100 18.8% (3.6%) 14 Oct 2013 AHE ASX Small Ords Share price $3.72 2193.21 50 0 Oct-12 Dec-12
Helloworld Travel Limited results announcement Half year ended 31 December 2017
 Helloworld Travel Limited results announcement Half year ended 31 December 2017 HIGHLIGHTS FOR THE HALF YEAR ENDED 31 DECEMBER 2017 Total Transaction Value (TTV) growth of 2.7% to $2.968 billion. Earnings
Qantas Group - Positioned for Growth and Sustainable Returns
 Qantas Group - Positioned for Growth and Sustainable Returns Tino La Spina, Qantas Group Chief Financial Officer Macquarie Australia Conference 3 May 2018 Third Quarter 1 FY18 Trading Update Q3 trading
December 2018 Quarterly Production Report
 31 January 2019 December 2018 Quarterly Production Report Fortescue Metals Group Limited (ASX: FMG, Fortescue) Fortescue has released its December 2018 quarterly production results, reporting total shipments
PERFORMANCE OVERVIEW BLUESCOPE STEEL BUSINESS SEGMENTS
 18 PERFORMANCE OVERVIEW BLUESCOPE STEEL BUSINESS SEGMENTS AUSTRALIA HOT ROLLED PRODUCTS KEY CUSTOMERS Engineering, construction, mining and manufacturing industries and export customers who re-roll our
Ramsay Health Care Limited Results Briefing Year ended 30 June 2018
 Ramsay Health Care Limited Results Briefing Year ended 30 June 2018 Craig McNally, Managing Director & Bruce Soden, Group Finance Director 30 August 2018 ramsayhealth.com Agenda Group Performance Overview
RAMSAY HEALTH CARE REPORTS 17.7% RISE IN FULL YEAR CORE EPS AND 16.8% RISE IN CORE NET PROFIT
 ASX ANNOUNCEMENT 30 August 2016 RAMSAY HEALTH CARE REPORTS 17.7% RISE IN FULL YEAR CORE EPS AND 16.8% RISE IN CORE NET PROFIT Financial Highlights Core net profit after tax 1 (Core NPAT) up 16.8% to $481.4
FY 2013 Nippon Paint Group Analysts' Meeting for Financial Results of First Half FY 2013
 FY 2013 Nippon Paint Group Analysts' Meeting for Financial Results of First Half FY 2013 November 18, 2013 Nippon Paint Co., Ltd. Disclaimer The forward-looking statements in this document are based on
HALF YEAR REPORT February Leighton Holdings Limited
 HALF YEAR REPORT February 2009 PRESENTATION OUTLINE Results highlights Operational update Financial statements Strategy and outlook 2 Half Year Report I 12 February 2009 I RESULTS HIGHLIGHTS 3 Half Year
Whitehaven Coal Limited
 Whitehaven Coal Limited AUSTMINE Presentation by Paul Flynn, Managing Director and CEO SYDNEY, AUSTRALIA 1 OCTOBER 2015 Our goal To become Australia s leading independent coal company 2 // AUSTMINE - 1
23 February The Manager Market Announcements Australian Securities Exchange Limited 20 Bridge Street SYDNEY NSW 2000.
 Level 1 157 Grenfell Street Adelaide SA 5000 GPO Box 2155 Adelaide SA 5001 Adelaide Brighton Ltd ACN 007 596 018 Telephone (08) 8223 8000 International +618 8223 8000 Facsimile (08) 8215 0030 www.adbri.com.au
FY2015 2nd Quarter Business Results
 FY2015 2nd Quarter Business Results Project AH A MAY products Yamaha Corporation and Yamaha Motor Co., Ltd. make products by exchanging the design divisions and their design fields, and present a joint
For personal use only
 HELLOWORLD TRAVEL LIMITED RESULTS ANNOUNCEMENT Highlights for the year ended 30 June 2018 Total Transaction Value (TTV) growth of 3.5% to $6.1 billion, underpinned by strong air ticket sales volume growth.
Christopher Rex Managing Director 15 November 2011
 Christopher Rex Managing Director 15 November 2011 Agenda Overview What is important to us? FY 2011 Highlights - Group - Australia - United Kingdom - France Our Growth Strategy Brownfield Developments
M2 Group Ltd 2014 Interim Results
 M2 Group Ltd 2014 Interim Results 24 February 2014 Geoff Horth, CEO Presentation Content Record Financial Performance Strong Organic Growth FY14 Priorities and Guidance Slide 2, 24 February 2014 Record
Forward looking statements
 1 Forward looking statements This presentation contains forward-looking statements. Forward-looking statements often include words such as anticipate", "expect", "intend", "plan", "believe, continue or
QANTAS DELIVERS STRONG FIRST HALF RESULT DESPITE HIGHER FUEL BILL
 ASX and Media Release Sydney, 21 February 2019 QANTAS DELIVERS STRONG FIRST HALF RESULT DESPITE HIGHER FUEL BILL Underlying Profit Before Tax: $780 million (down $179 million) Statutory Profit Before Tax:
2003/04 Full Year Results Presentation to Investors
 2003/04 Full Year Results Presentation to Investors 19 August 2004 Geoff Dixon Chief Executive Officer Highlights 12 months to June 2004 12 months to June 2003 Increase/ (decrease) % Sales and operating
NuSep Half Year Profit Presentation
 FOR IMMEDIATE RELEASE NuSep Half Year Profit Presentation SYDNEY, AUSTRALIA 17 th February, 2010 NuSep (ASX: NSP) is pleased to provide an audio and powerpoint broadcast with Mr John Manusu and Dr Hari
INSPIRATIONSTRENGTHCOLOUR
 INSPIRATIONSTRENGTHCOLOUR BLUESCOPE STEEL LIMITED ANNUAL REPORT 2002/03 2 Chairman s Report 4 Managing Director and CEO s Report INSPIRATION 8 Company Profile 8 Brands 9 Operations 10 Operations Around
Annual Shareholder Meeting. 27 April 2017
 Annual Shareholder Meeting 27 April 2017 Agenda 1. Directors and proxies 2. Chairman s introduction 3. Chief executive s report 4. Resolutions 5. General business 2 Seeka Annual Shareholders Meeting April
BHP Billiton Limited Annual General Meeting 2016
 BHP Billiton Limited Annual General Meeting 2016 Disclaimer Forward-looking statements This presentation contains forward-looking statements, which may include statements regarding: trends in commodity
BHP Billiton Iron Ore Western Australia. Iron Ore. Presentation to Analysts June Ian Ashby, President and COO BHP Billiton Iron Ore
 BHP Billiton Western Australia Presentation to Analysts June 2005 Ian Ashby, President and COO BHP Billiton BHP Billiton Overview Record 53.6Mt of iron ore produced in the first half of FY2005 On target
Corporate Presentation 2012/13 Interim Results
 Corporate Presentation 2012/13 Interim Results 26 February 2013 0 Disclaimer The information contained in this presentation is intended solely for your personal reference. Such information is subject to
FOURTH QUARTER AND FULL-YEAR RESULTS February 2008
 FOURTH QUARTER AND FULL-YEAR RESULTS 2 1 February 2 AGENDA CEO review Financial review Operating review of Mobile Concluding remarks Harri Koponen Lars Nilsson Harri Koponen Harri Koponen 2 29-2-1 Fourth
For personal use only
 SMS Management & Technology Level 41 140 William Street Melbourne Victoria 3000 Australia T +61 1300 842 767 F +61 1300 329 767 www.smsmt.com Melbourne Sydney Brisbane Canberra Adelaide Hong Kong Vietnam
For personal use only HILLS HOLDINGS HALF YEAR RESULTS FY2013
 HILLS HOLDINGS HALF YEAR RESULTS FY2013 TODAY KEY HIGHLIGHTS OUR FY13 FIRST HALF RESULTS GROUP PERFORMANACE FIRST HALF NPAT 1 $8.2M IN LINE WITH NOVEMBER AGM GUIDANCE. STRONG MANAGEMENT OF WORKING CAPITAL
BlueScope Asia Day China Business. 29 June 2006
 BlueScope Asia Day China Business 29 June 2006 an integrated group of focused businesses Our Focus: derive maximum value from the growing China steel construction industry. The market will see improved
2016 Full-year Results Supplementary Information
 206 Full-year Results Supplementary Information Wednesday, 24 August 206 (to be read in conjunction with the 206 Full-year Results Briefing Presentation) Presentation outline Item Presenter Page Group
Results Briefing Half Year ended 31 December Christopher Rex Managing Director
 Results Briefing Half Year ended 31 December 2014 Christopher Rex Managing Director AGENDA 1. Group Operational and Financial Highlights 2. Segment Operational and Financial Highlights 3. Growth Strategy
Investor Briefings First-Half FY2016 Financial Results
 Cedar Woods Properties Limited Investor Briefings First-Half FY2016 Financial Results 26 February 2016 Cedar Woods Presentation 2 Snapshot of Achievements in FY2016 Extensive portfolio of residential estates
FAIRFAX MEDIA REPORTS NET PROFIT AFTER TAX OF $142.2 MILLION, UP 18.6%
 SYDNEY, 12 February, 2007: FAIRFAX MEDIA REPORTS NET PROFIT AFTER TAX OF $142.2 MILLION, UP 18.6% UNDERLYING NPAT OF $121.4 MILLION (PRE NON-RECURRING ITEMS) FOR THE SIX MONTHS TO 31 DECEMBER 2006 EBITDA
Citigroup Investor Conference October 2010
 Citigroup Investor Conference October 2010 Disclaimer Important information This presentation ti has been prepared in good faith, but no representation ti or warranty, express or implied, is made as to
MAINFREIGHT LIMITED FULL YEAR RESULT TO MARCH 2015
 MAINFREIGHT LIMITED FULL YEAR RESULT TO MARCH 2015 Result Summary NET SURPLUS Net surplus after tax and before abnormal items up 7.7% to $83.48 million REVENUE EBITDA Revenue up 6.8% to $2.05 billion Excluding
Q Earnings Financial Results for the Third Quarter Ended December 31, January 29, 2015 OMRON Corporation
 Q3 2014 Earnings Financial Results for the Third Quarter Ended December 31, 2014 January 29, 2015 OMRON Corporation Contents 1. Summary 2. Q1-Q3 Results P. 2 P. 4 3. Full-Year Forecast P. 13 4. Corporate
For personal use only
 LIMITED Investor Presentation August 2016 Chris Tuckwell Managing Director / CEO Peter Gilford CFO / Company Secretary CORPORATE SNAPSHOT Capital Structure Share price (as at 22 August 2016) $1.595 Ordinary
Virgin Australia Holdings Limited (ASX: VAH) H1 FY18 Results 1
 H1 FY18 Results 1") Virgin Australia Holdings Limited (ASX: VAH) H1 FY18 Results 1 Summary of H1 FY18 Group Outcomes 2 Group Underlying Profit Before Tax of $102.5 million up 142.3% Group Statutory Profit After Tax of $4.4
Virgin Australia Holdings Limited (ASX: VAH) H1 FY18 Results 1 Summary of H1 FY18 Group Outcomes 2 Group Underlying Profit Before Tax of $102.5 million up 142.3% Group Statutory Profit After Tax of $4.4
Media Release QANTAS RESULTS FOR THE HALF YEAR ENDED 31 DECEMBER 2004 HIGHLIGHTS. Fully franked interim dividend of 10 cents per share
 Media Release QANTAS RESULTS FOR THE HALF YEAR ENDED 31 DECEMBER 2004 HIGHLIGHTS Profit before tax of $601.3 million Net profit after tax of $458.4 million Revenue of $6.4 billion Fully franked interim
Final Dividend 7.0 cents per share, full year payout of 10.0
 KATHMANDU HOLDINGS LIMITED ASX/NZX/Media Announcement 21 September 2011 Kathmandu Holdings Ltd announces record sales and earnings result for FY2011: NZ$ Denominated Result Sales up 24.5% to $306.1m, EBIT
QANTAS HALF YEAR 2015 FINANCIAL RESULTS 1
 QANTAS HALF YEAR 2015 FINANCIAL RESULTS 1 Key points: Underlying Profit Before Tax: $367 million Statutory Profit After Tax: $206 million Transformation benefits: $374 million Comparable unit cost reduction:
2011 Annual General Meeting. Greg Robinson Managing Director & CEO
 2011 Annual General Meeting Greg Robinson Managing Director & CEO Disclaimer Forward Looking Statements These materials include forward looking statements. Forward looking statements inherently involve
2007/08 Interim Results
 Bossini International Holdings Limited 2007/08 Interim Results For the six months ended 31 December 2007 Corporate Presentation 19 March 2008 0 Agenda Results Highlights Review of Operations Future Plans
2017 Half-Yearly Results
 2017 Half-Yearly Results Presentation 4th August 2017 Agenda Speakers: Robert Wong, Chief Executive & Simon Dixon, Chief Financial Officer 1. 2017 Half-Yearly Highlights 2. Investment Properties 3. Development
An Overview of SATS. Cho Wee Peng, CFO SIAS Corporate Profile & Investment Seminar 30 November 2013
 An Overview of SATS Cho Wee Peng, CFO SIAS Corporate Profile & Investment Seminar 30 November 2013 Forward Looking Statements This presentation may contain forward-looking statements regarding, among other
2007/08 Full Year Results Investor Briefing
 2007/08 Full Year Results Investor Briefing Highlights of Result Profit before tax up 46% to $1,408 million Up 36% on the reported result Margin improvement $3 billion of Sustainable Future Benefits achieved
PAN PACIFIC HOTELS GROUP LIMITED 2010 FULL YEAR RESULTS BRIEFING 22 FEB 2011
 PAN PACIFIC HOTELS GROUP LIMITED 2010 FULL YEAR RESULTS BRIEFING 22 FEB 2011 2010 RESULTS OVERVIEW STRATEGIC & OPERATIONS HIGHLIGHTS NEO SOON HUP CHIEF FINANCIAL OFFICER 2 CONTENTS Focus and Highlights
Media Release. Qantas Group Full Year 2017 Financial Result 1. Sydney, 25 August 2017
 Media Release Qantas Group Full Year 2017 Financial Result 1 Sydney, 25 August 2017 Underlying Profit Before Tax: $1,401 million (second highest in Qantas history) Statutory Profit Before Tax: $1,181 million
Christopher Rex, Managing Director
 Christopher Rex, Managing Director AGENDA FY2013 Year in Review Delivering on our Growth Strategy Development Update Outlook 2 3 RAMSAY HEALTH CARE 121 hospitals in five countries Circa 12,000 beds Employs
2012 Result. Mika Vehviläinen CEO
 2012 Result Mika Vehviläinen CEO 1 Agenda Market environment in Q4 Business performance and strategy execution Outlook Financials 2 Market Environment According to IATA, Global air travel continues to
Financial overview. Adjusted operating cash flow* Annual dividend (excluding special dividend) Dollar movement. Percentage
 Dollar movement. Percentage") 1 Financial overview June 2007 June 2006 Dollar movement Percentage movement Operating revenue $4,297m $3,805m $492m 13% PBUT $268m $150m $118m 79% NPAT $214m $96m $118m 123% Adjusted operating cash flow*
1 Financial overview June 2007 June 2006 Dollar movement Percentage movement Operating revenue $4,297m $3,805m $492m 13% PBUT $268m $150m $118m 79% NPAT $214m $96m $118m 123% Adjusted operating cash flow*
Land area 1.73 million km 2 Queensland population (December 2015) Brisbane population* (June 2015)
 Brisbane population* (June 2015)") Queensland - 18 Queensland OVERVIEW Queensland is nearly five times the size of Japan, seven times the size of Great Britain, and two and a half times the size of Texas. Queensland is Australia s second
Queensland - 18 Queensland OVERVIEW Queensland is nearly five times the size of Japan, seven times the size of Great Britain, and two and a half times the size of Texas. Queensland is Australia s second
Outlook: FY13 EBITDA guidance $28M - $29M. Pursuing contracted 300MW in 2013 growth strategy. FY13 maiden franked dividend payment expected
 ASX CODE PEA ISSUED CAPITAL Ordinary Shares 360.8M Options 10.7M KPS CONTRACTED CAPACITY 240MW HYDRO CONTRACTED CAPACITY 6MW 14 February 2013 STRONG ORGANIC GROWTH UNDERPINS RECORD PACIFIC ENERGY RESULT
2011 Full Year Result
 2011 Full Year Result 23 February 2012 CEO Brett Chenoweth CFO Peter Myers 1 Financial results for 2011 FY 2011 AUD millions 2011 2010 Δ% Revenue 1,072.4 1,059.1 1% EBITDA* 208.9 244.3 (14%) EBIT* 171.4
Ramsay Health Care Limited RESULTS BRIEFING Year ended 30 June 2016
 Ramsay Health Care Limited RESULTS BRIEFING Year ended 30 June 2016 Christopher Rex, Managing Director 30 August 2016 ramsayhealth.com Agenda 1. Group Operational and Financial Highlights 2. Segment Operational
USA Acquisition Summary. December 2010
 USA Acquisition Summary December 2010 www.roadbearrv.com Strategic Intent 1. To leverage the existing business capabilities in a significant sized and growing tourism market with a similar customer base.
QANTAS RESULTS FOR THE YEAR ENDED 30 JUNE 2000 HIGHLIGHTS. Net profit before tax of AUD$762.8 million, up AUD$100.3 million, 15 percent on last year
 QANTAS RESULTS FOR THE YEAR ENDED 30 JUNE 2000 HIGHLIGHTS Net profit before tax of AUD$762.8 million, up AUD$100.3 million, 15 percent on last year Net profit after tax of AUD$517.9 million, up AUD$97
FIRST QUARTER
 FIRST QUARTER 2007 1 WELCOME TO REZIDOR one of the fastest growing hotel companies in the world 300 250 200 150 100 FAST TRACK GROWTH FRESH & DYNAMIC MULTI-BRAND PORTFOLIO BRAND SEGMENT HOTELS ROOMS Upscale
Introduction Financials The Market Honey Supply Beekeeping Enterprise Outlook
 Introduction Financials The Market Honey Supply Beekeeping Enterprise Outlook Capilano is the market leader of honey in Australia. It was established in 1953 as a 100% beekeeper owned co-operative. Historically
Tiger Airways Holdings Limited FY11 Results
 Tiger Airways Holdings Limited FY11 Results May 2011 Financial Year Ended 31 March 2011 Disclaimer The information contained in this presentation (the "Information") is provided by Tiger Airways Holdings
Results Presentation 27 May 2008
 Yongmao Holdings Limited Results Presentation 27 May 2008 Agenda About Yongmao FY08 Performance Review Outlook & Strategy 2 Company Overview Leading designer and manufacturer of tower cranes and accessories
Corporate Presentation 2015/16 Interim Results
 Corporate Presentation 2015/16 Interim Results 24 February 2016 0 Disclaimer The information contained in this presentation is intended solely for your personal reference. Such information is subject to
Crown Resorts Limited
 Crown Resorts Limited 2016 Half Year Results Presentation 25 February 2016 1 Crown Resorts Limited Results Overview Crown Resorts Limited (Crown) performance: The 2016 First Half results across Crown s
AGENDA. Group overview. Financial highlights. Operational highlights. Expansion plans
 1 AGENDA Group overview Financial highlights Operational highlights Expansion plans 2 3 CURRENT FOOTPRINT Kenya 12 stores 2 DCs Tanzania 2 stores Number of stores 31-Dec-16 31-Dec-17 Increase: Dec-16 to
Thank you for participating in the financial results for fiscal 2014.
 Thank you for participating in the financial results for fiscal 2014. ANA HOLDINGS strongly believes that safety is the most important principle of our air transportation business. The expansion of slots
The Qantas Group A Strong, Sustainable Future Alan Joyce, CEO Qantas Airways. Macquarie Australia Conference 4 May 2012
 The Qantas Group A Strong, Sustainable Future Alan Joyce, CEO Qantas Airways Macquarie Australia Conference 4 May 2012 Overview Fleet renewal now substantially complete FY13 capital expenditure reduced
Crown Resorts Limited
 Crown Resorts Limited Annual General Meeting 20 October 2016 1 Presentation Outline F16 Year in Review 2 Crown Resorts Limited Group Result F16 Normalised $m F15 Normalised $m Variance F/(U) F16 Actual
Finnair Group Interim Report 1 January 30 September 2008
 Finnair Group Interim Report 1 January 30 September 2008 1 31/10/2008 Presentation name / Author Airline industry at a historical turning point Expensive fuel price in the beginning of 2008 has dramatical
2008/09 Interim Results For the six months ended 31 December 2008
 Bossini International Holdings Limited 2008/09 Interim Results For the six months ended 31 December 2008 Corporate Presentation 18 March 2009 0 0 Disclaimer The information contained in this presentation
Record Result. 2006/07 Full Year Results Investor Presentation. Moved on successfully following bid. Profit before tax % to $1,032 million
 2006/07 Full Year Results Investor Presentation August 16 2007 Record Result Moved on successfully following bid Profit before tax + 53.8% to $1,032 million Group returning above Cost of Capital 2 Key
Corporate Presentation
 Corporate Presentation 2010/11 Interim Results 22 February 2011 Bossini International Holdings Limited 堡獅龍國際集團有限公司 Disclaimer The information contained in this presentation is intended solely for your
LOCATED AT THE GATEWAY OF THE TROPICAL PROVINCE, RIDING ON THE GROWTH MOMENTUM OF THE COUNTRY, WE ARE ON THE RIGHT TRACK OF TAKING OFF.
 LOCATED AT THE GATEWAY OF THE TROPICAL PROVINCE, RIDING ON THE GROWTH MOMENTUM OF THE COUNTRY, WE ARE ON THE RIGHT TRACK OF TAKING OFF. MANAGEMENT DISCUSSION INDUSTRY REVIEW Civil Aviation Industry in
ANNUAL GENERAL MEETING 22 November 2005
 ANNUAL GENERAL MEETING 22 November 2005 CHAIRMAN S OVERVIEW FY 2005 Year of transition, Affinity acquisition doubles size of company Affinity acquisition most exciting development in Ramsay history welcomed
PIPE Networks Limited 2008 Annual General Meeting
 27 October 2008 ASX RELEASE PIPE Networks Limited 2008 Annual General Meeting In accordance with Listing Rule 3.13.3, please find attached copies of the presentations to be provided today at the third
For personal use only
 Ramsay Health Care Limited Annual General Meeting 12 November 2015 Christopher Rex, Managing Director AGENDA 1. Operational and Financial Highlights 2. Group Operations 3. Growth Strategy Update 4. Outlook
Q3 FY18 Business Highlights
 Q3 FY18 RESULTS Q3 FY18 Business Highlights 1 2 3 4 5 6 7 Record passengers 7.1m, record revenues 423m Investing in growth 24% passenger growth in Q3 Disciplined cost management flat ex-fuel CASK Largest
BORAL ANNUAL GENERAL MEETING 2011
 BUILDING SOMETHING GREAT TM BORAL ANNUAL GENERAL MEETING 2011 Dr Bob Every, Chairman 3 November 2011 1 1 Dr Bob Every Annual General Meeting 2011 FINANCIAL HIGHLIGHTS - Continuing operations $4.7bn up
Investor Meeting Presentation. 4 June 2014
 Investor Meeting Presentation 4 June 2014 COMPANY OVERVIEW 1Q2014 RESULTS OVERVIEW OPERATION HIGHLIGHTS Q&A 2 Founded in 1963, listed on the Singapore Exchange in 1964 Three core businesses: - Property
Interim Report 3m Bilfinger Berger SE, Mannheim May 10, 2012 Joachim Müller, CFO
 Interim Report 3m 2012 Bilfinger Berger SE, Mannheim May 10, 2012 Joachim Müller, CFO Bilfinger Berger SE Interim report 3m 2012 May 10, 2012 Page 1 3m 2012: Highlights Growth in output volume and orders
Q Earnings Financial Results for the First Quarter Ended June 30, July 28, 2016 OMRON Corporation
 Q1 2016 Earnings Financial Results for the First Quarter Ended June 30, 2016 July 28, 2016 OMRON Corporation Summary Q1 Results Both sales and operating income are in line with internal plan (decreased
A n n u a l R e s u l t s
 2 0 1 3 A n n u a l R e s u l t s 27 February 2014 Overview Accounting Sales up 3%. Global Brand Sales down 2%. Sales mainly decline in China, Taiwan and Singapore offset by growth in other markets, particularly
Minara Resources Limitedit Sydney February Peter Johnston
 Minara Resources Limitedit Sydney February 2008 y y y Peter Johnston Important t Notice This presentation contains certain statements which may constitute forward-looking statements. Such statements are
Recovery on track, continued strengthening in most segments. Record Jetstar and Frequent Flyer earnings highlight value of portfolio
 Qantas Full Year 2010 Results Presentation Overview Underlying PBT 1 more than tripled to $377m in line with guidance Delivering against strategic priorities Recovery on track, continued strengthening
Blackmores Limited Presentation to Goldman Sachs Emerging Companies Conference 15 May 2013
 Blackmores Limited Presentation to Goldman Sachs Emerging Companies Conference 15 May 2013 Welcome Chris Last Chief Financial Officer Blackmores Limited Our Proud Pioneer Heritage Blackmores has been an
Crown Resorts Limited
 Crown Resorts Limited 2015 Full Year Results Presentation 13 August 2015 1 Crown Resorts Limited Results Overview Crown Resorts Limited (Crown) performance: Overall, the results for Crown s portfolio of
Minor International Public Company Limited
 Minor International Public Company Limited Management Discussion & Analysis MINT s financial performance as of 30th June 2008 Summary of Key Financial Performance 2Q08 Performance Minor International Public
KERRIE MATHER MANAGING DIRECTOR AND CHIEF EXECUTIVE OFFICER. Macquarie Conference 4 MAY 2016
 KERRIE MATHER MANAGING DIRECTOR AND CHIEF EXECUTIVE OFFICER Macquarie Conference 4 MAY 2016 Disclaimer General securities warning This presentation has been prepared by Sydney Airport Limited (ACN 165
The Laminex Group Laminates & Panels. Investor Presentation October 2009 David Worley, Chief Executive Laminex
 The Laminex Group Laminates & Panels Investor Presentation October 2009 David Worley, Chief Executive Laminex Disclaimer 2 This presentation contains not only a review of operations, but also some forward