Public Perception Survey of Wildness in Scotland
|
|
|
- Meredith Jefferson
- 5 years ago
- Views:
Transcription
1 Public Perception Survey of Wildness in Scotland Report for Loch Lomond & The Trossachs National Park Authority, Cairngorms National Park Authority & Scottish Natural Heritage In Association With Research Now July 2012
2 Document Control Project Title: MVA Project No: Document Type: Directory & File Name: Public Perceptions of Wildness C3A650/00 Final Report H:\Contracts\Live\C3A65000_Public Perceptions Of Wildness\Final Report\ Final Report V9.Doc Document Approval Primary Author: Other Author(s): Reviewer(s): Formatted by: Elaine Wilson Smith Jon Crockett and Shirley McCoard David Connolly Nicola Milne Distribution Issue Date Distribution Comments 1 09/03/2012 David Connolly Draft for Review 2 09/03/2012 Steering Group Draft for Review (V3) 3 29/03/2012 David Connolly Draft 2 for Review 4 9/04/2012 Steering Group Draft 2 for Review (V6) 5 16/05/2012 David Connolly Final Report for Review 6 31/05/2012 Steering Group Final Report Delivered (V8) 7 18/07/2012 Steering Group Final Report (V9) This report, and information or advice which it contains, is provided by MVA Consultancy Ltd solely for internal use and reliance by its Client in performance of MVA Consultancy Ltd s duties and liabilities under its contract with the Client. Any advice, opinions, or recommendations within this report should be read and relied upon only in the context of the report as a whole. The advice and opinions in this report are based upon the information made available to MVA Consultancy Ltd at the date of this report and on current UK standards, codes, technology and construction practices as at the date of this report. Following final delivery of this report to the Client, MVA Consultancy Ltd will have no further obligations or duty to advise the Client on any matters, including development affecting the information or advice provided in this report. This report has been prepared by MVA Consultancy Ltd in their professional capacity as Consultants. The contents of the report do not, in any way, purport to include any manner of legal advice or opinion. This report is prepared in accordance with the terms and conditions of MVA Consultancy Ltd s contract with the Client. Regard should be had to those terms and conditions when considering and/or placing any reliance on this report. Should the Client wish to release this report to a Third Party for that party's reliance, MVA Consultancy Ltd may, at its discretion, agree to such release provided that: (a) MVA Consultancy Ltd's written agreement is obtained prior to such release, and (b) by release of the report to the Third Party, that Third Party does not acquire any rights, contractual or otherwise, whatsoever against MVA Consultancy Ltd and MVA Consultancy Ltd, accordingly, assume no duties, liabilities or obligations to that Third Party, and (c) MVA Consultancy Ltd accepts no responsibility for any loss or damage incurred by the Client or for any conflict of MVA Consultancy Ltd's interests arising out of the Client's release of this report to the Third Party.
3 Contents Executive Summary i 1 Introduction Introduction Aims and Objectives Methodology Survey Administration Questionnaire Design Analysis Research Caveats and Reporting Conventions Sample Profile Sample Size Sample Profile Use of the Outdoors Most Wild Place Visited Organisation Membership Visits to the Outdoors Resident s Employment within the National Parks Perceptions of Wildness Appropriateness of Wildness Attributes Attribute Weighting by Attribute Type Attribute Weighting for all Attributes Allocating Weights to the Five Attribute Categories Importance of Scotland s Wild Areas Importance of Wild Areas Wild Areas Under Threat Preserving Wild Areas Importance of Protecting Wild Areas Importance of Promoting Economic Development Importance of Protecting Wild Areas Vs Promoting Economic Development Conclusions/Recommendations Conclusions Recommendations 7.3 Public Perception Survey of Wildness in Scotland 1
4 Contents Tables Table 2.1 Example Scenario 2.3 Table 3.1 Sample Size 3.1 Table 4.1 Organisation Membership 4.2 Table 4.2 Outdoor Activities Participated in within the Last 12 Months 4.4 Table 4.3 All Residents Employment Sector Within the National Parks 4.6 Table 5.1 Impact of Perceived Naturalness 5.9 Table 5.2 Impact of Man-Made Artefacts 5.10 Table 5.3 Wildness Values for the Wildlife Attributes 5.12 Table 5.4 Wildness Values for Different Levels of Remoteness 5.13 Table 5.5 Impact of Terrain 5.14 Table 5.6 Overall Attribute Rankings 5.16 Table 5.7 Top 3 and Bottom 3 Attributes 5.18 Table 5.8 Top and Bottom Attributes in each Category 5.21 Table 5.9 Range of Wildness Scores for each Attribute Category 5.22 Table 6.1 Actions to preserve wild areas 6.5 Table 7.1 Suggested Weights for each Wildness Attribute Category 7.3 Figures Figure 2.1 Example Picture Card 2.4 Figure 4.1 Frequency of Visits to the Outdoors in the Last 12 Months 4.3 Figure 4.2 Frequency of Visits to National Parks (Main Sample) 4.5 Figure 5.1 Ability of the Four Main Attributes to Cover Wildness 5.7 Figure 5.2 Wildness Scores for Perceived Naturalness by Sub-Sample 5.9 Figure 5.3 Wildness Scores for Man-Made Features by Sub-Sample 5.11 Figure 5.4 Wildness Scores for Wildlife Attributes 5.12 Figure 5.5 Wildness Scores for Remoteness by Sub-Sample 5.13 Figure 5.6 Wildness Scores for Terrain by Sub-Sample 5.15 Figure 5.7 Attributes with Above-Average Wildness Scores by Sample Type 5.19 Figure 5.8 Attributes with Below-Average Wildness Scores by Sample Type 5.20 Figure 5.9 Range of Wildness Scores for each Attribute Category 5.22 Figure 6.1 Importance of Wild Areas 6.1 Figure 6.2 Wild Areas Under Threat 6.3 Figure 6.3 Action Required to Preserve Wild Areas 6.4 Figure 6.4 Actions to Preserve Wild Areas by Main Sample 6.6 Figure 6.5 Importance of Protecting Wild Areas 6.7 Figure 6.6 Importance of Promoting Economic Development 6.8 Figure 6.7 Comparing Importance of Protecting Wild Areas and Promoting Economic Development 6.9 Appendices Appendix A Appendix B Appendix C Appendix D Appendix E Survey Questionnaire Supporting Picture Cards List of Key Attributes Detailed Analysis Methods Demographic Profiles of Respondents Public Perception Survey of Wildness in Scotland 2
5 Executive Summary Introduction Loch Lomond and the Trossachs National Park Authority (LLTNPA), working in partnership with the Cairngorms National Park Authority (CNPA) and Scottish Natural Heritage (SNH) commissioned a survey to further develop their understanding of the public perception of wildness in Scotland and to support future wildness mapping by providing a set of weights which can be used to combine the various attributes associated with the Scottish public s perception of wildness. The Study has focussed on the following four attribute categories: the naturalness of the land cover and wildlife; the presence of man-made structures and features; remoteness from roads and railway stations; and the terrain. Methodology Three sample groups were identified for inclusion within the research: 1006 responses from a nationally representative sample of the Scottish population, contacted via an online panel and asked to complete the survey on-line (ie the main sample ); a face-to-face booster survey which obtained responses from 210 National Park residents (ie the residents sample ); and a (self-selecting) subset of 656 Scottish-based members of various relevant organisations (John Muir Trust, Scottish Mountaineering Council, etc) which were invited to participate (via the on-line version of the survey) (ie the organisation members ). The survey covered use of the outdoors, perceptions of wildness, the importance of wild areas in Scotland and basic demographics. In addition to the questionnaire, visual stimuli were provided to illustrate the various attributes being described. Key Results Use of the Outdoors Overall, 38% (n=387) of respondents in the main sample indicated that they visited the outdoors at least once a week, while only 6% (n=65) indicated that they never make such visits. Both the residents sample and organisation members visited the outdoors more frequently, with 54% of the residents sample and 81% (n=531) of organisation members visiting at least once a week. Of those in the main sample who had visited the outdoors within the last 12 months, the main activities participated in included low level walking (87%), sightseeing/visitor attractions (52%), and family days out (51%). Public Perception Survey of Wildness in Scotland i
6 Summary Perceptions of Wildness Respondents were introduced to the four key wildness attribute categories outlined above. 29% of the main sample felt these captured the essence of wildness Very Well, with a further 66% indicating that they captured wildness Quite Well. Respondents identified the following additional aspects which contribute towards their perceptions of wildness: a lack of people, not meeting other people in the area, a sense of loneliness and isolation (n=71); wildlife (n=66); natural or unspoiled beauty and beautiful scenery (n=37); and the weather (n=29). A Best/Worst experiment was used to enable the respondents to rank the wildness impacts of a set of 25 individual attributes. Mathematical analysis of this set of responses suggested that attributes such as the presence of native wildlife, noticeable features in the landscape (such as cliff faces and boulder fields) and perceived naturalness of vegetation all achieve high wildness scores, while attributes such as the presence of built-up areas, energy infrastructure (eg wind turbines, pylons, dams etc) and recreational infrastructure (eg 4-wheel drive tracks, hiking paths, ski lifts and field sports) all have a strong negative impact on perceived wildness. The presence of native wildlife appears to contribute most to the main sample s and the residents sample s perceptions of wildness and came fifth in the ranking of organisation members, who felt that the complete absence of visible man-made features was the most important wildness factor. Note that since the experiment combined all native wildlife into a single attribute, additional research would be required to estimate the wildness impacts of different types of native wildlife. At the other end of the scale, built-up areas (small towns and villages) reduces perceived wildness by the most for both the main sample and the organisation members, while energy infrastructure in the landscape has the biggest negative impact on the perception of wildness for the residents sample. Additional analysis of the range of wildness scores within each main attribute category was used to derive weights which can be used in future to combine any measures of wildness which have been calculated using the broad attribute categories considered here. Importance of Scotland s Wild Areas 72% of the main sample, 83% of the residents sample and 93% of the organisation members considered that it was Very Important that Scotland had wild areas. 60% of the main sample, 55% of residents sample and 92% of the organisation members stated that they felt wild areas were under threat in Scotland. 77% of the main sample, 82% of the residents sample and 93% of organisation members stated that it was Very Important to protect wild areas in Scotland. Public Perception Survey of Wildness in Scotland ii
7 Summary 86% of the main sample, 80% of the residents sample and 97% of organisation members felt that further action is necessary to preserve wild land in Scotland. The most popular types of action to preserve wild land, identified by over a third of respondents in the main sample, were: the introduction of specific 'wild land' designation; effective planning control for wind turbines; effective planning control for buildings; effective planning control for telephone masts and pylons; and species re-introductions. When asked to indicate how important it is to promote economic development in rural areas of Scotland, 31% of the main sample, 50% of the residents sample and 32% of organisation members felt it was very important to promote economic development in rural areas of Scotland. Comparing the mean scores for the importance of protecting wild areas and promoting economic development shows that, across all three sample groups, respondents placed a greater level of importance on the protection of wild areas than economic development. Conclusions and Recommendations The study has confirmed the validity of the four main attribute categories identified by previous research, but has suggested that these categories should be given different weights within the public s overall perception of wildness. The analysis of the results from the Best/Worst choice process used in the study has produced robust estimates of the average wildness impacts of a set of 25 individual attributes. In addition, the analysis has suggested that there are non-trivial differences in the wildness scores given to these attributes by the different population groups surveyed here. In particular, the organisation members included in this research tended to assign more-extreme wildness scores across all of the categories, while the residents sample tend to assign less negative wildness impacts to attributes such as modern structures, recreation infrastructure and built-up areas than the other two groups. These differences should be borne in mind when endeavouring to understand the attitudes of different sub-groups. However, it is recommended that the results from the main sample reported here should provide the default values for general future wild-land mapping in Scotland. Older built structures (defined here as bothies, abandoned cottages, crofts, castles and stone walls )) actually appear to have a positive wildness score (ie score more-highly than the average wildness attribute) for all three sample groups. Care is therefore required when combining built structures within wildness mapping. Additional research would be required to determine the wildness impacts of the various different sub-categories within this older built structures attribute. Public Perception Survey of Wildness in Scotland iii
8 Summary The attribute described in this study as Energy Infrastucture (which therefore includes a combination of wind-turbines, electricity pylons and hydroelectric dams) was given very high negative wildness scores (second only to Built up Areas, Small Towns and Villages in the main sample.). It would therefore be useful to consider further research to enable this combined attribute to be separated into its different components, especially if the resulting wildness values are to be used as part of the consideration of future planning processes for wind turbines, pylons and/or hydroelectric schemes. Finally, the best-worst (most wild/least wild) approach used here could be extended to include additional monetary trade-offs (eg increases to taxation or visitor charges to protect or enhance particular attributes). Such additional research could facilitate a monetary valuation of the features which add to the general public s perception of Scotland s wildness and would add important additional evidence for the protection (or creation) of these features. Public Perception Survey of Wildness in Scotland iv
9 1 Introduction 1.1 Introduction Loch Lomond and the Trossachs National Park Authority (LLTNPA), working in partnership with the Cairngorms National Park Authority (CNPA) and Scottish Natural Heritage (SNH) commissioned a survey to further develop their understanding of the public perception of wildness in Scotland A technique for mapping wildness has been developed by Leeds University which identifies the geographical extent and intensity of wildness. This approach has been used to map wildness in the Cairngorms and Loch Lomond and the Trossachs National Parks. This technique can produce maps based on any individual wildness attribute, but can also combine these to create an overall wildness map. The result is a range of wildness maps which can better inform management and planning for different stakeholder groups or for different purposes such as planning, access, habitat restoration, etc SNH undertook a previous study conducted in into the public s perceptions of wild land which aimed to quantify consumer opinion regarding the wildness of Scotland and of the Cairngorm National Park. This previous research was not designed to provide weighting for the different attributes required for the wildness mapping. This current research is therefore designed to extend the previous research by providing these attributes weights for the ongoing wildness mapping In addition to this public perceptions research, an event was held with various public bodies and expert organisations where the perceptions of wildness, and measurement of each wildness attribute s impact upon perceptions was also assessed. Results from this event can be found on the SNH website Aims and Objectives The overall project aim was to provide quantitative data on the public s perception of wildness, wild land, and perceived naturalness of land cover in Scotland The specific objectives included: identifying what people understand to be wild land ; identifying which elements of the landscape and the land-cover people consider to be natural or wild and which they consider to be not, or less wild; and identifying the impact of human artefacts in the landscape (eg wind turbines, hill tracks, etc). 1 Market Research Partners (2008) Public Perceptions of Wild Places and Landscapes in Scotland. Commissioned Report No. 291 (ROAME No. F06NC03). 2 Public Perception Survey of Wildness in Scotland 1.1
10 1 Introduction In addition, the results of this research will be used to support the wildness mapping already undertaken for Loch Lomond and the Trossachs National Park and the Cairngorms National Park, and underway for Scotland, by providing a set of weights which can be used to combine the various attributes associated with the Scottish public s perception of wildness into single combined wildness maps. The attributes which need to be combined in this way are: the naturalness of the land cover and wildlife; the presence of man-made structures and features; remoteness from roads and railway stations; and the terrain The research also aims to explore the weighting of the above attributes in relation to each other. Public Perception Survey of Wildness in Scotland 1.2
11 2 Methodology 2.1 Survey Administration One of the key considerations for the survey design was the various sampling requirements. These included: a main sample which is nationally representative of the Scottish population, (which will be referred to as the main sample throughout); a booster survey of National Park residents, (referred to as the residents sample throughout); and a comparison group made up of members of various outdoors, wildlife, environmental, and conservation type organisations in Scotland who may have different views about (and awareness of) the issues surrounding wildness than general public at large. (This sample group will be referred to as the organisation members throughout) A mixed method approach was designed in order to target sufficient numbers of respondents within each of the desired sample groups. This included an online survey utilising an online panel designed to be representative of the Scottish population and members of various organisations, and a face-to-face booster survey of residents of Scotland s two National Parks. Online Survey An online questionnaire was designed to be distributed to both a representative sample of the Scottish population and to members of various selected organisations. Using an online approach allowed the incorporation of visual stimuli to support and illustrate some of the terms and concepts being considered An online panel was accessed via Research Now, where all members have registered to complete such surveys. Demographic information is also held on panel members allowing the sample to be structured so that it is representative of the Scottish population. Quotas were set for gender, age, socio-economic group, urban/rural location and Local Authority The same questionnaire was made available to members of selected organisations. These organisations were informed about the research and asked to invite their Scottish based members to complete the questionnaire. A link was sent to members directly from the organisations and/or included on the organisations website/online newsletter/etc. The following organisations were sent information on the survey: Scottish Mountaineering Club; Mountaineering Council of Scotland; John Muir Trust; Royal Society for the Protection of Birds (RSPB); Ramblers; National Trust for Scotland; Scottish Wildlife Trust; Woodland Trust; Public Perception Survey of Wildness in Scotland 2.1
12 2 Methodology Trees for Life; and Scottish Wild Land Group Security was added to the online questionnaire so that, once a panel member or organisation member had completed the survey, they could not re-access it and make multiple submissions. Booster Survey with National Park Residents As the online panel approach was unlikely to include many respondents that happened to live within the two National Parks, a face-to-face booster approach was used to survey the views of this group. The questionnaire was, therefore, adapted to be suitable for a face-to-face interviewer administered approach. A mixture of on-street and household interviews were conducted over a three week period in February Various sample points were selected within the boundaries of each National Park, generally located in the largest towns and villages within the two Parks. Quotas were set for gender and age, to help ensure this booster was broadly representative of the resident populations of each park Interviews were conducted over a mix of weekdays and weekends, covering early mornings and evenings to ensure that employed residents were not under-represented in this booster survey. 2.2 Questionnaire Design One questionnaire was designed to be used across all administration methods and with each target sample. Topics covered use of the outdoors; perceptions of wildness, to include coverage of the four key wildness attributes; the importance of wild areas in Scotland; as well as basic demographics A copy of the questionnaire is provided in Appendix A. Best/Worst Scaling In order to assess respondents perceptions of wildness and to provide weighted ranking between the various attributes, a best/worst scaling approach was used Respondents were provided with an introduction to this section of the questionnaire, including the provision of an overview of the four key attributes and provided with the opportunity to identify others that they considered important when considering wildness Various sub-divisions within the four key attributes were identified (these are listed in Appendix C). These were then mixed across 25 best/worst ranking tables so that each table contained a mix of sub-divisions from each of the four attributes. A block design method was used to minimise the input of each participant. This required each respondent to complete five of the best/worst ranking scenarios, chosen systematically from a total set of 25 scenarios An example of one of the scenarios is provided below while an example picture card is provided in Figure 2.1: Public Perception Survey of Wildness in Scotland 2.2
13 2 Methodology Table 2.1 Example Scenario Scenario A1 Picture Card A No visible man-made features 1 B Area heavily managed, made up of parks and gardens, and/or intensive stock grazing 10 C Moorland, actively managed by burning 21 D E Landscape has one or two noticeable features (such as lochs), but is generally of low altitude and is easy to move around Native wildlife may be present in landscape, eg deer, eagle, red squirrel, wild cat, pine marten For each scenario respondents were required to identify: the most wild ; the least wild ; the next/second most wild ; and the the next/second least wild Before being presented with these scenarios, respondents were taken through an example. Visual Stimulus Material To support the best/worst scaling scenario options presented to respondents, considerable time and effort was spent in identifying a range of pictures and images which could be presented as examples of each option. Particular care and attention was taken to ensure that each image selected only showed the key attributes and did not contain any biasing factors. For example: four or five images were shown for each option presented so that respondents were not simply commenting on perceptions created by one single image; all images were subject specific, for example pictures of moorland did not contain any traces of plantation forests, manmade artefacts such as tracks/fences, etc any wildlife/domestic livestock or manmade objects/tracks in the pictures were displayed at an equal distance so that no one element dominated the picture unduly and so that no one image dominated the selection presented; and the weather was neutral throughout so that perceptions were not biased by particularly dominant cloud coverage, snow or other inclement weather Figure 2.1 provides an example of the Picture Cards used to support and illustrate the attribute descriptions, whilst the full range of Picture Cards can be found in Appendix B. These Picture Cards were provided as A4 showcards for the face-to-face survey method used to capture the residents sample, and were shown as full screen images within the online version of the questionnaire used to capture the main sample and the organisation members. Public Perception Survey of Wildness in Scotland 2.3
14 2 Methodology Richard Webb No visible manmade features Figure 2.1 Example Picture Card 2.3 Analysis The results have been disaggregated by: Sample Type: the main sample (ie the online panel sample representative of the Scottish population); the organisation members (ie the sample invited via the relevant organisation s); and the residents sample (ie the booster sample of National Park residents). for the main sample only, market segmentation is provided by: gender; age; urban/rural location; and socio-economic group. Public Perception Survey of Wildness in Scotland 2.4
15 2 Methodology Only those differences between sample types and market segments that show a statistically significant difference have been identified separately in the reporting A mathematical behavioural choice model was used to analyse the results of the various best/worst scenarios where respondents identified and ranked the most to least wild. For this, each preference on the best-worst scale for a given scenario was converted into an equivalent choice3. Statistical analysis of this nature is based on the concept of utility theory (the degree of satisfaction provided by the alternatives on offer). Individuals are assumed to choose the alternative which is best (or wildest ) and therefore maximises satisfaction or utility, where utility is taken to be a construct of the choice alternative (the attributes of wildness). By comparing the relative influence of one attribute against another, through the parameters which result from the statistical models, it is possible to infer its relative value (or contribution to wildness) Estimated models have been subject to a full set of diagnostic tests to ensure they are statistically robust. This includes an examination of their overall level-of-fit, precision in parameter estimation and consideration of correlation between attributes and alternatives A more detailed and technical description of the analysis methods used is provided in Appendix D. 2.4 Research Caveats and Reporting Conventions It is important to note that this research was designed to test people s perception of wild land, and as such, there will be exceptions to the results expressed here It is also important to note that, respondents were only able to comment based on those images and scenarios shown, and based on their own personal experience Where sample sizes were small, some demographic categories have been grouped for analysis purposes, these include: age (ie age 75+ has been grouped with age 60-74); the initial six-way urban rural classification has been reduced to two categories (ie urban and rural); and socio-economic group was combined to two categories (ie ABC1 and C2DE) The urban/rural classification of the respondent s home was self-reported, ie was based upon their own assumptions of where they live. Therefore, results may not be exactly equivalent to the official Scottish Government classification For clarity, it was considered that the main sample (ie the online panel sample representative of the Scottish population) should be the most important for analysis purposes. As such, the residents sample and organisation members are provided mainly for comparison purposes. Further, any dissagregation by the various market segments has only been conducted on the main sample, and is only discussed where statistically significant differences exist between the categories. 3 As respondents progress through a best-worst scaling task in a given scenario, alternatives selected at previous stages are removed from the choice set available at subsequent stages in the statistical analysis. Public Perception Survey of Wildness in Scotland 2.5
16 2 Methodology Where the proportion of respondents equals less than 1%, this is indicated in tables by <1%. Where no respondents have selected a response option this is indicated by -. This enables the reader to distinguish between low non-zero response frequencies and true zero values. Public Perception Survey of Wildness in Scotland 2.6
17 3 Sample Profile 3.1 Sample Size As outlined above, three separate samples were collected within this research. Table 3.1 provides details of the total sample sizes achieved for each. Table 3.1 Sample Size Sample Type Respondents Percent (%) Main Sample (ie Online Survey: Scottish Representative Sample) Organisation Members (ie Online Survey: Invited via Organisations) Residents Sample (ie Face-to-face Park Residents Booster Survey) Loch Lomond and the Trossachs National Park Cairngorms National Park Total Sample Profile The main sample, ie that achieved from the online survey of panel members, was designed to be representative of the Scottish population in terms of: gender; age; urban/rural geography; socio-economic group; and Local Authority Likewise, the residents sample was designed to be representative of the populations within each National Park in terms of gender and age No controls or restrictions were placed upon organisation members in terms of demographics and profile. These respondents are, therefore, not necessarily representative in any way. Our analysis suggests that this sample contains more of the following sub-groups than the general population: males; the age-bands; those living in rural locations; and those from the higher socio-economic groups Appendix E provides breakdowns of the profile of each of the three different samples. Public Perception Survey of Wildness in Scotland 3.1
18 4 Use of the Outdoors 4.1 Most Wild Place Visited The most-frequently mentioned wild places that respondents to the main sample reported having visited included: the highlands and islands regions (n=257); various mountain ranges, glens and lochs (n=179); the two national parks, ie Loch Lomond and the Trossachs area and the Cairngorms area (n=142); Rannoch Moor (n=33); Ardnamurchan and Knoydart peninsulas (n=19); Galloway area and forest (n=11); and the west coast of Scotland (n=8) A few respondents, however, mentioned various wildlife parks, zoo s, etc as being the most wild places they had visited Responses were similar for both the residents sample and the organisation members, though the organisation members showed a tendency to identify specific mountain summits etc. 4.2 Organisation Membership Of the main sample, a total of 813 (81%) respondents indicated that they were not a member of any relevant organisation. For the remainder (n=193, 19%), the most common memberships included: National Trust for Scotland (n=100); Royal Society for the Protection of Birds (n=50); World Wildlife Fund (n=34); and Scottish Wildlife Trust (n=21) Table 4.1 provides a breakdown of organisation memberships by the three sample types. Public Perception Survey of Wildness in Scotland 4.1
19 4 Use of the Outdoors Table 4.1 Organisation Membership Organisation Main Sample (%) Residents Sample (%) Organisation Sample (%) John Muir Trust (JMT) <1% <1% 65% Mountaineering Council of Scotland 1% - 25% National Trust for Scotland (NTS) 10% 3% 34% Ramblers Association Scotland 1% - 5% Royal Society for the Protection of Birds (RSPB) 5% 7% 22% Scottish Mountaineering Club (SMC) 1% - 4% Scottish Wild Land Group <1% - 4% Scottish Wildlife Trust (SWT) 2% <1% 16% Trees for Life 1% - 4% World Wildlife Fund (WWF) 3% 1% 9% Other 4% 9% 34% Not a member of any groups 81% 82% 13% Total (N) A total of 88 respondents (13%) in the organisation sample indicated that they were not a member of any group. No information was collected to identify how these 88 respondents had found their way into the on-line survey, but we suspect many will either have been pointed to at by organisation members or have followed links to the survey from SNH s website or from the public access areas of some of the participating organisations websites. 4.3 Visits to the Outdoors Overall, 38% (n=387) of respondents in the main sample indicated that they visited the outdoors at least once a week, while only 6% (n=65) indicated that they never make such visits As would be expected, the organisation members visited the outdoors more frequently, with 81% (n=531) indicating that they visit at least once a week, while very few (<1% (n=4)) stated that they never visit the outdoors. Public Perception Survey of Wildness in Scotland 4.2
20 4 Use of the Outdoors 100% 90% 8% 22% 18% Daily 80% 70% 31% Weekly 60% 32% Once or twice a month 50% 40% 23% 14% 63% Once every 2-3 months 30% 20% 10% 0% 19% 5% 13% 6% 11% 15% 15% Main Sample Residents Organisation Members Once or twice Not made any such visits in the last 12 months Figure 4.1 Frequency of Visits to the Outdoors in the Last 12 Months Within the main sample, the youngest age group indicated that they were less frequent visitors to the outdoors than all other age groups. With 28% (n=65) stating that they visit at least once a week compared to 40% (n=93) for those aged 60+ and 42% for each age group (n=113) and (n=116) Likewise, those living in urban areas were less frequent visitors than those living in rural areas, with 32% (n=181) of those from urban areas visiting at least once a week compared to 46% (n=206) of those from rural areas Slight differences were also noted between the frequency of visits of the two socio-economic groups, with those from ABC1 being more frequent visitors compared to those from C2DE and those from C2DE indicating that they had not visited the outdoors in the last 12 months. 41% (n=214) of those from ABC1 indicated that they visited at least once a week, compared to 35% (n=173) of those from C2DE. Meanwhile, 9% (n=43) of those from C2DE indicated that they had not visited in the last 12 months compared to 4% (n=22) of those from ABC Those respondents that had made at least one visit to the outdoors in the last 12 months were asked to identify the various activities that they had participated in. Table 4.2 provides a breakdown of all activities respondents indicated they had participated in. Public Perception Survey of Wildness in Scotland 4.3
21 4 Use of the Outdoors Table 4.2 Outdoor Activities Participated in within the Last 12 Months Activity Main Sample (%) Residents Sample (%) Organisation Sample (%) Walking (Low Level) 87% 83% 94% Hill Walking 26% 37% 87% Rock Climbing 2% 6% 11% Cycling (road based) 19% 20% 45% Mountain Biking (off-road) 6% 7% 34% Horse Riding 5% 3% 3% Fishing 9% 16% 8% Watersports 4% 8% 17% Snowsports 3% 10% 24% Swimming 13% 13% 15% Birdwatching 17% 23% 48% Other Wildlife/Nature Watching 19% 18% 50% Running/Jogging 14% 10% 25% Camping 20% 15% 48% Sightseeing/Visitor Attractions 52% 22% 56% Picnicing 37% 20% 28% Family Day Out 51% 22% 32% Other 5% 11% 16% None/Nothing/Can t Remember <1% 1% - Total (N) Common other activities across the samples included dog walking, photography and golf, while organisation members also listed conservation activities and work and various sailing and sea kayaking activities. Visiting the Outdoors for Work Purposes Respondents were also asked whether they regularly visit the outdoors for work purposes. The majority of respondents in the main sample stated that they do not (n=901, 90%), compared to only 10% (n=105) who do Although still in the minority, the proportions of the residents sample and organisation members is higher than the main sample, with 20% of the residents sample and 25% of organisation members indicating that they regularly visit the outdoors for work purposes In addition, within the main sample, a higher proportion of men (13%, n=62) than women (8%, n=43) and those aged up to the age of 60 (10-13%) compared to those aged 60+ (4%, Public Perception Survey of Wildness in Scotland 4.4
22 4 Use of the Outdoors n=10), indicate they visit the outdoors for work. This could be because fewer women are in employment and that the older age groups contains many retired respondents. Frequency of Visits to the National Parks Respondents were asked how often they visit: Loch Lomond and the Trossachs National Park; Cairngorms National Park; and Other National Parks in the UK Very few respondents within the main sample visit any National Parks very often; only 7% (n=65) indicated that they visit Loch Lomond at least monthly, 3% (n=32) visit the Cairngorms with the same frequency, and 4% (n=34) indicated that they visit other UK National Parks. Figure 4.2 details the frequency with which the main sample visit each National Park. 100% 90% 80% 70% 60% 50% 40% 30% 20% 10% 0% 37% 38% 18% 29% 27% 39% 29% 46% 23% Loch Lomond Cairngorms Other UK National Parks Weekly Monthly Once or twice a year Rarely Never Figure 4.2 Frequency of Visits to National Parks (Main Sample) As would perhaps be expected, organisation members tend to visit the National Parks with a little more frequency; 16% visit Loch Lomond at least monthly and 46% at least once a year; 23% visit the Cairngorms at least monthly and 56% at least once a year; and 5% visit other UK National Parks at least once a month and 38% at least once a year. 4.4 Resident s Employment within the National Parks The survey also endeavoured to determine the extent to which National Park residents work within the Parks and to identify the relevant industry sectors. For brevity, all Park residents identified across all three samples are considered together here. Public Perception Survey of Wildness in Scotland 4.5
23 4 Use of the Outdoors Of those that were in employment (either full/part-time employment or self-employed), 73% (n=112) stated that their normal place of work lay within one of the Scottish National Parks boundary s. The remaining 29% (n=45) of employed residents were employed outwith the National Parks Of those that were employed within the boundaries, 32% (n=35) were employed in catering/leisure/tourism, 13% (n=14) were employed in construction, manufacturing & distribution, and 12% (n=13) were employed in public sector services The full disaggregation by economic sector is shown in the table below. Table 4.3 All Residents Employment Sector Within the National Parks Business Sector Number Percent (%) Agriculture 2 2 Forestry 3 3 Catering/Leisure/Tourism Energy and Water 4 4 Finance and Business 4 4 Construction, Manufacturing and Distribution Transport and Communication 6 5 Public Sector Services Other Total (N) Public Perception Survey of Wildness in Scotland 4.6
24 5 Perceptions of Wildness 5.1 Appropriateness of Wildness Attributes Respondents were introduced to the four key wildness attributes: the naturalness of the land cover and wildlife; the presence of man-made structures and features; remoteness from roads and railway stations; and the terrain On the whole, main sample respondents felt that the attributes capture what they think of as wild either quite or very well. Overall, 66% (n=660) felt these captured wildness quite well, with a further 29% (n=290) indicating they captured it very well. Only 5% (n=56) of the respondents suggested that these attributes did not capture wildness very well. 100% 90% 80% 29% 39% Very well 70% 60% 50% 71% Quite well 40% 30% 66% 58% Not very well 20% 10% 0% 25% Main Sample Residents Organisation Members No response Figure 5.1 Ability of the Four Main Attributes to Cover Wildness The only difference between the main sample and both the organisation members and the residents samples was that greater proportions considered that the attributes captured their views very well, with 39% (n=255) of organisation members and 71% (n=149) of the residents sample stating this. There was little difference however, in the proportions who stated that they felt the attributes were not very well aligned with their own views, with 3% (n=18) of organisation members and 2% (n=5) of the residents sample reporting this view There were no statistically significant differences in results within the main sample by the various market segments (ie gender, age, urban/rural location and socio-economic group). Public Perception Survey of Wildness in Scotland 5.7
25 5 Perceptions of Wildness Respondents were also asked to identify any additional aspects that contribute towards their perceptions of wildness. Common responses from the main sample included: a lack of people, not meeting other people in the area, a sense of loneliness and isolation (n=71); wildlife (n=66); natural or unspoiled beauty and beautiful scenery (n=37); the weather (n=29); type of vegetative cover (n=17); and fresh/open air (n=9) Similar responses were also given by the residents sample and organisation members, albeit that organisation members were more likely to mention the need for a lack of specific human artefacts and energy infrastructure such as wind turbines, roads, tracks and paths, etc. 5.2 Attribute Weighting by Attribute Type Responses to the best-worst experiment were analysed under a choice modelling framework, which allows a weight to be estimated for each attribute investigated in the study. Importantly, the approach adopted allows for the scale between any two attributes to be robustly identified due to the trade-off nature of the scenarios presented The scores are calculated relative to each other, with no real absolute. We have therefore expressed each set of scores relative to the average attribute score (ie averaged over all 25 attributes) for the relevant set of respondents. A wildness score close to zero for a given sample therefore represents attributes which obtained close to the average score in the analysis of that sample, while attributes which tended to be selected as Most Wild achieve a large positive score and those which were usually selected as Least Wild will have a large negative score. Note that attributes with small negative scores may still contribute positively to wildness, they just contribute less than the average attribute in the ranking for that sample ie a negative weight does NOT necessarily mean that that attribute decreases the public s perception of wildness. Similarly, a small positive wildness score does not necessarily mean that this attribute adds to the perception of wildness rather it is just rather unimportant from a wildness perspective Any differences between the three samples mentioned in the following sections is statistically significant at the 95% confidence level. Perceived Naturalness Table 5.1 and Figure 5.2 show how the three different groups believe that the different sorts of perceived naturalness affects wildness The key feature of these values are that the organisation members give more weight to this category than the other two sample groups, with higher positive wildness scores for natural landscapes and more negative wildness scores for evidence of farming and highly managed landscapes. Public Perception Survey of Wildness in Scotland 5.8
26 5 Perceptions of Wildness Table 5.1 Impact of Perceived Naturalness Sub-Attribute Wildness Value Main Sample Residents Sample Organisation Members Area made up of natural broadleaf or coniferous woodland, heath or moor vegetation, rivers, lochs, and streams, and bare rock surfaces Area made up of semi-natural woodland, bracken or shrubs (gorse, heather and bilberry), and marsh area Area made up of planted woodland and seminatural grasslands. Some evidence of manmade interventions, eg reservoirs Area has evidence of farming, including drainage, ploughing and arable crops Area heavily managed, made up of parks and gardens, and/or intensive stock grazing Wildness Score Natural woodland Semi-natural woodland Planted woodland and semi-natural grasslands Evidence of farming Parks and gardens Main Sample Residents Sample Organisation Members Figure 5.2 Wildness Scores for Perceived Naturalness by Sub-Sample Man-Made Artefacts Table 5.2 and Figure 5.3 show how the three different groups believe that the different types of man-made artefacts affect wildness. Public Perception Survey of Wildness in Scotland 5.9
27 5 Perceptions of Wildness Table 5.2 Impact of Man-Made Artefacts Sub-Attribute Wildness Value Main Sample Residents Sample Organisation Members No visible man-made features Older built structures in landscape, eg bothies, abandoned cottages, crofts, castles and stone walls Moorland, actively managed by burning Plantation forests in landscape (non-native conifers) Long line features in landscape, eg roads, railways and/or vehicle tracks Modern built structures in landscape, eg working farms, isolated homes, deer fencing, and small scale industrial land uses such as quarrying or mining Physical evidence of recreation (eg 4-wheel drive tracks, hiking paths, ski lifts) and field sports (eg hunting, shooting, fishing) in landscape Energy infrastructure in landscape, eg wind turbines, pylons, dams, and associate infrastructure Built-up areas, eg small towns and villages Public Perception Survey of Wildness in Scotland 5.10
28 5 Perceptions of Wildness Wildness Score 0-1 No visible manmade features Older built structures Muirburn Plantation forests Long line features Modern structures Recreation infrastructure Energy infrastructure Built-up areas Main Sample Residents Sample Organisation Members Figure 5.3 Wildness Scores for Man-Made Features by Sub-Sample The key features of these values are that: organisation members give more weight to man-made features (ie associate greater positive wildness scores to the absence of visible man-made features and more negative scores to features which detract from wildness) than the other two groups; older built structures (defined as bothies, abandoned cottages, crofts, castle and stone walls ) actually have a positive wildness score (ie score more-highly than the average attribute) for all three sample groups; and the residents sample assign less negative wildness impacts to modern structures, recreation infrastructure and built-up areas than the other two groups. Wildlife Table 5.3 and Figure 5.4 show how the three different groups scored the two attributes associated with wildlife. Public Perception Survey of Wildness in Scotland 5.11
29 5 Perceptions of Wildness Table 5.3 Wildness Values for the Wildlife Attributes Sub-Attribute Wildness Value Main Sample Residents Sample Organisation Members Native wildlife may be present in landscape, eg red deer, eagles, red squirrel, wild cat, and/or pine marten Domestic livestock may be present in landscape, eg cattle and sheep Wildness Score Native wildlife may be present Domestic livestock may be present Main Sample Residents Sample Organisation Members Figure 5.4 Wildness Scores for Wildlife Attributes All three groups show a similar pattern, with a high positive wildness score for native wildlife and a small negative score created by the potential presence of domestic livestock. Note that since the experiment combined all native wildlife into a single attribute, additional research would be required to estimate the wildness impacts of different types of native wildlife. Remoteness Table 5.4 and Figure 5.5 illustrate the wildness score allocated to different levels of remoteness for the three sub-samples. Public Perception Survey of Wildness in Scotland 5.12
30 5 Perceptions of Wildness Table 5.4 Wildness Values for Different Levels of Remoteness Sub-Attribute Wildness Value Main Sample Residents Sample Organisation Members 5 hours walk from the nearest road or railway station 4 hours walk from the nearest road or railway station 2 hours walk from the nearest road or railway station 1 hour walk from the nearest road or railway station Roadside (estimated by extrapolation) Wildness Score (Relative to Average) Time from nearest road/railway station (hours) Main Sample Residents Sample Organisation Members Figure 5.5 Wildness Scores for Remoteness by Sub-Sample As expected, the perceptions of wildness for each sub-sample increases as the distance of location from the nearest road or railway station increases The graph also suggests that the organisation members perceive that increasing remoteness generates a greater level of wildness (relative to the other attributes) than the main sample or the residents sample. Public Perception Survey of Wildness in Scotland 5.13
31 5 Perceptions of Wildness Given the observed relationships and the high degree of statistical significance of the relevant parameter estimation, it is likely that the relevant lines could be extrapolated beyond five hours, if necessary. Terrain Table 5.5 and Figure 5.6 show how the three different groups believe that the different sorts of terrain affects wildness The key feature of these values are that the organisation members give much higher wildness scores to the three most-rugged categories of terrain than the other two groups. Table 5.5 Impact of Terrain Sub-Attribute Wildness Value Main Sample Residents Sample Organisation Members Landscape has noticeable features (such as cliff faces and boulder fields), with extensive areas of high altitude and rough terrain which are difficult to move around Landscape has some areas of noticeable features (such as cliff faces and lochs), and high altitude, which are difficult to move around Landscape is a mix of terrains with the occasional noticeable feature (such as lochs), and can be difficult to move around in places Landscape has one or two noticeable features (such as lochs), but is generally of low altitude and is easy to move around Landscape is of low altitude with no noticeable natural features, and is very easy to move around Public Perception Survey of Wildness in Scotland 5.14
32 5 Perceptions of Wildness Wildness Score High altitude, rough terrain, cliffs etc (difficult to move around) Landscape has some areas of noticable features Mix of terrains with the occasional noticable feature Landscape has one or two noticable features Low altitude with no noticable natural features Main Sample Residents Sample Organisation Members Figure 5.6 Wildness Scores for Terrain by Sub-Sample 5.3 Attribute Weighting for all Attributes Table 5.6 shows the ranking of the wildness scores given to each of the 25 attributes by the three sub-groups. Public Perception Survey of Wildness in Scotland 5.15
33 5 Perceptions of Wildness Table 5.6 Overall Attribute Rankings Attribute Main Sample Ranking Residents Sample Ranking Organisation Members Ranking Native wildlife may be present in landscape, eg red deer, eagles, red squirrel, wild cat, and/or pine marten Landscape has noticeable features (such as cliff faces and boulder fields), with extensive areas of high altitude and rough terrain which are difficult to move around Landscape has some areas of noticeable features (such as cliff faces and lochs), and high altitude, which are difficult to move around Area made up of natural broadleaf or coniferous woodland, heath or moor vegetation, rivers, lochs, and streams, and bare rock surfaces No visible man-made features Landscape is a mix of terrains with the occasional noticeable feature (such as lochs), and can be difficult to move around in places Area made up of semi-natural woodland, bracken or shrubs (gorse, heather and bilberry), and marsh area Older built structures in landscape, eg bothies, abandoned cottages, crofts, castles, and stone walls Landscape has one or two noticeable features (such as lochs), but is generally of low altitude and is easy to move around hours walk from the nearest road or railway station hours walk from the nearest road or railway station Moorland, actively managed by burning Landscape is of low altitude with no noticeable natural features, and is very easy to move around hours walk from the nearest road or railway station Area made up of planted woodland and semi-natural grasslands. Some evidence of manmade interventions, eg reservoirs Domestic livestock may be present in landscape, eg cattle and sheep hour walk from the nearest road or railway station Plantation forests in landscape (non-native conifers) Area has evidence of farming, including drainage, ploughing and arable crops Public Perception Survey of Wildness in Scotland 5.16
34 5 Perceptions of Wildness Attribute Main Sample Ranking Residents Sample Ranking Organisation Members Ranking Long line features in landscape, eg roads, railways and/or vehicle tracks Modern built structures in landscape, eg working farms, isolated homes, deer fencing, and small scale industrial land uses such as quarrying or mining Area heavily managed, made up of parks and gardens, and/or intensive stock grazing Physical evidence of recreation (eg 4 wheel drive tracks, hiking paths, ski lifts) and field sports (eg hunting, shooting, fishing) in landscape Energy infrastructure in landscape, eg wind turbines, pylons, dams, and associate infrastructure Built-up areas, eg small towns and villages The presence of native wildlife appears to contribute most to the main sample s and the residents sample s perceptions of wildness and came fifth in the ranking of organisation members, who felt that the complete absence of visible man-made features was the most important wildness factor At the other end of the scale, built-up areas (small towns and villages) reduces wildness by the most for both the main sample and the organisation members, while energy infrastructure in the landscape has the biggest negative impact on the perception of wildness for the residents sample These graphs show that the top three attributes which contribute to perceptions of wildness and the bottom three attributes which contribute least to wildness are as listed in Table 5.7. Public Perception Survey of Wildness in Scotland 5.17
35 5 Perceptions of Wildness Table 5.7 Top 3 and Bottom 3 Attributes Contribution to Wildness Main Sample Residents Sample Organisation Members Most Positive Native wildlife may be present in the landscape Native wildlife may be present in the landscape No visible man-made features 2 nd Most Positive Landscape has noticeable features Natural broadleaf or coniferous woodland Landscape has noticeable features 3 rd Most Positive Landscape has some area of noticeable features Mix of terrains with the occasional noticeable feature Landscape has some area of noticeable features rd Most Negative Physical evidence of recreation Long line features Energy infrastructure in the landscape 2 nd Most Negative Energy infrastructure in the landscape Built up areas Heavily managed (eg parks and gardens) Most Negative Built up areas Energy infrastructure in the landscape Built up areas Figure 5.7 illustrates the attributes which have above average wildness scores, while Figure 5.8 shows the attributes which tend to reduce wildness for each of the three samples. NB The caveats in paragraph above (about attributes whose wildness scores are close to zero) should be particularly borne in mind here. Public Perception Survey of Wildness in Scotland 5.18
36 5 Perceptions of Wildness Atrributes with Positive Wildness Scores Native wildlife may be present in landscape Landscape has noticable features Landscape has some areas of noticable features Natural broadleaf or coniferous woodland No visible man-made features Mix of terrains with the occasional noticable feature Semi-natural woodland, bracken or shrubs Older built structures in landscape Landscape has one or two noticable features 5 hours walk from the nearest road or railway 4 hours walk from the nearest road or railway Wildness Value Wildness Attribute Main Sample Residents Sample Organisation Members Figure 5.7 Attributes with Above-Average Wildness Scores by Sample Type Public Perception Survey of Wildness in Scotland 5.19
37 5 Perceptions of Wildness Attributes with Negative Wildness Scores Moorland, actively managed by burning Low altitude with no noticable natural features 2 hours walk from the nearest road or railway Planted woodland and semi-natural grasslands Domestic livestock may be present in landscape 1 hour walk from the nearest road or railway Plantation forests (non-native conifers) Area has evidence of farming Long line features (eg roads/railways/tracks) Modern built structures in landscape Heavily managed (parks and gardens) Physical evidence of recreation Energy infrastructure in landscape Built-up areas, eg small towns and villages Wildness Value Wildness Attribute Main Sample Residents Sample Organisation Members Figure 5.8 Attributes with Below-Average Wildness Scores by Sample Type Public Perception Survey of Wildness in Scotland 5.20
38 5 Perceptions of Wildness 5.4 Allocating Weights to the Five Attribute Categories In order to determine the relative importance of the different categories of attribute (terrain, perceived naturalness of the vegetation, man-made features, remoteness and wildlife), it is necessary to consider the range between the most wild and least wild attribute within these categories This range gives an indication of the difference in wildness scores created by moving from the least-wild to the most-wild version of each attribute type Table 5.8 lists the attributes which achieved the top and bottom wildness scores within each attribute category, based on the results described in the previous section. Table 5.8 Top and Bottom Attributes in each Category Attribute Category Least Wild Attribute Most Wild Attribute Terrain Landscape is of low altitude with no noticeable natural features, and is very easy to move around Landscape has noticeable features (such as cliff faces and boulder fields), with extensive areas of high altitude and rough terrain which are difficult to move around Perceived Naturalness Area heavily managed, made up of parks and gardens, and/or intensive stock grazing Area made up of natural broadleaf or coniferous woodland, heath or moor vegetation, rivers, lochs, and streams, and bare rock surfaces Man-made Artefacts Built-up areas, eg small towns and villages No visible man-made features Remoteness Roadside (calculated by extrapolation) 5 hours walk from the nearest road or railway station Wildlife Domestic livestock may be present in landscape, eg cattle and sheep Native wildlife may be present in landscape, eg red deer, eagles, red squirrel, wild cat and/or pine marten The corresponding range in the average wildness scores allocated to these attributes by the three sub-groups are shown in Table 5.9 and illustrated in Figure 5.9. These ranges indicate which of the categories of attributes have the most influence on the wildness of the relevant landscape, with the attribute categories with the largest ranges being the most-important for determining the overall perceived wildness of the location (ie categories which show little difference in the range of wildness scores between the top and bottom are less important than categories which exhibit a wide range). Public Perception Survey of Wildness in Scotland 5.21
39 5 Perceptions of Wildness Table 5.9 Range of Wildness Scores for each Attribute Category Attribute Category Main Sample Residents Sample Organisation Members Terrain [-0.1, 1.6] = 1.7 [-0.0, 1.1] = 1.1 [-0.5, 2.8] = 3.2 Perceived Naturalness [-1.4, 1.4] = 2.9 [-1.1, 1.3] = 2.4 [-3.1, 1.9] = 5.1 Man-made Artefacts [-2.4, 1.4] = 3.8 [-1.7, 1.1] = 2.8 [-3.7, 2.9] = 6.6 Remoteness [-0.4, 0.3] = 0.8 [-0.6, 0.8] = 1.4 [-0.5, 2.0] = 2.5 Wildlife [-0.3, 1.7] = 2.0 [-0.9, 1.6] = 2.5 [-0.9, 2.1] = Range of Wildness Scores Terrain Perceived naturalness Man-made artefacts Remoteness Wildlife Main Sample Residents Organisation Members Figure 5.9 Range of Wildness Scores for each Attribute Category As noted previously, the organisation members consistently assign a larger range of values than the other two groups, due to a combination of higher positive wildness scores for attributes such as No visible man-made features which add to their perception of wildness and more negative wildness scores for the attributes which they perceive to reduce wildness The main sample and the organisation members show the same overall pattern, with the Man-made Artefacts attributes and Perceived Naturalness having the highest and 2 nd highest range of wildness values respectively and Remoteness having the smallest range of values. The values from the residents sample exhibit a slightly different pattern, with Man-made Artefacts again having the largest range but the other categories having broadly similar wildness score ranges. Public Perception Survey of Wildness in Scotland 5.22
40 5 Perceptions of Wildness These ranges give an indication of the relative importance of the different categories of attribute for determining overall perceived wildness. For example, within the Man-Made Artefacts category of the main sample, wildness scores can range from -2.4 (for Built Up Areas) to 1.4 (for No man-made features) (giving a range of 3.8), while the difference between Roadside 4 (with an Wildness score of -0.4) and five hour s walk from the nearest road (with a wildness score of 0.3) is only 0.7. In other words, the level of man-made artefacts in the landscape is more important from an overall wildness perspective than the distance from the nearest road The values listed in Table 5.9 above can therefore be used to combine any measures of wildness (or wildness mapping) which have been calculated based on these broad attribute categories. In other words, the weights in Table 5.9 can be used to combine a location s scores for terrain, perceived naturalness, man-made artefacts, remoteness and/or wildlife, provided that these scores have been constructed using measures which are broadly consistent with the individual attribute descriptions used in this research The weights in Table 5.9 can also be used to combine any subset of the attribute categories. For example, the weights shown in Table 5.9 can be used to combine maps of terrain, perceived naturalness, man-made artefacts and remoteness, even though the level of Wildlife may not be available for different locations. 4 Calculated by extrapolation using the 1-hour walk and 2-hour walk values Public Perception Survey of Wildness in Scotland 5.23
41 6 Importance of Scotland s Wild Areas 6.1 Importance of Wild Areas Respondents generally considered that it was very important that Scotland had wild areas. Almost three quarters of the main sample (72%, n=718) stated this, with only 3% (n=34) stating that it was not at all important However, a greater proportion of the residents sample and the organisation members stated that they considered that it was very important that Scotland has wild areas (83%, n=174 and 93%, n=609, respectively). 100% 90% 80% 15% 10% 4% Not at all Important 70% 4 60% 50% 40% 30% 72% 83% 93% % 10% 0% Main Sample Residents Organisation Members Very Important Figure 6.1 Importance of Wild Areas The main sample was also analysed for statistically significant differences by market segment. No statistically significant differences were noted by gender or urban/rural location Age does appear to influence the responses to this question, with older respondents significantly more likely to consider that it was very important that Scotland has wild areas than younger respondents Respondents who felt that it was important that Scotland has wild areas were asked to explain their answer. The most frequently cited responses from the main sample included: preservation of wildlife (n=159); As Scotland has some of the last remaining wilderness in Europe, it's important we look after it and its wildlife. part of Scottish culture (n=143); Public Perception Survey of Wildness in Scotland 6.1
42 6 Importance of Scotland s Wild Areas It is part of our culture and our heritage. Scotland has landscapes like no other country and it is worrying that more and more the wild areas we have left are being built on or being affected by manmade structures. adds to the diversity of the country (n=126); natural beauty has to be preserved (n=112); To preserve the beauty, attract tourism, if we lose these areas it will be almost impossible to get them back. the wild areas are beautiful (n=93); Scotland is known for it's wild areas (n=91); Because it is a vital part of Scotland s heritage, our country is known for its vast country sides and wildlife, and always should be. Because we are famous for our hills, lochs and greenery and most people associate this with open spaces and wilderness. for recreation and sightseeing activities (n=89); For recreational purposes and in order that people may have a place to wind down after the stress of today's world which seems now to be claiming more people as victims progressively as the strain of living in our modern world gets worse. preservation of heritage (n=81); for helping with pollution and health (n=73); conservation of wildlife and natural habitat (n=72); attracts tourists to the area (n=57); Scotland has some of the most wonderful areas of natural beauty which brings tourists from around the world and helps with the economy. Too much modernisation would interfere with our animals living wild, our heritage and our ability to encourage increased tourist numbers animals need natural habitat in which to thrive (n=54); and one of the last remaining wild areas in Europe (n=28). It what makes Scotland special as the rest of the world is turning into concrete jungles Scotland should retain it wild areas as they are part of what makes Scotland special and beautiful. 6.2 Wild Areas Under Threat Of the main sample, 60% (n=599) of respondents stated that they thought wild areas in Scotland are under threat, with 17% (n=172) stating they did not think they were under threat Almost all organisation members (92%, n=602) stated that they felt wild areas were under threat in Scotland, while this figure was just over half (55%, n=114) for the residents sample. These responses are illustrated in Figure 6.2 below. Public Perception Survey of Wildness in Scotland 6.2
43 6 Importance of Scotland s Wild Areas 100% 90% 23% 23% 4% 4% 80% 70% 17% 22% Don't Know 60% 50% 40% 92% No 30% 20% 60% 55% Yes 10% 0% Main Sample Residents Organisation Members Figure 6.2 Wild Areas Under Threat The main sample was also analysed for statistically significant differences by market segment. There were no statistically significant differences in the sample by age, socio-economic group, and urban/rural location. 6.3 Preserving Wild Areas Figure 6.3 shows that 86% (n=868) of respondents in the main sample felt that action is necessary to preserve wild land in Scotland Almost all (97%, n=639) organisation members felt that action is necessary while 80% (n=168) of the residents sample felt that this was necessary. Public Perception Survey of Wildness in Scotland 6.3
44 6 Importance of Scotland s Wild Areas 100% 90% 80% 70% 9% 5% 14% 8% Don't Know 60% No 50% 40% 30% 86% 80% 97% Yes 20% 10% 0% Main Sample Residents Organisation Members Figure 6.3 Action Required to Preserve Wild Areas There were no statistically significant differences in the main sample by gender, age, socio-economic group, or urban/rural location. Specific Actions to Preserve Wild Areas Respondents were provided with a list of potential actions and asked to select the three that they think should be taken to preserve wild areas in Scotland. The responses are summarised in Table 6.1. Public Perception Survey of Wildness in Scotland 6.4
45 6 Importance of Scotland s Wild Areas Table 6.1 Actions to preserve wild areas Main Sample (%) Residents Sample (%) Organisation Members (%) The introduction of specific 'wild land' designation Effective control over new vehicle hill tracks Effective planning control for buildings Effective planning control for wind turbines Effective planning control for telephone masts and pylons Make some areas wild again Species re-introductions Effective management of farming, forestry and fishing Fewer purpose built paths, including signage and track removal Other None/Nothing Don't Know Total (N) *Note: Totals do not equal 100% due to multiple responses Looking solely at the main sample, Figure 6.4 below shows that the most popular responses for action to be taken, stated by over a third of respondents, were: the introduction of specific 'wild land' designation; effective planning control for wind turbines; effective planning control for buildings; effective planning control for telephone masts and pylons; and species re-introductions. Public Perception Survey of Wildness in Scotland 6.5
46 6 Importance of Scotland s Wild Areas 60% 50% 48% 40% 37% 36% 35% 35% 30% 20% 22% 19% 14% 10% % 4% 2% 6% 1% Introduction of specific 'wild land' designation Effective planning control for wind turbines Effective planning control for buildings Species re-introductions Effective planning control-telephone masts, pylons Effective management of farming, forestry, fishing Make some areas wild again Effective control over new vehicle hill tracks Fewer purpose built paths Other Don't Know None/Nothing Figure 6.4 Actions to Preserve Wild Areas by Main Sample The most frequently cited other responses were: all of the above actions; education and awareness eg in schools; effective planning and control in general; more national parks; less wind farms; and wider promotion of the wilderness. 6.4 Importance of Protecting Wild Areas When asked, to indicate on a five point scale, where 1 is very important and 5 is not at all important, how important respondents think it is to protect wild areas in Scotland, over three quarters of the main sample (77%, n=771) considered it was very important Of the other two samples, 82% (n=169) of the residents sample and 93% (n=611) of organisation members also stated that they thought it was very important. This is illustrated in Figure 6.5. Public Perception Survey of Wildness in Scotland 6.6
47 6 Importance of Scotland s Wild Areas 100% 90% 80% 70% 60% 50% 40% 30% 20% 10% 0% 13% 77% 12% 82% 5% 93% Main Sample Residents Organisation Members Not at all Important Very Important Figure 6.5 Importance of Protecting Wild Areas The main sample was also analysed for statistically significant differences. There were no differences in the sample by urban/rural location Age group was found to be statistically significant, with respondents in the older age group more likely than respondents in the younger age groups to think that it was very important to protect wild areas in Scotland There was also a statistically significant difference between socio-economic group, with those in group ABC1 more likely to think it was important that wild areas are protected in Scotland than those in groups C2DE Gender was also found to be statistically significant, however, the only noticeable differences that can be seen in the results is that males were slightly more likely than females to think that it was not at all important, although numbers for both groups stating this were low. 6.5 Importance of Promoting Economic Development When asked, to indicate on a five point scale, where 1 is very important and 5 is not at all important, how important respondents think it is to promote economic development in rural areas of Scotland, 31% (n=314) of the main sample felt it was very important to promote economic development in rural areas of Scotland Results were similar for the organisation members, with 32% (n=212) stating that they thought it was very important, however, a higher proportion of the residents sample considered this to be very important, with half of all residents indicating this (50%, n=101). Public Perception Survey of Wildness in Scotland 6.7
48 6 Importance of Scotland s Wild Areas 100% 90% 80% 70% 60% 50% 40% 30% 20% 10% 28% 33% 31% 17% 31% 50% 26% 33% 32% Not at all Important Very Important 0% Main Sample Residents Organisation Members Figure 6.6 Importance of Promoting Economic Development The main sample was also analysed for statistically significant differences. There were no statistically significant differences in the sample by age and urban/rural location Gender was found to be statistically significant, however, the only noticeable differences that can be seen in the results is that males were slightly more likely than females to think that it was not at all important promote economic development in rural areas of Scotland, although numbers for both groups stating this were very small Socio-economic group was also found to be statistically significant, with more respondents in group ABC1 stating 2 ie that it was important to promote economic development in rural areas of Scotland than group C2DE, although overall, around two thirds of respondents in both of these groups considered it important or very important to promote economic development in rural areas of Scotland. 6.6 Importance of Protecting Wild Areas Vs Promoting Economic Development Comparing the mean scores for the importance of protecting wild areas and the importance of promoting economic development shows that, across all three samples, respondents placed a statistically significant greater level of importance on the protection of wild areas than economic development. (see Figure 6.7) Note that the scale ran from 1 being very important to 5 being not at all important, therefore, the lower the mean score, the higher the actual level of importance reported. Public Perception Survey of Wildness in Scotland 6.8
49 6 Importance of Scotland s Wild Areas Mean Score Protecting Wild Areas Promoting Economic Development Protecting Wild Areas Promoting Economic Development Protecting Wild Areas Promoting Economic Development Main Sample Residents Organisation Members Scale: 1=Very Important through to 5=Not at all Important Figure 6.7 Comparing Importance of Protecting Wild Areas and Promoting Economic Development Figure 6.7 also shows that organisation members placed the greatest importance on protecting wild areas, followed by the residents sample, then by the main sample. These differences in the responses to this question between the three groups are all statistically-significant The residents sample rated the importance of economic development more highly than either of the other two samples and this difference was statistically-significant. The difference in the responses to this question between the other two sub-groups was not statistically significant. Public Perception Survey of Wildness in Scotland 6.9
50 7 Conclusions/Recommendations 7.1 Conclusions This approach to measuring public perceptions of wildness has been built on a robust statistical method, using techniques which have been widespread in other fields and sectors for many years. Critical to this is the trade-off of different attributes, which allow weights to be estimated for each attribute which have a robust scale between each. This represents a significant advancement on alternative ranking and rating techniques. The goodness-of-fit statistics which accompany the analysis suggest the high degree of accuracy associated with the estimated weights and values The research has also investigated a greater range of attributes than has previously been possible, with attributes presented using both textual and visual descriptions. It has been previously proven that different segments of the population prefer different stimuli; similar research has established the splits as approximately a third preferring text, visual, and text and visual jointly. The visuals deployed were of a high quality, and were perceived by respondents to offer a transparent, accessible, and engaging means of describing different attributes of wildness The survey methodology achieved a representative sample of Scottish residents for the main sample for analysis. These respondents generally indicated that the wildest places they had visited in Scotland were the highlands and islands regions, various mountain ranges, glens and lochs, and the two National Parks Around one third of respondents in the main sample visited the outdoors at least once a week, while only 6% indicated that they never make such visits. The main activities undertaken by these respondents included low level walking, sightseeing/visitor attractions and family days out However, very few respondents within the main sample visit any National Parks with any regularity; only 7% indicated that they visit Loch Lomond at least monthly, 3% visit the Cairngorms on a monthly basis and 4% indicated visit other UK National Parks with the same regularity Most respondents, across all three samples, indicated that they considered it important that Scotland has wild areas, although a higher proportion of organisation members and the residents sample considered this important than within the main sample Slightly more than half of all respondents in the main sample and the residents sample considered that Scotland s wild areas were under threat and the majority of organisation members felt that this was the case. However, across all samples, the majority of respondents felt that action is necessary to preserve wild land in Scotland Actions that were suggested for the protection of wild areas included the introduction of specific 'wild land' designation, with almost half of all main sample respondents identifying this as an appropriate action. Effective planning controls for for wind turbines, buildings and telephone masts/pylons were also suggested by just over one third of the respondents in the main sample Across all samples, although most respondents indicated that protecting wild areas and promoting economic activity were important, respondents appear to place greater importance on the protection of wild areas than they placed on promoting economic development in rural areas. Public Perception Survey of Wildness in Scotland 7.1
51 7 Conclusions/Recommendations The majority of respondents, across all sample groups, indicated that the four specified categories of attributes capture what they thought of as wild either quite or very well The mathematical analysis of the responses yielded a consistent and statistically-robust set of wildness values for each of the 25 attributes tested here, including a broadly linear relationship between remoteness and wildness and an intuitive ordering of attributes within each of the main attribute categories tested here This analysis has suggested that attributes such as the presence of native wildlife, noticeable features in the landscape (such as cliff faces and boulder fields) and perceived naturalness of vegetation all score highly. The absence of any man-made features also achieved a high wildness score. Attributes such as the presence of built-up areas, energy infrastructure (eg wind turbines, pylons, dams etc) and recreational infrastructure (eg 4-wheel drive tracks, hiking paths, ski lifts and field sports) all have a strong negative impact on perceived wildness. It should be noted however, that whilst noticeable features in the landscape were a key element in respondents perceptions of wildness, this was on the basis of the photos provided and questions/specific attributes being asked about, yet the absence of all features could also lead to perceptions of wildness. However, this attribute was not included or tested within this survey The top three attributes which contribute to positive perceptions of wildness for the main sample are: native wildlife may be present in the landscape ; landscape has noticeable features ; and landscape has some area of noticeable features The top three attributes which contribute to positive perceptions of wildness for the residents sample are: native wildlife may be present in the landscape ; natural broadleaf or coniferous woodland ; and mix of terrains with the occasional noticeable feature The top three attributes which contribute to perceptions of wildness for organisation members are: no visible man-made features ; landscape has noticeable features ; and landscape has some areas of noticeable features The main sample and the organisation members show the same overall pattern, with the Man-made Artefacts attributes and Perceived Naturalness having the highest and 2 nd highest range of wildness values respectively and Remoteness having the smallest range of values. The values from the residents sample exhibit a slightly different pattern, with Man-made Artefacts again having the largest range but the other categories having broadly similar wildness score ranges The resulting weights (summarised in Table 7.1 below) can be used to combine any measures of wildness which have been calculated based on these broad attribute categories. Note that these weights have been calculated independently of each other and therefore can be used to combine any combination of these wildness attribute categories. For example, if the level of wildlife Public Perception Survey of Wildness in Scotland 7.2
52 7 Conclusions/Recommendations cannot be calculated then we can simply ignore this weight and use the other weights in the table below to combine the categories which are available. These weights should obviously not be used to combine measures of wildness based on categories which differ significantly from the range of attributes included in this research. Table 7.1 Suggested Weights for each Wildness Attribute Category Attribute Category Main Sample Residents Sample Organisation Members Terrain Perceived Naturalness Man-made Artefacts Remoteness Wildlife It is interesting to note that the organisations members who were invited to take part in this research consistently assign a larger range of wildness values than the other two groups, due to a combination of higher positive wildness scores for attributes such as No visible man-made features and more negative scores for attributes which they perceive to reduce wildness. 7.2 Recommendations The analysis suggests that the four categories of wildness used in previous wildness mapping merit different weights. Any attempts to combine these previous wildness maps should use the weights which are listed in Table 7.1 above. NB Since the level of wildlife was not included in the previous mapping (and is not easy to estimate) the weight for this category can simply be ignored In addition, the analysis by market segmentation suggests that there are statistically-significant 5 differences in the wildness scores given to these attributes by the different population groups surveyed here. In particular, the organisation members included in this research tended to assign more-extreme wildness scores across all of the categories, while the residents sample tend to assign less negative wildness impacts to attributes such as modern structures, recreation infrastructure and built-up areas than the other two groups These differences should be borne in mind when endeavouring to understand the attitudes of different sub-groups. In particular, users of the results quoted here should consider carefully which set of attribute values ( main sample, residents sample or organisation members ) to use for each application. It is recommended that the results from the main sample reported here should provide the default values for general future wild-land mapping in Scotland. 5 at or above the 95% significance level Public Perception Survey of Wildness in Scotland 7.3
53 7 Conclusions/Recommendations It should also be noted that older built structures (defined here as bothies, abandoned cottages, crofts, castles and stone walls ) actually have a positive wildness score (ie score more-highly than the average wildness attribute) for all three sample groups Care is therefore required when combining built structures within wildness mapping. Additional research would be required to determine the wildness impacts of the various different sub-categories within this older built structures attribute In this research we combined various types of energy infrastructure (eg dams, pylons and wind turbines etc) into one attribute. However, 'it would be useful in any future research to separate these across separate attributes and investigate the impact each has individually. For example, it is likely that respondents will have different perceptions of the impact that wind turbines have on wildness compared to, say, hydroelectric dams, but this difference cannot be determined from the results of this Study. Given the importance of this combined Energy Infrastructure attribute (second only to Built up Areas, Small Towns and Villages in reducing perceived wildness), any future research in this area should consider a further disaggregation of this attribute Finally, the best-worst (most wild/least wild) approach used here could/should be extended to include additional monetary trade-offs (eg increases to taxation or visitor charges to protect or enhance particular attributes). Such additional research could facilitate a monetary valuation of the features which add to the general public s perception of Scotland s wildness and would add important additional evidence for the protection (or creation) of these features. Public Perception Survey of Wildness in Scotland 7.4
54 CONTACT DETAILS: Steering Group MVA Consultancy Loch Lomond and the Trossachs National Park Authority Lisa Duggan Landscapes Manager Sara Melville Landscape Adviser National Park Headquarters Carrochan, Carrochan Road, Balloch, G83 8EG Tel: Cairngorms National Park Authority Matthew Hawkins Heritage Manager 14 The Square, Grantown on Spey PH26 3HG Tel: Project Management Dr David Connolly Project Director Elaine Wilson Smith Project Manager MVA Consultancy, Prospect House, 5 Thistle Street, Edinburgh, EH2 1DF Tel: dconnolly@mvaconsultancy.com ewilsonsmith@mvaconsultancy.com Best/Worst Scaling Design and Analysis Dr Jonathan Crockett Technical Expert MVA Consultancy, City Tower, Piccadilly Plaza, Manchester, M1 4BT Tel: jcrockett@mvaconsultancy.com Scottish National Heritage Paul Roberts Operations Officer The Beta Centre, Innovation Park, University of Stirling, Stirling, FK9 4NF Tel: Paul.Roberts@snh.gov.uk Leeds University Stephen Carver Senior Lecturer School of Geography, University of Leeds, Leeds, LS2 9JT Tel: S.J.Carver@leeds.ac.uk
55 Appendix A Survey Questionnaire Public Perceptions of Wildness in Scotland Loch Lomond and the Trossachs National Park Authority, the Cairngorms National Park Authority and Scottish Natural Heritage are conducting a survey of the public's perception of 'wildness' and 'naturalness' of land cover in Scotland. MVA Consultancy and Research Now have been commissioned to design and conduct this survey using a representative sample of the Scottish population, and among residents of and visitors to the two National Parks. We fully adhere to the Market Research Society's Code of Conduct and can assure you that all information that you provide here will be treated in the strictest confidence. All responses will be anonymous and the data will be analysed and reported at such a level that no individual can be identified. If you have any questions about the research please contact Elaine Wilson Smith at MVA Consultancy either on or by ewilsonsmith@mvaconsultancy.com Q1. Where is the most 'wild' place/area you have ever been in Scotland?.. Q2. Are you a member of any outdoors, wildlife, and/or conservation organisations? (Tick all that apply) Not a member of any outdoor, wildlife or conservation organisation 0 John Muir Trust (JMT) 1 Scottish Mountaineering Club (SMC) 6 Mountaineering Council of Scotland 2 Scottish Wild Land Group 7 National Trust for Scotland (NTS) 3 Scottish Wildlife Trust (SWT) 8 Ramblers Association Scotland 4 Trees for Life 9 Royal Society for the Protection of 5 World Wildlife Fund (WWF) 10 Birds (RSPB) Other (tick and write in) 11 Q3 In the last 12 months, how often, on average, have you made a visit to the outdoors for leisure and recreation? (By outdoors, we mean any large open spaces in cities, towns or the countryside, including parks, woodland, farmland, beaches, etc). More than once a day 1 CONTINUE Every day 2 CONTINUE Several times a week 3 CONTINUE Once a week 4 CONTINUE Once or twice a month 5 CONTINUE Once every 2-3 months 6 CONTINUE Once or twice 7 CONTINUE Not made any such visits in the last 12 months 8 GO TO Q5
56 Q4 Which of the following activities have you participated in during your visits to the outdoors in the last 12 months? (Tick all that apply) Walking (Low Level) 1 Birdwatching 11 Hill walking 2 Other wildlife/nature watching 12 Rock Climbing 3 Running/jogging 13 Cycling (road-based) 4 Camping 14 Mountain biking (off road) 5 Sightseeing/visitor attractions 15 Horse riding 6 Picnicing 16 Fishing 7 Family day out 17 Watersports 8 Other (tick and write in) 18 Snowsports 9 Swimming 10 None/nothing/can't remember 19 Q5 Do you regularly visit the 'outdoors' for work purposes? Yes 1 No 2 Q6 Do you live in either of Scotland's National Parks, ie Loch Lomond and the Trossachs National Park or Cairngorms National Park? Live within the boundaries of Loch Lomond and the Trossachs National Park 1 Live within the boundaries of the Cairngorms National Park 2 Do not live within either of these two National Parks 3 Q7 How frequently do you visit: Park resident, Weekly Monthly Once or twice a Rarely Never N/A year (a) Loch Lomond and the Trossachs National Park (b) Cairngorms National Park (c) Other National Parks in the UK Q8a Please tick the statement which most-closely describes your current employment status: Self-employed 1 GO TO Q8b Employed (full-time or part-time) 2 GO TO Q8b Unwaged (looking after home or family, student, unemployed, retired etc) 3 GO TO Perceptions of Wildness Section Other 4 GO TO Perceptions of Wildness Section Q8b SELF-EMPLOYED & EMPLOYED ONLY: Please tick the statement which most-closely describes the location of your main job: My normal place of work lies within one of Scotland s National Park boundaries 1 GO TO Q8c My normal place of work is not in either of the National Parks 2 GO TO Perceptions of Wildness Section Q8c THOSE WHOSE WORK IN THE NATIONAL PARKS: Which industrial sector best describes your main job? Agriculture 1 Construction, Manufacturing & Distribution 6 Forestry 2 Transport and Communication 7 Catering/Leisure/Tourism 3 Public Sector Services 8 Energy and Water 4 Other (tick and write in) 9 Finance and Business 5
57 Perceptions of Wildness In the following section you will be presented with a series of descriptions of wildness in Scotland. Wildness will be described by four different aspects: the naturalness of the land cover and wildlife the presence of man-made structures and features its remoteness from roads and railway stations its terrain and climate In each situation we ll be asking you to select which descriptions you think are most wild and least wild. We ve provided some pictures with each description to help you in making your choices. Naturalness of the land cover and wildlife tells you about the presence of plants and animals and any evidence of use of the land by people. natural/semi-natural woodland plants, such as bushes and shrubs heaths, moors and other open areas water features, including rivers and lochs farming & domesticated animals/livestock natural wildlife Man-made structures and features tells you about the age, type, and size of any buildings and other human infrastructure which are present in the landscape. modern structures such as homes or industrial premises and activities older structures such as farms, lodges and bothies plantation forests power lines, dams or wind farms transport features such as roads and tracks for vehicles villages or small towns Remoteness tells you how far the location is from the nearest paved road. We ve described this using the time it would take for a typical able-bodied adult to walk to this point from the nearest public road. For example: one hours walk two hours walk three hours walk Terrain and climate tells you about the general appearance of an area, how difficult it is to move around, and how likely you might be to encounter extreme weather conditions. the height above sea level the presence of natural barriers such as cliff faces and lochs the steepness/gradient how easy it is to move around the area Q9 On a scale of one to three, where one is not very well and three is very well, how well do you think these aspects capture what you think of as wildness in Scotland? (Please tick one box only) Not very well 1 Quite well 2 Very well 3 Q10 Are there any other aspects which you feel contribute toward your perceptions of wildness in Scotland? (please write in)..
58 NOTE: RESPONDENTS ONLY SAW ONE SET OF SCENARIO S BETWEEN A AND E. SCENARIO A1 Picture Card A No visible man-made features 1 B Area heavily managed, made up of parks and gardens, and/or intensive stock grazing 10 C Moorland, actively managed by burning 21 D Landscape has one or two noticeable features (such as lochs), but is generally of low 14 altitude and is easy to move around E Native wildlife may be present in landscape, eg deer, eagle, red squirrel, wild cat, pine marten 16 Scenario A1: Questions Q11. Which of the descriptions above is most likely to increase your sense of wildness? Q12. And which is least likely to increase your sense of wildness? Q13. Of the remaining 3 descriptions, which of these is most likely to increase your sense of wildness? Q14. Of the remaining 2 descriptions, which of these is least likely to increase your sense of wildness? Enter Letter (A-E) SCENARIO A2 Picture Card A Energy infrastructure in landscape, eg wind turbines, pylons, dams, and associate 19 infrastructure B Moorland, actively managed by burning 21 C Landscape has noticeable features (such as cliff faces and boulder fields), with 11 extensive areas of high altitude and rough terrain which are difficult to move around D Older built structures in landscape, eg bothies, abandoned cottages, crofts, castles, 4 and stone walls E Area made up of semi-natural woodland, bracken or shrubs (gorse, heather and bilberry), and marsh area 7 Scenario A2: Questions Q15. Which of the descriptions above is most likely to increase your sense of wildness? Q16. And which is least likely to increase your sense of wildness? Q17. Of the remaining 3 descriptions, which of these is most likely to increase your sense of wildness? Q18. Of the remaining 2 descriptions, which of these is least likely to increase your sense of wildness? Enter Letter (A-E) SCENARIO A3 Picture Card A 4 hours walk from the nearest road or railway station - B No visible man-made features 1 C Native wildlife may be present in landscape, eg deer, eagles, red squirrel, wild cat, 16 and/or pine marten D Area made up of semi-natural woodland, bracken or shrubs (gorse, heather and 7 bilberry), and marsh area E Landscape is a mix of terrains with the occasional noticeable feature (such as lochs), and can be difficult to move around in places 13
59 Scenario A3: Questions Q19. Which of the descriptions above is most likely to increase your sense of wildness? Q20. And which is least likely to increase your sense of wildness? Q21. Of the remaining 3 descriptions, which of these is most likely to increase your sense of wildness? Q22. Of the remaining 2 descriptions, which of these is least likely to increase your sense of wildness? Enter Letter (A-E) SCENARIO A4 Picture Card A Landscape is of low altitude with no noticeable natural features, and is very easy to 15 move around B Physical evidence of recreation (eg 4 wheel drive tracks, hiking paths, ski lifts) and 18 field sports (eg hunting, shooting, fishing) in landscape C Area made up of semi-natural woodland, bracken or shrubs (gorse, heather and 7 bilberry), and marsh area D 1 hour walk from the nearest road or railway station - E Plantation forests in landscape (non-native conifers) 3 Scenario A4: Questions Q23. Which of the descriptions above is most likely to increase your sense of wildness? Q24. And which is least likely to increase your sense of wildness? Q25. Of the remaining 3 descriptions, which of these is most likely to increase your sense of wildness? Q26. Of the remaining 2 descriptions, which of these is least likely to increase your sense of wildness? Enter Letter (A-E) SCENARIO A5 Picture Card A Area made up of planted woodland and semi-natural grasslands. Some evidence of 8 manmade interventions, eg reservoirs B Landscape has one or two noticeable features (such as lochs), but is generally of low 13 altitude and is easy to move around C Modern built structures in landscape, eg working farms, isolated homes, deer fencing, 5 and small scale industrial land uses such as quarrying or mining D Built-up areas, eg small towns and villages 20 E 4 hours walk from the nearest road or railway station - Scenario A5: Questions Q27. Which of the descriptions above is most likely to increase your sense of wildness? Q28. And which is least likely to increase your sense of wildness? Q29. Of the remaining 3 descriptions, which of these is most likely to increase your sense of wildness? Q30. Of the remaining 2 descriptions, which of these is least likely to increase your sense of wildness? Enter Letter (A-E)
60 SCENARIO B1 Picture Card A No visible man-made features 1 B Area made up of natural broadleaf or coniferous woodland, heath or moor vegetation, 6 rivers, lochs, and streams, and bare rock surfaces C 5 hours walk from the nearest road or railway station - D Landscape has noticeable features (such as cliff faces and boulder fields), with 11 extensive areas of high altitude and rough terrain which are difficult to move around E Native wildlife may be present in landscape, eg deer, eagle, red squirrel, wild cat, pine marten 16 Scenario B1: Questions Q11. Which of the above descriptions is most likely to increase your sense of wildness? Q12. And which is least likely to increase your sense of wildness? Q13. Of the remaining 3 descriptions, which of these is most likely to increase your sense of wildness? Q14. Of the remaining 2 descriptions, which of these is least likely to increase your sense of wildness? Enter Letter (A-E) SCENARIO B2 Picture Card A Domestic livestock may be present in landscape, eg cattle and sheep 17 B Moorland, actively managed by burning 21 C Landscape is a mix of terrains with the occasional noticeable feature (such as lochs), 13 and can be difficult to move around in places D Long line features in landscape, eg roads, railways and/or vehicle tracks 2 E Area has evidence of farming, including drainage, ploughing and arable crops 9 Scenario B2: Questions Q15. Which of the above descriptions is most likely to increase your sense of wildness? Q16. And which is least likely to increase your sense of wildness? Q17. Of the remaining 3 descriptions, which of these is most likely to increase your sense of wildness? Q18. Of the remaining 2 descriptions, which of these is least likely to increase your sense of wildness? Enter Letter (A-E) SCENARIO B3 Picture Card A Moorland, actively managed by burning 21 B Plantation forests in landscape (non-native conifers) 3 C Physical evidence of recreation (eg 4 wheel drive tracks, hiking paths, ski lifts) and 18 field sports (eg hunting, shooting, fishing) in landscape D Area made up of planted woodland and semi-natural grasslands. Some evidence of 8 manmade interventions, eg reservoirs E Landscape has some areas of noticeable features (such as cliff faces and lochs), and high altitude, which are difficult to move around 12
61 Scenario B3: Questions Q19. Which of the above descriptions is most likely to increase your sense of wildness? Q20. And which is least likely to increase your sense of wildness? Q21. Of the remaining 3 descriptions, which of these is most likely to increase your sense of wildness? Q22. Of the remaining 2 descriptions, which of these is least likely to increase your sense of wildness? Enter Letter (A-E) SCENARIO B4 Picture Card A Landscape has some areas of noticeable features (such as cliff faces and lochs), and 12 high altitude, which are difficult to move around B Energy infrastructure in landscape, eg wind turbines, pylons, dams, and associate 19 infrastructure C Area heavily managed, made up of parks and gardens, and/or intensive stock grazing 10 D 2 hours walk from the nearest road or railway station - E Older built structures in landscape, eg bothies, abandoned cottages, crofts, castles, and stone walls 4 Scenario B4: Questions Q23. Which of the above descriptions is most likely to increase your sense of wildness? Q24. And which is least likely to increase your sense of wildness? Q25. Of the remaining 3 descriptions, which of these is most likely to increase your sense of wildness? Q26. Of the remaining 2 descriptions, which of these is least likely to increase your sense of wildness? Enter Letter (A-E) SCENARIO B5 Picture Card A Area made up of natural broadleaf or coniferous woodland, heath or moor vegetation, 6 rivers, lochs, and streams, and bare rock surfaces B Landscape has some areas of noticeable features (such as cliff faces and lochs), and 12 high altitude, which are difficult to move around C Long line features in landscape, eg roads, railways and/or vehicle tracks 2 D Domestic livestock may be present in landscape, eg cattle and sheep 17 E 4 hours walk from the nearest road or railway station - Scenario B5: Questions Q27. Which of the above descriptions is most likely to increase your sense of wildness? Q28. And which is least likely to increase your sense of wildness? Q29. Of the remaining 3 descriptions, which of these is most likely to increase your sense of wildness? Q30. Of the remaining 2 descriptions, which of these is least likely to increase your sense of wildness? Enter Letter (A-E)
62 SCENARIO C1 Picture Card A Plantation forests in landscape (non-native conifers) 3 B Area heavily managed, made up of parks and gardens, and/or intensive stock grazing 10 C 4 hours walk from the nearest road or railway station - D Landscape has noticeable features (such as cliff faces and boulder fields), with 11 extensive areas of high altitude and rough terrain which are difficult to move around E Physical evidence of recreation (eg 4 wheel drive tracks, hiking paths, ski lifts) and field sports (eg hunting, shooting, fishing) in landscape 18 Scenario C1: Questions Q11. Which of the above descriptions is most likely to increase your sense of wildness? Q12. And which is least likely to increase your sense of wildness? Q13. Of the remaining 3 descriptions, which of these is most likely to increase your sense of wildness? Q14. Of the remaining 2 descriptions, which of these is least likely to increase your sense of wildness? Enter Letter (A-E) SCENARIO C2 Picture Card A Native wildlife may be present in landscape, eg deer, eagle, red squirrel, wild cat, pine 16 marten B 1 hour walk from the nearest road or railway station - C Landscape has some areas of noticeable features (such as cliff faces and lochs), and 12 high altitude, which are difficult to move around D No visible man-made features 1 E Area has evidence of farming, including drainage, ploughing and arable crops 9 Scenario C2: Questions Q15. Which of the above descriptions is most likely to increase your sense of wildness? Q16. And which is least likely to increase your sense of wildness? Q17. Of the remaining 3 descriptions, which of these is most likely to increase your sense of wildness? Q18. Of the remaining 2 descriptions, which of these is least likely to increase your sense of wildness? Enter Letter (A-E) SCENARIO C3 Picture Card A 1 hour walk from the nearest road or railway station - B Modern built structures in landscape, eg working farms, isolated homes, deer fencing, 5 and small scale industrial land uses such as quarrying or mining C Built-up areas, eg small towns and villages 20 D Area heavily managed, made up of parks and gardens, and/or intensive stock grazing 10 E Landscape is a mix of terrains with the occasional noticeable feature (such as lochs), and can be difficult to move around in places 13
63 Scenario C3: Questions Q19. Which of the above descriptions is most likely to increase your sense of wildness? Q20. And which is least likely to increase your sense of wildness? Q21. Of the remaining 3 descriptions, which of these is most likely to increase your sense of wildness? Q22. Of the remaining 2 descriptions, which of these is least likely to increase your sense of wildness? Enter Letter (A-E) SCENARIO C4 Picture Card A Landscape is a mix of terrains with the occasional noticeable feature (such as lochs), 13 and can be difficult to move around in places B Energy infrastructure in landscape, eg wind turbines, pylons, dams, and associate 19 infrastructure C Area made up of planted woodland and semi-natural grasslands. Some evidence of 8 manmade interventions, eg reservoirs D 5 hours walk from the nearest road or railway station - E Older built structures in landscape, eg bothies, abandoned cottages, crofts, castles, and stone walls 4 Scenario C4: Questions Q23. Which of the above descriptions is most likely to increase your sense of wildness? Q24. And which is least likely to increase your sense of wildness? Q25. Of the remaining 3 descriptions, which of these is most likely to increase your sense of wildness? Q26. Of the remaining 2 descriptions, which of these is least likely to increase your sense of wildness? Enter Letter (A-E) SCENARIO C5 Picture Card A Area made up of natural broadleaf or coniferous woodland, heath or moor vegetation, 6 rivers, lochs, and streams, and bare rock surfaces B Landscape is a mix of terrains with the occasional noticeable feature (such as lochs), 13 and can be difficult to move around in places C Plantation forests in landscape (non-native conifers) 3 D Physical evidence of recreation (eg 4 wheel drive tracks, hiking paths, ski lifts) and 18 field sports (eg hunting, shooting, fishing) in landscape E 2 hours walk from the nearest road or railway station - Scenario C5: Questions Q27. Which of the above descriptions is most likely to increase your sense of wildness? Q28. And which is least likely to increase your sense of wildness? Q29. Of the remaining 3 descriptions, which of these is most likely to increase your sense of wildness? Q30. Of the remaining 2 descriptions, which of these is least likely to increase your sense of wildness? Enter Letter (A-E)
64 SCENARIO D1 Picture Card A Long line features in landscape, eg roads, railways and/or vehicle tracks 2 B Area made up of semi-natural woodland, bracken or shrubs (gorse, heather and 7 bilberry), and marsh area C 2 hours walk from the nearest road or railway station - D Landscape has one or two noticeable features (such as lochs), but is generally of low 14 altitude and is easy to move around E Domestic livestock may be present in landscape, eg cattle and sheep 17 Scenario D1: Questions Q11. Which of the above descriptions is most likely to increase your sense of wildness? Q12. And which is least likely to increase your sense of wildness? Q13. Of the remaining 3 descriptions, which of these is most likely to increase your sense of wildness? Q14. Of the remaining 2 descriptions, which of these is least likely to increase your sense of wildness? Enter Letter (A-E) SCENARIO D2 Picture Card A Built-up areas, eg small towns and villages 20 B Moorland, actively managed by burning 21 C Landscape is of low altitude with no noticeable natural features, and is very easy to 15 move around D Modern built structures in landscape, eg working farms, isolated homes, deer fencing, 5 and small scale industrial land uses such as quarrying or mining E Area made up of natural broadleaf or coniferous woodland, heath or moor vegetation, rivers, lochs, and streams, and bare rock surfaces 6 Scenario D2: Questions Q15. Which of the above descriptions is most likely to increase your sense of wildness? Q16. And which is least likely to increase your sense of wildness? Q17. Of the remaining 3 descriptions, which of these is most likely to increase your sense of wildness? Q18. Of the remaining 2 descriptions, which of these is least likely to increase your sense of wildness? Enter Letter (A-E) SCENARIO D3 Picture Card A 5 hours walk from the nearest road or railway station - B Plantation forests in landscape (non-native conifers) 3 C Physical evidence of recreation (eg 4 wheel drive tracks, hiking paths, ski lifts) and 18 field sports (eg hunting, shooting, fishing) in landscape D Area has evidence of farming, including drainage, ploughing and arable crops 9 E Landscape has one or two noticeable features (such as lochs), but is generally of low altitude and is easy to move around 14
65 Scenario D3: Questions Q19. Which of the above descriptions is most likely to increase your sense of wildness? Q20. And which is least likely to increase your sense of wildness? Q21. Of the remaining 3 descriptions, which of these is most likely to increase your sense of wildness? Q22. Of the remaining 2 descriptions, which of these is least likely to increase your sense of wildness? Enter Letter (A-E) SCENARIO D4 Picture Card A Landscape has one or two noticeable features (such as lochs), but is generally of low 14 altitude and is easy to move around B Energy infrastructure in landscape, eg wind turbines, pylons, dams, and associate 19 infrastructure C Area made up of natural broadleaf or coniferous woodland, heath or moor vegetation, 6 rivers, lochs, and streams, and bare rock surfaces D 1 hour walk from the nearest road or railway station - E Older built structures in landscape, eg bothies, abandoned cottages, crofts, castles, and stone walls 4 Scenario D4: Questions Q23. Which of the above descriptions is most likely to increase your sense of wildness? Q24. And which is least likely to increase your sense of wildness? Q25. Of the remaining 3 descriptions, which of these is most likely to increase your sense of wildness? Q26. Of the remaining 2 descriptions, which of these is least likely to increase your sense of wildness? Enter Letter (A-E) SCENARIO D5 Picture Card A Area made up of planted woodland and semi-natural grasslands. Some evidence of 8 manmade interventions, eg reservoirs B Landscape is of low altitude with no noticeable natural features, and is very easy to 15 move around C No visible man-made features 1 D Native wildlife may be present in landscape, eg deer, eagles, red squirrel, wild cat, 16 and/or pine marten E 2 hours walk from the nearest road or railway station - Scenario D5: Questions Q27. Which of the above descriptions is most likely to increase your sense of wildness? Q28. And which is least likely to increase your sense of wildness? Q29. Of the remaining 3 descriptions, which of these is most likely to increase your sense of wildness? Q30. Of the remaining 2 descriptions, which of these is least likely to increase your sense of wildness? Enter Letter (A-E)
66 SCENARIO E1 Picture Card A Modern built structures in landscape, eg working farms, isolated homes, deer fencing, 5 and small scale industrial land uses such as quarrying or mining B Area made up of semi-natural woodland, bracken or shrubs (gorse, heather and 6 bilberry), and marsh area C 5 hours walk from the nearest road or railway station - D Landscape has some areas of noticeable features (such as cliff faces and lochs), and 12 high altitude, which are difficult to move around E Built-up areas, eg small towns and villages 20 Scenario E1: Questions Q11. Which of the above descriptions is most likely to increase your sense of wildness? Q12. And which is least likely to increase your sense of wildness? Q13. Of the remaining 3 descriptions, which of these is most likely to increase your sense of wildness? Q14. Of the remaining 2 descriptions, which of these is least likely to increase your sense of wildness? Enter Letter (A-E) SCENARIO E2 Picture Card A Domestic livestock may be present in landscape, eg cattle and sheep 17 B 5 hours walk from the nearest road or railway station - C Landscape is of low altitude with no noticeable natural features, and is very easy to 15 move around D Long line features in landscape, eg roads, railways and/or vehicle tracks 2 E Area heavily managed, made up of parks and gardens, and/or intensive stock grazing 10 Scenario E2: Questions Q15. Which of the above descriptions is most likely to increase your sense of wildness? Q16. And which is least likely to increase your sense of wildness? Q17. Of the remaining 3 descriptions, which of these is most likely to increase your sense of wildness? Q18. Of the remaining 2 descriptions, which of these is least likely to increase your sense of wildness? Enter Letter (A-E) SCENARIO E3 Picture Card A 4 hours walk from the nearest road or railway station - B Older built structures in landscape, eg bothies, abandoned cottages, crofts, castles, 4 and stone walls C Energy infrastructure in landscape, eg wind turbines, pylons, dams, and associate 19 infrastructure D Area has evidence of farming, including drainage, ploughing and arable crops 9 E Landscape is of low altitude with no noticeable natural features, and is very easy to move around 15
67 Scenario E3: Questions Q19. Which of the above descriptions is most likely to increase your sense of wildness? Q20. And which is least likely to increase your sense of wildness? Q21. Of the remaining 3 descriptions, which of these is most likely to increase your sense of wildness? Q22. Of the remaining 2 descriptions, which of these is least likely to increase your sense of wildness? Enter Letter (A-E) SCENARIO E4 Picture Card A Landscape has noticeable features (such as cliff faces and boulder fields), with 11 extensive areas of high altitude and rough terrain which are difficult to move around B Domestic livestock may be present in landscape, eg cattle and sheep 17 C Area made up of planted woodland and semi-natural grasslands. Some evidence of 8 manmade interventions, eg reservoirs D 1 hour walk from the nearest road or railway station - E Long line features in landscape, eg roads, railways and/or vehicle tracks 2 Scenario E4: Questions Q23. Which of the above descriptions is most likely to increase your sense of wildness? Q24. And which is least likely to increase your sense of wildness? Q25. Of the remaining 3 descriptions, which of these is most likely to increase your sense of wildness? Q26. Of the remaining 2 descriptions, which of these is least likely to increase your sense of wildness? Enter Letter (A-E) SCENARIO E5 Picture Card A Area has evidence of farming, including drainage, ploughing and arable crops 9 B Landscape has noticeable features (such as cliff faces and boulder fields), with 11 extensive areas of high altitude and rough terrain which are difficult to move around C Modern built structures in landscape, eg working farms, isolated homes, deer fencing, 5 and small scale industrial land uses such as quarrying or mining D Built-up areas, eg small towns and villages 20 E 2 hours walk from the nearest road or railway station - Scenario E5: Questions Q27. Which of the above descriptions is most likely to increase your sense of wildness? Q28. And which is least likely to increase your sense of wildness? Q29. Of the remaining 3 descriptions, which of these is most likely to increase your sense of wildness? Q30. Of the remaining 2 descriptions, which of these is least likely to increase your sense of wildness? Enter Letter (A-E)
68 Importance of Wild Areas in Scotland Q31. On a five point scale, where 1 is very important and 5 is not at all important, please indicated how important you think it is that Scotland has wild areas? 1 Very Important 1 CONTINUE 2 2 CONTINUE 3 3 GO TO Q GO TO Q33 5 Not at all important 5 GO TO Q33 0 Don t Know 0 GO TO Q33 Q32. Please explain why you think it is important that Scotland has wild areas... Q33. Do you think that wild areas in Scotland are under threat? Yes 1 No 2 Don't know 3 Q34. Do you believe that action is necessary to preserve wild land in Scotland? Yes 1 CONTINUE No 2 GO TO Q36a Don t Know 3 GO TO Q36a Q35. Which of these actions do you think should be taken to preserve wild areas in Scotland? (Please tick up to three actions only) The introduction of specific 'wild land' designation 1 Effective control over new vehicle hill tracks 2 Effective planning control for buildings 3 Effective planning control for wind turbines 4 Effective planning control for telephone masts and pylons 5 Make some areas wild again, for example by removing selected human features, reducing grazing and restoring natural vegetation Species re-introductions, for example beaver, lynx, sea eagle, osprey, boar, etc. 7 Effective management of farming, forestry and fishing 8 Fewer purpose built paths, including signage and track removal 9 Other (write in) None/Nothing 11 Don't Know Q36a. On a five point scale, where 1 is very important and 5 is not at all important; please indicate how important you think it is to protect wild areas in Scotland? Very Important Not at all Important OR TICK Don t Know 6
69 Q36b. On a five point scale, where 1 is very important and 5 is not at all important; please indicate how important you think it is to promote economic development in rural areas of Scotland? Very Important Not at all Important OR TICK Don t Know 6 Demographics This section asks 5 questions which will help us ensure that this survey is representative of the whole population and will allow us to identify how opinions differ between different sub-groups of the population. Q37. Would you mind answering a question about what sex you are? Rather not say 0 Male 1 Female 2 Q38. Please indicate the age group you fall within: Rather not say Q39. Which Local Authority area do you live in? Aberdeen City 1 Highland 17 Aberdeenshire 2 Inverclyde 18 Angus 3 Midlothian 19 Argyll & Bute 4 Moray 20 Clackmannanshire 5 North Ayrshire 21 Dumfries & Galloway 6 North Lanarkshire 22 Dundee City 7 Orkney Islands 23 East Ayrshire 8 Perth & Kinross 24 East Dunbartonshire 9 Renfrewshire 25 East Lothian 10 Scottish Borders 26 East Renfrewshire 11 Shetland Islands 27 Edinburgh, City of 12 South Ayrshire 28 Eilean Siar 13 South Lanarkshire 29 Falkirk 14 Stirling 30 Fife 15 West Dunbartonshire 31 Glasgow City 16 West Lothian 32 Other, please specify 33 Q40. Which of the following, best describe the area you live in? Large Urban Area 1 Small Town 3 Other Urban Area 2 Rural Area 4
70 Q41. Finally, please indicate to which occupational group the Chief Income Earner in your household belongs, or which group fits best. This could be you: the Chief Income Earner is the person in your household with the largest income. If the Chief Income Earner is retired and has an occupational pension please answer for their most recent occupation. If the Chief Income Earner is not in paid employment but has been out of work for less than 6 months, please answer for their most recent occupation. 1. Semi or unskilled manual work (e.g. Manual workers, All apprentices to be skilled trades, Caretaker, Park keeper, Non-HGV driver, Shop assistant) 2. Skilled manual worker (e.g. Skilled Bricklayer, Carpenter, Plumber, Painter, Bus/Ambulance Driver, HGV driver, AA patrolman, Pub/Bar Worker, etc) 3. Supervisory or clerical/ junior managerial/ professional/ administrative (e.g. Office worker, Student Doctor, Foreman with 25+ employees, Salesperson, etc) 4. Intermediate managerial/ professional/ administrative (e.g. Newly qualified (under 3 years) doctor, Solicitor, Board director small organisation, Middle manager in large organisation, Principal officer in civil service/local government) 5. Higher managerial/ professional/ administrative (e.g. Established doctor, Solicitor, Board Director in a large organisation [200+ employees, top level civil servant/public service employee]) Student 6 7. Casual worker not in permanent employment 7 8. Housewife/ Homemaker 8 9. Retired and living on state pension Unemployed or not working due to long-term sickness Full-time carer of other household member Other (Please Specify) 12 Thank you for your time in completing this survey, your views are very helpful.
71 Appendix B Supporting Picture Cards

72 Richard Webb No visible manmade features Picture 1


73 Long line features in landscape, egroads, railways, and vehicle tracks Picture 2


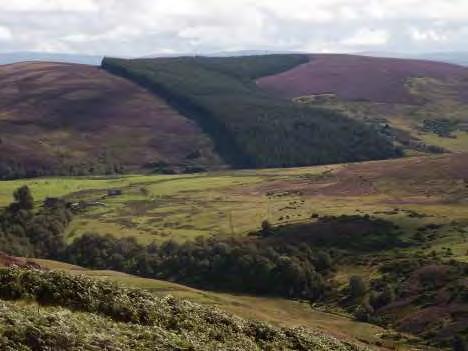
74 Plantation forests in landscape (non-native conifer) Picture 3


75 Older built structures in landscape, egbothies, abandoned cottages, crofts, castles and stone walls Picture 4


76 Modern built structures in landscape, egworking farms, isolated homes, deer fencing, and small scale industrial land uses such as quarrying or mining Picture 5


77 Area made up of natural broadleaf or coniferous woodland, heath or moor vegetation, rivers, lochs, and streams, and bare rock surfaces Lairich Rig Picture 6


78 Area made up of seminatural woodland, bracken or shrubs (gorse, heather and bilberry), and marsh area Trish Steel Picture 7


79 Area made up of planted woodland and semi-natural grasslands. Some evidence of manmade interventions, eg reservoirs Picture 8


80 Area has evidence of farming, including drainage, ploughing, and arable crops Keith Evans Picture 9


81 Area heavily managed, made up of parks and gardens and intensive stock grazing Ken Bagnall Brian Robert Marshall Picture 10


82 Helmutt Zozimann Michael Graham Landscape has noticeable features (such as cliff faces and boulder fields), with extensive areas of high altitude and rough terrain which are difficult to move around Picture 11 Adam Ward


, and")


83 Landscape has some areas of noticeable features (such as cliff faces and lochs), and high altitude, which are difficult to move around Alice H Myers Picture 12


84 Landscape is a mix of terrains with the occasional noticeable feature (such as lochs), and can be difficult to move around in places Picture 13
, but is")

85 Landscape has one or two noticeable features (such as lochs), but is generally of low altitude and is easy to move around Chris Downer Picture 14

86 Picture 15


87 Native wildlife may be present in landscape, eg deer, eagles, red squirrel, wild cat, and pine marten Picture 16


88 Walter Baxter Stephen Craven Domestic livestock may be present in landscape, eg cattle and sheep Picture 17 Evelyn Simak

 and")
 in")

89 Physical evidence of recreation (eg4 wheel drive tracks, hiking paths, ski lifts) and field sports (eghunting, shooting, fishing) in landscape Mick Garratt Dave Croker Phillip Williams Picture 18


90 Energy infrastructure in landscape, egwind turbines, pylons, dams and associated infrastructure Picture 19


91 Mike Pennington Colin Smith Built-up areas, egsmall towns and villages Walter Baxter Anne Burgess Picture 20


92 Moorland actively managed by burning Picture 21
93 Appendix C Key Attributes 1 Introduction 1.1 In this Appendix we provide the detailed descriptions of each of the wildness attributes, as they appeared in the material presented to the respondents taking part in the three surveys. 2 Naturalness of the land cover and wildlife Area made up of natural broadleaf or coniferous woodland, heath or moor vegetation, rivers, lochs, and streams, and bare rock surfaces Area made up of semi-natural woodland, bracken or shrubs (gorse, heather and bilberry), and marsh area Area made up of planted woodland and semi-natural grasslands. Some evidence of manmade interventions, eg reservoirs Area has evidence of farming, including drainage, ploughing and arable crops Area heavily managed, made up of parks and gardens, and/or intensive stock grazing Native wildlife may be present in landscape, eg red deer, eagles, red squirrel, wild cat, and/or pine marten Domestic livestock may be present in landscape, eg cattle and sheep 3 Presence of man-made structures and features No visible man-made features Long line features in landscape, eg roads, railways and/or vehicle tracks Plantation forests in landscape (non-native conifers) Older built structures in landscape, eg bothies, abandoned cottages, crofts, castles, and stone walls Modern built structures in landscape, eg working farms, isolated homes, deer fencing, and small scale industrial land uses such as quarrying or mining Moorland, actively managed by burning Physical evidence of recreation (eg 4 wheel drive tracks, hiking paths, ski lifts) and field sports (eg hunting, shooting, fishing) in landscape
94 Energy infrastructure in landscape, eg wind turbines, pylons, dams, and associate infrastructure Built-up areas, eg small towns and villages 4 Remoteness from roads and railway stations Five hours walk from the nearest road or railway station Four hours walk from the nearest road or railway station Two hours walk from the nearest road or railway station One hours walk from the nearest road or railway station 5 Terrain Landscape has noticeable features (such as cliff faces and boulder fields), with extensive areas of high altitude and rough terrain which are difficult to move around Landscape has some areas of noticeable features (such as cliff faces and lochs), and high altitude, which are difficult to move around Landscape is a mix of terrains with the occasional noticeable feature (such as lochs), and can be difficult to move around in places Landscape has one or two noticeable features (such as lochs), but is generally of low altitude and is easy to move around Landscape is of low altitude with no noticeable natural features, and is very easy to move around
95 Appendix D Detailed Analysis Methods 1 Introduction 1.1 In this appendix we provide details of the sampling and analysis used in the three surveys. 2 Data Weighting Firstly, the main sample and the residents sample profiles were compared against the relevant populations in order to determine if weighting was required to ensure representativeness within the results. However, it was found that the achieved samples were similar enough in nature to the populations that data weighting was not required. 3 Data Segmentation Across all sections of the questionnaire the results were analysed by the three separate sample groups: main sample (ie the online panel representative of the Scottish population); residents sample (ie the face-to-face booster survey with residents in each of Scotlands two National Parks, representative of the populations within these Parks); and organisation members (ie those invited to complete the online questionnaire via one of the relevant organisations). In addition, market segmentation was undertaken within the main sample. This utilised responses provided to the demographic section, and included: gender; age (although for analysis purposes age groups and 75+ were combined due to the low numbers within the 75+ group); urban/rural (which was created by combining large urban areas and other urban areas to create the variable for Urban ; and small town and rural area to create the variable for Rural ); and socio-economic group, grouped into ABC1 and C2DE for analysis purposes. This variable was created based on responses regarding the chief income earners occupational group, with responses recoded as outlined in Table D.1 to provide the socio-economic group for analysis.
96 Table D.1 Socio-Economic Group Chief Income Earners Occupational Group Semi or unskilled manual work Skilled manual worker Supervisory or clerical/junior managerial/ professional/administrative Intermediate managerial/professional/ administrative Higher managerial/professional/administrative Student Casual worker not in permanent employment Housewife/Homemaker Retired and living on state pension Unemployed or not working due to long-term sickness Full-time carer of other household member Socio-Economic Group C2DE C2DE ABC1 ABC1 ABC1 ABC1 C2DE C2DE C2DE C2DE C2DE 4 Analysis Methods The questionnaire was essentially split into two sections for analysis purposes, with the initial questions on respondents use of the outdoors, ie Q1 to Q10, and the final questions on the importance of wildness, ie Q31 to Q36b being subject to more descriptive types of data analysis, and the scenarios presented within the perceptions of wildness section being subject to best-worst choice modelling data analysis. Descriptive Analysis Essentially, crosstabulations were run for each question. These involved, firstly, crosstabulations by sample type; and then, for the main sample only, crosstabs by each of the four market segments outlined above. Chi-square tests were also performed on each crosstabulation in order to identify any significant differences between the respondent categories. Only those results that showed a significant difference were then described in the reporting. The only variation to this was in conducting a comparison between the two questions, importance of protecting wild areas in Scotland and the importance of promoting economic development (ie Q36a and Q36b). The aim of this comparison was to determine which of these two options was seen as more important to respondents.
97 Both questions were asked in the same way, with respondents indicating levels of importance across a five point scale. The mean score was calculated for each of the questions for each of the three sample types, along with the upper and lower confidence intervals associated with each mean. These were then compared to identify if/where there were statistically significant differences between the mean values, and to determine if and/or what element was considered to be more important. Best-Worst Analysis Design The design of the Wildness Best-Worst Scaling experiment followed a series of sequential steps: selection of a range of attributes which defined wildness, eg terrain or the presence of wild animals; each attribute then had a number of levels attached to it using text and/or images which can be easily understood by respondents. For example, a level for the attribute Perceived naturalness might be Some small plantations at the edge of the area or for the attribute Extent of area it could be a numerical value in hectares (if understood) or a proportion of an area; based on the number of attributes and their levels, an orthogonal statistical design giving the number of scenarios to be presented to each respondent was selected. The maximum number of scenarios to be presented to a respondent in the survey was capped at five using a technique known as blocking to minimise cognitive burden; and scenarios were then worked up for presentation to respondents in the field. For illustration only, Figure D.1 presents an illustrative mock-up of how a choice scenario for the wildness research looked. In this example we have provided descriptive text only for ease of presentation, but the final survey also included photographic material to help respondents visualise the attribute level presented, as detailed in Appendix B. Online and face-toface interviews allowed for the collection of the full best-worst scale for each scenario, and also for the inclusion of supplementary information such as graphics, extended descriptions, or maps either as show cards or via buttons where More Information can be requested.

98 Figure D.1 Example of Best-Worst Scaling Scenario Respondents were firstly asked to pick their best or most wild alternative, then their worst or least wild alternative. This was extended to their second best/worst alternative until all alternatives had been ranked. The first choice gave us four data points (eg A is wilder than B to E), the second choice gave us three data points (eg B is wilder than C to E), and so on. Thus, for each scenario the respondent, with five attributes on offer, provided us with their perception of wildness ten times. Repeating the experiment with five different sets of scenarios to rank therefore gives a total of 50 (= 5 x 10) wildness-ranking observations per respondent. The ordering of the attributes in the final experiment was randomised across scenarios to further reduce the potential for bias. Analysis Best-worst scaling experiments can be analysed using either regression or choice modelling techniques. For the purposes of this research, we used an exploded logit whereby each preference on the best-worst scale for a given scenario is converted into an equivalent choice 1. Statistical analysis of this nature is based on the concept of utility theory (the degree of satisfaction provided by the alternatives on offer). Individuals are assumed to choose the alternative which is best [or wildest ] and therefore maximises satisfaction or utility, where utility is taken to be a construct of the choice alternative (the attributes of wildness). By comparing the relative influence of one attribute against another, through the parameters which result from the statistical models, it is possible to infer its relative 1 As respondents progress through a best-worst scaling task in a given scenario, alternatives selected at previous stages are removed from the choice set available at subsequent stages in the statistical analysis.
Cairngorms National Park Visitor Survey 2009/2010 Summary
 Cairngorms National Park Visitor Survey 2009/2010 Summary Published by Cairngorms National Park Authority Cairngorms National Park Visitor Survey 2009/2010 Summary Please contact the Cairngorms National
Recreational Carrying Capacity
 9 th Annual Caribbean Sustainable Tourism Conference Recreational Carrying Capacity Graham C Barrow What is Recreational Carrying Capacity? It s not about fixing absolute numbers of visitors/tourists that
Tourism Industry Council Tasmania Community Survey 2018 Research Report. May 2018
 Tourism Industry Council Tasmania Community Survey 2018 Research Report May 2018 This report has been prepared by Enterprise Marketing and Research Services 60 Main Road, Moonah TAS 7009 All enquiries
SECTION ONE. Scotland s National Parks and National Nature Reserves Ten Things You Might Not Know
 SECTION ONE Scotland s National Parks and National Nature Reserves Ten Things You Might Not Know 5 Ten Things You Might Not Know... 1. SCOTLAND S NATIONAL PARKS AND NATIONAL NATURE RESERVES ARE BEAUTIFUL,
The tourism value of the natural environment and outdoor activities in
 The tourism value of the natural environment and outdoor activities in the South West Produced on behalf of the South West Coast Path Association By The South West Research Company Ltd January 2016 1 Contents
COMMUNITY BASED TOURISM DEVELOPMENT (A Case Study of Sikkim)
") COMMUNITY BASED TOURISM DEVELOPMENT (A Case Study of Sikkim) SUMMARY BY RINZING LAMA UNDER THE SUPERVISION OF PROFESSOR MANJULA CHAUDHARY DEPARTMENT OF TOURISM AND HOTEL MANAGEMENT KURUKSHETRA UNIVERSITY,
COMMUNITY BASED TOURISM DEVELOPMENT (A Case Study of Sikkim) SUMMARY BY RINZING LAMA UNDER THE SUPERVISION OF PROFESSOR MANJULA CHAUDHARY DEPARTMENT OF TOURISM AND HOTEL MANAGEMENT KURUKSHETRA UNIVERSITY,
SCOTLAND S PEOPLE AND NATURE SURVEY 2013/14 SPECIAL INTEREST REPORT NO.1 PARTICIPATION IN OUTDOOR RECREATION
 SCOTLAND S PEOPLE AND NATURE SURVEY 013/14 SPECIAL INTEREST REPORT NO.1 PARTICIPATION IN OUTDOOR RECREATION 1. Background This summary report on participation in outdoor recreation is one of a series describing
PEMBROKESHIRE & CORNWALL VISITOR SURVEYS 2011/12 COMPARING THE DESTINATIONS. February 2013
 PEMBROKESHIRE & CORNWALL VISITOR SURVEYS 2011/12 COMPARING THE DESTINATIONS February 2013 Prepared for: Visit / Destination Pembrokeshire Partnership Client Contact: Emma Rojano/ Mark Horner TERMS OF CONTRACT
Produced by: Destination Research Sergi Jarques, Director
 Produced by: Destination Research Sergi Jarques, Director Economic Impact of Tourism Epping Forest - 2014 Economic Impact of Tourism Headline Figures Epping Forest - 2014 Total number of trips (day & staying)
Produced by: Destination Research Sergi Jarques, Director
 Produced by: Destination Research Sergi Jarques, Director Economic Impact of Tourism Norfolk - 2017 Contents Page Summary Results 2 Contextual analysis 4 Volume of Tourism 7 Staying Visitors - Accommodation
Produced by: Destination Research Sergi Jarques, Director
 Produced by: Destination Research Sergi Jarques, Director Economic Impact of Tourism Oxfordshire - 2015 Economic Impact of Tourism Headline Figures Oxfordshire - 2015 Total number of trips (day & staying)
National Park Authority Board Meeting
 Paper for decision 1. Introduction 1.1 Preparations for the introduction of four Camping Management Zones (covering less than 4% of the National Park) have progressed significantly since Scottish Ministers
2009 Muskoka Airport Economic Impact Study
 2009 Muskoka Airport Economic Impact Study November 4, 2009 Prepared by The District of Muskoka Planning and Economic Development Department BACKGROUND The Muskoka Airport is situated at the north end
The Economic Impact of Tourism West Oxfordshire Prepared by: Tourism South East Research Unit 40 Chamberlayne Road Eastleigh Hampshire SO50 5JH
 The Economic Impact of Tourism West Oxfordshire 2014 Prepared by: Tourism South East Research Unit 40 Chamberlayne Road Eastleigh Hampshire SO50 5JH CONTENTS 1. Summary of Results 1 1.1 Introduction 1
Produced by: Destination Research Sergi Jarques, Director
 Produced by: Destination Research Sergi Jarques, Director Economic Impact of Tourism North Norfolk District - 2016 Contents Page Summary Results 2 Contextual analysis 4 Volume of Tourism 7 Staying Visitors
Produced by: Destination Research Sergi Jarques, Director
 Produced by: Destination Research Sergi Jarques, Director Economic Impact of Tourism Norfolk - 2016 Contents Page Summary Results 2 Contextual analysis 4 Volume of Tourism 7 Staying Visitors - Accommodation
The Economic Impact of Tourism on Scarborough District 2014
 The Economic Impact of Tourism on Scarborough District 2014 Prepared by: Tourism South East Research Unit 40 Chamberlayne Road Eastleigh Hampshire SO50 5JH CONTENTS 1. Summary of Results 1 2. Table of
The Economic Impact of Tourism on the District of Thanet 2011
 The Economic Impact of Tourism on the District of Thanet 2011 Prepared by: Tourism South East Research Unit 40 Chamberlayne Road Eastleigh Hampshire SO50 5JH CONTENTS 1. Summary of Results 1 2. Table of
Baku, Azerbaijan November th, 2011
 Baku, Azerbaijan November 22-25 th, 2011 Overview of the presentation: Structure of the IRTS 2008 Main concepts IRTS 2008: brief presentation of contents of chapters 1-9 Summarizing 2 1 Chapter 1 and Chapter
2013 Travel Survey. for the States of Guernsey Commerce & Employment Department RESEARCH REPORT ON Q1 2013
 213 Travel Survey for the States of Guernsey Commerce & Employment Department RESEARCH REPORT ON Q1 213 May 21st 213 Table of Contents Page No. Summary of Results 1 Survey Results 2 Breakdown of departing
Produced by: Destination Research Sergi Jarques, Director
 Produced by: Destination Research Sergi Jarques, Director Economic Impact of Tourism Oxfordshire - 2016 Economic Impact of Tourism Headline Figures Oxfordshire - 2016 number of trips (day & staying) 27,592,106
Official Journal of the European Union L 7/3
 12.1.2010 Official Journal of the European Union L 7/3 COMMISSION REGULATION (EU) No 18/2010 of 8 January 2010 amending Regulation (EC) No 300/2008 of the European Parliament and of the Council as far
Stakeholder Perspectives on the Potential for Community-based Ecotourism Development and Support for the Kgalagadi Transfrontier Park in Botswana
 Stakeholder Perspectives on the Potential for Community-based Ecotourism Development and Support for the Kgalagadi Transfrontier Park in Botswana Naomi Moswete, University of Botswana Brijesh Thapa, University
RECREATION. Seven issues were identified that pertain to the effects of travel management on outdoor recreation within portions of the project area.
 RECREATION Seven issues were identified that pertain to the effects of travel management on outdoor recreation within portions of the project area. OPPORTUNITIES FOR SOLITUDE / QUIET TRAILS. One attraction
The Economic Impact of Tourism on Calderdale Prepared by: Tourism South East Research Unit 40 Chamberlayne Road Eastleigh Hampshire SO50 5JH
 The Economic Impact of Tourism on Calderdale 2015 Prepared by: Tourism South East Research Unit 40 Chamberlayne Road Eastleigh Hampshire SO50 5JH CONTENTS 1. Summary of Results 1 2. Table of Results Table
PRIORITY HABITAT SURVEY 2017 SWALEDALE. Summary. July 2018
 PRIORITY HABITAT SURVEY 2017 SWALEDALE Summary July 2018 Conservation & Monitoring Report No: Lead Author(s): Tony Serjeant & Sue Thurley Incorporating comments from: Gary Smith & Gordon Haycock (16/07/18)
Copyrighted material - Taylor & Francis
 444 CHAPTER ELEVEN The public sector and tourism BOX 11.2: CASE STUDY: THE SCOTTISH TOURISM FRAMEWORK FOR ACTION 2002 2005 AND SCOTTISH TOURISM THE NEXT DECADE: A FRAMEWORK FOR TOURISM CHANGE 2006 2015
Labrador - Island Transmission Link Target Rare Plant Survey Locations
 27-28- Figure: 36 of 55 29-28- Figure: 37 of 55 29- Figure: 38 of 55 #* Figure: 39 of 55 30- - east side Figure: 40 of 55 31- Figure: 41 of 55 31- Figure: 42 of 55 32- - secondary Figure: 43 of 55 32-
1.4 Previous research on New Zealand subantarctic tourism
 Figure 5 The subantarctic islands are nature reserves protecting habitats of great conservation value, such as that of the Southern Royal albatross, seen here at the Auckland Islands. Tourist visits must
Figure 1.1 St. John s Location. 2.0 Overview/Structure
 St. John s Region 1.0 Introduction Newfoundland and Labrador s most dominant service centre, St. John s (population = 100,645) is also the province s capital and largest community (Government of Newfoundland
Royal Parks Stakeholder Research Programme 2014
 1 Royal Parks Stakeholder Research Programme 2014 Park profile: Greenwich Park (Waves 1-3) January 2015 Technical note 2 This slide deck presents findings from three waves of survey research conducted
ANGLIAN WATER GREEN BOND
 ANGLIAN WATER GREEN BOND DNV GL ELIGIBILITY ASSESSMENT Scope and Objectives Anglian Water Services Financing Plc is the financing subsidiary of Anglian Water Services Limited. References in this eligibility
Gold Coast: Modelled Future PIA Queensland Awards for Planning Excellence 2014 Nomination under Cutting Edge Research category
 Gold Coast: Modelled Future PIA Queensland Awards for Planning Excellence 2014 Nomination under Cutting Edge Research category Jointly nominated by SGS Economics and Planning and City of Gold Coast August
IOW Ramblers Submission Paper to the Sept 2016 ROW Improvement Plan Consultation.
 IOW Ramblers Submission Paper to the Sept 2016 ROW Improvement Plan Consultation. The current Island Rights of Way Improvement Plan is a comprehensive document and much of its content is still relevant
SOCIAL ENTERPRISE IN EDINBURGH: PEOPLE, PROFIT AND PLACE
 SOCIAL ENTERPRISE IN EDINBURGH: PEOPLE, PROFIT AND PLACE Introduction Edinburgh is a leading centre for social enterprise and home to some high profile organisations in the sector. With over 70 members,
JATA Market Research Study Passenger Survey Results
 JATA Market Research Study Passenger Survey Results Prepared for the Jackson Area Transportation Authority (JATA) April, 2015 3131 South Dixie Hwy. Suite 545 Dayton, OH 45439 937.299.5007 www.rlsandassoc.com
Economic Impact Analysis. Tourism on Tasmania s King Island
 Economic Impact Analysis Tourism on Tasmania s King Island i Economic Impact Analysis Tourism on Tasmania s King Island This project has been conducted by REMPLAN Project Team Matthew Nichol Principal
The Value of Activities for Tourism
 The Value of Activities for Tourism Introduction The measurement of activities undertaken during tourism trips is an important element of all the three main tourism monitors the GBTS (domestic overnight),
IATOS 2003 Outdoor Enthusiast Survey CTC Market Research March, 2003
 IATOS 2003 Outdoor Enthusiast Survey CTC Market Research March, 2003 The IATOS Expo (International Adventure Travel and Outdoor Sports Show, Chicago, February 2003) provided the CTC s Outdoor Product Development
Arrangements for the delivery of minor highway maintenance services by Town and Parish Councils
 Arrangements for the delivery of minor highway maintenance services by Town and Parish Councils Cabinet Date of Meeting 8 March 2017 Officer Cllr Peter Finney, Cabinet Member for Environment, Infrastructure
The Economic Impact of Tourism New Forest Prepared by: Tourism South East Research Unit 40 Chamberlayne Road Eastleigh Hampshire SO50 5JH
 The Economic Impact of Tourism New Forest 2008 Prepared by: Tourism South East Research Unit 40 Chamberlayne Road Eastleigh Hampshire SO50 5JH CONTENTS Glossary of terms 1 1. Summary of Results 4 2. Table
Analysis of en-route vertical flight efficiency
 Analysis of en-route vertical flight efficiency Technical report on the analysis of en-route vertical flight efficiency Edition Number: 00-04 Edition Date: 19/01/2017 Status: Submitted for consultation
POLICE AND FIRE & RESCUE SCRUTINY SUB-COMMITTEE. Consultation, Annual Review of Policing 2017/18 by Scottish Police Authority (SPA)
") To: POLICE AND FIRE & RESCUE SCRUTINY SUB-COMMITTEE On: 22 MAY 2018 Report by: DIRECTOR OF ENVIRONMENT & COMMUNITIES Heading: Consultation, Annual Review of Policing 2017/18 by Scottish Police Authority
To: POLICE AND FIRE & RESCUE SCRUTINY SUB-COMMITTEE On: 22 MAY 2018 Report by: DIRECTOR OF ENVIRONMENT & COMMUNITIES Heading: Consultation, Annual Review of Policing 2017/18 by Scottish Police Authority
The results of the National Tourism Development Strategy Assessments
 The results of the National Tourism Development Strategy Assessments - 2012 (I) The assessment tool In 2012 the Sustainable Tourism Working Group of the CEEweb for Biodiversity prepared a guidance for
The Economic Impact of Tourism Brighton & Hove Prepared by: Tourism South East Research Unit 40 Chamberlayne Road Eastleigh Hampshire SO50 5JH
 The Economic Impact of Tourism Brighton & Hove 2013 Prepared by: Tourism South East Research Unit 40 Chamberlayne Road Eastleigh Hampshire SO50 5JH CONTENTS 1. Summary of Results 1 1.1 Introduction 1 1.2
PERFORMANCE MEASURE INFORMATION SHEET #16
 PERFORMANCE MEASURE INFORMATION SHEET #16 ARROW LAKES RESERVOIR: RECREATION Objective / Location Recreation/Arrow Lakes Reservoir Performance Measure Access Days Units Description MSIC 1) # Access Days
AIRCRAFT AIRWORTHINESS STANDARDS FOR CIVIL UNMANNED AIR VEHICLE SYSTEMS
 AIRCRAFT AIRWORTHINESS STANDARDS FOR CIVIL UNMANNED AIR VEHICLE SYSTEMS Cliff Whittaker, Policy Manager, Design & Production Standards Division, Civil Aviation Authority, UK Slide 1 Report Documentation
Tourism Impacts and Second Home Development in Coastal Counties: A Sustainable Approach
 Tourism Impacts and Second Home Development in Coastal Counties: A Sustainable Approach Brunswick, Currituck and Pender Counties, North Carolina (Funded by North Carolina Sea Grant) Center for Sustainable
Tourism and the Cairngorms National Park // Update 2006
 Tourism and the Cairngorms National Park // Update 2006 Tourism and the Cairngorms National Park // Update 2006 One Year on... Since finalising the Sustainable Tourism Strategy last March, the Cairngorms
HIGH-END ECOTOURISM AS A SUSTAINABLE LAND USE OPTION IN RURAL AFRICA:
 HIGH-END ECOTOURISM AS A SUSTAINABLE LAND USE OPTION IN RURAL AFRICA: THE ROLE OF EMPLOYMENT IN POVERTY REDUCTION & SOCIAL WELFARE Sue Snyman, March 2011 sues@wilderness.co.za INTRODUCTION Rural Communities
Exemplar for Internal Achievement Standard Geography Level 1. Conduct geographic research, with direction
 Exemplar for internal assessment resource Geography for Achievement Standard 91011 Exemplar for Internal Achievement Standard Geography Level 1 This exemplar supports assessment against: Achievement Standard
CONGESTION MONITORING THE NEW ZEALAND EXPERIENCE. By Mike Curran, Manager Strategic Policy, Transit New Zealand
 CONGESTION MONITORING THE NEW ZEALAND EXPERIENCE 26 th Australasian Transport Research Forum Wellington New Zealand 1-3 October 2003 By, Manager Strategic Policy, Transit New Zealand Abstract New Zealand
RE: Access Fund Comments on Yosemite National Park Wilderness Stewardship Plan, Preliminary Ideas and Concepts
 September 30, 2016 Superintendent Yosemite National Park Attn: Wilderness Stewardship Plan P.O. Box 577 Yosemite, CA 95389 RE: Access Fund Comments on Yosemite National Park Wilderness Stewardship Plan,
PERTH AND KINROSS COUNCIL. Enterprise and Infrastructure Committee 4 November 2009
 PERTH AND KINROSS COUNCIL 4 09/494 Enterprise and Infrastructure Committee 4 November 2009 STRATEGIC PRIORITIES FOR TOURISM AND AREA TOURISM PARTNERSHIP ARRANGEMENTS Report by Depute Director (Environment)
Tourism Impacts and Second Home Development in Pender County: A Sustainable Approach
 Tourism Impacts and Second Home Development in Pender County: A Sustainable Approach (Funded by North Carolina Sea Grant) Center for Sustainable Tourism Division of Research and Graduate Studies East Carolina
2013 Business & Legislative Session Visitor Satisfaction Survey Results
 2013 Business & Legislative Session Visitor Satisfaction Survey Results Completed by Juneau Economic Development Council in partnership with The Alaska Committee August 2013 JEDC research efforts are supported
Economic Impact of Tourism. Norfolk
 Economic Impact of Tourism Norfolk - 2009 Produced by: East of England Tourism Dettingen House Dettingen Way, Bury St Edmunds Suffolk IP33 3TU Tel. 01284 727480 Contextual analysis Regional Economic Trends
The regional value of tourism in the UK: 2013
 Article: The regional value of tourism in the UK: 2013 Estimates of the economic value of tourism within UK regions and sub-regions. It includes supply and demand data relating to tourism and tourism industries.
Consultation on Draft Airports National Policy Statement: new runway capacity and infrastructure at airports in the South East of England
 Tony Kershaw Honorary Secretary County Hall Chichester West Sussex PO19 1RQ Telephone 033022 22543 Website: www.gatcom.org.uk If calling ask for Mrs. Paula Street e-mail: secretary@gatcom.org.uk 22 May
The Strategic Commercial and Procurement Manager
 Item 3 To: Procurement Sub Committee On: 8 June 2016 Report by: The Strategic Commercial and Procurement Manager Heading: Renfrewshire Council s Community Benefit Strategy 2016 1. Summary 1.1. The purpose
Coastal Tourism The End of the Line or a Renaissance Waiting to Happen? Jason Freezer Associate Director National Coastal Tourism Academy
 Coastal Tourism The End of the Line or a Renaissance Waiting to Happen? Jason Freezer Associate Director National Coastal Tourism Academy 60 73 67 106 247 241 243 238 Coastal Tourism Big Business at a
Proof of Concept Study for a National Database of Air Passenger Survey Data
 NATIONAL CENTER OF EXCELLENCE FOR AVIATION OPERATIONS RESEARCH University of California at Berkeley Development of a National Database of Air Passenger Survey Data Research Report Proof of Concept Study
Summary Report. Economic Impact Assessment for Beef Australia 2015
 Summary Report Economic Impact Assessment for Beef Australia 2015 September 2015 The Department of State Development The Department of State Development exists to drive the economic development of Queensland.
Visitor Profile - Central Island Region
 TOURISM LABOUR MARKET RESEARCH PROJECT 2003 The Project The Tourism Labour Market Research Project, was designed to study the tourism labour market throughout the Vancouver Island region. The Visitor Survey
2014 West Virginia Image & Advertising Accountability Research
 2014 West Virginia Image & Advertising Accountability Research November 2014 Table of Contents Introduction....... 3 Purpose... 4 Methodology.. 5 Executive Summary...... 7 Conclusions and Recommendations.....
Borders Railway: What is the impact two years on?
 STAR 2018 Borders Railway: What is the impact two years on? Rachel Thomas, Peter Brett Associates, Scott Leitham, Peter Brett Associates, and Rebecca Rossi, Transport Scotland 1 INTRODUCTION The Borders
Economic Impact of Tourism in Hillsborough County September 2016
 Economic Impact of Tourism in Hillsborough County - 2015 September 2016 Key findings for 2015 Almost 22 million people visited Hillsborough County in 2015. Visits to Hillsborough County increased 4.5%
Draft Strategic Plans for Coillte s eight Business Area Units ( )
") Draft Strategic Plans for Coillte s eight Business Area Units (2011-2015) Response to Public Consultation from Mountaineering Ireland April 2013 1 Introduction Mountaineering Ireland welcomes this opportunity
Draft Strategic Plans for Coillte s eight Business Area Units (2011-2015) Response to Public Consultation from Mountaineering Ireland April 2013 1 Introduction Mountaineering Ireland welcomes this opportunity
3.0 LEARNING FROM CHATHAM-KENT S CITIZENS
 3.0 LEARNING FROM CHATHAM-KENT S CITIZENS An important aspect in developing the Chatham-Kent Trails Master Plan was to obtain input from stakeholders and the general public. Throughout the course of the
The Economic Impact of Tourism Brighton & Hove Prepared by: Tourism South East Research Unit 40 Chamberlayne Road Eastleigh Hampshire SO50 5JH
 The Economic Impact of Tourism Brighton & Hove 2014 Prepared by: Tourism South East Research Unit 40 Chamberlayne Road Eastleigh Hampshire SO50 5JH CONTENTS 1. Summary of Results 1 1.1 Introduction 1 1.2
Tourism Development Framework for Scotland. Executive Summary- Development Framework to 2020 for the Visitor Economy (Refresh 2016)
") Tourism Development Framework for Scotland Executive Summary- Development Framework to 2020 for the Visitor Economy (Refresh 2016) Introduction The Tourism Development Framework for Scotland refresh 2016:
Tourism Development Framework for Scotland Executive Summary- Development Framework to 2020 for the Visitor Economy (Refresh 2016) Introduction The Tourism Development Framework for Scotland refresh 2016:
Land Management Summary
 photo credit: ANGAIR Anglesea Heath Land Management Summary The Anglesea Heath (6,501 ha) was incorporated into the Great Otway National Park in January 2018. This provides an opportunity to consider the
TOURISM SPENDING IN ALGONQUIN PROVINCIAL PARK
 TOURISM SPENDING IN ALGONQUIN PROVINCIAL PARK Margaret E. Bowman 1, Paul F.G. Eagles 2 1 Ontario Parks Central Zone, 451 Arrowhead Park Road, RR3, Huntsville, ON P1H 2J4, 2 Department of Recreation and
National Passenger Survey Spring putting rail passengers first
 National Passenger Survey putting rail passengers first What is Passenger Focus? Passenger Focus is the independent national rail consumer watchdog. Our mission is to get the best deal for Britain s rail
Destination Orkney. The Orkney Tourism Strategy Summary
 Destination Orkney The Orkney Tourism Strategy Summary Introduction Adopted by Destination Orkney (formerly Orkney s Area Tourism Partnership), the strategy rocket is a one-page summary of the strategy
2.2 For these reasons the provision of tourist signing will only be considered:
 TOURIST SIGNING POLICY 2015 1. DEFINITION 1.1 A tourist destination is defined as a permanently established attraction which attracts or is used by visitors to an area and is open to the public without
- Online Travel Agent Focus -
 North American Online Travel Report 2009 - Online Travel Agent Focus - EyeforTravel Research 7-9 Fashion Street London E1 6PX UK For queries contact: amy@eyefortravel.com www.eyefortravelresearch.com EyeforTravel
North American Online Travel Report
 North American Online Travel Report 2009 - Hotel Focus - EyeforTravel Research 7-9 Fashion Street London E1 6PX UK For queries contact: amy@eyefortravel.com www.eyefortravelresearch.com EyeforTravel Ltd,
Commissioned by: Economic Impact of Tourism. Stevenage Results. Produced by: Destination Research
 Commissioned by: Produced by: Destination Research www.destinationresearch.co.uk December 2016 Contents Page Introduction and Contextual Analysis 3 Headline Figures 5 Volume of Tourism 7 Staying Visitors
CAIRNGORMS NATIONAL PARK BOUNDARY BILL
 These documents relate to the Cairngorms National Park Boundary Bill (SP Bill 72) as introduced in the Scottish Parliament on 21 September 2006 CAIRNGORMS NATIONAL PARK BOUNDARY BILL EXPLANATORY NOTES
Economic Impact of Tourism. Hertfordshire Results. Commissioned by: Visit Herts. Produced by:
 Commissioned by: Visit Herts Produced by: Destination Research www.destinationresearch.co.uk December 2016 Contents Page Introduction and Contextual Analysis 3 Headline Figures 5 Volume of Tourism 7 Staying
An Analysis of Communication, Navigation and Surveillance Equipment Safety Performance
 An Analysis of Communication, Navigation and Surveillance Equipment Safety Performance Phulele Nomtshongwana and Krige Visser Graduate School of Technology Management, University of Pretoria www.saama.org.za
Performance monitoring report for 2014/15
 Performance monitoring report for 20/15 Date of issue: August 2015 Gatwick Airport Limited Summary Gatwick Airport is performing well for passengers and airlines, and in many aspects is ahead of the performance
PERTH AND KINROSS COUNCIL. 22 June 2016 DEVELOPING THE CULTURAL OFFER IN PERTH AND KINROSS UPDATE AND NEXT STEPS
 PERTH AND KINROSS COUNCIL 8 16/278 22 June 2016 DEVELOPING THE CULTURAL OFFER IN PERTH AND KINROSS UPDATE AND NEXT STEPS Report by Senior Depute Chief Executive (Equality, Community Planning & Public Service
Policy PL Date Issued February 10, 2014
 Subject RENEWABLE ENERGY ON CROWN LAND Compiled by Renewable Energy Program, Biodiversity Branch Replaces Policy Directives Waterpower Site Release Crown Land Onshore Windpower Development - Crown Land
Economic And Social Values of Vermont State Parks 2002
 Economic And Social Values of Vermont State Parks 2002 Executive Summary Prepared for Vermont State Parks Department of Forest and Parks and Recreation Prepared by: Alphonse H. Gilbert Robert E. Manning
NAPA VALLEY VISITOR INDUSTRY 2012 Economic Impact Report
 Join Visit Napa Valley NAPA VALLEY VISITOR INDUSTRY 2012 Economic Impact Report Research prepared for Visit Napa Valley by Destination Analysts, Inc. Table of Contents SECTION 1 Introduction 2 SECTION
Report of the Strategic Director of Place to the meeting of Executive to be held on 11 September 2018
 Report of the Strategic Director of Place to the meeting of Executive to be held on 11 September 2018 Subject: M Arrangements for the establishment of a West Yorkshire Urban Traffic Management Control
PSP 75 Lancefield Road. Northern Jacksons Creek Crossing Supplementary Information
 PSP 75 Lancefield Road Northern Jacksons Creek Crossing Supplementary Information September 2017 The northern crossing of Jacksons Creek proposed within the Lancefield Road PSP is a key part of the ultimate
Rail Delivery Group. Consultation on the future of the East Midlands rail franchise
 Rail Delivery Group Response to: Department for Transport Consultation on the future of the East Midlands rail franchise Date: 11 October 2017 Rail Delivery Group Limited Registered Office, 2nd Floor,
Department of Agricultural and Resource Economics, Fort Collins, CO
 June 2007 EDR 07-15 Department of Agricultural and Resource Economics, Fort Collins, CO 80523-1172 http://dare.colostate.edu/pubs OF WINE AND WILDLIFE: ASSESSING MARKET POTENTIAL FOR COLORADO AGRITOURISM
Longmont to Boulder Regional Trail Jay Road Connection DRAFT FINAL REPORT
 Longmont to Boulder Regional Trail Jay Road Connection DRAFT FINAL REPORT December 2018 Project Summary Boulder County, Colorado, in partnership with the City of Boulder, is evaluating options for multi-use
(Also known as the Den-Ice Agreements Program) Evaluation & Advisory Services. Transport Canada
 Evaluation & Advisory Services. Transport Canada") Evaluation of Transport Canada s Program of Payments to Other Government or International Agencies for the Operation and Maintenance of Airports, Air Navigation, and Airways Facilities (Also known as the
Evaluation of Transport Canada s Program of Payments to Other Government or International Agencies for the Operation and Maintenance of Airports, Air Navigation, and Airways Facilities (Also known as the
Air Operator Certification
 Civil Aviation Rules Part 119, Amendment 15 Docket 8/CAR/1 Contents Rule objective... 4 Extent of consultation Safety Management project... 4 Summary of submissions... 5 Extent of consultation Maintenance
DUNOON PROFILE May 2014
 www.hie.co.uk DUNOON PROFILE May 2014 DUNOON PROFILE INTRODUCTION The Dunoon profile uses 2011 Census data and other available data sources to present an up-to-date analysis of its population and labour
CAA consultation on its Environmental Programme
 CAA consultation on its Environmental Programme Response from the Aviation Environment Federation 15.4.14 The Aviation Environment Federation (AEF) is the principal UK NGO concerned exclusively with the
Gold Coast. Rapid Transit. Chapter twelve Social impact. Chapter content
 Gold Coast Rapid Transit Chapter twelve Social impact Chapter content Social impact assessment process...235 Existing community profile...237 Consultation...238 Social impacts and mitigation strategies...239
Terms of Reference: Introduction
 Terms of Reference: Assessment of airport-airline engagement on the appropriate scope, design and cost of new runway capacity; and Support in analysing technical responses to the Government s draft NPS
Kent Pedestrian Guard Railing Assessment
 Kent Pedestrian Guard Railing Assessment Canterbury Final Report for JTB March 2012 Project Number B1649000 Jacobs Eng UK Ltd, Miller House, Lower Stone Street, Maidstone, Kent ME15 6GB Document control
Gatwick Airport Limited. Response to Airports Commission Consultation. Appendix. Ian H Flindell & Associates - Ground Noise Report
 Gatwick Airport Limited Response to Airports Commission Consultation Appendix 10 Ian H Flindell & Associates - Ground Noise Report GATWICK AIRPORT Technical Report in response to Airports Commission Consultation