The regional value of tourism in the UK: 2013
|
|
|
- Corey Young
- 5 years ago
- Views:
Transcription

1 Article: The regional value of tourism in the UK: 2013 Estimates of the economic value of tourism within UK regions and sub-regions. It includes supply and demand data relating to tourism and tourism industries. Contact: Sean White Release date: 10 May 2016 Table of contents 1. Key points 2. Introduction 3. Tourism s contribution to regional and sub-regional economies 4. The demand side of tourism 5. The supply side of tourism 6. Sources of supply and demand data 7. Annex
2 1. Key points The total tourism expenditure in the UK in 2013 was approximately 140 billion. 40% of all tourism expenditure in the UK during 2013, amounting to 56 billion, was in London and the South East. The proportional output of all industries in the UK that can be directly attributed to tourism spend was 3.7%. Wales and the South West have the highest proportions of their economic output that can be directly attributed to tourism spend (4.9% and 4.5% respectively), followed by London with 4.3%. 2. Introduction This report examines the value of tourism in the regions and sub-regions of the UK. Tourism is very much driven by tourism expenditure, also referred to as tourism demand, and any analysis of the economic value, or contribution, of the sector is dependent on information on the spending of visitors. This expenditure is on products and services provided by industries however there is no sole tourism industry, but rather a set of industries (for example, accommodation services, food and drink serving activities, and passenger transport services). It is this set of tourism industries that constitute the supply side of tourism. The difficulty in measuring the value of tourism is determining what proportion of the output of these tourism industries is accounted for by the expenditure of visitors. In other words we need to reconcile the supply (referring to the output of tourism industries and non-tourism industries in an area) and demand (referring to tourism consumption or expenditure) sides of tourism. The most complete reconciliation of these 2 elements of tourism is the Tourism Satellite Account (TSA), developed internationally by the UN World Tourism Organisation, the Organisation for Economic Co-operation and Development (OECD) and Eurostat. The TSA uses a National Accounts framework to determine the supply side of tourism, in terms of output and employment. This information is reconciled with demand side (visitor expenditure) data from overseas visitors to the UK, domestic overnight visitors, same day visitors, and the expenditure of UK residents travelling abroad before they depart the country (that is, within the UK).
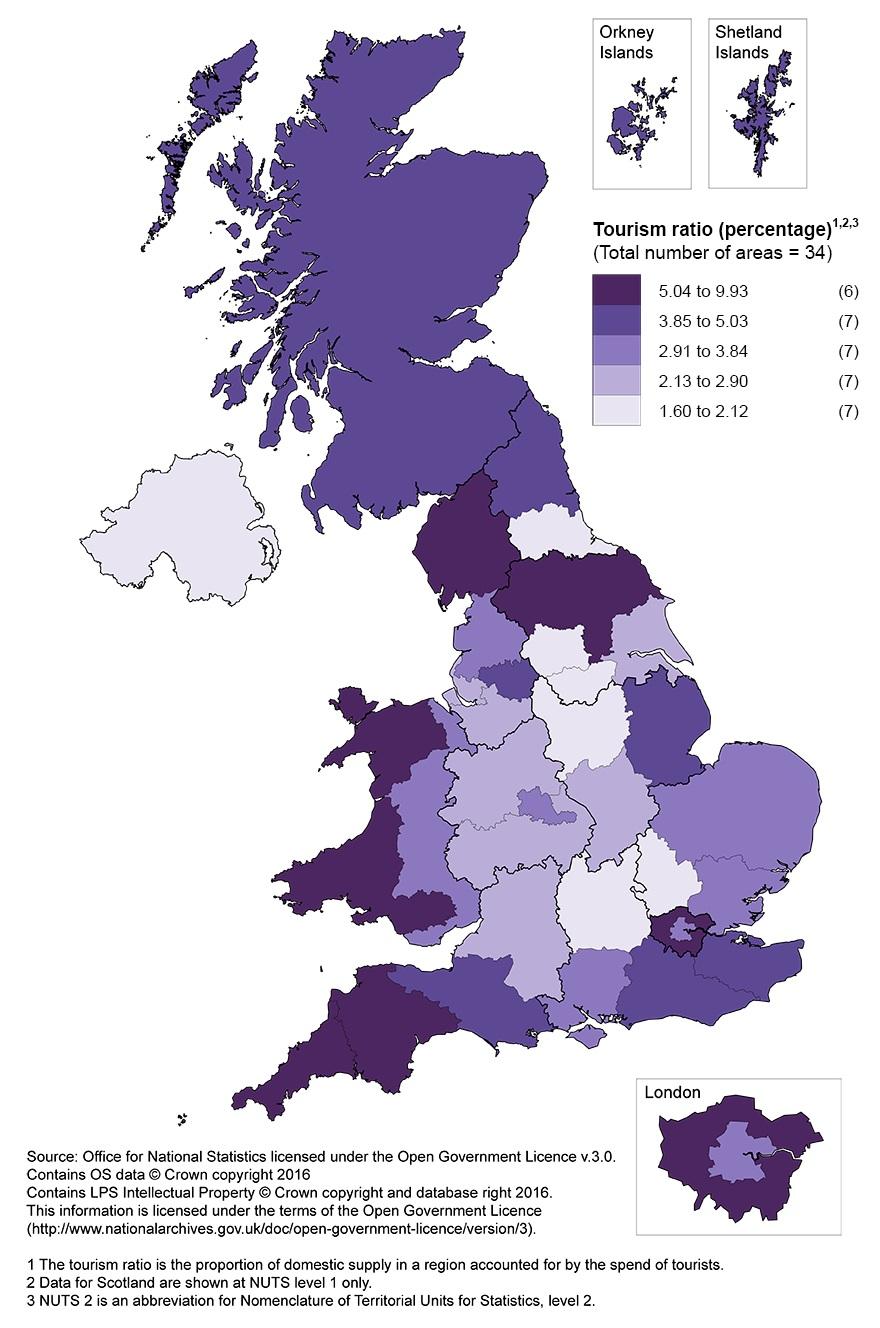
3 The end result of this reconciliation is a set of tourism ratios for each tourism product or service, which indicates the proportion of the value or output that is attributable to visitor expenditure. A complete TSA for the UK has been produced by the Office for National Statistics (ONS) for the reference date 2013 (the latest available Input-Output and Supply Use Tables on which these are based is for 2013). The TSA analysis can be extended to the regional level in the UK and the subregional level in England and Wales (down to NUTS 2) to give an indication of the value of tourism in these areas. Estimates are also provided for the nations of Scotland and Northern Ireland. A previous version of this release included estimates to NUTS 3 level, but this has not been repeated for this release as this would necessitate the use of 3- year averages for the tourism demand surveys used in the analysis, due to small sample sizes. It is important to note that it is not possible to construct regional TSAs in the UK without fully developed regional Input-Output and Supply Use Tables (IO&SUT), part of the National Accounts framework, currently only produced at a national level. However, a disaggregation of the main outputs of the TSA to regional and subregional levels can be produced. This disaggregation is achieved through the use of business survey data from ONS and visitor expenditure data from tourism surveys. These enable us to give estimates of the supply and demand sides of tourism, which allows for a reconciliation of the two at a regional level. This is achieved by calculating the proportion of output within an area, measured in terms of GVA that is directly attributable to the expenditure of tourists. The full methodology for this analysis can be found on the archived version of our website. 3. Tourism s contribution to regional and sub-regional economies This section examines how tourism expenditure affects the economic output of regions. This can be determined by calculating a tourism ratio for each region or sub-region. This statistic is the result of dividing the total demand within an area (or visitor expenditure) by the total supply (or output of all industries) in each region. The tourism ratio itself is a good measure of the economic importance of the tourism sector within regions, as it shows the proportion of the output of all industries in a region that is attributable to tourism expenditure. Figure 1 shows the tourism ratio by UK region (NUTS 1) and Figures 2 and 3 at the sub-regional level in England, Wales and Northern Ireland (NUTS 2) and the region of Scotland (NUTS 1). Wales (4.9%) and the South West (4.5%) have the highest tourism ratios but there are a number of regions with ratios above 3.7% (which is the UK average). From further exploration, the main contributor to the high tourism ratio in Wales is West Wales and the Valleys (5.7%) and the main contributor to the tourism ratio in the South West is Cornwall and the Isles of Scilly (9.9%).

4 At the sub-regional level, tourism would be expected to have a dominant role in creating output in some regions and Figure 2 shows this clearly in relation to Cornwall and the Isles of Scilly, Cumbria and North Yorkshire in particular. Figure 1: Tourism ratios for the regions and nations of the UK (NUTS 1) in 2013 Source: UK TSA 2013 (ONS), ONS IO&SUT 2013, Annual Business Survey 2013; GB Day Visits Survey 2013; GB Tourism Survey 2013; International Passenger Survey 2013
, ONS IO&SUT 2013, Annual Business Survey 2013; GB Day Visits Survey 2013; GB Tourism Survey 2013; International Passenger Survey 2013 Figure 3: Tourism ratio by NUTS 2 area, UK in")
5 Figure 2: Tourism ratios at the sub-regional level in the UK in 2013 (top 15 ranked NUTS 2 regions in England and Wales - Scotland and Northern Ireland totals included) Source: Sources: UK TSA 2013 (ONS), ONS IO&SUT 2013, Annual Business Survey 2013; GB Day Visits Survey 2013; GB Tourism Survey 2013; International Passenger Survey 2013 Figure 3: Tourism ratio by NUTS 2 area, UK in 2013
6
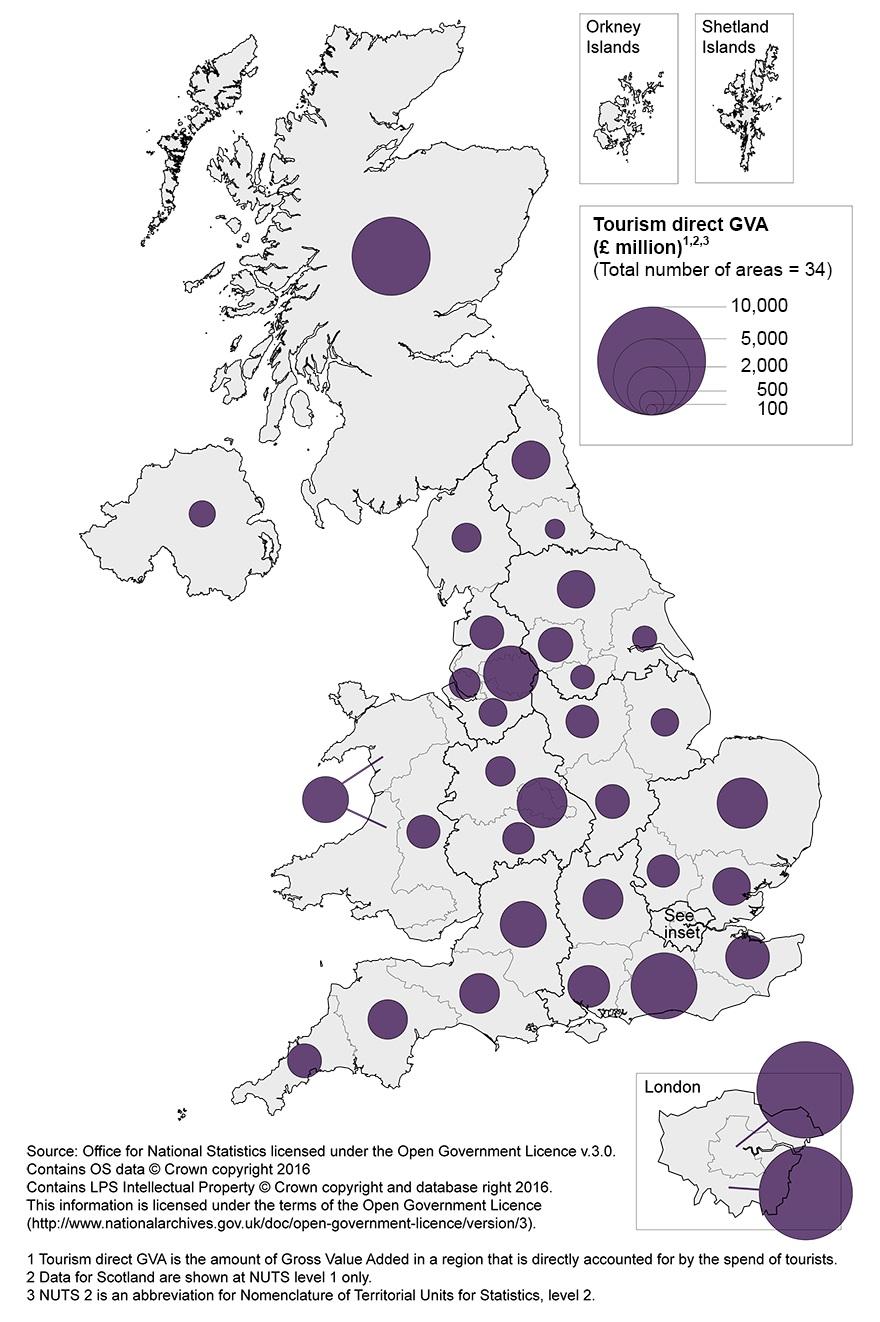
7 Source: UK TSA 2013 (ONS), ONS IO&SUT 2013, Annual Business Survey 2013; GB Day Visits Survey 2013; GB Tourism Survey 2013; International Passenger Survey 2013 The tourism ratio is an important statistic in terms of this analysis because it is used in the calculation of tourism direct gross value added (TDGVA) for each region and sub-region. This is achieved through a multiplication of the tourism ratio and the total GVA of each region in current prices (which are not adjusted to remove the effects of inflation). The TDGVA is a main aggregate in tourism statistics and is also derived in the Tourism Satellite Account. Figure 4 displays the TDGVA for the regions and nations of the UK (NUTS 1) and Figures 5 and 6 at the sub-regional level in England, Wales and Northern Ireland (NUTS 2) and the region of Scotland (NUTS 1). It is clear that London has a dominant position in terms of TDGVA, followed by the South East, North West and South West. This reflects the size of the host economy to some extent, but also the role of major airports and other major ports. This becomes clearer when we look at the sub-regional figures, where Surrey, East and West Sussex has the fourth highest TDGVA which could partly be explained by the presence of Gatwick airport. Figure 4: Tourism direct gross value added ( millions) in regions and nations of the UK (NUTS 1) in 2013
8 Source: UK-TSA 2013 (ONS), ONS IO&SUT 2013, Annual Business Survey 2013; GB Day Visits Survey 2013; GB Tourism Survey 2013; International Passenger Survey 2013 Notes: 1. Current prices.
9 Figure 5: Tourism direct gross value added ( millions) at the sub-regional level in the UK in 2013 (top 15 ranked NUTS 2 regions in England and Wales - Scotland and Northern Ireland totals included) Source: UK-TSA 2013 (ONS), ONS IO&SUT 2013, Annual Business Survey 2013; GB Day Visits Survey 2013; GB Tourism Survey 2013; International Passenger Survey 2013 Notes: 1. Current prices Figure 6: Tourism direct gross value added by NUTS 2 area, United Kingdom in 2013
10
11 Source: UK TSA 2013 (ONS), ONS IO&SUT 2013, Annual Business Survey 2013; GB Day Visits Survey 2013; GB Tourism Survey 2013; International Passenger Survey 2013 Notes: 1. Current prices In the following sections we consider in more detail the profile of tourism expenditure (or demand) in each region and the steps taken to derive estimates of the total supply for each region. 4. The demand side of tourism In this section the expenditure of tourists is analysed in each region and sub-region in terms of the type of visit. This includes: inbound visits, which refers to visits to the UK from overseas tourists domestic overnight visits, which refers to UK residents taking trips within the UK that include an overnight s tay day visits, which refers to UK residents taking a tourism day visit within the UK domestic outbound visits, which refers to UK resident spend within the UK on trips abroad (this includes spend on fares to UK-based carriers, for example, airlines) Tourism expenditure by region Figure 7 shows that 40% of the total 2013 tourism expenditure was in London and the South East. Spend relating to outbound travel was particularly prevalent in these areas at around 57% of the total. This reflects the large proportion of UK outbound airport passengers flying from Heathrow and Gatwick, as well as the ferry and Channel Tunnel departures from these 2 regions.
12 Figure 7: Estimated tourism expenditure ( millions) by UK NUTS 1 area and visit type in 2013 Source: UK-TSA 2013 (ONS); International Passenger Survey 2013; GB Day Visits Survey 2013; GB Tourism Survey 2013 Notes: 1. Current prices London and the South East also received 30% of expenditure on domestic day visits, reflecting a combination of their high populations and the large number of days out to London from elsewhere in the UK. In addition, over half of expenditure by overseas visitors in the UK was in London. However, for domestic overnight stays, the South West of England received the highest expenditure, with 17% of the UK total, followed by London and Scotland. Tourism expenditure by sub-region
13 Sub-regional data in Figure 8 illustrates how types of visitors contribute to overall expenditure in the NUTS 2 areas of England and Wales and NUTS 1 areas of Scotland and Northern Ireland. In areas with busy airports, domestic outbound expenditure is, not surprisingly, very prevalent. Domestic day visit expenditure is particularly important in areas that include major conurbations or are relatively close to London and the South East. The importance of spend from domestic day visitors is clearly an important element of overall tourism spend in many regions of England and Wales, with Inner London generating the highest level of spend in this category of visitor. Scotland has the second highest level of spend from this type of visitor.
 Source: UK-TSA 2013 (ONS); International Passenger Survey 2013; GB Day Visits Survey 2013; GB Tourism Survey 2013 Notes: 1. Current prices 5.")
14 Figure 8: Estimated tourism expenditure ( millions) by UK sub-regions and visit type in 2013 (top 15 ranked NUTS 2 regions in England and Wales - Scotland and Northern Ireland totals included) Source: UK-TSA 2013 (ONS); International Passenger Survey 2013; GB Day Visits Survey 2013; GB Tourism Survey 2013 Notes: 1. Current prices 5. The supply side of tourism
15 In this section we detail the steps taken to analyse the supply side of tourism and derive estimates of the total supply for each region. There are 2 distinct steps in this analysis. Step 1: Calculating the gross value added of the tourism industries According to international recommendations on the compilation of the Tourism Satellite Account (TSA: RMF, 2010), the gross value added of the tourism industries (GVATI) is an important aggregate in an analysis of the economic contribution of tourism: Gross Value Added of the Tourism Industries (GVATI) simply sums the total gross value added of all establishments belonging to tourism industries, regardless of whether all their output is provided to visitors and of the degree of specialization of their production process. It leaves out the value added from other non tourism industries which outputs have been acquired by visitors or by others for their benefit (TSA: RMF, pg. 47). It can be seen from this that, although an important first step in determining the contribution of tourism in an economy, GVATI is an imperfect measure as it doesn t distinguish between resident and visitor expenditure on the goods and services provided. It also excludes expenditure by visitors on goods and services provided by industries that are not part of the tourism industries, for example retail industries. Nevertheless, GVATI is an important indicator as it allows us to determine the levels of output attributable to tourism industries in each region and sub-region, which are then used to apportion the total output from the ONS Input-Output and Supply Use Tables (SUT) for 2013 in the next stage of the analysis. Step 2: Balancing to supply use table totals The next step in the analysis of the supply side data is to balance the GVATI within each region with the total supply of producers from the ONS SUT. This is a necessary step as it allows for the eventual calculation of tourism direct gross value added (TDGVA). This stage of the analysis involves taking the shares of GVA in the tourism industries divided by the total GVA for each region, and then apportion this by the GVA at basic prices (which excludes taxes), as reported in the SUT. The choice of using the SUT as the denominator allows us to obtain regional totals summing up to national UK figures, in particular those published in the UK Tourism Satellite Account. This means that regional and sub-regional TDGVA and total GVA results all adding up to the UK totals published previously. This internal consistency is a main advantage of the methodology.
 is accounted for by the tourism industries within that region.")
16 In Figure 9 we show the percentage figure for the GVATI (GVATI%) at the regional level in In this chart a high figure means that a high percentage of regional output (represented by GVA) is accounted for by the tourism industries within that region. Figure 9 shows that the regions with the highest GVATI% are London and the South West. This reveals the relative importance of the tourism industries in terms of contributing to GVA within each of the regions. It does not, however, distinguish between visitor and resident spend, and therefore this figure does not provide an accurate picture of the direct contribution of tourism to a region. Figure 9: The percentage of gross value added of the tourism industries in the regions and nations of the UK (NUTS 1) in 2013 Source: UK-TSA 2013 (ONS), ONS IO&SUT 2013, Annual Business Survey 2013

17 Similarly Figure 10 shows the GVATI% indicator in relation to the sub-regions of England and Wales (NUTS 2) and regions of Scotland and Northern Ireland. As with the regions, this is a useful indicator of the strength of the tourism industries within each sub-region but shouldn t be considered as a measure of the economic contribution of tourism. Here Outer London and Gloucester, Wiltshire and Bristol/Bath have the highest levels of GVATI%. Figure 10: The percentage of gross value added of the tourism industries at the sub-regional level in the UK in 2013 (top 15 ranked NUTS 2 regions in England and Wales - Scotland and Northern Ireland totals included) Source: UK-TSA 2013 (ONS), ONS IO&SUT 2013, Annual Business Survey 2013
18 6. Sources of supply and demand data Supply side sources The main source of information used in relation to the supply side of tourism is the regional version of the Annual Business Survey (ABS) from 2013 which includes a scaling factor to ensure that data are representative at the regional level. The ABS is used to determine the output or gross value added (GVA) of the tourism industries. These tourism industries are derived from 40 5-digit Standard Industrial Classifications codes for 2007 (SIC codes) (see Annex A). Other sources of information on the supply side include the ONS Supply and Use Tables for 2013 which are used to derive estimates of the output of the tourism industries in purchaser prices (which include taxes) as well as estimates of the regional economies on the same basis. This is important in the calculation of tourism ratios for each region and sub-region that allow us to determine the GVA directly attributable to tourism. ONS regional accounts data on GVA at the regional and sub-regional levels are also employed as the numerator for GVA of the tourism industries in each region. Demand side sources Inbound tourism: The International Passenger Survey (IPS) provides an estimate of total expenditure by overseas visitors within the UK. Domestic overnight visitors: The main source of information for this category of visit is the annual Great Britain Tourism Survey (GBTS). The ONS annual Family Spending publication provides data on expenditure associated with second-home ownership. Domestic day visitors: The Great Britain Day Visits Survey (GBDVS) is the first Great Britain-wide survey of day visits since 2002 to 2003 and replaces the 2005 England Leisure Visits Survey (ELVS). Outbound tourism spend within the UK:
19 The International Passenger Survey includes estimates of UK residents expenditure on fares to overseas locations and on package holidays abroad. The latter was used to estimate the foreign-holiday related travel agent expenditure. Passenger numbers (for airports, sea ports and the Channel Tunnel) were used to provide a total estimate of spend. Sources of subnational expenditure breakdowns Inbound tourism: Output from the International Passenger Survey (IPS) includes expenditure information for UK counties and unitary authorities, categorised by purpose (for example, holiday, business, visiting friends and relatives). Using 2012 to 2014 combined data, this geographical breakdown provides data for all regions, most sub-regions and some local areas. This was further disaggregated using the totals from the 2013 Tourism Satellite Account (UK-TSA) release to enable estimates for 2013 to be produced. To obtain estimates for all areas, counts of visits to towns and cities from the IPS and domestic surveys were used to allocate spend to specific NUTS 2 areas that are part of larger geographies. Domestic overnight visitors: Results from the GBTS routinely include information about spend for the 9 English regions and for Scottish and Welsh sub-regions. Visit England recently produced an analysis of the GBTS for 2012 to 2014 with expenditure data for holiday and nonholiday purposes for English local authorities and we used this with some amendments to provide subnational estimates of spend. Visit Wales produce estimate for the unitary authorities in Wales for the same source which are used in this release. For expenditure on second homes, the proportions of people with a non-work second home in each area in the 2011 Census were applied to the TSA total in Table 4 of the 2013 UK-TSA release. Domestic day visitors: The GBDVS provides local authority level spend estimates and these were used to allocate to NUTS 2 and NUTS 1 areas of England and Wales using data from Outbound tourism spend within the UK:
20 Expenditure at and en-route to overseas holiday destinations were assigned to the location of the departure point, using passenger numbers to provide these estimates. Because the IPS does not include data for all airports or sea ports, we have only used this source for a geographical breakdown of Channel Tunnel passenger information. For airports we used Civil Aviation Authority data, and Department for Transport (DfT) statistics for sea ports. The proportions of passengers at each airport, sea port or Channel Tunnel departure point were applied to the TSA totals in Table 2 of the 2013 UK-TSA release. Expenditure on air, ferry and Channel Tunnel fares were assigned to the departure point within the UK. IPS fare spend data was used for outbound air and Channel Tunnel travel, with an adjustment to the former to include less busy airports not covered by the IPS. DfT passenger numbers were used to allocate ferry spend between sea ports. Expenditure on travel agents fees for overseas visits has been allocated to the residence of the purchaser. Regional proportions of weekly expenditure on package holidays abroad from ONS s annual Family Spending publication were used. 7. Annex Annex A: The tourism industries (Standard Industrial Classification, 2007) Tourism Industries SIC2007 code Description Hotels and similar accommodation Youth hostels Accommodation for visitors Recreational vehicle parks, trailer parks & camping grounds Holiday centres and villages
21 55209 Other holiday and other collective accommodation Other accommodation Licensed restaurants Unlicensed restaurants and cafes Take-away food shops and mobile food stands Food and beverage serving activities Other food services Event Catering Activities Licensed clubs Public houses and bars Railway passenger transport Passenger rail transport, interurban Road passenger transport Taxi Operation Other passenger land transport Water passenger transport Sea and coastal passenger water transport Inland passenger water transport
22 Air passenger transport Scheduled passenger air transport Non-scheduled passenger air transport Renting & leasing of cars and light motor vehicles Transport equipment rental Renting & leasing of passenger water transport equipment Renting & leasing of passenger air transport equipment Travel agency activities Tour operator activities Travel agencies & other reservation services activities Activities of tour guides Other reservation service activities n.e.c Performing arts Support Activities for the performing arts Artistic creation Operation of arts facilities Cultural activities
23 91020 Museums activities Operation of historical sites & buildings & similar attractions Botanical & zoological gardens and nature reserves activities Gambling & betting activities Operation of sports facilities Other sports activities Sporting & recreational activities Activities of amusement parks and theme parks Other amusement and recreation activities nec Renting and leasing of recreational and sports goods Country-specific tourism characteristic activities Activities of exhibition and fair organisers Activities of conference organisers Letting and operating of conference and exhibition centres
24 Contact details for this article Sean White Telephone: +44 (0)
The Geography of Tourism Employment
 The Geography of Tourism Employment Coverage: UK Date: 23 November 2012 Geographical Area: European (NUTS) Theme: People and Places Theme: Labour Market Key Points There were 2.7 million persons with jobs
Estimates of the Economic Importance of Tourism
 Estimates of the Economic Importance of Tourism 2008-2013 Coverage: UK Date: 03 December 2014 Geographical Area: UK Theme: People and Places Theme: Economy Theme: Travel and Transport Key Points This article
Tourism Satellite Account: Demand-Supply Reconciliation
 Tourism Satellite Account: Demand-Supply Reconciliation www.statcan.gc.ca Telling Canada s story in numbers Demi Kotsovos National Economic Accounts Division Statistics Canada Regional Workshop on the
Employment characteristics of UK tourism industries in 2008
 Employment characteristics of UK tourism industries in 2008 Eddie Smith, Dominic Webber and Sean White Tourism Intelligence Unit, Office for National Statistics Summary This article uses an analysis of
The Economic Impact of Tourism on Scarborough District 2014
 The Economic Impact of Tourism on Scarborough District 2014 Prepared by: Tourism South East Research Unit 40 Chamberlayne Road Eastleigh Hampshire SO50 5JH CONTENTS 1. Summary of Results 1 2. Table of
The Economic Impact of Tourism on Calderdale Prepared by: Tourism South East Research Unit 40 Chamberlayne Road Eastleigh Hampshire SO50 5JH
 The Economic Impact of Tourism on Calderdale 2015 Prepared by: Tourism South East Research Unit 40 Chamberlayne Road Eastleigh Hampshire SO50 5JH CONTENTS 1. Summary of Results 1 2. Table of Results Table
From: OECD Tourism Trends and Policies Access the complete publication at:
 From: OECD Tourism Trends and Policies 2014 Access the complete publication at: http://dx.doi.org/10.1787/tour-2014-en United Kingdom Please cite this chapter as: OECD (2014), United Kingdom, in OECD Tourism
Presented by: Ms. Kanageswary Ramasamy Department of Statistics, Malaysia February 2017
 Presented by: Ms. Kanageswary Ramasamy Department of Statistics, Malaysia 14-16 February 2017 1 INTRODUCTION 2 INTERNATIONAL RECOMMENDATIONS ON TOURISM STATISTICS (IRTS) 2008 3 RECOMMENDED METHODOLOGICAL
The Economic Impact of Tourism on the District of Thanet 2011
 The Economic Impact of Tourism on the District of Thanet 2011 Prepared by: Tourism South East Research Unit 40 Chamberlayne Road Eastleigh Hampshire SO50 5JH CONTENTS 1. Summary of Results 1 2. Table of
LOCAL AREA TOURISM IMPACT MODEL. Wandsworth borough report
 LOCAL AREA TOURISM IMPACT MODEL Wandsworth borough report London Development Agency May 2008 CONTENTS 1. Introduction... 3 2. Tourism in London and the UK: recent trends... 4 3. The LATI model: a brief
The Economic Impact of Tourism Brighton & Hove Prepared by: Tourism South East Research Unit 40 Chamberlayne Road Eastleigh Hampshire SO50 5JH
 The Economic Impact of Tourism Brighton & Hove 2014 Prepared by: Tourism South East Research Unit 40 Chamberlayne Road Eastleigh Hampshire SO50 5JH CONTENTS 1. Summary of Results 1 1.1 Introduction 1 1.2
Status of Compilation of Tourism Satellite Accounts for India
 Status of Compilation of Tourism Satellite Accounts for India S V Ramana Murthy Deputy Director General Ministry of Statistics & Programme Implementation Email: svr.murthy@nic.in What are Satellite Accounts?
The Economic Impact of Tourism Brighton & Hove Prepared by: Tourism South East Research Unit 40 Chamberlayne Road Eastleigh Hampshire SO50 5JH
 The Economic Impact of Tourism Brighton & Hove 2013 Prepared by: Tourism South East Research Unit 40 Chamberlayne Road Eastleigh Hampshire SO50 5JH CONTENTS 1. Summary of Results 1 1.1 Introduction 1 1.2
Introduction on the Tourism Satellite Account
 Mr. Peter Laimer Directorate Spatial Statistics UNWTO/DG GROW TSA-Workshop Agenda Item 2 Introduction on the Tourism Satellite Account Framework, tables and benefits Brussels, 29/30 November 2017 www.statistik.at
Produced by: Destination Research Sergi Jarques, Director
 Produced by: Destination Research Sergi Jarques, Director Economic Impact of Tourism Epping Forest - 2014 Economic Impact of Tourism Headline Figures Epping Forest - 2014 Total number of trips (day & staying)
Produced by: Destination Research Sergi Jarques, Director
 Produced by: Destination Research Sergi Jarques, Director Economic Impact of Tourism Oxfordshire - 2015 Economic Impact of Tourism Headline Figures Oxfordshire - 2015 Total number of trips (day & staying)
The Economic Impact of Tourism Eastbourne Prepared by: Tourism South East Research Unit 40 Chamberlayne Road Eastleigh Hampshire SO50 5JH
 The Economic Impact of Tourism Eastbourne 2016 Prepared by: Tourism South East Research Unit 40 Chamberlayne Road Eastleigh Hampshire SO50 5JH CONTENTS Page 1. Summary of Results 1 1.1 Introduction 1 1.2
Employment Characteristics of Tourism Industries, 2011
 Employment Characteristics of Tourism Industries, 2011 Coverage: UK Date: 22 March 2013 Geographical Area: UK Theme: Labour Market Theme: People and Places Theme: Travel and Transport Theme: Economy Key
Produced by: Destination Research Sergi Jarques, Director
 Produced by: Destination Research Sergi Jarques, Director Economic Impact of Tourism Oxfordshire - 2016 Economic Impact of Tourism Headline Figures Oxfordshire - 2016 number of trips (day & staying) 27,592,106
Produced by: Destination Research Sergi Jarques, Director
 Produced by: Destination Research Sergi Jarques, Director Economic Impact of Tourism North Norfolk District - 2016 Contents Page Summary Results 2 Contextual analysis 4 Volume of Tourism 7 Staying Visitors
Produced by: Destination Research Sergi Jarques, Director
 Produced by: Destination Research Sergi Jarques, Director Economic Impact of Tourism Norfolk - 2016 Contents Page Summary Results 2 Contextual analysis 4 Volume of Tourism 7 Staying Visitors - Accommodation
Self Catering Holidays in England Economic Impact 2015
 Self Catering Holidays in England Economic Impact 2015 An overview of the economic impact of self catering holidays in England Published by The South West Research Company Ltd March 2017 Contents Page
The tourism value of the natural environment and outdoor activities in
 The tourism value of the natural environment and outdoor activities in the South West Produced on behalf of the South West Coast Path Association By The South West Research Company Ltd January 2016 1 Contents
Produced by: Destination Research Sergi Jarques, Director
 Produced by: Destination Research Sergi Jarques, Director Economic Impact of Tourism Norfolk - 2017 Contents Page Summary Results 2 Contextual analysis 4 Volume of Tourism 7 Staying Visitors - Accommodation
Feature Article. Equally, counting up all employment in. conversely, that not all employment in. if industry sales rely in part
 Tourism Satellite Accounts: Progress in Wales and the UK Calvin Jones, Welsh Economy Research Unit, Cardiff Business School Cardiff University, Jonesc24@cf.ac.uk Introduction and Background: Measuring
Tourism Industries & Employment A Statistical Profile of the Regions
 Centre for Policy Studies Conference 2014 Coping with Recession A Regional Perspective Tourism Industries & Employment A Statistical Profile of the Regions Steve MacFeely Centre for Policy Studies, UCC
UNWTO Workshop on Developing Tourism Statistics and the Tourism Satellite Account Project Cebu, Philippines, October, 2008
 UNWTO Workshop on Developing Tourism Statistics and the Tourism Satellite Account Project Cebu, Philippines, 21-22 October, 2008 Background for developing the national system of tourism statistics The
Commissioned by: Economic Impact of Tourism. Stevenage Results. Produced by: Destination Research
 Commissioned by: Produced by: Destination Research www.destinationresearch.co.uk December 2016 Contents Page Introduction and Contextual Analysis 3 Headline Figures 5 Volume of Tourism 7 Staying Visitors
Economic Impact of Tourism. Hertfordshire Results. Commissioned by: Visit Herts. Produced by:
 Commissioned by: Visit Herts Produced by: Destination Research www.destinationresearch.co.uk December 2016 Contents Page Introduction and Contextual Analysis 3 Headline Figures 5 Volume of Tourism 7 Staying
Baku, Azerbaijan November th, 2011
 Baku, Azerbaijan November 22-25 th, 2011 Overview of the presentation: Structure of the IRTS 2008 Main concepts IRTS 2008: brief presentation of contents of chapters 1-9 Summarizing 2 1 Chapter 1 and Chapter
The Economic Impact of Tourism New Forest Prepared by: Tourism South East Research Unit 40 Chamberlayne Road Eastleigh Hampshire SO50 5JH
 The Economic Impact of Tourism New Forest 2008 Prepared by: Tourism South East Research Unit 40 Chamberlayne Road Eastleigh Hampshire SO50 5JH CONTENTS Glossary of terms 1 1. Summary of Results 4 2. Table
An overview of the importance and economic contribution of the visitor economy in Dorset
 Tourism in Dorset An overview of the importance and economic contribution of the visitor economy in Dorset Written and prepared by; The South West Research Company for the Dorset LEP On behalf of; Bournemouth
Estimation of Tourism Employment through Tourism Satellite Account Indian Experience
 Estimation of Tourism Employment through Tourism Satellite Account Indian Experience Dr. R. N. Pandey Additional Director General Ministry of Tourism Govt. of India E-Mail: rajnath56.pandey@gmail.com Importance
Travel & Tourism Sector Ranking United Kingdom. Summary of Findings, November 2013
 Travel & Tourism Sector Ranking United Kingdom Summary of Findings, November 2013 Introduction Sector Ranking Analysis In order to better understand the importance of the Travel & Tourism industry in a
ANNUAL TOURISM REPORTING - DATA SHEETS COUNTRY: The statistical data provided in the tables below shall cover the year 2014 and, if available, 2015.
 EUROSTAT EUROSTAT EURO ANNUAL TOURISM REPORTING - DATA SHEETS COUNTRY: The statistical data provided in the tables below shall cover the year 2014 and, if available, 2015. Please note that you are only
Agenda item 5.3. Identification of tourism characteristic products and industries in terms of national product and activity classifications
 Agenda item 5.3 Identification of tourism characteristic products and industries in terms of national product and activity classifications Vladimir Markhonko UNWTO Consultant Content I. Tourism characteristic
Economic Contribution of Tourism to NSW
 Economic Contribution of Tourism to NSW 2013-14 Tourism is a significant part of the NSW economy. In 2013-14, tourism contributed $34.9 billion (Tourism Consumption) to the NSW economy and employed 272,000
Presentation Outline. Background Methodology Key Findings of TSA (Pilot) for TSA Tables for Bangladesh
 for TSA Tables for Bangladesh") Presentation Outline Background Methodology Key Findings of TSA (Pilot) for 2011-12 TSA Tables for Bangladesh Background Attractive natural beauty and rich cultural heritage made Bangladesh enormously
Presentation Outline Background Methodology Key Findings of TSA (Pilot) for 2011-12 TSA Tables for Bangladesh Background Attractive natural beauty and rich cultural heritage made Bangladesh enormously
Asia-Pacific Economic Statistics Week Seminar Component Bangkok, 2 4 May 2016
 Name of author: Bimlesh Krishna Organization: Fiji Bureau Of Statistics Asia-Pacific Economic Statistics Week Seminar Component Bangkok, 2 4 May 2016 Contact address: Ratu Sukuna House, Mac Arthur Street,
The Value of Tourism in Worcestershire. Final Report. March 2013
 The Value of Tourism in Worcestershire Final Report March 2013 Office 234 79 Friar Street Worcester Worcestershire, WR1 2NT Tel. 01905 729276 www.worcester-research.co.uk Page 1 of 28 Contents Section
- Online Travel Agent Focus -
 North American Online Travel Report 2009 - Online Travel Agent Focus - EyeforTravel Research 7-9 Fashion Street London E1 6PX UK For queries contact: amy@eyefortravel.com www.eyefortravelresearch.com EyeforTravel
North American Online Travel Report
 North American Online Travel Report 2009 - Hotel Focus - EyeforTravel Research 7-9 Fashion Street London E1 6PX UK For queries contact: amy@eyefortravel.com www.eyefortravelresearch.com EyeforTravel Ltd,
Commissioned by: Visit Kent. Economic Impact of Tourism. Canterbury Results. Produced by: Destination Research
 Commissioned by: Visit Kent Produced by: Destination Research www.destinationresearch.co.uk November 2016 Contents Page Introduction and Contextual Analysis 3 Headline Figures 6 Volume of Tourism 8 Staying
Insight Department: Scotland The key facts on tourism in 2016
 Insight Department: Scotland The key facts on tourism in 2016 September 2017 Executive Summary & Background Information In 2016 just under 14.5 million overnight tourism trips were undertaken in Scotland.
The Economic Impact of Tourism West Oxfordshire Prepared by: Tourism South East Research Unit 40 Chamberlayne Road Eastleigh Hampshire SO50 5JH
 The Economic Impact of Tourism West Oxfordshire 2014 Prepared by: Tourism South East Research Unit 40 Chamberlayne Road Eastleigh Hampshire SO50 5JH CONTENTS 1. Summary of Results 1 1.1 Introduction 1
Measuring travel services and tourism in New Zealand. October 2013
 Measuring travel services and tourism in New Zealand October 2013 Outline Travel in the New Zealand economy Different measures for travel and tourism How are travel and tourism statistics compiled? Publications
TOURISM SATELLITE ACCOUNTS : Northern Territory
 8.4% 14.2% 12.7% 10.8% TOURISM SATELLITE ACCOUNTS 2006 07: Northern Territory Thiep Van Ho, Ray Spurr, Daniel Pambudi, Peter Forsyth, Larry Dwyer and Serajul Hoque Sustainable Tourism Cooperative Research
Economic Impact of Tourism. Norfolk
 Economic Impact of Tourism Norfolk - 2009 Produced by: East of England Tourism Dettingen House Dettingen Way, Bury St Edmunds Suffolk IP33 3TU Tel. 01284 727480 Contextual analysis Regional Economic Trends
Commissioned by: Visit Kent. Economic Impact of Tourism. Dover Results. Produced by: Destination Research
 Commissioned by: Visit Kent Produced by: Destination Research www.destinationresearch.co.uk November 2016 Contents Page Introduction and Contextual Analysis 3 Headline Figures 6 Volume of Tourism 8 Staying
the research solution
 the research solution FOREST OF DEAN DMO TOURISM ECONOMIC IMPACT ASSESSMENT 2006 FOREST OF DEAN DMO AREA TOURISM ECONOMIC IMPACT ASSESSMENT 2006 FINAL REPORT October 2007 Prepared by The Research Solution
Tourism Satellite Account Calendar Year 2010
 The Economic Impact of Tourism in Georgia Tourism Satellite Account Calendar Year 2010 Highlights The Georgia visitor economy rebounded in 2010, recovering 98% of the losses experienced during the recession
The Economic Impact of Tourism West Oxfordshire Prepared by: Tourism South East Research Unit 40 Chamberlayne Road Eastleigh Hampshire SO50 5JH
 The Economic Impact of Tourism West Oxfordshire 2010 Prepared by: Tourism South East Research Unit 40 Chamberlayne Road Eastleigh Hampshire SO50 5JH CONTENTS Summary of Results 1 1.1 Introduction 1 1.2
Insight Department: Scotland The key facts on tourism in 2016
 Insight Department: Scotland The key facts on tourism in 2016 September 2017 Executive Summary & Background Information In 2016 just under 14.5 million overnight tourism trips were undertaken in Scotland.
Regional Tourism Satellite Accounts (RTSA) in Austria
 in Austria") Peter Laimer Directorate Spatial Statistics CIS countries and Georgia Workshop III (Session 1) 10-12 June 2013 Baku/Azerbaijan Regional Tourism Satellite Accounts (RTSA) in Austria Methods, data sources,
Peter Laimer Directorate Spatial Statistics CIS countries and Georgia Workshop III (Session 1) 10-12 June 2013 Baku/Azerbaijan Regional Tourism Satellite Accounts (RTSA) in Austria Methods, data sources,
The Economic Impact of Tourism in North Carolina. Tourism Satellite Account Calendar Year 2013
 The Economic Impact of Tourism in North Carolina Tourism Satellite Account Calendar Year 2013 Key results 2 Total tourism demand tallied $26 billion in 2013, expanding 3.9%. This marks another new high
Trends & Statistics - July 2013
 Trends & Statistics - July 2013 Insight Department VisitScotland July 2013 1 Welcome In today s rapidly changing world, having an informed outlook is vital. The tourism and hospitality sectors are increasingly
Economic Impact of Tourism. Cambridgeshire 2010 Results
 Economic Impact of Tourism Cambridgeshire 2010 Results Produced by: Tourism South East Research Department 40 Chamberlayne Road, Eastleigh, Hampshire, SO50 5JH sjarques@tourismse.com http://www.tourismsoutheast.com
The Economic Impact of Tourism in North Carolina. Tourism Satellite Account Calendar Year 2015
 The Economic Impact of Tourism in North Carolina Tourism Satellite Account Calendar Year 2015 Key results 2 Total tourism demand tallied $28.3 billion in 2015, expanding 3.6%. This marks another new high
UNDERSTANDING TOURISM: BASIC GLOSSARY 1
 UNDERSTANDING TOURISM: BASIC GLOSSARY 1 Tourism is a social, cultural and economic phenomenon related to the movement of people to places outside their usual place of residence pleasure being the usual
Methodology and coverage of the survey. Background
 Methodology and coverage of the survey Background The International Passenger Survey (IPS) is a large multi-purpose survey that collects information from passengers as they enter or leave the United Kingdom.
Economic Impact Analysis. Tourism on Tasmania s King Island
 Economic Impact Analysis Tourism on Tasmania s King Island i Economic Impact Analysis Tourism on Tasmania s King Island This project has been conducted by REMPLAN Project Team Matthew Nichol Principal
The Economic Impact of Tourism in Maryland. Tourism Satellite Account Calendar Year 2015
 The Economic Impact of Tourism in Maryland Tourism Satellite Account Calendar Year 2015 MD tourism economy reaches new peaks The Maryland visitor economy continued to grow in 2015; tourism industry sales
The Economic Impact of Tourism on Oxfordshire Estimates for 2013
 The Economic Impact of Tourism on Oxfordshire Estimates for 2013 County and District Results September 2014 Prepared by: Tourism South East Research Unit 40 Chamberlayne Road Eastleigh Hampshire SO50 5JH
Tourism Satellite Accounts : The Demand Perspective Concepts and Definitions Tourism Expenditure and Tourism Consumption
 Tourism Satellite Accounts : The Demand Perspective Concepts and Definitions Tourism Expenditure and Tourism Consumption Demi Kotsovos Satellite Accounts and Special Studies National Economic Accounts
West Somerset 2015 Local data version
 West Somerset 2015 Local data version Introduction This report examines the volume and value of tourism and the impact of visitor expenditure on the local economy in West Somerset and Somerset county in
Domestic Tourism Statistics in India
 Domestic Tourism Statistics in India S V Ramana Murthy Deputy Director General Ministry of Statistics & Programme Implementation Email: svr.murthy@nic.in Presentation Sources of data Concerns Need for
Economic Contribution of Tourism to NSW
 Economic Contribution of Tourism to NSW 2015-16 Tourism is a significant part of the NSW economy. In 2015-16, tourism contributed $38.1 billion (Tourism Consumption) to the NSW economy and employed 261,100
The Economic Impact of West Oxfordshire s Visitor Economy 2015
 The Economic Impact of West Oxfordshire s Visitor Economy 2015 Produced on behalf of the West Oxfordshire District Council By The South West Research Company Ltd October 201 1 Contents Page Introduction
The Economic Impact of West Oxfordshire s Visitor Economy 2016
 The Economic Impact of West Oxfordshire s Visitor Economy 201 Produced on behalf of the West Oxfordshire District Council By The South West Research Company Ltd January 2018 1 Contents Page Introduction
Tourism Satellite Account STATISTICS NEW ZEALAND DECEMBER 2002
 Tourism Satellite Account 1997 1999 STATISTICS NEW ZEALAND DECEMBER 2002 Published in December 2002 by: Statistics New Zealand Te Tari Tatau Wellington, New Zealand Catalogue Number 16.001 ISSN 1175-530X
I begin by referencing the document prepared for this Meeting under the provisional programme, Protecting the TSA Brand, specifically...
 Misappropriation of the TSA Brand: The Case of State-level Tourism Satellite Accounts Published in the United States Presented to the Eleventh Meeting of the UNWTO Committee on Statistics and TSA, Madrid,
The Economic Impact of Tourism on Oxfordshire Estimates for 2014
 The Economic Impact of Tourism on Oxfordshire Estimates for 2014 County and District Results August 2015 Prepared by: Tourism South East Research Unit 40 Chamberlayne Road Eastleigh Hampshire SO50 5JH
Tourism Statistics and its relationship with statistics of international trade in services, BoP and NA Item 4
 Tourism Statistics: Challenges and Good Practices Regional Workshop for the CIS countries Tourism Statistics and its relationship with statistics of international trade in services, BoP and NA Item 4 Peter
Presented by: Ms. Kanageswary Ramasamy Department of Statistics, Malaysia February 2017
 Presented by: Ms. Kanageswary Ramasamy Department of Statistics, Malaysia 14-16 February 2017 1 INTRODUCTION 2 HISTORICAL DEVELOPMENT OF TOURISM SATELLITE ACCOUNT 3 THE IMPORTANCE OF TOURISM SATELLITE
TELFORD & WREKIN TOURISM ECONOMIC IMPACT ASSESSMENT
 TELFORD & WREKIN TOURISM ECONOMIC IMPACT ASSESSMENT 2005 TELFORD & WREKIN TOURISM ECONOMIC IMPACT ASSESSMENT 2005 FINAL REPORT September 2007 Prepared by Research Department Larkhill Road Worcester WR5
TSA governance at national level
 Mr. Peter Laimer Directorate Spatial Statistics UNWTO/DG GROW TSA-Workshop Agenda Item 6 TSA governance at national level Austrian experiences Brussels, 29/30 November 2017 www.statistik.at We provide
Priority Sector Report: Experience Industries
 Priority Sector Report: Experience Industries Göran Lindqvist, Stockholm School of Economics Sergiy Protsiv, Stockholm School of Economics 17 October 2011 Deliverable D09-6 Executive summary Experience
United Kingdom. How does Travel & Tourism compare to other sectors? GDP. Size. Share. UK GDP Impact by Industry. UK GDP Impact by Industry
 United Kingdom Stonehenge in Wiltshire Agriculture Automotive Banking Chemicals Communications Education Financial Mining Other Service Manufacturing Manufacturing Services Exports Retail (without wholesale)
Benchmarking Travel & Tourism in Colombia
 Benchmarking Travel & Tourism in Colombia How does Travel & Tourism compare to other sectors? Summary of Findings, November 2013 Sponsored by: Outline Introduction... 3 Colombia summary..... 8 Data sources
The Economic Impact of Poole s Visitor Economy 2015
 The Economic Impact of Poole s Visitor Economy 2015 Produced By The South West Research Company Ltd October 2016 Contents Page Introduction 3 Poole data 4 Dorset data 17 Introduction This report examines
Australian Casino Association ECONOMIC REPORT. Prepared for. Australian Casino Association. June Finance and Economics
 Australian Casino Association ECONOMIC REPORT Prepared for Australian Casino Association June 2004 Finance and Economics Contents Executive Summary--------------------------------------------------------------------------------------------
SHREWSBURY TOURISM ECONOMIC IMPACT ASSESSMENT
 SHREWSBURY TOURISM ECONOMIC IMPACT ASSESSMENT 2005 SHREWSBURY TOURISM ECONOMIC IMPACT ASSESSMENT 2005 FINAL REPORT September 2007 Prepared by Research Department Larkhill Road Worcester WR5 2EZ Telephone:
From: OECD Tourism Trends and Policies Access the complete publication at:
 From: OECD Tourism Trends and Policies 2014 Access the complete publication at: http://dx.doi.org/10.1787/tour-2014-en Slovak Republic Please cite this chapter as: OECD (2014), Slovak Republic, in OECD
From: OECD Tourism Trends and Policies Access the complete publication at: Japan
 From: OECD Tourism Trends and Policies 2014 Access the complete publication at: http://dx.doi.org/10.1787/tour-2014-en Japan Please cite this chapter as: OECD (2014), Japan, in OECD Tourism Trends and
The Economic Impact of Gloucestershire s Visitor Economy Forest of Dean district
 The Economic Impact of Gloucestershire s Visitor Economy 201 Forest of Dean district Produced on behalf of the Wye Valley and Forest of Dean Tourism Association By The South West Research Company Ltd January
The impacts of proposed changes in Air Passenger Duty
 The impacts of proposed changes in Air Passenger Duty Analysis for easyjet May 2011 Air Passenger Duty Proposed changes Impacts Summary Detail 2 Frontier Economics Air passenger duty Rates and structure
Measuring Tourism Locally Guidance Note 1: Definitions of Tourism (version 2)
") Measuring Tourism Locally Guidance Note 1: Definitions of Tourism (version 2) Sean White and Eddie Smith, Tourism Intelligence Unit 1. Introduction This guidance note is produced as part of a series by
Measuring Tourism Locally Guidance Note 1: Definitions of Tourism (version 2) Sean White and Eddie Smith, Tourism Intelligence Unit 1. Introduction This guidance note is produced as part of a series by
The Economic Impact of Gloucestershire s Visitor Economy Forest of Dean district
 The Economic Impact of Gloucestershire s Visitor Economy 2014 Forest of Dean district Produced on behalf of the Wye Valley and Forest of Dean Tourism Association By The South West Research Company Ltd
The Economic Impact Of Luxembourg Airport 29 April 2016
 The Economic Impact Of Luxembourg Airport 29 April 2016 What is Economic Impact Economic Impact of Luxemburg Airport refers to the contribution of the Airport to the Luxembourg Economy This can be measured
HEALTH SECTOR ECONOMIC INDICATORS REPORT
 HEALTH SECTOR ECONOMIC INDICATORS REPORT For: Mid North Coast Local Health District Report prepared by: April 2013 Table of Contents Introduction 3 Executive Summary 4 Output 5 Value-Added 7 Workforce
STATE TOURISM SATELLITE ACCOUNTS STATE TOURISM SATELLITE ACCOUNTS
 STATE TOURISM SATELLITE ACCOUNTS 2015 16 STATE TOURISM SATELLITE ACCOUNTS ACKNOWLEDGMENTS The State Tourism Satellite Accounts series has been produced as part of a modelling program established and funded
Tourist satellite account for Poland for the years 2005 simplified version
 Tourist satellite account for Poland for the years 2005 simplified version Department of Tourism Ministry of Sport and Tourism of Poland - In 2005 tourism consumption within the economic territory of Poland
Ireland. Tourism in the economy. Tourism governance and funding
 Ireland Tourism in the economy Tourism is one of Ireland s most important economic sectors and has significant potential to play a further role in Ireland s economic renewal. In 2014, spending by visitors
Structure of presentation
 Inbound tourism Slovak Republic CAPACITY BUILDING PROGRAMME ON TOURISM STATISTICS, Regional Seminar, Vienna (Austria), 1st July 2009 Structure of presentation 1. System of Tourism Statistics 2. Developments
Regional Tourism Satellite Accounts in Austria sufficient information for regional tourism policy?
 Peter Laimer Directorate Spatial Statistics 11 th Global Forum on Tourism Statistics (Session 4) 14 16 November 2012 Regional Tourism Satellite Accounts in Austria sufficient information for regional tourism
The Economic Impact of Tourism in Maryland. Tourism Satellite Account Calendar Year 2016
 The Economic Impact of Tourism in Maryland Tourism Satellite Account Calendar Year 2016 County Results Washington County, Visitors Washington County Visitors (thousands) Year Overnight Day Total Growth
Benchmarking Travel & Tourism in United Arab Emirates
 Benchmarking Travel & Tourism in United Arab Emirates How does Travel & Tourism compare to other sectors? Summary of Findings, November 2013 Sponsored by: Outline Introduction... 3 UAE summary...... 8
Mexico. How does Travel & Tourism compare to other sectors? GDP. Size. Share. Mexico GDP Impact by Industry. Mexico GDP Impact by Industry
 Mexico Chapultepec Castle in Mexico City Agriculture Automotive Manufacturing Banking Chemicals Manufacturing Communications Education Financial Services Mining Other Service Exports Retail (without wholesale)
1. Summary dashboard Introduction The strategy targets... 4
 Contents 1. Summary dashboard... 1 2. Introduction... 3 3. The strategy targets... 4 Strategy targets... 4 There are three objectives to be achieved by 2020:... 4 Visitor numbers... 4 Visitor nights...
Fiji s Tourism Satellite Accounts
 Asia-Pacific Economic Statistics Week Bangkok 2 4 May 2016 Fiji s Tourism Satellite Accounts Mr. Bimlesh Krishna Divisional Manager Economic Statistics Fiji s Tourism Satellite Introduction The Tourism