2007 Annual Ocean and Bay Water Quality Report
|
|
|
- Rachel Allen
- 5 years ago
- Views:
Transcription


1 March Annual Ocean and Bay Water Quality Report HEALTH CARE AGENCY PUBLIC HEALTH SERVICES ENVIRONMENTAL HEALTH
2


3 March Annual Ocean and Bay Water Quality Report PROJECT MANAGERS Larry Honeybourne, Program Manager Monica Mazur, Supervising Environmental Health Specialist II Michael Fennessy, Environmental Health Specialist II Patrick Pham, Research Analyst IV Bolsa Chica State Beach 2007 Annual Ocean and Bay Water Quality Report - Page I
4 ACKNOWLEDGMENTS The 2007 Annual Ocean and Bay Water Quality Report would not have been possible without the assistance of many people. The staff of the County of Orange Health Care Agency (HCA), Environmental Health Ocean Water Protection Program wishes to acknowledge the support of the following: County of Orange Board of Supervisors, with special thanks to Supervisor Patricia C. Bates and Fifth District Staff, and Supervisor John M. Moorlach and Second District Staff County of Orange Executive Office, County Executive Officer Thomas Mauk and Deputy County Executive Officer for Government and Public Services Stephen Dunivent County of Orange Health Care Agency, Director Juliette A. Poulson, R.N., M.N. County of Orange Health Care Agency, Assistant Director David L. Riley County of Orange Health Care Agency, Public Health Services, Deputy Agency Director David Souleles, M.P.H. County of Orange Health Care Agency, Public Health Services, Health Officer/Deputy Agency Director Eric G. Handler, M.D., M.P.H., F.A.A.P. County of Orange Health Care Agency, Environmental Health, Director Richard Sanchez, R.E.H.S., M.P.H. County of Orange Health Care Agency, Quality Management, Desktop Publishing County of Orange Health Care Agency, Public Health Laboratory U.S. Environmental Protection Agency, Headquarters, Washington, D.C. U.S. Environmental Protection Agency, Region 9 California Department of Public Health California State Water Resources Control Board Orange County Sanitation District South Orange County Wastewater Authority SPECIAL THANKS The staff of HCA s Environmental Health Ocean Water Protection Program would like to thank the Marine Safety and Lifeguard Divisions of the cities of Seal Beach, Huntington Beach, Newport Beach, Laguna Beach and San Clemente; U.S. Ocean Safety Lifeguards; Monarch Beach Lifeguards; County of Orange Resources and Development Management Department/Harbors, Beaches and Parks staff; and the California State Parks staff for their continued assistance. We would also like to thank the following for providing photographs for this report: staff from the cities of Huntington Beach, Newport Beach, Dana Point and San Clemente; Randy Seton of the Newport Beach Coastal/ Bay Water Quality Citizens Advisory Committee; El Toro Water District staff; California State Parks staff; and the County of Orange Sheriff/Harbor Patrol, District Attorney and HCA Environmental Health staff Annual Ocean and Bay Water Quality Report - Page II


5 TABLE OF CONTENTS Executive Summary V Map of Orange County Coastline VII The Ocean Water Protection Program Ocean Water-Contact Sports Standards Assembly Bill 411 Disease-Causing Microorganisms Indicator Bacteria Testing Methods Closure and Warning Signs Beach Mile Days Ocean and Bay Water Closures Due to Sewage Spills Sewage Spills Sewage Spills Sewage Spill Caused Ocean and Bay Water Closures Sewage Spill Caused Ocean and Bay Water Closures Ocean and Bay Rain Advisories Ocean and Bay Water Postings Due to Bacteriological Water Quality Standards Violations AB 411 Period Postings for all Orange County Ocean and Bay Water Areas (April October) AB 411 Period Postings for Orange County Coastal Ocean Water Areas (April October) AB 411 Period Postings for all Orange County Ocean and Bay Water Areas by Indicator Bacteria (April October) Calendar Year Postings for all Orange County Ocean and Bay Water Areas Calendar Year Postings for Orange County Coastal Ocean Water Areas Appendix Postings by Ocean and Bay Water Areas Appendix Unauthorized Discharges of Waste and Ocean and Bay Water Closures Appendix Open Coastal Beaches Postings, Days Posted and Beach Mile Days of Postings The Wedge, Newport Beach W. Nelson, Sheriff/Harbor Patrol 2007 Annual Ocean and Bay Water Quality Report - Page III


6 2007 Annual Ocean and Bay Water Quality Report - Page IV The Wedge, Newport Beach J. M. Hollenbeck, Sheriff/Harbor Patrol

7 EXECUTIVE SUMMARY The 2007 Annual Ocean and Bay Water Quality Report provides an analysis of bacteriological water quality data for the 112 miles of Orange County s ocean and bay waters for the years , and incorporates sewage spill and related ocean and bay water closure data from This seventh annual report also describes year-to-year variability and trends in bacteriological water quality for Orange County s ocean and bay waters. Major findings of the 2007 Annual Ocean and Bay Water Quality Report are: Sewage Spills and Closures The number of sewage spills reported to the Ocean Water Protection Program decreased five consecutive years from This represents the first five-year decrease since Private property owner (e.g., apartment/condominium complexes, restaurants, vessel pump stations, etc.) sewage spills continued to be responsible for more than half (54%) of all sewage spills reported to the Ocean Water Protection Program in This is the third consecutive year that private property owner spills were greater than 50% of the spills reported. In 2007, the total number of ocean and bay water closures due to sewage spills (12) was the lowest number of closures since 1993 and represents a 50% reduction in the number of ocean and bay water closures from the previous year. The total number of closure days and the total number of Beach Mile Days that ocean and bay waters were closed due to sewage spills in 2007 were the lowest number of closure days and Beach Mile Days on record for the nine-year period from Private property owner sewage spills were responsible for 75% of all ocean and bay water closures in This represents the highest percentage of ocean and bay water closures due to private property owner sewage spills for the nine-year period from Pipeline blockages remain the major cause (62%) of all ocean and bay water closures from Root infiltration and grease deposition continue to be the major types of blockages (together totaling 60%) causing ocean and bay water closures. Postings In 2007, the total number of days posted and the total number of Beach Mile Days posted due to standards violations were the lowest recorded for an AB 411 period (April to October) for the eight years from For calendar year 2007, the total number of days posted and the total number of Beach Mile Days posted due to standards violations were the lowest recorded for a calendar year period for the eight years from The number of Beach Mile Days posted due to standards violations at Doheny State Beach during the AB 411 period in 2007 was the lowest on record since The number of Beach Mile Days posted at Doheny State Beach decreased by almost one-half from 71.0 in 2006 to 36.1 in For the 2007 AB 411 period, Huntington State Beach had the highest number of Beach Mile Days posted due to standards violations, almost tripling the number of Beach Mile Days posted from 2006 (21.9) to 2007 (61.0). This was the third consecutive year ( ) that the total number of Beach Mile Days posted at Huntington State Beach have increased during the AB 411 period following a significant reduction in Beach Mile Days of postings in 2004 (from 41.9 in 2003 to 10.6 in 2004) Annual Ocean and Bay Water Quality Report - Page V
8 2007 Annual Ocean and Bay Water Quality Report - Page VI


9 2007 Annual Ocean and Bay Water Quality Report - Page VII

 have been cooperatively testing the")
10 THE OCEAN WATER PROTECTION PROGRAM As part of the County of Orange Health Care Agency (HCA), Environmental Health s Ocean Water Protection Program is responsible for protecting the public from exposure to ocean and bay waters that may be contaminated with sewage or may cause illness along Orange County s 42 miles of open ocean coastline and 70 miles of harbor and bay frontage. Ocean and bay waters used for body-contact recreational activities such as swimming, surfing and diving must meet specific bacteriological standards to be considered safe for such purposes. Over the past 40 years, the Health Care Agency and two local sanitation agencies (Orange County Sanitation District and South Orange County Wastewater Authority) have been cooperatively testing the coastal waters in Orange County for bacteria that indicate the possible presence of disease-causing organisms. The sanitation agencies and HCA program staff participate in the weekly collection of water samples at approximately 150 ocean, bay and drainage locations throughout coastal Orange County. Each year, the sanitation agencies and HCA routinely collect over 13,300 water samples and perform approximately 40,000 analyses for the required three indicator bacteria (i.e., total coliform, fecal coliform and enterococcus). HCA and the Orange County Sanitation District each collect and analyze over 5,000 samples per year, and the South Orange County Wastewater Authority collects and analyzes over 3,300 samples per year. HCA Ocean Water Protection Program staff review the bacteriological water sample results daily and issue ocean and bay water closures, postings and health advisories under the requirements stipulated by the California Health and Safety Code and Title 17 of the California Code of Regulations. When the results of testing indicate that one or more of the AB 411 Ocean Water-Contact Sports Standards have been exceeded, the public is notified (i.e., signs are posted at the beach, hotline and web page are updated), and the sampling frequency and locations may increase until the sample results meet established standards and/or the source of the problem is eliminated. In addition, the Ocean Water Protection Program staff respond on a 24-hour basis to investigate reports of sewage or other contamination incidents affecting Orange County s ocean and bay waters. The Ocean Water Protection Program staff maintain an Ocean and Bay Water Posting and Closure Hotline and Web Page. Ocean and Bay Water Closure & Posting Hotline: (714) The Ocean and Bay Water Closure & Posting Web Page: The following is a listing of some of the reports and data located on the web page in the Downloads, Reports & Data section: Annual Ocean and Bay Water Quality Reports ( ); Historical Bacteriological Data (1986 present); and Sewage Spill Closure Logs (1999 present). Balboa Peninsula, Newport Beach 2007 Annual Ocean and Bay Water Quality Report - Page 1
.")

11 Ocean Water-Contact Sports Standards Assembly Bill 411 In 1998, AB 411 (Wayne) was chaptered into law and added Sections to the California Health and Safety Code. The law authorized the creation of bacteriological ocean water quality standards that are considered protective of public health (California Code of Regulations Sections ). The standards are informally called AB 411 standards and include the following: Required testing of the waters adjacent to all ocean and bay public beaches for total coliforms, fecal coliforms and enterococci bacteria that may indicate the presence of possible diseasecausing bacteria, viruses or protozoa. Required maintenance and updates of the Ocean and Bay Posting and Closure Hotline. Established single sample standards for total coliforms, fecal coliforms and enterococci bacteria which shall not exceed: Total Coliforms: 10,000 organisms per 100 milliliter sample. Fecal Coliforms: 400 organisms per 100 milliliter sample. Enterococci: 104 organisms per 100 milliliter sample. Fecal Coliform to Total Coliform ratio: >1,000 total coliforms if ratio exceeds 0.1. Established 30-day geometric mean standards (of five weekly samples) for total coliforms, fecal coliforms and enterococci bacteria which shall not exceed: Total Coliforms: 1,000 organisms per 100 milliliter sample. Fecal Coliforms: 200 organisms per 100 milliliter sample. Enterococci: 35 organisms per 100 milliliter sample. When any waters adjacent to a public beach fail to meet any of the standards described above, the local health officer shall post signs on the beach to restrict access to the affected waters. Weekly testing is required from April 1 to October 31 if the following applies: The beach is visited by more than 50,000 people annually. The beach is located in an area adjacent to a storm drain that flows in the summer. In the case of a known release of sewage into ocean or bay waters adjacent to a public beach, the local health officer is required to: Immediately close the affected ocean or bay waters until the source of the sewage is eliminated. Collect bacterial samples from the affected waters. Continue the closure until testing results of water samples meet the established standards. Huntington City Beach 2007 Annual Ocean and Bay Water Quality Report - Page 2
12 Disease-Causing Microorganisms Contaminated runoff and untreated sewage released into ocean and bay waters may result in swimmer exposure to pathogenic bacteria, viruses or protozoa. These disease-causing microorganisms may be present at or near the sites where discharges enter the water. The following table lists the types of microorganisms and the diseases (or symptoms) they may cause. PATHOGENIC AGENT DISEASE Bacteria Escherichia coli (E. coli) Gastroenteritis Salmonella (not typhi) Gastroenteritis, usually with fever; less commonly septicemia (generalized infection - organisms multiply in the bloodstream) Some strains of Shigella Gastroenteritis, usually with fever Protozoa (Intestinal Parasites) Cryptosporidium Giardia lamblia Diarrhea - Cryptosporidiosis Diarrhea - Giardiasis Viruses Rotavirus Enteroviruses Norwalk and Norwalk-like viruses Adenovirus Hepatitis A (outbreaks associated with eating shellfish from sewage-contaminated water) Gastroenteritis Respiratory infection, rash, fever, meningitis Gastroenteritis Respiratory infection and gastroenteritis Infectious hepatitis (liver malfunction) The levels of bacteria, viruses and protozoa typically decrease in ocean and bay waters over time due to the following reasons: Die off due to sun (ultraviolet exposure), salt water or age. Predation by other organisms. Dispersion and dilution Annual Ocean and Bay Water Quality Report - Page 3
 as a means to ascertain the likelihood that human pathogens may be present in recreational waters.")

 Multiple-Tube Fermentation (MTF) Colilert Enterolert All of the methods are culture based,")
13 Indicator Bacteria Testing Methods The detection and enumeration of disease-causing organisms (pathogens) identified with waterborne illness is difficult, time-consuming and costly. Thus, most water quality laboratories are required to test for fecal indicator bacteria (i.e., total coliforms, fecal coliforms and enterococci) as a means to ascertain the likelihood that human pathogens may be present in recreational waters. Fecal indicator bacteria normally occur in the intestines of all warm-blooded animals, are excreted in high numbers in feces, but can also be found in soil and decaying vegetation. Since there is no ideal indicator group, testing is done for more than one indicator. Total coliforms are a broad group of organisms that include fecal coliform bacteria as well as E. coli. The enterococci group has been determined to be a good indicator of watercontact associated gastroenteritis. The methods most commonly used to detect fecal indicator bacteria in water include: Membrane Filtration (MF) Multiple-Tube Fermentation (MTF) Colilert Enterolert All of the methods are culture based, which means that the indicator bacteria present in water must be allowed to grow in order to be detected. Differences between the methods include how the bacteria are detected and counted, how soon the results become known, and cost. Each method has its advantages and disadvantages. Most of the limitations depend on factors such as the other types of constituents in the water and density of bacteria present, and all require at least an 18-hour incubation period. The following is a brief summary of the Membrane Filtration method, the method used by the County of Orange Health Care Agency/Public Health Laboratory, the South Orange County Wastewater Authority Laboratory and the Orange County Sanitation District Laboratory for the analyses of total coliforms, fecal coliforms and enterococci in ocean and bay waters. Detailed descriptions for the Membrane Filtration (MF), Multiple-Tube Fermentation (MTF), Colilert and Enterolert methods are available in the latest edition of Standard Methods for the Examination of Water and Wastewater. Membrane Filtration (MF) The membrane filtration method involves filtering water through a porous membrane to concentrate or trap bacteria from the water sample on the filter surface. The membrane filter is placed onto a culture medium designed to encourage the growth of the target indicator. The filter is incubated for hours to allow the bacterial cells to multiply into visible colonies. Theoretically, each bacterial cell (or clump of cells) produces a single colony on the membrane. The colonies are viewed under a 10X magnifying lens and distinguished from non-target bacteria based on the type, size and color of the colonies. Target bacteria are indicated by pigment production resulting from bacterial enzymatic reactions to specific substrates. The number of colonies present in 100 milliliters of water, also known as Colony Forming Units (CFUs), is counted and the concentration of organisms in the original sample is calculated. Total Coliform Colonies Fecal Coliform Colonies Enterococcus Colonies 2007 Annual Ocean and Bay Water Quality Report - Page 4


14 Closure and Warning Signs The yellow closure sign is posted when a sewage spill affects ocean or bay waters adjacent to a public beach. This sign is also available in Spanish. The warning sign with the red and black border is posted when a violation of the AB 411 Ocean Water- Contact Sports Standards occurs. The warning sign with the yellow and black border is permanently posted near storm drains, creeks and rivers to advise the public of the risks associated with possible contamination from urban runoff Annual Ocean and Bay Water Quality Report - Page 5

 = Beach Mile Days For example, if a sewage spill resulted in the closure of ½ mile of beach for 7 days then: (7 days) x (0.5 mile) = 3.")
 x (70 miles bays) = 25,550 Available Beach Mile Days (365 days) x (112 miles total) = 40,880 Available Beach Mile Days Using BMDs as a measurement of ocean and bay water")

15 Beach Mile Days The term Beach Mile Days is used to represent the measurement of the number of days and the linear area of ocean or bay front waters that are closed due to a sewage spill or posted for a violation of the AB 411 Ocean Water-Contact Sports Standards. Beach Mile Days (BMDs) are calculated by multiplying the number of days of a closure or posting by the number of miles of beach closed or posted: (Number of Days) x (Miles of beach closed/posted) = Beach Mile Days For example, if a sewage spill resulted in the closure of ½ mile of beach for 7 days then: (7 days) x (0.5 mile) = 3.5 Beach Mile Days of closure The total number of available ocean and bay Beach Mile Days for Orange County are: (365 days) x (42 miles coastal) = 15,330 Available Beach Mile Days (365 days) x (70 miles bays) = 25,550 Available Beach Mile Days (365 days) x (112 miles total) = 40,880 Available Beach Mile Days Using BMDs as a measurement of ocean and bay water availability is more meaningful than using the number of incidences or the number of days since BMDs take into account both the length of beach and time of a closure or posting. The State of California Water Resources Control Board and all California coastal counties use BMDs for reporting closures and postings which provides a standardized measure allowing comparison of different areas (beach to beach or county to county) or assessing trends over time. Newport Beach 2007 Annual Ocean and Bay Water Quality Report - Page 6

, volume of spill, location of spill, ocean currents and tides, historical sewage spills in the area, and other pertinent")


16 OCEAN AND BAY WATER CLOSURES DUE TO SEWAGE SPILLS When a known release of sewage is reported to the Ocean Water Protection Program, the ocean or bay water areas that may be affected by the sewage discharge are immediately closed to body-contact recreational activities. The closure area is based on many factors including type of sewage (e.g., untreated, secondary treated, etc.), volume of spill, location of spill, ocean currents and tides, historical sewage spills in the area, and other pertinent information. After the initial closure area is established, the appropriate agencies are notified, the area is posted with closure signs, a press release is issued, the Ocean and Bay Water Closure and Posting Hotline and Web Page are updated with the beach closure information, and daily bacterial sampling of the affected area is initiated. The closed ocean or bay water area will be reopened or reduced in size when the contamination source has been eliminated and after two daily consecutive sampling results indicate the affected area meets the AB 411 Ocean Water-Contact Sports Standards. The Ocean and Bay Water Closure and Posting Hotline at (714) and the Ocean and Bay Water Closure and Posting Web Page at com are updated as needed with closure status information. Detailed information regarding closure events from 1999 present may be downloaded from the Ocean and Bay Water Closure Logs available on the web page. Huntington Harbour, Huntington Beach 2007 Annual Ocean and Bay Water Quality Report - Page 7


17 Sewage Spills The number of sewage spills reported to the Ocean Water Protection Program staff by sanitation districts, cities that operate sewage collection systems and private property owners from is detailed in the following graph. From , the number of sewage spills reported declined for the fifth consecutive year Annual Ocean and Bay Water Quality Report - Page 8
18 Sewage Spills The total number of sewage spills due to private property owners (e.g., apartment/condominium complexes, restaurants, vessel pump stations, etc.) from is summarized in the following graph. The following chart depicts the percentage of sewage spills that were due to private property owners from From , private property owners were responsible for more than half of the sewage spills reported Annual Ocean and Bay Water Quality Report - Page 9
19 Sewage Spill Caused Ocean and Bay Water Closures The number of ocean and bay water closures in Orange County due to sewage spills from is summarized in the following graph. The number of sewage spill related ocean and bay closures in 2007 (12) represents the lowest number of closures for the 14-year period from Sewage spills caused by pipeline blockages were responsible for the majority (51%) of the ocean and bay water closures in Orange County from , as the following chart illustrates Annual Ocean and Bay Water Quality Report - Page 10

, the total number of closure days (33), and the")
 represent the lowest totals for the nine-year period from 1999 2007.")
20 Sewage Spill Caused Ocean and Bay Water Closures The following chart depicts the total number of sewage spill-caused ocean and bay water closures, total number of closure days and total number of Beach Mile Days of closure in Orange County from For 2007, the total number of closures (12), the total number of closure days (33), and the total number of Beach Mile Days (2.0) represent the lowest totals for the nine-year period from North Beach, San Clemente 2007 Annual Ocean and Bay Water Quality Report - Page 11
21 Sewage Spill Caused Ocean and Bay Water Closures continued The following graph depicts: (a) the number of sewage spill-caused ocean and bay water closures from when the known discharged volume of sewage spilled into ocean or bay waters was greater than 1,000 gallons; and (b) the total number of closures. In 2007, only one of the 12 ocean and bay water closures was due to a sewage spill where the volume of sewage discharged was greater than 1,000 gallons. The following graph illustrates the median volume of sewage spilled per sewage spill closure incident from for sewage spills when the volume was known. In 2007, the median volume of sewage discharged represents the lowest median volume for the nine-year period from Annual Ocean and Bay Water Quality Report - Page 12


22 Sewage Spill Caused Ocean and Bay Water Closures continued The average number of Beach Mile Days per sewage spill-caused ocean and bay water closure incident from is shown in the following graph. In 2007, the average number of Beach Mile Days closed per sewage spill closure represents the lowest average for the nine-year period from Newport Bay, Newport Beach 2007 Annual Ocean and Bay Water Quality Report - Page 13
23 Sewage Spill Caused Ocean and Bay Water Closures continued The number of ocean and bay water closures that resulted from private property owner (PPO) sewage spills (e.g., apartment/condominium complexes, restaurants, vessel pump stations, etc.) from and total number of closures is shown in the following graph. In 2007, private property owners were responsible for nine of the 12 ocean and bay water closures. The percentage of ocean and bay water closures that were due to private property owner sewage spills from is shown in the following chart. In 2007, private property owners were responsible for 75% of all ocean and bay water closures representing the highest percentage of ocean and bay water closures due to private property owner sewage spills for the nine-year period from Annual Ocean and Bay Water Quality Report - Page 14
24 Sewage Spill Caused Ocean and Bay Water Closures continued The following chart illustrates that sewage pipeline blockages caused the majority (62%) of the ocean and bay water closures in Orange County from Root infiltration and grease deposition together accounted for the majority (60%) of the sewage pipeline blockages that resulted in ocean and bay water closures in Orange County from , as the following chart illustrates Annual Ocean and Bay Water Quality Report - Page 15
25 Sewage Spill Caused Ocean and Bay Water Closures continued The following chart illustrates that, from , the major percentage of ocean and bay water closures from sewage spills were caused by pipeline blockages. For 2007, all closures were caused by either a pipeline blockage or a line break at a vessel pump station. Pipeline Breaks Pipeline Blockages Pump Station Failures Treatment Plant Discharges Miscellaneous Vessel Pump Stations The following chart compares the total number of open coastal water closures to the total number of harbor and bay closures in Orange County due to sewage spills from Annual Ocean and Bay Water Quality Report - Page 16
26 OCEAN AND BAY RAIN ADVISORIES During and after a significant rainstorm event, storm drains, creeks and rivers carry floodwaters combined with urban runoff to ocean and bay waters. Urban runoff may include fertilizers, road oils, litter and large amounts of bacteria from a variety of sources such as animal waste and decomposing vegetation. The levels of bacteria can rise significantly in ocean and bay waters close to discharging storm drains and outlets of creeks, rivers and streams during and after rainstorms. To ensure that public health and safety is protected, the Ocean Water Protection Program staff advises against the use of ocean or bay waters where there may be contamination due to storm runoff. The elevated bacterial levels in the coastal ocean waters may continue for a period of at least three days depending on the intensity of the rain and the volume of runoff. Swimmers should avoid Orange County coastal waters during and after rainstorms, and beach users should avoid contact with any runoff on the beach during dry or wet weather conditions. A rain advisory is issued during or after a rainstorm event of greater than or equal to two-tenths of an inch ( 0.20 ), unless multiple events occur during the 72-hour window of the previous rainstorm. In those cases, the existing rain advisory continues for an additional 72 hours. The Ocean and Bay Water Closure and Posting Hotline and Web Page are updated with the rain advisory information. The dates listed below are the periods that an ocean and bay water rain advisory was in effect for Orange County during YEAR 2000 (55 Total Rain Advisory Days) January 25 February 2 February 10 February 16 February 17 February 27 February 28 March 13 April 17 April 23 September 23 September 25 October 11 October 15 October 27 November 2 YEAR 2001 (74 Total Rain Advisory Days) January 8 January 16 January 24 January 31 February 10 February 16 February 20 March 13 April 7 April 13 April 21 April 24 November 12 November 16 November 24 November 27 November 29 December 6 December 14 December 18 December 21 December 25 December 30 December 31 YEAR 2002 (44 Total Rain Advisory Days) January 1 January 3 January 28 February 1 February 17 February 21 March 7 March 11 March 18 March 21 March 23 March 27 November 8 November 13 November 30 December 3 December 16 December 31 YEAR 2003 (54 Total Rain Advisory Days) January 1 January 2 January 8 January 12 February 11 February 17 February 25 March 2 March 15 March 19 April 14 April 18 May 3 May 7 July 30 August 3 November 1 November 7 November 13 November 19 December 8 December 11 December 15 December 18 December 25 December Annual Ocean and Bay Water Quality Report - Page 17
 January 1")
 January 1 January 6 February 18 February 23 February 27 March 24 April 14 April 18 April 23 April 26 May 22 May 25 October 14 October 17 December 10")

27 Ocean and Bay Rain Advisories continued YEAR 2004 (65 Total Rain Advisory Days) January 2 January 6 February 3 February 6 February 18 March 6 April 2 April 5 April 17 April 20 October 17 October 24 October 26 November 1 November 8 November 12 November 21 November 25 November 27 December 1 December 5 December 12 December 28 December 31 YEAR 2005 (73 Total Rain Advisory Days) January 1 January 18 January 28 January 31 February 11 February 28 March 5 March 8 March 19 March 26 April 22 May 1 May 6 May 10 September 20 September 24 October 17 October 21 November 10 November 14 December 31 YEAR 2006 (75 Total Rain Advisory Days) January 1 January 6 February 18 February 23 February 27 March 24 April 14 April 18 April 23 April 26 May 22 May 25 October 14 October 17 December 10 December 14 December 17 December 21 December 22 December 25 December 27 December 31 YEAR 2007 (48 Total Rain Advisory Days) January 31 February 6 February 11 February 16 February 19 February 26 February 27 March 2 March 21 March 23 April 20 April 25 September 22 September 25 October 13 October 16 November 30 December 4 December 7 December 12 December 19 December 24 Doheny State Beach, Dana Point 2007 Annual Ocean and Bay Water Quality Report - Page 18


 433-6400 and Web Page at www.ocbeachinfo.com.")

28 OCEAN AND BAY WATER POSTINGS DUE TO BACTERIOLOGICAL WATER QUALITY STANDARDS VIOLATIONS Upon implementation of the AB 411 Ocean Water- Contact Sports Standards in July of 1999, the Ocean Water Protection Program began posting the required health warning signs at public beaches where the ocean or bay waters failed to meet the bacteriological standards. Bacteriological water samples are collected each week at approximately 150 ocean, bay and drainage locations throughout Orange County. The Ocean Water Protection Program receives the results of bacteriological ocean and bay water analyses each week. The results are reviewed daily to determine compliance with the seven standards. When a bacteriological water sample fails to meet any of the AB 411 Ocean Water-Contact Sports Standards the following occurs: Warning signs are posted at the affected ocean or bay areas indicating that the waters have exceeded health standards. The information regarding the posted areas is updated on the Ocean and Bay Water Closure and Posting Hotline at (714) and Web Page at Additional bacteriological water samples are collected at the posted areas and the results are evaluated daily to determine if the areas posted with warning signs should be increased, reduced, shifted or removed. Because ocean or bay waters which violate the AB 411 Ocean Water-Contact Sports Standards may cause illness to users, the Ocean Water Protection Program staff recommends staying out of the water at all beach areas that are posted with the health warning sign shown below. Seal Beach 2007 Annual Ocean and Bay Water Quality Report - Page 19
29 AB 411 Period Postings for all Orange County Ocean and Bay Water Areas (April October) As required by the California Health and Safety Code Section , violations of the AB 411 Ocean Water- Contact Sports Standards between April 1 and October 31 must be reported to the State of California Water Resources Control Board by all California coastal counties on a monthly basis. The information provided in this section is the Orange County data reported to the State Water Resources Control Board beginning with the year 2000, the first calendar year that the AB 411 Ocean Water-Contact Sports Standards were in place. The total number of postings, total number of days posted, and total number of Beach Mile Days posted due to violations of AB 411 standards between April 1 and October 31 for all Orange County beach areas are shown in the following table , , , , , , , , For 2007, the total number of Beach Mile Days posted due to AB 411 standards violations between April 1 and October 31 represents a small percentage (0.6%) of the total number of Beach Mile Days available for recreational water use during this period, as the following chart indicates Annual Ocean and Bay Water Quality Report - Page 20
 The total number of Beach Mile Days posted due to AB 411")


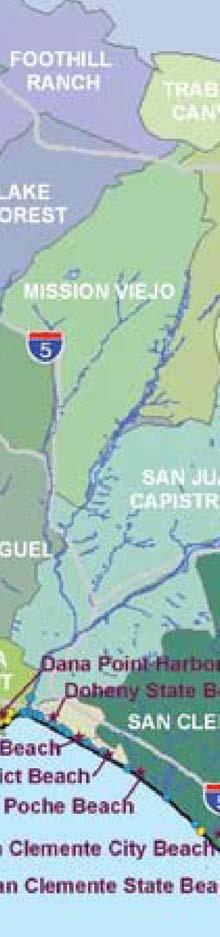
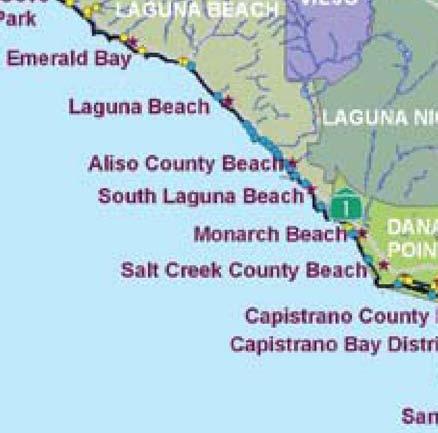
30 AB 411 Period Postings for Orange County Coastal Ocean Water Areas (April October) The total number of Beach Mile Days posted due to AB 411 standards violations between April 1 and October 31 for each Orange County coastal ocean water areas from is depicted on the map and graph on the following page. From , Doheny State Beach had the highest total number of Beach Mile Days posted. The coastal ocean water area of Huntington State Beach had the highest total number of Beach Mile Days posted for Huntington City Beach 2007 Annual Ocean and Bay Water Quality Report - Page 21
31 2007 Annual Ocean and Bay Water Quality Report - Page 22
32 AB 411 Period Postings for all Orange County Ocean and Bay Water Areas by Indicator Bacteria (April October) Violations of the single sample enterococcus standard accounted for the majority (64.7%) of the ocean and bay water postings that occurred in Orange County between April 1 and October 31 for , as the following chart indicates. Violations of a single sample standard accounted for the majority (80.0%) of the ocean and bay water postings that occurred in Orange County between April 1 and October 31 for Multiple standard violations (e.g., a combination of total coliforms and fecal coliforms, total coliforms and enterococci, fecal coliforms and enterococci, or all three) accounted for 20.0% of the postings Annual Ocean and Bay Water Quality Report - Page 23
33 Calendar Year Postings for all Orange County Ocean and Bay Water Areas Due to year round recreational water use, Orange County implements the AB 411 Ocean Water-Contact Sports Standards from January 1 December 31. Violations are reported to the State of California Water Resources Control Board monthly with the exception of violations occurring when a rain advisory is in effect. The information provided in this section is the Orange County data reported to the State Water Resources Control Board beginning with the year 2000, the first calendar year that the AB 411 Ocean Water-Contact Sports Standards were in place. The total number of postings, total number of days posted, and total number of Beach Mile Days posted due to violations of AB 411 standards between January 1 and December 31 for all Orange County beach areas are shown in the table below , , , , , , , , For 2007, the total number of Beach Mile Days posted due to AB 411 standards violations between January 1 and December 31 represents a small percentage (1.1%) of the total number of Beach Mile Days available for recreational water use during this period, as the following chart indicates Annual Ocean and Bay Water Quality Report - Page 24


34 Calendar Year Postings for Orange County Coastal Ocean Water Areas The total number of Beach Mile Days posted due to AB 411 standards violations for the calendar year at each Orange County coastal ocean water areas from is depicted in the map and graph on the following page. From , Doheny State Beach had the highest total number of Beach Mile Days posted due to AB 411 standards violations. Newport Beach 2007 Annual Ocean and Bay Water Quality Report - Page 25

35 2007 Annual Ocean and Bay Water Quality Report - Page 26


36 2007 Annual Ocean and Bay Water Quality Report - Page 27


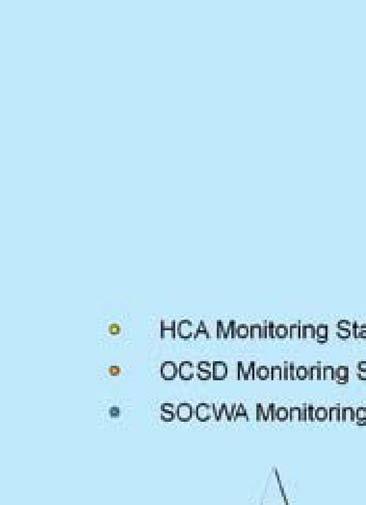
37 Appendix 1 Postings by Ocean and Bay Water Areas The following tables provide sample collection information for each Orange County ocean and bay water area, and indicate the total number of postings, total number of days posted, and the total number of Beach Mile Days posted due to AB 411 standards violations between April 1 and October 31 and for the calendar year (dry weather data only) for Appendix 1 map legend for sampling agencies: HCA Monitoring Stations OCSD Monitoring Stations SOCWA Monitoring Stations Newport Harbor Entrance 2007 Annual Ocean and Bay Water Quality Report - Page 28


38 Appendix 1 continued HCA Monitoring Stations SEAL BEACH / SURFSIDE Sampling Agency: HCA Environmental Health Sampling Frequency: 1 sample per week Sampling Stations: 5 Sampling Locations: 1st Street, 8th Street, South of Pier, 14th Street, Sea Way Beach Miles: 2 miles of coastal beach Available AB 411 BMDs: 428 BMDs Available Yearly BMDs: 730 BMDs AB 411 PERIOD (APRIL OCTOBER) CALENDAR YEAR Seal Beach 2007 Annual Ocean and Bay Water Quality Report - Page 29

 2000 0 0 0 2001 0 0 0 2002 0 0 0 2003 0 0 0 2004 0 0 0 2005 0 0 0 2006 0 0 0 2007 0 0")

39 Appendix 1 continued HCA Monitoring Stations SUNSET BEACH Sampling Agency: HCA Environmental Health Sampling Frequency: 1 sample per week Sampling Station: 1 Sampling Location: Broadway Beach Miles: 1 mile of coastal beach Available AB 411 BMDs: 214 BMDs Available Yearly BMDs: 365 BMDs AB 411 PERIOD (APRIL OCTOBER) CALENDAR YEAR Sunset County Beach W. Nelson, Sheriff/Harbor Patrol 2007 Annual Ocean and Bay Water Quality Report - Page 30


40 Appendix 1 continued OCSD Monitoring Stations BOLSA CHICA STATE BEACH Sampling Agency: Orange County Sanitation District Sampling Frequency: 5 samples per week Sampling Stations: 2 Sampling Locations: Bolsa Chica Reserve, Bolsa Chica Beach Beach Miles: 2.8 miles of coastal beach Available AB 411 BMDs: BMDs Available Yearly BMDs: 1,022 BMDs AB 411 PERIOD (APRIL OCTOBER) CALENDAR YEAR Bolsa Chica State Beach, Huntington Beach D. Holtz, California State Parks 2007 Annual Ocean and Bay Water Quality Report - Page 31


 2000 16 100 4.7 2001 34 182 18.0 2002 24 134 7.")

41 Appendix 1 continued HUNTINGTON HARBOUR Sampling Agency: Sampling Frequency: Sampling Stations: 14 Sampling Locations: Beach Miles: Available AB 411 BMDs: Available Yearly BMDs: HCA Environmental Health 1 sample per week Sunset Aquatic Marina, Mother s Beach, Trinidad Lane Beach, Sea Gate, Humboldt Beach, Davenport Beach, Clubhouse Marina, Harbour Channel, 11th Street Beach, Admiralty Drive, Anderson Street Marina, Anaheim Bay Gas Dock, Coral Cay Beach, Bolsa Bay 31.1 miles of harbor frontage 6,655.4 BMDs 11,351.5 BMDs HCA Monitoring Stations AB 411 PERIOD (APRIL OCTOBER) CALENDAR YEAR Trinidad Beach, Huntington Harbour, Huntington Beach 2007 Annual Ocean and Bay Water Quality Report - Page 32


42 Appendix 1 continued OCSD Monitoring Stations HUNTINGTON CITY BEACH Sampling Agency: Orange County Sanitation District Sampling Frequency: 5 samples per week Sampling Stations: 4 Sampling Locations: Bluffs, 17th Street, Jack s Snack Bar, Beach Blvd. Beach Miles: 3.5 miles of coastal beach Available AB 411 BMDs: 749 BMDs Available Yearly BMDs: 1,277.5 BMDs AB 411 PERIOD (APRIL OCTOBER) CALENDAR YEAR Huntington City Beach 2007 Annual Ocean and Bay Water Quality Report - Page 33

43 Appendix 1 continued HUNTINGTON STATE BEACH OCSD Monitoring Stations Sampling Agency: Sampling Frequency: Sampling Stations: 5 Sampling Locations: Beach Miles: Available AB 411 BMDs: Available Yearly BMDs: Orange County Sanitation District 5 samples per week Beach Blvd., Newland Street, Magnolia Street, Brookhurst Street, Santa Ana River Mouth Beach 2.5 miles of coastal beach 535 BMDs BMDs AB 411 PERIOD (APRIL OCTOBER) CALENDAR YEAR Huntington State Beach, Huntington Beach 2007 Annual Ocean and Bay Water Quality Report - Page 34


44 Appendix 1 continued NEWPORT SLOUGH HCA Monitoring Stations Sampling Agency: Sampling Frequency: Sampling Stations: 2 Sampling Locations: Beach Miles: Available AB 411 BMDs: Available Yearly BMDs: HCA Environmental Health 1 sample per week Lancaster Street Beach at 61 st Street, Lancaster Street Beach at Canal Street 0.1 miles of channel beach 21.4 BMDs 36.5 BMDs AB 411 PERIOD (APRIL OCTOBER) 2000 N/A N/A N/A CALENDAR YEAR 2000 N/A N/A N/A Newport Slough, Newport Beach W. Nelson, Sheriff/Harbor Patrol 2007 Annual Ocean and Bay Water Quality Report - Page 35
, Vaughn s Launch, Ski Zone, North Star Beach, Bayshore Beach, De Anza Launch Ramp, 43rd Street Beach, 38th Street Beach, 33rd Street")
45 Appendix 1 continued NEWPORT BAY Sampling Agency: Sampling Frequency: Sampling Stations: 31 Sampling Locations: Beach Miles: Available AB 411 BMDs: Available Yearly BMDs: HCA Environmental Health 1 sample per week Newport Dunes Beach (East, Middle, West and North), Vaughn s Launch, Ski Zone, North Star Beach, Bayshore Beach, De Anza Launch Ramp, 43rd Street Beach, 38th Street Beach, 33rd Street Channel, Newport Blvd. Bridge Marina, Lido Isle Yacht Club Beach, Via Genoa Beach, Rhine Channel, 19th Street Beach, 15th Street Beach, 10th Street Beach, Alvarado/Bay Isle Beach, N Street Beach, Garnet Avenue Beach, Ruby Avenue Beach, Sapphire Avenue Beach, Grand Canal, Abalone Avenue Beach, Park Avenue Beach, Onyx Avenue Beach, Promontory Point Channel, Bayside Drive Beach, Rocky Point Beach 39.5 miles of bay front 8,453 BMDs 14,417.5 BMDs HCA Monitoring Stations AB 411 PERIOD (APRIL OCTOBER) CALENDAR YEAR , , , , , , Newport Bay, Newport Beach City of Newport Beach Staff 2007 Annual Ocean and Bay Water Quality Report - Page 36
 Orange Street, 52nd/53rd Street, 38th Street, 15th/16th Street, Balboa Pier, The Wedge, Corona Del Mar State Beach,")

46 Appendix 1 continued NEWPORT BEACH Sampling Agency: Sampling Frequency: Sampling Stations: 8 Sampling Locations: Beach Miles: Available AB 411 BMDs: Available Yearly BMDs: Orange County Sanitation District, HCA Environmental Health 1 or 5 samples per week (agency dependent) Orange Street, 52nd/53rd Street, 38th Street, 15th/16th Street, Balboa Pier, The Wedge, Corona Del Mar State Beach, Little Corona 7 miles of coastal beach 1,498 BMDs 2,555 BMDs HCA Monitoring Stations OCSD Monitoring Stations AB 411 PERIOD (APRIL OCTOBER) CALENDAR YEAR The Wedge, Newport Beach J. M. Hollenbeck, Sheriff/Harbor Patrol 2007 Annual Ocean and Bay Water Quality Report - Page 37

 2000 9 21 1.3 2001 3 5 0.3 2002 1 1 0.")

47 Appendix 1 continued CRYSTAL COVE STATE PARK BEACH Sampling Agency: Sampling Frequency: Sampling Stations: 4 Sampling Locations: Beach Miles: Available AB 411 BMDs: Available Yearly BMDs: HCA Environmental Health, Orange County Sanitation District 1 or 5 samples per week (agency dependent) Pelican Point Beach, Crystal Cove State Beach, Muddy Creek Beach, El Morro Beach 3.2 miles of coastal beach BMDs 1,168 BMDs HCA Monitoring Stations OCSD Monitoring Stations AB 411 PERIOD (APRIL OCTOBER) CALENDAR YEAR Crystal Cove State Park Beach R. Seton, Newport Beach Water Quality Committee 2007 Annual Ocean and Bay Water Quality Report - Page 38


48 Appendix 1 continued LAGUNA BEACH Sampling Agency: Sampling Frequency: Sampling Stations: 7 Sampling Locations: Beach Miles: Available AB 411 BMDs: Available Yearly BMDs: HCA Environmental Health, South Orange County Wastewater Authority 1 or 2 samples per week (agency dependent) Emerald Bay, Crescent Bay, Laguna Main Beach, Hotel Laguna, Bluebird Canyon, Victoria Beach, Blue Lagoon 4.4 miles of coastal beach BMDs 1,606 BMDs HCA Monitoring Stations SOCWA Monitoring Stations AB 411 PERIOD (APRIL OCTOBER) CALENDAR YEAR Main Beach, Laguna Beach 2007 Annual Ocean and Bay Water Quality Report - Page 39

 2000 12 22 1.6 2001 4 5 0.7 2002 4 9 1.")

49 Appendix 1 continued ALISO COUNTY BEACH & SOUTH LAGUNA BEACH Sampling Agency: South Orange County Wastewater Authority Sampling Frequency: 2 samples per week Sampling Stations: 10 Sampling Locations: Goff Island Beach, Treasure Island Beach, Aliso-North, Aliso-Middle, Aliso-South, Camel Point, Table Rock, Laguna Lido, 9th Street/1000 Steps Beach, Three Arch Bay Beach Miles: 2 miles of coastal beach Available AB 411 BMDs: 428 BMDs Available Yearly BMDs: 730 BMDs SOCWA Monitoring Stations AB 411 PERIOD (APRIL OCTOBER) CALENDAR YEAR Aliso County Beach B. Fowler, City of Dana Point 2007 Annual Ocean and Bay Water Quality Report - Page 40
 Monarch Beach, Salt Creek County Beach, Dana Strands, Ocean Institute Beach 3 miles of coastal beach 642")
50 Appendix 1 continued DANA POINT Sampling Agency: Sampling Frequency: Sampling Stations: 4 Sampling Locations: Beach Miles: Available AB 411 BMDs: Available Yearly BMDs: HCA Environmental Health, South Orange County Wastewater Authority 1 or 2 samples per week (agency and season dependent) Monarch Beach, Salt Creek County Beach, Dana Strands, Ocean Institute Beach 3 miles of coastal beach 642 BMDs 1,095 BMDs HCA Monitoring Stations SOCWA Monitoring Stations AB 411 PERIOD (APRIL OCTOBER) CALENDAR YEAR Dana Point Headlands B. Fowler, City of Dana Point 2007 Annual Ocean and Bay Water Quality Report - Page 41
 Fuel Dock, Baby")
 2000 10 206 7.9 2001 8 420 20.")

51 Appendix 1 continued DANA POINT HARBOR Sampling Agency: Sampling Frequency: Sampling Stations: 12 Sampling Locations: Beach Miles: Available AB 411 BMDs: Available Yearly BMDs: HCA Environmental Health, South Orange County Wastewater Authority 1 or 2 samples per week (agency and season dependent) Fuel Dock, Baby Beach (West End, Buoy Line, Swim Area and East End), Pier, Pilgrim Dock, Youth Dock, Harbor Entrance, Guest Dock, Harbor Patrol Dock, M Dock 3.3 miles of harbor frontage BMDs 1,204.5 BMDs HCA Monitoring Stations SOCWA Monitoring Stations AB 411 PERIOD (APRIL OCTOBER) CALENDAR YEAR Dana Point Harbor, Dana Point B. Fowler, City of Dana Point 2007 Annual Ocean and Bay Water Quality Report - Page 42

 2000 9 165 140.3 2001 5 191 148.4 2002 7 216 142.5 2003 6 207 116.5 2004 12 226 107.6 2005 3 123 107.")
52 Appendix 1 continued DOHENY STATE BEACH Sampling Agency: South Orange County Wastewater Authority, HCA Environmental Health Sampling Frequency: 1 or 2 samples per week (agency and season dependent) Sampling Stations: 8 Sampling Locations: North Beach, 250 North of San Juan Creek, San Juan Creek/Ocean Interface, 250 South of San Juan Creek, 1000 South of Outfall, 2000 South of Outfall, 3000 South of Outfall, 4000 South of Outfall Beach Miles: 1.1 miles of coastal beach Available AB 411 BMDs: BMDs Available Yearly BMDs: BMDs HCA Monitoring Stations SOCWA Monitoring Stations AB 411 PERIOD (APRIL OCTOBER) CALENDAR YEAR Doheny State Beach, Dana Point K. Kinnings, District Attorney s Office 2007 Annual Ocean and Bay Water Quality Report - Page 43
 Capistrano County Beach 0.25 miles of coastal beach 53.5 BMDs 91.")

53 Appendix 1 continued SOCWA Monitoring Stations CAPISTRANO COUNTY BEACH Sampling Agency: Sampling Frequency: Sampling Stations: 1 Sampling Locations: Beach Miles: Available AB 411 BMDs: Available Yearly BMDs: South Orange County Wastewater Authority, HCA Environmental Health 1 or 2 per week (season dependent) Capistrano County Beach 0.25 miles of coastal beach 53.5 BMDs BMDs AB 411 PERIOD (APRIL OCTOBER) CALENDAR YEAR Capistrano County Beach, Dana Point W. Nelson, Sheriff/Harbor Patrol 2007 Annual Ocean and Bay Water Quality Report - Page 44
 7500 South of Outfall, 10,000 South of Outfall 1.")

54 Appendix 1 continued SOCWA Monitoring Stations CAPISTRANO BAY DISTRICT BEACH Sampling Agency: Sampling Frequency: Sampling Stations: 2 Sampling Locations: Beach Miles: Available AB 411 BMDs: Available Yearly BMDs: South Orange County Wastewater Authority, HCA Environmental Health 1 or 2 samples per week (season dependent) 7500 South of Outfall, 10,000 South of Outfall 1.6 miles of coastal beach BMDs 584 BMDs AB 411 PERIOD (APRIL OCTOBER) CALENDAR YEAR Capistrano Bay District Beach, Dana Point 2007 Annual Ocean and Bay Water Quality Report - Page 45

 Poche Beach 0.2 miles of coastal beach 42.")


55 Appendix 1 continued SOCWA Monitoring Stations POCHE BEACH Sampling Agency: Sampling Frequency: Sampling Stations: 1 Sampling Locations: Beach Miles: Available AB 411 BMDs: Available Yearly BMDs: South Orange County Wastewater Authority, HCA Environmental Health 1 or 2 samples per week (season dependent) Poche Beach 0.2 miles of coastal beach 42.8 BMDs 73 BMDs AB 411 PERIOD (APRIL OCTOBER) CALENDAR YEAR Poche County Beach, San Clemente 2007 Annual Ocean and Bay Water Quality Report - Page 46
 North Beach, 450 Feet North of Pier, Trafalgar Street ( T Street), Avenida Calafia,")
56 Appendix 1 continued SAN CLEMENTE CITY & STATE BEACH Sampling Agency: Sampling Frequency: Sampling Stations: 5 Sampling Locations: Beach Miles: Available AB 411 BMDs: Available Yearly BMDs: South Orange County Wastewater Authority, HCA Environmental Health 1 or 2 samples per week (agency and season dependent) North Beach, 450 Feet North of Pier, Trafalgar Street ( T Street), Avenida Calafia, Avenida de Las Palmeras 3.2 miles of coastal beach BMDs 1168 BMDs HCA Monitoring Stations SOCWA Monitoring Stations AB 411 PERIOD (APRIL OCTOBER) CALENDAR YEAR San Clemente City Beach City of San Clemente Staff 2007 Annual Ocean and Bay Water Quality Report - Page 47

57 2007 Annual Ocean and Bay Water Quality Report - Page 48


58 Appendix 2 Unauthorized Discharges of Waste and Ocean and Bay Water Closures The following chart, arranged by year, details the total number of unauthorized discharges of waste reported to the Health Care Agency as well as the total number of ocean and bay water closures for The total number of unauthorized discharges of waste reported are categorized by sewage type and by waste discharge causes for each year. The total number of ocean and bay water closures are categorized by waste type and closure causes. In addition, the total number of Beach Mile Days for ocean and bay water closures from sewage spills and from miscellaneous causes is shown for Annual Ocean and Bay Water Quality Report - Page 49
59 Number of Unauthorized Discharges of Waste / Ocean and Bay Water Closures in Orange County WASTE DISCHARGES Annual Ocean and Bay Water Quality Report - Page 50 Total Number of Discharges By Waste Type Raw Sewage Primary Treated Effluent Secondary Treated Effluent Tertiary Treated Effluent Miscellaneous Waste Discharge Causes Pipeline Breaks Pipeline Blockages Pump Station Failures Treatment Plant Discharges Stormwater Surcharges Vessel Pump Station Failures Miscellaneous OCEAN AND BAY WATER CLOSURES Total Number of Closures By Waste Type Raw Sewage Primary Treated Effluent Secondary Treated Effluent Tertiary Treated Effluent Miscellaneous Ocean and Bay Water Closure Causes Pipeline Breaks Pipeline Blockages Pump Station Failures Treatment Plant Discharges Stormwater Surcharges Vessel Pump Station Failures Miscellaneous Beach Mile Days of Closures Due to Sewage Spills ~ ~ ~ ~ ~ ~ ~ ~ ~ ~ ~ ~ Due to Miscellaneous Causes ~ ~ ~ ~ ~ ~ ~ ~ ~ ~ ~ ~ ~ = Data Not Available
.")

60 Appendix 3 Open Coastal Beaches Postings, Days Posted and Beach Mile Days of Posting The following table shows historical posting data for each individual Orange County coastal sampling station from during the AB 411 period (April 1 October 31). The data represents the cumulative total number of postings, days posted and Beach Mile Days of posting for the five-year period using dry weather data only. Corona del Mar State Beach, Newport Beach City of Newport Beach Staff 2007 Annual Ocean and Bay Water Quality Report - Page 51
61 Number of Postings Number of Days Posted Number of BMDs Number of Postings Number of Days Posted Number of BMDs SEAL BEACH / SURFSIDE / SUNSET BEACH 1st Street th Street South of Pier th Street Seaway Broadway BOLSA CHICA STATE BEACH Bolsa Chica Reserve Bolsa Chica Beach HUNTINGTON CITY BEACH Bluffs th Street Jack s Snack Bar Beach Blvd HUNTINGTON STATE BEACH Beach Blvd Newland Street Magnolia Street Brookhurst Street Santa Ana River Mouth Beach NEWPORT BEACH Orange Street nd / 53rd Street th Street Newport Pier th / 16th Street Balboa Pier The Wedge Corona Del Mar State Beach Little Corona CRYSTAL COVE STATE PARK BEACH Pelican Point Beach Crystal Cove State Beach Muddy Creek Beach El Morro Beach LAGUNA BEACH Emerald Bay Crescent Bay Laguna Main Beach Hotel Laguna Bluebird Canyon Victoria Beach Blue Lagoon ALISO COUNTY BEACH & SOUTH LAGUNA BEACH Goff Island Beach Treasure Island Beach Aliso - North Aliso - Middle Aliso - South Table Rock Laguna Lido th Street / 1000 Steps Beach Three Arch Bay DANA POINT Monarch Beach Salt Creek County Beach Dana Strands Ocean Institute Beach DOHENY STATE BEACH North Beach North of San Juan Creek San Juan Creek / Ocean Interface South of Outfall South of Outfall South of Outfall South of Outfall CAPISTRANO COUNTY BEACH Capistrano County Beach CAPISTRANO BAY DISTRICT BEACH 7500 South of Outfall ,000 South of Outfall POCHE BEACH Poche Beach SAN CLEMENTE CITY BEACH North Beach North of Pier Trafalgar Street ( T Street) SAN CLEMENTE STATE BEACH Avenida Calafia Avenida de Las Palmeras Annual Ocean and Bay Water Quality Report - Page 52


62


63


64 County of Orange Health Care Agency Public Health Services Environmental Health 1241 East Dyer Road, Suite 120 Santa Ana, CA (714) Web Page: Hotline: (714)
2006 Annual Ocean and Bay Water Quality Report
 March 2007 2006 Annual Ocean and Bay Water Quality Report HEALTH CARE AGENCY ENVIRONMENTAL HEALTH March 2007 2006 Annual Ocean and Bay Water Quality Report PROJECT MANAGERS Larry Honeybourne, Environmental
HEALTH CARE AGENCY PUBLIC HEALTH SERVICES ENVIRONMENTAL HEALTH. October 2012
 HEALTH CARE AGENCY PUBLIC HEALTH SERVICES ENVIRONMENTAL HEALTH October 2012 Cover Photo: Newport Beach Pier October 2012 2011 Annual Ocean, Harbor & Bay Water Quality Report PROJECT MANAGERS Larry Honeybourne,
2005 Annual Ocean and Bay Water Quality Report
 March 2006 2005 Annual Ocean and Bay Water Quality Report HEALTH CARE AGENCY ENVIRONMENTAL HEALTH March 2006 2005 Annual Ocean and Bay Water Quality Report PROJECT MANAGERS Larry Honeybourne, Environmental
HEALTH CARE AGENCY PUBLIC HEALTH SERVICES ENVIRONMENTAL HEALTH. September 2016
 HEALTH CARE AGENCY PUBLIC HEALTH SERVICES ENVIRONMENTAL HEALTH September 2016 Cover Photo: Family Fun in Surf September 2016 2015 Annual Ocean, Harbor & Bay Water Quality Report PROJECT MANAGERS Anthony
HEALTH CARE AGENCY PUBLIC HEALTH SERVICES ENVIRONMENTAL HEALTH. September 2011
 HEALTH CARE AGENCY PUBLIC HEALTH SERVICES ENVIRONMENTAL HEALTH September 2011 Cover Photo: San Clemente City Beach September 2011 2010 Annual Ocean, Harbor & Bay Water Quality Report PROJECT MANAGERS Larry
Oregon Department of Human Services HEALTH EFFECTS INFORMATION
 Oregon Department of Human Services Office of Public Health Systems (503) 731-4030 Emergency 800 NE Oregon Street #611 (503) 731-4381 Portland, OR 97232-2162 (503) 731-4077 FAX (503) 731-4031 TTY-Nonvoice
Portland Water District Sebago Lake Monitoring Programs Lower Bay Bacteria Monitoring Presenting data from 1977 to 2018 Laurel Jackson
 Portland Water District Sebago Lake Monitoring Programs Lower Bay Bacteria Monitoring Presenting data from 1977 to 2018 Laurel Jackson Introduction Sebago Lake is the primary drinking water supply for
Tufts University Water: Systems, Science, and Society (WSSS) Program
 Program") To: From: John Foster, Elbow Cay, the Bahamas; Friends of the Environment, Marsh Harbor, the Bahamas Alex Bedig, Amanda Garfield, Shonda Gaylord, Jack Melcher, Melissa Ng, Nathan Rawding, Kendall Webster,
To: From: John Foster, Elbow Cay, the Bahamas; Friends of the Environment, Marsh Harbor, the Bahamas Alex Bedig, Amanda Garfield, Shonda Gaylord, Jack Melcher, Melissa Ng, Nathan Rawding, Kendall Webster,
Analysis of Indicator Bacteria in NJ Dead-end Lagoons. Michael Callaghan Gasbarro Mentor: Dr. Kathryn Goddard
 Analysis of Indicator Bacteria in NJ Dead-end Lagoons Michael Callaghan Gasbarro Mentor: Dr. Kathryn Goddard Delaware Valley Estuary Summit Session 20: January 28, 2015 Dead-end Canals or Lagoons Popular
Finding sources of fecal coliform bacteria in stormwater runoff
 Finding sources of fecal coliform bacteria in stormwater runoff David Tomasko, Ph.D. May 12, 2016 Why the concern over bacteria? Cholera Tens of millions killed over the centuries > 100,000 Americans 11
FINAL Water Year 2012 Bacteria Sampling Report for the Klamath River Estuary
 FINAL Water Year 2012 Bacteria Sampling Report for the Klamath River Estuary Prepared by: Patrick Fox Yurok Tribe Environmental Program April 2013 Acknowledgements The Yurok Tribe Environmental Program
Water Quality Trends for Conscience Bay
 Water Quality Trends for Conscience Bay 2018 This report summarizes water quality data for fecal coliform and total coliform in Conscience Bay for the years 1998-2018. Prepared by: Brian M. McCaffrey Stormwater
Orange County CoastKeeper Harbor Pumpout Survey
 Orange County CoastKeeper Harbor Pumpout Survey Orange County CoastKeeper OC Pumpout Survey Table of contents Executive Summary.3-11 Data Section.12-13 Newport Harbor..14-32 Dana Point 33-38 Huntington
Loyalsock Creek Bacterial Coliforms. Presented By: Dr. Mel Zimmerman Clean Water Institute Lycoming College Matthew Bennett Jim Rogers
 Loyalsock Creek Bacterial Coliforms Presented By: Dr. Mel Zimmerman Clean Water Institute Lycoming College Matthew Bennett Jim Rogers What is E. coli? Short for Escherichia coli (a bacteria) It is a
No Longer Fond of the Local Pond
 No Longer Fond of the Local Pond by Stephanie L. Luster-Teasley, Janie G. Locklear, and Niva S. King Department of Civil, Architectural and Environmental Engineering North Carolina A&T State University,
FECAL COLIFORM MONITORING IN GRAYS HARBOR COUNTY: SUMMARY REPORT OF MONITORING RESULTS FOR
 Chehalis Basin Partnership Fecal Coliform Monitoring in Grays Harbor County: Summary Report of Monitoring Results for 2000-2003 Draft June 30, 2003 Prepared by Tetra Tech/KCM, Inc. 1917 First Avenue, Seattle,
Pathogens and Grazing Livestock
 Pathogens and Grazing Livestock Steve Ensley DVM, PhD 10/16/09 Water Borne Pathogens This presentation will have a specific emphasis on water borne pathogens. NUMBERS OF IOWA WATER SOURCES WITH Stream/River
Water Quality Trends for Patchogue Bay
 Water Quality Trends for Patchogue Bay 2018 This report summarizes water quality data for fecal coliform and total coliform in Patchogue Bay for the years 2003-2017. Prepared by: Brian M. McCaffrey Stormwater
Overview of Microbial Indicator Monitoring Lab Methods. Jim Ferretti, USEPA Region 2 DESA, Laboratory Branch May 23, 2018
 Overview of Microbial Indicator Monitoring Lab Methods Jim Ferretti, USEPA Region 2 DESA, Laboratory Branch May 23, 2018 Water Contamination and Public Health 1854- John Snow mapped and correlated incidence
E. coli and Coliform Bacteria Levels of Edgewood s Watershed Katie Schneider and Leslie Reed
 E. coli and Coliform Bacteria Levels of Edgewood s Watershed Katie Schneider and Leslie Reed Abstract Bacteria levels throughout the Lake Wingra watershed are a concern to the Lake Wingra community. Local
Fecal Coliform Bacteria Monitoring for the Sleepy Creek Watershed Incremental 319 Project Final Report
 Fecal Coliform Bacteria Monitoring for the Sleepy Creek Watershed Incremental 319 Project Final Report Prepared for: West Virginia Conservation Agency Prepared by: Cacapon Institute Back Creek Road PO
Evaluation copy. Fecal Coliform. Computer INTRODUCTION
 Fecal Coliform Computer 9 INTRODUCTION The concentration of fecal coliform bacteria in water is measured to determine the likelihood of contamination by microbiological organisms. While fecal coliform
CITY OF LYNDEN STORMWATER MANAGEMENT PROGRAM REPORT MARCH 1, 2016
 CITY OF LYNDEN STORMWATER MANAGEMENT PROGRAM 2015 WATER QUALITY MONITORING REPORT CITY OF LYNDEN 300 4 TH STREET LYNDEN, WASHINGTON 98264 PHONE (360) 354-3446 MARCH 1, 2016 This document serves as an attachment
BACTERIOLOGICAL MONITORING 109 TRAINING COURSE $ HOUR RUSH ORDER PROCESSING FEE ADDITIONAL $50.00
 Registration form BACTERIOLOGICAL MONITORING 109 TRAINING COURSE $50.00 48 HOUR RUSH ORDER PROCESSING FEE ADDITIONAL $50.00 Start and finish dates: You will have 90 days from this date in order to complete
Clean Ocean Access Water Quality Monitoring Summary Report
 Clean Ocean Access 2008-2017 Water Quality Monitoring Summary Report CONTRIBUTING AUTHORS: Eva Touhey, Program Manager, Clean Ocean Access Jessica Frascotti, Program Coordinator, Clean Ocean Access Dave
Appendix G: Summary of Microbial Source Tracking Studies in Southern California
 Appendix G: Summary of Microbial Source Tracking Studies in Southern California s Indicators/ Analyzed 2003-2004 Mission Bay MEC / Weston Bay, MS4, General Bacteroides by PCR Human Bacteroides by PCR Ribotyping
DEPARTMENT OF NATURAL RESOURCE PROTECTION TECHNICAL REPORT SERIES TR: 95-02
 DEPARTMENT OF NATURAL RESOURCE PROTECTION TECHNICAL REPORT SERIES TR: 95-02 SUMMARY OF BACTERIOLOGICAL TESTING IN THE LAS OLAS ISLES AUGUST 1994 THROUGH AUGUST 1995 ENVIRONMENTAL MONITORING DIVISION WATER
TACWA September Meeting CHALLENGES IN MEETING THE TEXAS BACTERIAL LIMITS WITH UV ALONG THE COAST AND BAYS. Gennady Boksiner, P.E. September 30, 2011
 TACWA September Meeting CHALLENGES IN MEETING THE TEXAS BACTERIAL LIMITS WITH UV ALONG THE COAST AND BAYS Gennady Boksiner, P.E. September 30, 2011 Bacterial Groups Intestinal bacteria of humans and other
Coliforms as Indicator of Faecal Pollution
 World Bank & Government of The Netherlands funded Training module # WQ - 22 Coliforms as Indicator of Faecal Pollution New Delhi, June 1999 CSMRS Building, 4th Floor, Olof Palme Marg, Hauz Khas, New Delhi
Fecal Coliforms Increase in a Storm Drain Fed Pond After Rain Events
 Proceedings of The National Conference On Undergraduate Research (NCUR) 217 University of Memphis, TN Memphis Tennessee April 6-8, 217 Fecal Coliforms Increase in a Storm Drain Fed Pond After Rain Events
Bacteriological testing of water
 MOBILE NOTE 6 Bacteriological testing of water Introduction Bacteriological water testing is a method of collecting water samples and analysing those samples to estimate the numbers of bacteria present.
Figure 1. Overview map of Burrard Inlet, showing location of False Creek inlet.
 Figure 1. Overview map of Burrard Inlet, showing location of False Creek inlet. 65 Figure 2. Location map of False Creek and shoreline and mid-channel monitoring sites. 66 Figure 3. Location of CSO's,
LAKE HURON BEACH STUDY
 LAKE HURON BEACH STUDY A microbiological water quality evaluation of Grand Bend Beach and related pollution sources in 1985 Ministry of the Environment D.A. McTavish Director Southwestern Region Copyright
Comparison of Gelman and Millipore Membrane Filters for Enumerating Fecal Coliform Bacteria
 APPLIED MICROBIOLOGY, Sept. 1973, p. 332-336 Copyright 0 1973 American Society for Microbiology Vol. 26, No. 3 Printed in U.S.A. Comparison of Gelman and Millipore Membrane Filters for Enumerating Fecal
Assessment of Pathogen Strategies
 Assessment of Pathogen Strategies Bacteria levels in receiving waters are a primary concern for federal, state, and local agencies. The primary sources of bacteria are generally attributed to combined
City of Peoria Clean Water Efforts. Governor s s Conference on the Management of the Illinois River October 4, 2007
 City of Peoria Clean Water Efforts Governor s s Conference on the Management of the Illinois River October 4, 2007 1 What do you call dinner and a movie with an unemployed guy? An unfunded man-date! 2
Alberta Agriculture and Forestry s Response to the 2014 Outbreak of E. coli O157:H7 in Alberta
 Alberta Agriculture and Forestry s Response to the 2014 Outbreak of E. coli O157:H7 in Alberta Jeff Stewart Alberta Agriculture and Forestry Industry Days April 9, 2016 E. coli O157:H7: What is it and
Bacteria Contamination of Surface Waters Due to Livestock Grazing in the Stanislaus National Forest, California (Second Year of Study)
") Bacteria Contamination of Surface Waters Due to Livestock Grazing in the Stanislaus National Forest, California (Second Year of Study) Lindsey Myers, staff biologist Central Sierra Environmental Resource
Bacteria Contamination of Surface Waters Due to Livestock Grazing in the Stanislaus National Forest, California (Second Year of Study) Lindsey Myers, staff biologist Central Sierra Environmental Resource
Teleclass Sponsored by Webber Training, Hosted by Paul Webber,
 Slide 1 Disease Transmission and Control in the Home Setting Charles P. Gerba Departments of Microbiology and Immunology and Epidemiology and Biostatistics University of Arizona Tucson, AZ 85721 Webber
Statistical Evaluation of BMP Effectiveness in Reducing Fecal Coliform Impairment in Mermentau River Basin
 Statistical Evaluation of BMP Effectiveness in Reducing Fecal Coliform Impairment in Mermentau River Basin Z.-Q. Deng 1 and H. Chowdhary 2 1 Assistant Professor, Department of Civil and Environmental Engineering,
Pr oject Summar y. Survey of the prevalence of Escherichia coli O157:H7 on the surface of subprimal cuts of beef during winter months (Phase I)
") Pr oject Summar y Survey of the prevalence of Escherichia coli O157:H7 on the surface of subprimal cuts of beef during winter months (Phase I) Principal Investigators: J. E. (Ken) Kennedy ABC Research
Pr oject Summar y Survey of the prevalence of Escherichia coli O157:H7 on the surface of subprimal cuts of beef during winter months (Phase I) Principal Investigators: J. E. (Ken) Kennedy ABC Research
Tel Fax
 655 West 12 th Avenue Vancouver, BC V5Z 4R4 Tel 604.707.2400 Fax 604.707.2441 www.bccdc.ca 2018 norovirus outbreak linked to consumption of BC oysters: evaluation of environmental sewage sources find commercial
UNITED STATES MARINE CORPS FIELD MEDICAL TRAINING BATTALION Camp Lejeune, NC
 UNITED STATES MARINE CORPS FIELD MEDICAL TRAINING BATTALION Camp Lejeune, NC 28542-0042 FMST 201 Perform Water Purification for Individual Use TERMINAL LEARNING OBJECTIVES 1. Given water and hygiene items,
BACTERIOLOGICAL SAMPLING TRAINING COURSE $ HOUR RUSH ORDER PROCESSING FEE ADDITIONAL $50.00
 Registration form BACTERIOLOGICAL SAMPLING TRAINING COURSE $100.00 48 HOUR RUSH ORDER PROCESSING FEE ADDITIONAL $50.00 Start and finish dates: You will have 90 days from this date in order to complete
Addressing challenges associated with the detection of faecal coliform organisms in water matrices. Neil Leat Rand Water Date 30/09/2014
 Addressing challenges associated with the detection of faecal coliform organisms in water matrices Neil Leat Rand Water Date 30/09/2014 What are coliforms? Definitions of coliforms are based on biochemical
Project Summary. Principal Investigators: Lawrence D. Goodridge 1 ; Phil Crandall 2, and Steven Ricke 2. Study Completed 2010
 Project Summary Validation of the use of Citrus Essential Oils as a Post Harvest Intervention against Escherichia coli O157:H7 and Salmonella spp. on Beef Carcasses Principal Investigators: Lawrence D.
INVESTIGATION OF NONPOINT POLLUTION SOURCES IMPACTING SHELLFISH GROWING AREAS IN TOMALES BAY,
 TOMALES BAY SHELLFISH TECHNICAL ADVISORY COMMITTEE FINAL REPORT: INVESTIGATION OF NONPOINT POLLUTION SOURCES IMPACTING SHELLFISH GROWING AREAS IN TOMALES BAY, 995-96 December 2000 Tomales Bay Shellfish
The Mercer Island E. coli Event PNWS AWWA Spring Conference Bellevue Washington 2015
 The Mercer Island E. coli Event PNWS AWWA Spring Conference Bellevue Washington 2015 Steve Deem, PE & Bob James, PE Office of Drinking Water Washington State Department of Health Office of Drinking Water
WIFSS research on E. coli O157:H7 in central coastal California. Rob Atwill, D.V.M., Ph.D. University of California-Davis
 WIFSS research on E. coli O157:H7 in central coastal California Rob Atwill, D.V.M., Ph.D. University of California-Davis To all cooperators: ranchers, growers, regulators, environmentalists, resource managers,
Little Venice Water Quality Monitoring 2002 Annual Report
 Florida International University FIU Digital Commons SERC Research Reports Southeast Environmental Research Center 5-7-2003 Little Venice Water Quality Monitoring 2002 Annual Report Ronald Jones Southeast
COLILERT - WHAT'S AL THE FUSS ABOUT? Elizabeth Hanko. Elizabeth Hanko, Senior Consultant. AWT, Victoria
 COLILERT - WHAT'S AL THE FUSS ABOUT? Paper Presented by : Elizabeth Hanko Author: Elizabeth Hanko, Senior Consultant AWT, Victoria 63 rd Annual Water Industry Engineers and Operators Conference Civic Centre
Learning Styles: Visual, auditory, kinesthetic, and synthesis
 Miriam Sawyer Tate High School/ Escambia County, FL Title: Let s get sterile and learn to problem solve!!!! Key Questions: (Unit on safety and scientific method) 1. How well do we wash our hands and why
Drinking Water and Waste Management Among Members of the Temagami Lakes Association July 2014 Page 0
 Drinking Water and Waste Management Among Members of the Temagami Lakes Association July 2014 Page 0 Acknowledgements The Timiskaming Health Unit would like to thank the following individuals for their
BUCKEYE LAKE PROTECTION PLAN THE TOWN OF BEECH MOUNTAIN REGULATIONS GOVERNING IN-LAKE ACTIVITIES AND USES OF BUCKEYE LAKE
 I. PURPOSE BUCKEYE LAKE PROTECTION PLAN THE TOWN OF BEECH MOUNTAIN REGULATIONS GOVERNING IN-LAKE ACTIVITIES AND USES OF BUCKEYE LAKE The purpose of this regulation is to set forth for the Town of Beech
Microbial Hygiene Considerations with Mechanical Harvesting of Blueberries
 Microbial Hygiene Considerations with Mechanical Harvesting of lueberries Renée Allen UGA Extension, Alma, GA Dr. Harald Scherm UGA Plant Pathology, Athens, GA Dr. Jinru Chen UGA Food Science, Griffin,
Sampling for Microbial Analysis
 Sampling for Microbial Analysis Linda J. Harris, Ph.D. Department of Food Science and Technology ljharris@ucdavis.edu Microbial Testing One of the most apparent but poorly understood parts of food microbiology
Comparison of the Novel ColiPlate
 Comparison of the Novel ColiPlate TM Kit and the Standard Membrane Filter Technique for Enumerating Total Coliforms and Escherichia coli Bacteria in Water Ran Lifshitz, 1 Renu Joshi 2 1 Environmental Biodetection
BACTERIAL CONTAMINATION OF WATER WELLS AND SPRINGS
 4/15/215 BACTERIAL CONTAMINATION OF WATER WELLS AND SPRINGS Bryan Swistock Water Resources Specialist Penn State Extension Department of Ecosystem Science and Management Microbiological Parameters Standard
Changes in Surviving E.coli, Coliform Bacteria and General Bacteria in Manure with Air Drying Treatment
 IJERD International Journal of Environmental and Rural Development (11) 2 1 Research article erd Changes in Surviving, Coliform Bacteria and General Bacteria in Manure with Air Drying Treatment YUTA ISHIKAWA
Outbreak of Escherichia coli O157. Connecticut, Quyen Phan, MPH Connecticut Department of Public Health
 Outbreak of Escherichia coli O157 Associated with Raw Milk, Connecticut, 2008 Quyen Phan, MPH Connecticut Department of Public Health Epidemiology and Emerging Infections Program 2009 OutbreakNet Annual
Aquatic Park, which is situated along the Berkeley shoreline (Figure 1, p. 126), can be a pleasant
, can be a pleasant") - 7 - hapter 3 WATER QUALITY AT AQUATI PARK: BIOLOGIAL PARAMETER Irvin Getts Introduction Aquatic Park, which is situated along the Berkeley shoreline (Figure 1, p. 126), can be a pleasant place to spend
- 7 - hapter 3 WATER QUALITY AT AQUATI PARK: BIOLOGIAL PARAMETER Irvin Getts Introduction Aquatic Park, which is situated along the Berkeley shoreline (Figure 1, p. 126), can be a pleasant place to spend
ES Aircraft Deicing Document Identification Number Date: March 15, ) Activity Description:
 Activity Description:") ES-301-1.06 Aircraft Deicing Document Identification Number ES-301-1.06 Date: March 15, 2018 Document Owner: Keith Pass 1) Activity Description: Aircraft deicing is the application of aircraft deicing
ES-301-1.06 Aircraft Deicing Document Identification Number ES-301-1.06 Date: March 15, 2018 Document Owner: Keith Pass 1) Activity Description: Aircraft deicing is the application of aircraft deicing
ASSESSMENT OF FECAL COLIFORM IN LITTLE RABBIT CREEK AND LITTLE SURVIVAL CREEK
 ASSESSMENT OF FECAL COLIFORM IN LITTLE RABBIT CREEK AND LITTLE SURVIVAL CREEK FINAL REPORT Prepared for: Alaska Department of Environmental Conservation 555 Cordova Street Anchorage, Alaska 99501 Prepared
IMPACT OF WASTE WATER TREATMENTS ON REMOVAL OF NOROVIRUSES FROM SEWAGE. 1 March 2012
 IMPACT OF WASTE WATER TREATMENTS ON REMOVAL OF NOROVIRUSES FROM SEWAGE 1 March 2012 Impact of wastewater treatments on removal of noroviruses from sewage defra project reference WT0924 Elaine Connolly,
Madera County Grand Jury Final Report Madera County Mosquito and Vector Control District
 2010-2011 Madera County Grand Jury Final Report Madera County Mosquito and Vector Control District INTRODUCTION: 2010-2011 Madera County Grand Jury Final Report Madera County Mosquito and Vector Control
The north half of Section 18, Township 37 North, Range 6 East, Second Principal Meridian, Jefferson Township, Elkhart County, Indiana; also,
 The north half of Section 18, Township 37 North, Range 6 East, Second Principal Meridian, Jefferson Township, Elkhart County, Indiana; also, The east half of Sections 21, 28, and 33, Township 37 North,
Coastal Peak Population Survey
 Coastal Peak Population Survey Final Report 2012-2013 September 2014 Executive Summary The Whangarei District Council conducted a survey to determine peak populations of coastal areas between the 21 December
Bacterial Quality of Crystalline Rock and Glacial Aquifers in New England
 Bacterial Quality of Crystalline Rock and Glacial Aquifers in New England By Sarah Flanagan and Charles Culbertson, U.S. Geological Survey 2012 New Hampshire Water and Watershed Conference Plymouth State
FECAL COLIFORM BACTERIA SUMMARY SHEET
 FECAL COLIFORM BACTERIA SUMMARY SHEET WATERBODY: Greybull River (Tributary to Big Horn River) (WYBH10080009) REACH DESCRIPTION: Confluence wi e Big Horn River upstream to Meeteetse, Wyoming. BACKGROUND:
Jonathan Howarth Ph.D and Tina Rodrigues BS Enviro Tech Chemical Services Modesto, CA 95258
 The Effectiveness of Water, Sodium Hypochlorite Bleach, and Peroxyacetic Acid (PAA) in Eradicating a Wild Field Strain of E. coli O157:H7 from the Surface of Cucumbers Background Jonathan Howarth Ph.D
Meeting Agenda. Why are we here? Getting Started. Designated Uses. Water Quality Standards
 Upper Basin Total Maximum Daily Load Study and Rapidan Technical Advisory Committee Meetings July 27, Meeting Agenda Water Quality Assessments and TMDL Process Bryant Thomas, VA DEQ Overview of 16 TMDL
Some Historical Aspects of Urban Water Systems
 Some Historical Aspects of Urban Water Systems Robert Pitt Department of Civil and Environmental Engineering University of Alabama Tuscaloosa, AL 35487 Ancient springs at Delphi, Greece (site of Oracle)
Potomac River Commuter Ferry Feasibility Study & RPE Results
 1.1 Introduction The Prince William County Department of Transportation conducted a route proving exercise (RPE) and feasibility study of a proposed commuter ferry service on the Potomac River between
Laboratories & Consulting Group
 Final Report Efficacy of Hypobromous Acid as a Hide Intervention Performed July 18-20, 2011 Submitted to Mike Harvey Technical Operations Mgr. Enviro Tech 500 Winmoore Way Modesto, CA 95358 209-232-2211
U.S. Coast Guard - American Waterways Operators Annual Safety Report
 American Waterways Operators U.S. Coast Guard - American Waterways Operators Annual Safety Report National Quality Steering Committee Meeting December 12, 2017 Established Safety Metrics For 17 years,
ISPUB.COM. Microbiological Quality Of Sweetmeat With Special Reference To Staphylococci. S Chakraborty, A Pramanik, A Goswami, R Ghosh, S Biswas
 ISPUB.COM The Internet Journal of Microbiology Volume 1 Number 1 Microbiological Quality Of Sweetmeat With Special Reference To Staphylococci S Chakraborty, A Pramanik, A Goswami, R Ghosh, S Biswas Citation
Bioremediation of Oily Bilge Using BilgeRemed on board M/V Swift Arrow. Satya Ganti
 SBR Report No. 3-1203 Bioremediation of Oily Bilge Using BilgeRemed on board M/V Swift Arrow Satya Ganti President & CEO Sarva Bio Remed. LLC 36 South Broad Street, Trenton, NJ 08608 USA www.sarvabioremed.com
Gas Chromatographic Presumptive Test for Coliform Bacteria in Water
 AmPID MICROBIOLOGY, Oct. 1975, P. 584-588 Copyright X) 1975 American Society for Microbiology Vol. 30, No. 4 Printed in U.SA. Gas Chromatographic Presumptive Test for Coliform Bacteria in Water JUDITH
Microbiological Analysis of Food Contact Surfaces in Child Care Centers
 APPLIED AND ENVIRONMENTAL MICROBIOLOGY, Nov. 2008, p. 6918 6922 Vol. 74, No. 22 0099-2240/08/$08.00 0 doi:10.1128/aem.00547-08 Copyright 2008, American Society for Microbiology. All Rights Reserved. Microbiological
Microbiological Analysis of Food Contact Surfaces in Child Care Centers
 APPLIED AND ENVIRONMENTAL MICROBIOLOGY, Nov. 2008, p. 6918 6922 Vol. 74, No. 22 0099-2240/08/$08.00 0 doi:10.1128/aem.00547-08 Copyright 2008, American Society for Microbiology. All Rights Reserved. Microbiological
Kit Information 4 Introduction. 4 Kit Contents, Storage, and Testing Conditions. 4 Equipment Needed. 4 Applicability. 4 Precautions... 4.
 Contents 3 Kit Information 4 Introduction. 4 Kit Contents, Storage, and Testing Conditions. 4 Equipment Needed. 4 Applicability. 4 Precautions.......................... 4 Procedure 6. Analysis of Results
Proficiency Testing FINAL REPORT Check sample program 16CSP02 February 2016
 Proficiency Testing FINAL REPORT Check sample program 16CSP2 February 216 Proficiency Testing Provider Certificate Number 3189-2. Program Coordinator: Ingrid Flemming IFM Quality Services Pty Ltd PO Box
Technological Field Performance of a New Point-of-Use Water Treatment Technology in a Randomized Control Trial in Limpopo, South Africa
 Technological Field Performance of a New Point-of-Use Water Treatment Technology in a Randomized Control Trial in Limpopo, South Africa Courtney Hill UNC Water and Health Conference October 218 1 Background
North Carolina Addendum Total Maximum Daily Load (TMDL) for Impaired Segments in the Dan River Watershed to Virginia TMDLs Approved by EPA Region 3
 for Impaired Segments in the Dan River Watershed to Virginia TMDLs Approved by EPA Region 3") North Carolina Addendum Total Maximum Daily Load (TMDL) for Impaired Segments in the Dan River Watershed to Virginia TMDLs Approved by EPA Region 3 Assessment units (AU) for the Dan River, 22-(39)b and
North Carolina Addendum Total Maximum Daily Load (TMDL) for Impaired Segments in the Dan River Watershed to Virginia TMDLs Approved by EPA Region 3 Assessment units (AU) for the Dan River, 22-(39)b and
March 25, 2013 Blog Water Cheryl Storrs. Water, Water Everywhere and Lots of Drops To Drink
 March 25, 2013 Blog Water Cheryl Storrs Water, Water Everywhere and Lots of Drops To Drink Something most of us take for granted is water. We never have to do more than turn on the tap, so what happens
Figure 1.1 St. John s Location. 2.0 Overview/Structure
 St. John s Region 1.0 Introduction Newfoundland and Labrador s most dominant service centre, St. John s (population = 100,645) is also the province s capital and largest community (Government of Newfoundland
Coastal vessels The number of insurance accidents and accident rate fluctuation 8.0%
 1 2 3 4 5 6 1 In November 2013, a Loss & Prevention Seminar under the theme of Prevention of damage to harbour facilities was held at the following five areas: Tokyo, Kobe, Imabari, Fukuoka and Saeki.
Amended Maintenance Dredge Spoil Management Plan. Shute Harbour Marina Resort
 Amended Maintenance Dredge Spoil Management Plan Shute Harbour Marina Resort Amended Maintenance Dredge Spoil Management Plan Quality Information Document Ref Amended Maintenance Dredge and Spoil Maintenance
Lower St. Johns River Tributaries Fecal Coliform Basin Management Action Plan Jacksonville Environmental Symposium
 Lower St. Johns River Tributaries Fecal Coliform Basin Management Action Plan Jacksonville Environmental Symposium WBIDs Addressed in This BMAP This BMAP includes 10 of the 75 (cycle 2) fecal coliform
Effect of SODIS and Hygiene Behaviour childhood diarrhoea
 WHO Conference, Accra Ghana 2. 5. June 2008 Effect of SODIS and Hygiene Behaviour childhood diarrhoea A quantitative field study in the SODIS project area in the Kibera Slum of Nairobi, Kenya Jürg Graf
To all our cooperators from across California. be they ranchers, growers, or regulators, activists, resource managers, and the public THANK YOU!
 Managing Rangeland sheds for Agricultural Production, Quality, and Food Safety To all our cooperators from across California be they ranchers, growers, or regulators, activists, resource managers, and
A Medical Mystery of Epidemic Proportions
 STO-116 A Medical Mystery of Epidemic Proportions Daphne s Blog - Sunday I m not sure my decision to be a Peace Corp volunteer was a good idea. I thought I was prepared for working in a village where extreme
Welcome to the. EBC Breakfast Meeting. The CSO Program Update Frederick A. Laskey Executive Director Massachusetts Water Resources Authority
 Welcome to the EBC Breakfast Meeting The CSO Program Update Frederick A. Laskey Executive Director Massachusetts Water Resources Authority Massachusetts Water Resources Authority Presentation to the Environmental
SAMTRANS TITLE VI STANDARDS AND POLICIES
 SAMTRANS TITLE VI STANDARDS AND POLICIES Adopted March 13, 2013 Federal Title VI requirements of the Civil Rights Act of 1964 were recently updated by the Federal Transit Administration (FTA) and now require
Cruise Industry Perspective on OWS and Waste Management
 Cruise Industry Perspective on OWS and Waste Management MAX1 OWS Studies Conference Wilmington, NC, 24 June 2015 James R. Van Langen, P.E. Environmental, Safety, Quality & Sustainability Consultant Cruise
Airline Industry Activity Report
 Airline Industry 2010-2011 Activity Report Table of Contents Introduction... 3 Background... 3 Results and Achievements... 4 1.0 Potable water sampling on Canadian based airlines... 4 2.0 Potable Water
FLORIDA DEPARTMENT OF ENVIRONMENTAL PROTECTION. Division of Environmental Assessment and Restoration, Bureau of Watershed Restoration
 FLORIDA DEPARTMENT OF ENVIRONMENTAL PROTECTION Division of Environmental Assessment and Restoration, Bureau of Watershed Restoration NORTHWEST DISTRICT PENSACOLA BAY BASIN FINAL TMDL Report Fecal Coliform
GB Translated English of Chinese Standard: GB NATIONAL STANDARD OF THE
 Translated English of Chinese Standard: GB4789.3-2016 www.chinesestandard.net Sales@ChineseStandard.net GB NATIONAL STANDARD OF THE PEOPLE S REPUBLIC OF CHINA GB 4789.3-2016 National food safety standard
2009 Muskoka Airport Economic Impact Study
 2009 Muskoka Airport Economic Impact Study November 4, 2009 Prepared by The District of Muskoka Planning and Economic Development Department BACKGROUND The Muskoka Airport is situated at the north end
Paul Sturm Roberto Viqueira Ríos
 Paul Sturm Roberto Viqueira Ríos In this talk Brief Background on Land Based Sources Historical Perspective Guánica watershed characteristics/ issues High priority restoration projects Other key issues