PASSENGER SERVICES, PAGE 15
|
|
|
- Sophie Whitehead
- 5 years ago
- Views:
Transcription


1 ANNUAL REPORT 2017


2 CONTENTS Highlights CEO s Review 4 CFO s Review 6 Business Concept, Values and Strategic Goals 9 Business Environment 10 Shipping and Sea Transport Services 12 Passenger Services 15 Port Operations 16 Safety and Environment 19 Human Resources 21 Financial Statements Board of Directors Report 24 Consolidated Statement of Comprehensive Income 28 Consolidated Statement of Financial Position 29 Consolidated Statement of Changes in Equity 30 Consolidated Statement of Cash Flows 31 Profit and Loss Account, Parent Company 32 Balance Sheet, Parent Company 33 Cash Flow Statement, Parent Company 34 Five-Year Key Figures 35 Calculation of Key Ratios 36 Quarterly Data 37 Board s Proposal 38 Auditor s Report 39 Corporate Governance Statement 40 Board of Directors 46 Executive Committee and Board of Management 47 Finnlines Fleet 48 Operating Areas 50 Contact Information 52 The Grimaldi Group 53 SHIPPING AND SEA TRANSPORT SERVICES, PAGE 12 PASSENGER SERVICES, PAGE 15 PORT OPERATIONS, PAGE 16

3 Finnlines is a leading shipping operator of ro-ro and passenger services in the Baltic Sea and the North Sea. The Company s passenger-freight vessels offer services from Finland to Germany and via the Åland Islands to Sweden, as well as from Sweden to Germany. Finnlines ro-ro vessels operate in the Baltic Sea and the North Sea. The Company has subsidiaries or sales offices in Germany, Belgium, Great Britain, Sweden, Denmark and Poland. In addition to sea transportation, the Company provides port services in Helsinki and Turku. Finnlines is a part of the Grimaldi Group, one of the world s largest operators of ro-ro vessels and the largest operator of the Motorways of the Sea in Europe for both passengers and freight. This affiliation enables Finnlines to offer liner services to and from any destination in the Mediterranean, West Africa as well as the Atlantic coast of both North and South America. 4
4 HIGHLIGHTS 2017 KEY FINANCIAL FIGURES Revenue increased by 13.2% to EUR million. EBITDA improved by 9.5% to EUR million. Interest-bearing debt decreased by 32.9 to EUR million. EUR million Equity ratio improved to 51.1% Revenue EUR million 600 Result before interest and taxes (EBIT) EUR million 100 Breakdown of revenue % 4% Shipping and sea transport Port operations IFRS IFRS EUR million Revenue Result before interest, taxes, depreciation and amortisation (EBITDA) Result before interest and taxes (EBIT) Result for the reporting period Equity ratio, % Interest bearing debt, MEUR Gearing, % STRATEGIC EXPANSION Investments in the fleet continues > Completed the EUR 100 million Environmental Technology Investment Programme to meet the more stringent environmental regulations set forth by the new Sulphur Directive in the SECA area. Thanks to this, Finnlines could reduce its environmental footprint and lower its sulphur emissions by over 90 per cent. > Started a new EUR 70 million Energy Efficiency and Emission Reduction Investment Programme. Under this programme Finnlines fleet capacity will be considerably increased by lengthening four Breeze series vessels and increasing passenger capacity within its ro-pax network. This new programme is also a direct response to the increased demand on the market. Investments in digitalisation > Developed mobile services in our port operations. > Implemented two major ERP systems: the port system and the system related to vessel efficiency monitoring and measurement. 2


5 KEY OPERATIONAL FIGURES The cargo volumes transported during January December totalled 709 thousand cargo units 147 thousand cars (not including passengers cars) 1,281 thousand tons of non-unitised freight 619 thousand private and commercial passengers Our largest ro-ro vessels have the capacity to carry 300 trailers per sailing. Our largest ro-ro passenger vessels have the capacity to carry 554 passengers per sailing. INCREASING LANE METRES AND EFFICIENCY The lengthening programme of Finnlines vessels is in full swing at Remontowa Shiprepair Yard in Gdansk, Poland, and the first lengthened Breeze series ro-ro vessels have been delivered. As planned, a vessel was cut in two and a 30-metre section was inserted between the parts. The sections were welded together again, and around 1,000 additional lane metres were added to the vessel s capacity. BETTER ENERGY EFFICIENCY The close to 30 per cent capacity increase will considerably reduce the energy consumption per transported unit compared to the original vessel. In other words, it will improve energy efficiency further and thus contribute more to reducing emissions. After the modification, the vessel is metres long and has a capacity of 4,192 lane metres. In practice, around 1 km of trucks more per ship can be accommodated on board. Under Finnlines EUR 70 million Energy Efficiency and Emission Reduction Investment Programme, which was launched in 2017, four of the Company s Breeze series ro-ro vessels will be lengthened. Finnlines also has an option for extension of another two vessels. The whole lengthening programme will be completed by May TOGETHER ACROSS THE BALTIC FOR THE 100-YEAR-OLD FINLAND As part of the Finland 100 years celebration we challenged everyone to be more active and exercise together for a great cause. Finnlines project Together across the Baltic was part of the official Finland 100 programme in As a result, Finnlines donated EUR 50,000 to Aamu Pediatric Cancer Foundation, which specialises in oncological research for children. FINNLINES

6 CEO S REVIEW WE CONTINUE TO GROW FINNLINES HAS A LONG-TERM DEVOTION TO EFFICIENCY, PERFORMANCE AND SUSTAINABILITY THE FINANCIAL YEAR 2017 WAS A FASCINATING YEAR FOR FINNLINES. While we celebrated our 70-year anniversary, we delivered again, for the third year in a row, a record-breaking result, EUR 82.7 million, which was over 20 per cent better than the previous year s result for the period. THE FINNISH ECONOMY STARTED TO GROW ALREADY AT THE END OF 2016 AND THE GROWTH ACCELERATED DUR- ING The sea freight volumes in Finland grew over 12 per cent during the year, yet, this can be considered an unprecedented result in the Finnlines Group. We are expanding the Finnlines fleet. In 2013, MS Europalink was sold by Finnlines to the parent company because of insufficient volumes in the Baltic at that time. In January 2018, the vessel re-joined Finnlines on the Germany Sweden route. Slotting the vessel back into the Finnlines rotation will also trigger reshuffling elsewhere in our routes. MS Nordlink, from the Germany Sweden route will be redeployed on the route between Finland and Sweden, that is, on the Naantali Långnäs Kapellskär route. MS Nordlink changed to sail under the Finnish flag and the vessel was renamed MS Finnswan. MS Finnswan will be one of the first ships of this length and with this level of cargo capacity to serve our customers between Finland and Sweden. 4

7 Three key elements running our shipping business are to grow together with customers, to increase efficiency of capital employed on our fleet and to continue investing in sustainable development. DURING THE PAST YEARS, FINNLINES HAS MADE SEV- ERAL IMPORTANT STRATEGIC DECISIONS and focused on improving its operational and financial performance. During the past decade, we have spent over EUR 1 billion on major fleet renewal, green ship technology, propulsion systems, port technology, IT technology and ERP systems, and we are continuing to invest more through our EUR 70 million Energy Efficiency and Emission Reduction Programme. Under this investment programme, launched in 2017, we will lengthen four of our Breeze series ro-ro vessels, which were built in 2012 and These vessels will have a capacity increase of 30 per cent, meaning they will be able to carry up to 4,200 lane metres of rolling cargo. The capacity increase of around 1,000 lane metres will also considerably reduce the energy consumption per transported unit compared to the original vessel. As a result, we have been able to sharply reduce emissions per transported tonne. Two vessels have already been lengthened successfully and the remaining two will be completed by the end of April. ONE TOPIC IN OUR STRATEGIC DISCUSSION IS DIGITALI- SATION. We continue to invest in digitalisation and it is already very present in our operations. We are increasing the efficiency and effectiveness of our processes and during 2017 we have implemented two major ERP systems; one in the port and the other one is related to vessel efficiency monitoring and measurement. We have also developed mobile services in our port operations to better serve our customers. By digitising and automating processes costs have been cut by more than 30 per cent, meaning savings of several million euros. In addition, information is more accurate, of higher quality, and transferred quicker to various recipients. We will further develop our services to create competitive advantages through digitalisation. SHIPPING TRANSPORTS TODAY COVER AROUND 90 PER CENT OF GLOBAL COMMERCE, but account only for around 2.2 per cent of C0 2 emissions. This low percentage alone speaks for itself how environmentally friendly the shipping sector is globally. IN THE INTERNATIONAL MARITIME ORGANIZATION (IMO), REGULATORS AND THE INDUSTRY ARE DISCUSSING ways to achieve big cuts to CO 2 emissions over the coming decades possibly as much as 40 per cent. This will be our contribution to the wellbeing of generations that follow us. Moreover, the International Chamber of Shipping (ICS), the London-based leading international association of the shipping industry which represents over 80 per cent of the world fleet, believes it is time for IMO to step up to the plate and contribute more to the fight against global warming in order to match the ambitions laid down in the Paris Agreement and by the EU. EVEN THOUGH THE WORLD S SHIPPING SECTOR REP- RESENTS ONLY AROUND 2.2 PER CENT OF THE TOTAL GLOBAL CO 2 EMISSIONS, yet, the ICS s goal is to reduce the shipping sector s annual total CO 2 emissions below 2008 levels. In fact, the ambitious goal is to reduce them, on a tonne/kilometre basis, by at least 50 per cent by 2050, compared to WE NEED TO LOOK AHEAD TO THE NEXT DECADE AFTER We are in great shape and well prepared to be one step ahead of our competitors. We base our decisions on our own strategy and in the megatrends we see in the world: a modern fleet, lengthenings, green new buildings, batteries, environmental responsibility, maritime safety, fuel efficiency, digitalisation and automation, will determine which players survive, and which thrive, in the markets of tomorrow. Being a forerunner in our sector, we are well positioned to respond to the need for energyefficient, environmentally safe and technologically advanced solutions. In the last three years for example Finnlines increased cargo units transported by 11 per cent, cars transported by 48 per cent and passenger transported by 10 per cent. The increased service was delivered without increasing fuel consumption but even diminishing it by 2 per cent, and reducing SOx emissions by ten times. IN RESPONSE TO GROWING VOLUMES AND MARKET DEMAND, FINNLINES CONTINUES TO INVEST HEAVILY IN ITS FLEET and has signed a letter of intent for three new 7,300 lane metre ro-ro vessels. Looking to 2018 and a decade beyond, there have always been three key elements strictly connected in the way we are running our shipping business, worldwide in the Grimaldi Group, and also in Finnlines, that is to grow together with customers, to increase efficiency of capital employed on our fleet and to continue investing in sustainable development. I WOULD LIKE TO TAKE THIS OPPORTUNITY TO THANK OUR CUSTOMERS AND OUR MANY STAKEHOLDERS FOR YOUR CONFIDENCE IN FINNLINES, and our personnel onboard, in ports and in offices for carrying out the work which has made us the market leader in our sector. Continued joint effort, working as a Finnlines team, made the 2017 financial year the best ever and was a truly remarkable achievement by us all. Emanuele Grimaldi FINNLINES

8 CFO S REVIEW FINNLINES WITH STRONG FINANCIAL PERFORMANCE PROFIT JUMPS UP 21.5 PER CENT FINANCIAL PERFORMANCE The Finnish sea freight industry last year amounted to 99 million tonnes. Total shipping increased, compared to the previous year s figures, by 4 million tonnes. Exports increased by 6 per cent, totalling 52 million tonnes. Imports increased by 2 per cent compared to the previous year to 47 million tonnes. Looking to 2018, the latest forecast estimates the world s economic growth rate to accelerate in Favourable trading conditions increased our cargo volumes. We transported 709,000 cargo units, shipped 147,000 cars (not including passengers cars) and carried 619,000 passengers: all comfortably up on the previous year. The Finnlines Group s result for the reporting period increased by EUR 14.6 million to EUR 82.7 million. Earnings before interest, taxes, depreciation and amortisation, EBITDA, came to EUR million against EUR million after Revenue increased EUR 62.6 million to EUR million. The strong results we posted again are a proof that our strategy is paying off. Overall, 2017 was a strong year for Finnlines. To maintain this positive development, we have continued to invest in Finnlines fleet. We completed the EUR 100 million Environmental Technology Investment Programme to reduce the sulphur, CO2 and other harmful emissions. This included the installation of scrubbers, investments in propulsion and reblading, and silicone anti-fouling. In 2017, we launched a EUR 70 million Energy Efficiency and Emission Reduction Investment Programme to respond to the growing demand by increasing vessels cargo capacity. Under this programme we will lengthen four of our Breeze series ro-ro vessels with options for another two vessels. Each vessel will have 30 per cent additional capacity, meaning they will be able to carry up to 4,200 lane metres of rolling cargo. In addition to improving the customer service, we aim toward increased energy efficiency and reduced emissions. The investments have been enabled by solid, consistently improving cash flow from our operations. Return on equity improved markedly and was 13.8 (11.9) per cent. Our equity ratio has increased from 48.9 per cent to 51.1 per cent, meaning we are today less reliant on debt. TURNAROUND PROGRAMME Our Turnaround Programme, launched in 2013, is based on our cost saving strategy. We started with the basics, focused on constant downward pressure on costs and implemented innovative energy-saving technologies. The strategic focus was on improving our operational and financial position, investing in the environmental technology and the decision to own all our vessels. With the operational, organisational and financial optimisation we achieved our targets and ensured improvement in Finnlines financial performance regardless of development in the European economy or its business environment. As a result, we increased our operational leverage on multiple levels. By reducing costs and increasing competitiveness, we passed a substantial part of our efficiency gains onto our clients. Our mission is to focus on cost reductions, and on further optimising our operations to improve our efficiency further. The Finnlines Group s return on capital employed (ROCE) increased over the previous year to 8.7 (7.4) per cent. CAPITAL STRUCTURE The Group s capital structure is strong. Despite the significant investment programmes, the extraordinary result led to an improved cash flow compared to the previous year, which enabled us to markedly reduce the Group s debt. The interest-bearing debt decreased by EUR 32.9 million and amounted to EUR (491.1) million. Cash flow generated from operating activities was EUR (124.8) million. In 2017, capital expenditure totalled about EUR 48.9 million, compared with EUR 46.3 million in the previous year. The gearing improved to 68.9 (83.8) per cent and the Group s equity ratio increased slightly to 51.1 per cent compared to 48.9 per cent in the previous year. Finnlines solvency and liquidity remained, as in previous years, at an excellent level, which enabled us to implement the significant capital expenditure programme. Cash and deposits together with unused committed credit facilities amounted to EUR (130.5) million and net debt to EBITDA dropped to 2.8 at year-end, from the previous year s 3.5 level. NEW SHAREHOLDER STRUCTURE Finnlines is part of Italy s Grimaldi Group, which is a multinational integrated logistics company, specialising in the maritime transport of cars, rolling cargo, containers and passengers. Group-wide network synergies with the Grimaldi Group enable us to be the most efficient shipping company in the Baltic Sea. Moreover, Finnlines is also a Finnish company as it owns 21 vessels, of which 18 fly the Finnish flag and close to 70 per cent of the Group s sea personnel is working on these vessels. Also 70 per cent of the Group s approximately 1,600 employees are based in Finland. Tom Pippingsköld 6

9 The strong results we posted again are a proof that our strategy is paying off. Overall, 2017 was a strong year for Finnlines. EBITDA and Equity Ratio Interest-bearing Debt and Shareholders Equity Net Debt/ EBITDA Development Gearing EUR million % EUR million EUR million % % EBITDA Equity Ratio Interest-bearing debt, excluding leasing liabilities Shareholders equity Net debt Net debt/ebitda FINNLINES

10 8
11 BUSINESS CONCEPT, VALUES AND STRATEGIC GOALS BUSINESS CONCEPT Finnlines promotes international commerce by providing efficient, high-quality sea transport and port services, mainly to meet the requirements of the European industrial, commercial and transport sectors and private passengers. FINANCIAL GOALS Finnlines objective is to guarantee long-term profitability through high-quality operations, to generate added value for its shareholders and to maintain a healthy capital structure. The Board of Directors bases its annual dividend proposal on the Company s capital structure, future outlook, and investment and development needs. VALUES CUSTOMER FOCUS Our customers choose us thanks to our competence, expertise and reliability. Satisfied customers are the basis for Finnlines enduring success. By identifying its cargo customers and passengers needs, the Company can continuously develop its service products and generate concrete added value for its customers. RESPONSIBILITY We adhere to the principles of sustainable development. Environmental responsibility forms part of our Company s everyday operations. We take safety issues into consideration in all our operations. PROFITABILITY We achieve our objectives. Through the quality of our business operations, we are able to guarantee long-term profitability and generate added value. STRATEGIC GOALS A stronger position in the Baltic Sea and the North Sea cargo traffic We invest in the operational efficiency of our current transport areas. We will open new routes according to market opportunities. We are actively involved in the growing consolidation of the sector. We increase Group-wide network synergies beyond the core of today. A stronger position in the Baltic Sea passenger traffic We offer quick and effortless travel between Finland, Sweden and Germany to our passengers on our large and efficient ro-pax vessels. A stronger position in Russian freight traffic We are the leading shipping company in transit traffic. We actively develop and market direct transport routes between Central Europe and Russian Baltic ports. Growing profitability We strive to improve our productivity. One of the main ways of doing this is to focus on routes where the vessels capacity utilisation is as high as possible in both directions. We will increase the efficiency of our operational systems and information management. We take proper care of environmental and safety issues. We invest in staff competence. EMPLOYEE SATISFACTION Finnlines is a reliable and motivating employer, which treats its employees with fairness and equality, rewarding the merit. FINNLINES


12 BUSINESS ENVIRONMENT FLEET After the comprehensive project of installing exhaust gas scrubbers to the Finnlines fleet and other environmental measures, Finnlines launched a new investment programme of lengthening Breeze series vessels to respond to increased demand on the market. The contract to lengthen four of the six Breeze vessels, with an option of the last two, was signed in April, and the first vessel to be lengthened arrived at Remontowa Shiprepair Yard in September. MS Finntide was delivered, 30 metres longer, in November and she returned to service between West Finland and Germany. Each lengthened vessel will have a capacity increase of some 30 per cent or 1,000 lane metres. After having been chartered since June 2017, MS Finneagle was sold to the Grimaldi Group in October. The average age of the Group s vessels was about 13 years. ROUTE NETWORK During 2017, Finnlines retained its position as a leading ro-ro shipping company in the Baltic Sea area. Finnlines ro-ro services in the Baltic and North Sea areas provide a backbone to Finnish industries and trade s transportation needs. The services covered the Finnish ports of Uusikaupunki, Turku, Hanko, Helsinki and Kotka, offering connections with Russian, Estonian, Polish, German, Danish, British, Belgian and Spanish ports. The route network also enabled cargo flows between Continental and British ports and Russia, as well as offered the wide Grimaldi shortsea and deepsea network for Finnlines customers use. The high frequency ro-pax lines cover the services between Finland and Sweden (FinnLink), Finland and Germany (HansaLink) and Sweden and Germany (NordöLink). TransRussiaExpress had a weekly sailing from St. Petersburg to Lübeck and vice versa. 10


13 FINNLINES
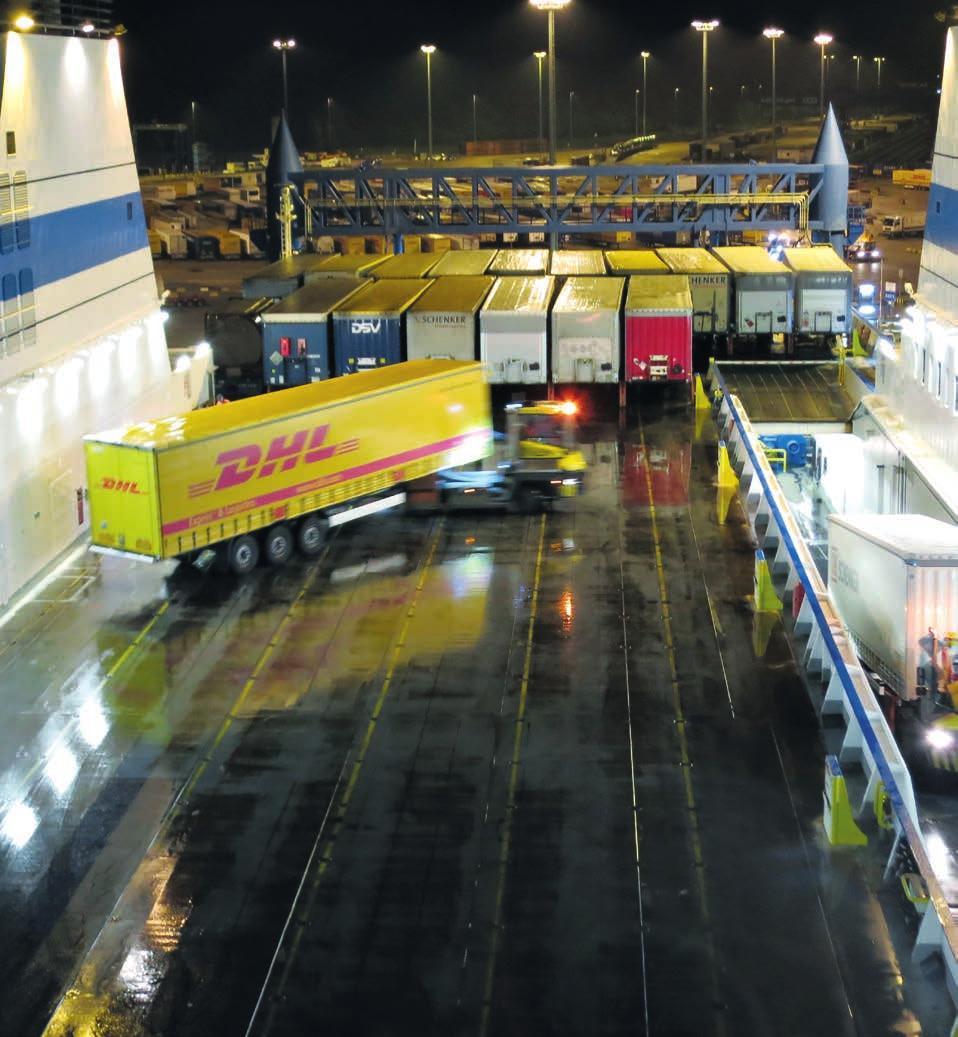
14 SHIPPING AND SEA TRANSPORT SERVICES Finnlines is one of the industry s leading players in the Baltic Sea, the North Sea and the Bay of Biscay. The strong position derives from the outstanding service which is based on the needs of our customers. High frequency, cargo capacity and information services offered by Finnlines contribute to flexibility, reliability and predictability to customers. Customers today need digitalised and individualised solutions and now they are able to pick the most suitable channel for them mobile application, extranet, or phone. In the autumn of 2016, Finnlines launched its first mobile application, Finnlines Cargo, to provide an ever more flexible and state-of-the-art service to its freight customers. The Shipping and Sea Transport Services segment s revenues totalled EUR (453.6 in 2016) million, and it employed 1,356 (1,372) people on average. During January December, the transports totalled about 709 (629) thousand cargo units, 147 (119) thousand cars (not including passengers cars) and 1,281 (1,611) thousand tons of nonunitised freight. In addition, some 619 (602) thousand private and commercial passengers were transported. The Finnish market was growing steadily but the sanctions on Russia still restrain the overall demand for sea transport services in the Baltic area. NORDÖLINK NordöLink runs a ro-pax service between Malmö and Travemünde. The three vessels, MS Finnpartner, MS Finntrader and MS Nordlink, made 19 weekly departures in both directions with an average intake capacity of about 110,000 lane metres per week. The non-freight passenger traffic s turnover continued its positive trend and improved by a further 8 per cent. FINNLINK FinnLink between Naantali and Kapellskär operated mainly with two Clipper class ro-pax vessels. These vessels served unitised cargo traffic with a total of 14 weekly departures in each direction. The fast eight-hour voyage and the service s schedule, tailored to the needs of freight customers, have maintained the competitiveness of the route. The calls at the port of Långnäs in the Åland Islands were continued throughout the year with dutyfree shopping onboard. THE BALTIC SEA AND NORTH SEA SERVICES Ro-ro services routes are ideally located for serving freight customers in the Baltic Sea and North Sea areas. Traffic was operated with some ten modern ro-ro vessels catering for lorries, trailers, other mobile cargo, containers and break bulk. HANSALINK HansaLink consisted of three Star class ro-pax vessels plying between Helsinki and Travemünde. HansaLink retained its strong position as the largest carrier for unitised cargo volumes between Germany and Finland. For passengers it was the only direct connection by sea between Finland and Continental Europe. The traffic was operated with seven weekly departures in both directions with a fast sailing time of less than 30 hours. TRANSRUSSIAEXPRESS TransRussiaExpress (TRE) runs a regular direct liner service between Germany and Russia (Lübeck St. Petersburg), offering one weekly departure in each direction. Throughout the year, the line operated with pure ro-ro vessels. The calls at the port of Kotka on the westbound leg continued throughout the year on a weekly basis. The slot charter agreement with DFDS, increasing the utilisation of the ship for the whole roundtrip, also continued for the whole year. INTERCARRIERS Intercarriers, in which Finnlines holds a 78.5 per cent stake, offered small-tonnage traffic services from ports in Lake Saimaa and some Russian inland ports to various parts of Europe. 12


15 FINNLINES

16 14
 grew by 3 per cent to 619 (602 in 2016) thousand passengers.")


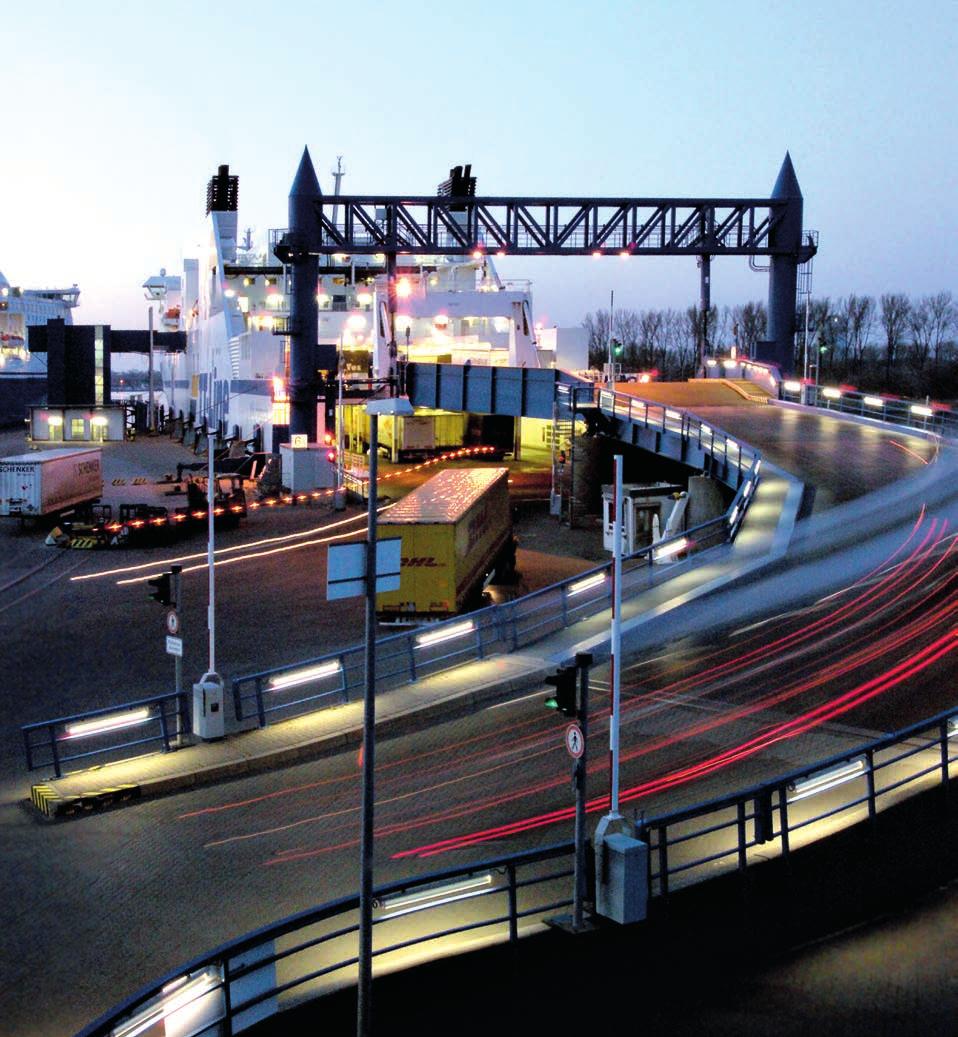
17 PASSENGER SERVICES With its nine ro-pax vessels, operating between six ports in three countries, Finnlines has established its position as an important provider of passenger services in the Baltic Sea. The total number of passengers transported on all routes (private and commercial) grew by 3 per cent to 619 (602 in 2016) thousand passengers. The number of private passengers increased on almost all routes, the strongest growth being on the Germany Sweden route with 10 per cent, followed by the Finland Germany with 8 per cent. Finland Sweden route declined by 2 per cent. After major refurbishment in the public areas on all vessels in 2016, the focus was now on further improvements in cabins and the customer service. Initiatives regarding web marketing and web channels were continued to respond to worldwide demand online, and sales initiatives were taken to also stimulate further market areas in addition to our core markets. The share of web bookings grew 12 per cent compared to the previous year. The onboard passenger concept on all lines is continuously being improved in close collaboration with the personnel onboard to maintain high customer satisfaction levels and experience. FINNLINES

 million and employed 295 (281) people on average.")
18 PORT OPERATIONS The Group s Port Operations are handled by Finnsteve companies (Finnsteve, Containersteve and FS-Terminals). Finnsteve companies are a major port operator focused on unitised cargo services required by regular liner traffic in the ports of Helsinki, Turku and Naantali. Helsinki is Finland s most important export and import port for unitised goods, while Turku and Naantali have the fastest sea connections to Sweden. In 2017, Finnlines Port Operations generated revenues of EUR 42.5 (38.4 in 2016) million and employed 295 (281) people on average. PORT OPERATIONS IN HELSINKI The Vuosaari Harbour, which was opened at the end of 2008, has proved to be an efficient world-class port with its modern and advanced infrastructure. The Company s four post-panamax container gantry cranes have sufficient capacity and power to cope easily with future growth in container volumes. The export terminals allow cargo handling in all weather conditions, while the import terminal in the logistics area has capacity for diversifying and increasing the provision of supplementary services. HELSINKI VOLUME DEVELOPMENT The overall cargo volumes handled by Finnsteve companies in the Vuosaari Harbour increased from the previous year. In 2017, the total cargo throughput in the port of Helsinki in- creased 14.2 per cent to a volume of 14.3 million tons, compared to the 2016 volumes. Unitised export traffic increased by 14.6 per cent to 6.4 million tons while import traffic increased by 10.1 per cent to 5.5 million tons. The volume of trailers and lorries increased by 9.2 per cent to 573,621 units. Container traffic increased by 8.8 per cent to 491,164 TEUs. PORT OPERATIONS IN TURKU AND NAANTALI The Company s operations covered the West Harbour, the Pansio Harbour, the Base Harbour and the port of Naantali. In 2017, the total cargo throughput in the port of Turku increased 3.0 per cent to 2.46 million tons in comparison to the volumes in Container export and import traffic decreased by 6.4 per cent to 2,153 TEUs, thus representing only a small part of the total cargo throughput. The volume of trailers and lorries increased by 0.8 per cent to 107,379 units in The Company s Naantali operations provided services to the Group s FinnLink traffic between Naantali, Långnäs and Kapellskär. 16

19 FINNLINES

20 18
21 SAFETY AND ENVIRONMENT A sustainable and socially responsible business model becomes more important year by year. Operating in ecologically sensitive areas, the objective of Finnlines safety and environmental policy is to provide safe, top-quality services while making efforts to minimise the environmental impacts in every aspect of operations. During the past few years Finnlines environmental programme has included the installation of exhaust gas scrubbers, investments in propulsion and reblading, and silicone anti-fouling. In 2017, Finnlines continued to invest in energy efficiency having decided to lengthen four ro-ro vessels. The capacity increase, which is around 30 per cent, will decrease the energy consumption per transported unit compared to the original vessel. SAFETY AND SECURITY Safety is one of the most important environmental aspects in shipping. The land-based ship management organisation and all the ships are certified in accordance with the ISM Code (International Management Code for the Safe Operation of Ships and for Pollution Prevention). All ships and port facilities also comply with the requirements of the ISPS Code (International Ship and Port Facility Security Code). The ships are regularly inspected and audited by the maritime administration, classification societies and by in-house auditors. To be prepared for safety and environmental risks, regular drills are held both internally and with authorities, such as the coast guard, border guard and local city rescue departments. In ports, stevedoring companies have safety systems, including communication and contingency plans in case of an accident. Ports are equipped to respond to fires and oil and chemical spills. ENVIRONMENTAL CERTIFICATION Finnlines environmental work focuses on vessels as they have a substantial effect on the environment. A certified environmental system under the ISO Code provides a tool to monitor and measure the impact of all environment-related operations and services. The system will also guarantee that the environmental performance unconditionally complies with relevant legislation and regulations. STAKEHOLDERS In environmental and safety matters, Finnlines most important stakeholders are the flag, port and host state administration, owners, customers, port operators and contractors, as well as the inhabitants of harbour and fairway areas. Finnlines is represented at the technical, safety and environmental committees under the Swedish and Finnish Shipowners Associations. LEGISLATION The International Maritime Organisation (IMO) manages international legislation on safety and environmental matters. The MARPOL 73/78 Convention contains regulations on the disposal of waste and sewage into the sea, and on the prevention of air emissions. The SOLAS Convention regulates maritime safety and security matters, including ship construction, life-saving arrangements and navigation. The Company s port operations comply with national legislation. ENERGY CONSUMPTION AND ATMOSPHERE EMISSIONS Finnlines operates mainly in the Emission Control Areas, i.e. the Baltic Sea, the North Sea and the English Channel, where the sulphur content limit for ship fuel oil is 0.10 per cent in accordance with the MARPOL Convention. The global sulphur fuel limit continues to be 3.5 per cent, but it will decrease to 0.5 per cent in To comply with the MARPOL Convention Finnlines has fitted a total of 20 ships with exhaust gas scrubbers. Ships which are not equipped with scrubbers run on ultra-low sulphur fuel oil. Since microorganisms, plants and algae tend to accumulate on submerged structures, increasing fuel consumption and air emissions, the bottom is brushed and cleaned at regular intervals. Anti-fouling is normally not used as Finnlines ships operate in ice conditions. On two ro-ro passenger ships, which operate in the Southern Baltic, the latest generation of silicone hull paints has been applied, which has generated substantial fuel savings. To reduce the carbon footprint from shipping and to create a benchmark system in Europe, the EU regulation on the monitoring, reporting and verification of CO 2 -emissions will become fully effective in Ship owners and operators will be required to report on fuel consumption for vessels larger than 5,000 GT. Another regulation to tackle greenhouse gas emissions from shipping has been adopted by the IMO. The Global Data >> FINNLINES
 starting 1 January 2021. The NOx limit applies to all vessels built after 2021.")


22 SAFETY AND ENVIRONMENT (CONTINUED) Collection System is part of the MARPOL Convention and the first monitoring period will start in The North Sea and the Baltic will constitute a NOx Emission Control Area (NECA) starting 1 January The NOx limit applies to all vessels built after Ships NOx emissions will reduce by 80 per cent compared with the present level. In 2017, Finnlines vessel traffic consumed 324,743 tons of heavy fuel oil and diesel oil, representing an increase of around 4.5 per cent compared with The increase is due to growing cargo volumes and distances sailed. Ballast Water Management Convention was introduced as early as 2004, but it did not enter into force until 8 September Exchange of ballast water has been mandatory after the entryinto-force date with the exception of the Baltic Sea, which does not meet the requirement of distance from shore or depth of water. Ships must be fitted with treatment equipment during a transitional period, however no later than 8 September Finnlines has investigated different technologies as low salinity, ice and high turbidity create extra challenges for the equipment in the Baltic Sea. WASTE AND SEWAGE Efforts have been made to minimise the amount of waste that is deposited in landfills. The main recyclable waste types generated on board include energy waste, bio waste, glass, paper, cardboard, wood, and metal. Hazardous waste, including oil waste, oily filters, paint, and electronic scrap, is separated and taken to a designated container in the port. MARPOL contains restrictions concerning black water, i.e. toilet water. Finnlines ro-pax vessels land black water to onshore municipal sewage systems whenever they are accessible. Tank vehicles are used where reception facilities are not provided. There are no restrictions on the discharge of grey water, i.e. water from kitchens and showers, but Finnlines ro-pax vessels pumps grey water to the shore-based sewage systems. Cargo ships are equipped with sewage treatment plants. BALLAST WATER MANAGEMENT Ballast water is used to trim and stabilise ships. However, ballast water may carry harmful aquatic species and out-compete native species, disrupting fragile marine ecosystems. The IMO OTHER ENVIRONMENTAL ASPECTS Oily waste water, bilge water, is generated in engine rooms. Bilge water is separated in separators and the remaining sludge is always taken ashore. The limit for the oil content of water that may be discharged into the sea is 15 ppm but many of our ships have more efficient separators. Some bilge water is also pumped ashore. ENVIRONMENTAL ASPECTS IN PORT OPERATIONS Being aware of their environmental impacts and responsibilities, Finnsteve companies follow the principles of sustainable development. The focus is on enhancing energy savings and on reducing air emissions and waste generation in processes, in storage operations and maintenance of machines and properties. Finnsteve companies hold a valid ISO environmental certificate and an ISO 9001 quality certificate. In 2017, the fuel consumption of the port operations totalled some 970 tons, which includes the operations in Helsinki, Turku and Naantali, an increase of nearly 20 per cent compared with


23 HUMAN RESOURCES SEA PERSONNEL Upgrading the skills of our sea personnel to meet the requirements of the STCW regulations continued, and training was also organised to enhance the competence regarding the new Ballast Water Management regulations, which came into force. The personnel were also provided training in safety at work, ECDIS, and numerous vocational training sessions were organised to support employees in rapidly changing situations in our environment and to implement new in-house processes. Utilisation of our extensive video training tool on our vessels continued and online training was introduced. The interest towards training has been excellent and our personnel have eagerly participated in many development projects. The long-term co-operation between shore and sea personnel was maintained by means of frequent contacts and ship visits. Wellbeing at work and work ability as essential success factors on a long-term basis were emphasised. Regarding the employer image and changing needs for competence of prospective seafarers, it was seen important to even increase the co-operation with Maritime Academies, Finnish Seamen s Apprentice programme and maritime students. The Company s investment programmes continued in These included the installation of exhaust gas scrubbers, the sale of one vessel and lengthening of the first of a total of four vessels with two options. Arrangements caused changes in vessels operating areas and manning but we are very pleased with the successful outcomes reached together with our truly committed and flexible personnel. STEVEDORE PERSONNEL In 2017, the dominant factors affecting our personnel s work were the increase in business volumes and the renewal of our IT-based production system. The increased workloads were handled by recruiting seven permanent stevedores and two mechanics to our repair shop. The production system renewal has been a very significant project. The first modules regarding the unitised cargo in Helsinki were launched in November. The project is still ongoing and new areas of our operations will be added to the new system in the near future. In addition, the renewal of our resource management system was also started and is making good progress. Safety and quality of the work as well as competence of our personnel was maintained and improved through vocational training arranged in-house. First aid courses were also provided. During the latter half of the year, training was focused on the use of our new production system. The importance of leadership and management skills was emphasised by providing training and workshops for the management team and supervisors. During the year, we continued our successful co-operation between the employees and their representatives focusing on managing wellbeing at work and work ability risks of our personnel. As a result, the statistics indicate again a decrease in our personnel s sick leaves and the number of work-related injuries has dropped dramatically. SHORE PERSONNEL As for the shore personnel, the focus in 2017 continued to be on developing the competence and leadership skills, which have been our focus for a few years. We believe that these efforts will continue to enhance our competitiveness and wellbeing at work in the future. For the shore personnel in Finland we were able to offer many opportunities for job rotation during Job rotation, job redesign and continuous improvement of working methods are important aspects in our competence development. We are pleased that our employees are motivated to take on new challenges. Other large projects, such as the lengthening project, dockings and several IT system developments and renewals had a significant impact on our everyday work. We are proud of the dedication and commitment of our employees in these changes. PERFORMANCE MANAGEMENT We continued to put emphasis on performance development. It is an integral part of the Company s incentive scheme and, >> FINNLINES
24 HUMAN RESOURCES (CONTINUED) from the point of view of our day-to-day operations, it has been implemented mostly through development of team cohesion, by concentrating on improving leadership skills, by ensuring good quality of recruitment processes and by supporting teams in adopting new practices. We also further harmonised the Group HR reporting with the Grimaldi Group s responsibility report. Our Group s revenue/average number of employees in 2017 was EUR 325 (287 in 2016) thousand. EBIT/average number of employees was EUR 57 (49) thousand. PERSONNEL CHANGES The Group employed an average of 1,651 (1,653) persons during the reporting period, consisting of 944 (957) persons at sea and 707 (696) persons on shore. The number of persons employed at the end of the period was 1,570 (1,627) in total, of which 886 (934) at sea and 684 (693) on shore. The personnel expenses (including social security costs) for the reporting period were EUR 89.5 (89.8) million. Key figures Average number of employees 1,651 1,653 Revenue/employee, EUR 324, ,538 Personnel expenses/employee, EUR 54,167 54,290 Result before taxes/employee, EUR 49,961 40,504 Employee turnover, % Average absence of personnel, day/employee Training days, total 1,468 2,464 Average number of employees per business area Shore-based personnel Shipping and Sea Transport Services Port Operations Sea personnel Group, total 1,651 1,653 On 31 December 2017, the shorebased personnel amounted to 684 and sea personnel to 886 in total 1,570. On 31 December 2016, the shorebased personnel amounted to 693 and sea personnel to 934, in total 1,627. Employee categories 2017, % 13% Personnel by country 2017, % 6% 2% 57% 30% 22% 70% Shore-based personnel excl. stevedores and foremen Sea personnel Stevedores and foremen Finland Sweden Germany Other Gender distribution as of 31 December 2017, % 50% 50% Shipping Female 6% 94% Port personnel Male 19% 81% Sea personnel Breakdown by age as of 31 December 2017, % 12% years 22% years 26% years 30% years 10% 60 years Average length of employment as of 31 December 2017, years Shipping 18.1 Port personnel Permanent employment Temporary employment Sea personnel

25 FINANCIAL STATEMENTS 2017 FINNLINES
26 BOARD OF DIRECTORS REPORT FINNLINES BUSINESS Finnlines is the largest shipping company in the Baltic Sea based on both ro-ro and ro-pax volumes (source: Baltic Transportation Journal). The Company's passenger-freight vessels offer services from Finland to Germany and via the Åland Islands to Sweden, as well as from Sweden to Germany. Finnlines ro-ro vessels operate in the Baltic Sea and the North Sea. The Company has subsidiaries in Germany, Belgium, Great Britain, Sweden, Denmark and Poland, which all are also sales offices. In addition to sea transportation, the Company provides port services in Helsinki and Turku. GROUP STRUCTURE Finnlines Plc is a Finnish public limited company, which operates under Finnish jurisdiction and legislation. At the end of the reporting period, the Group consisted of the parent company and 20 subsidiaries. Finnlines is part of the Italian Grimaldi Group, which is a global logistics group specialising in maritime transport of cars, rolling cargo, containers and passengers. The Grimaldi Group comprises seven shipping companies, including Finnlines, Atlantic Container Line (ACL), Malta Motorways of the Sea (MMS) and Minoan Lines. With an owned fleet of about 120 vessels, the Group provides maritime transport services for rolling cargo and containers between Northern Europe, the Mediterranean, the Baltic Sea, West Africa, North and South America. It also offers passenger services within the Mediterranean and the Baltic Sea. On 25 August 2016, Grimaldi Group S.p.A. gained title to all the shares in Finnlines Plc and the shares were thus delisted. GENERAL MARKET DEVELOPMENT Based on the statistics by the Finnish Transport Agency for January December, the Finnish seaborne imports carried in container, lorry and trailer units increased by 5 per cent whereas exports increased by 10 per cent (measured in tons) compared to the same period in Private and commercial passenger traffic between Finland and Sweden remained at the same level as in the previous year whereas the corresponding traffic between Finland and Germany increased by 7 per cent (Finnish Transport Agency) FINNLINES TRAFFIC At the beginning of 2017, the frequency of the Hanko Rostock service was upgraded to four weekly sailings, which considerably improved the sea connection between Finland and Germany. Two modern and environmentally friendly ro-ro vessels were put into service on the route. At the beginning of January, MS Finnfellow returned to the FinnLink service after the installation of an exhaust gas scrubber. MS Finneagle went for a similar installation at the end of March whereafter she was chartered out to the Grimaldi Group until mid-september. In October, she was sold to the Grimaldi Group. MS Finnmaster was chartered out for six months at the beginning of Additionally, MS Finnclipper was chartered out for one month as from the middle of January. Starting from April 2017, HansaLink s Star class vessels began to operate between Helsinki and Travemünde on a daily basis, which ensured sufficient capacity for both freight customers and passengers. At the end of September, MS Finntide arrived in Remontowa Shiprepair Yard in Gdansk, Poland for conversion. As planned, the vessel was lengthened by 30 metres, which increased the capacity by around 1,000 additional lane metres. MS Finntide returned to the normal operation on the Uusikaupunki/Turku Travemünde route at the end of November. At the same time, the second vessel, MS Finnwave, went for lengthening. During the reporting period, Finnlines operated on average 20 (21) vessels in its own traffic. The cargo volumes transported during January December totalled approximately 709 (629 in 2016) thousand cargo units, 147 (119) thousand cars (not including passengers cars) and 1,281 (1,611) thousand tons of freight not possible to measure in units. In addition, some 619 (602) thousand private and commercial passengers were transported. FINANCIAL RESULTS The Finnlines Group recorded revenue totalling EUR (473.7) million in 2017, an increase of 13.2 per cent compared to the same period in the previous year. Shipping and Sea Transport Services generated revenue amounting to EUR (453.6) million and Port Operations EUR 42.5 (38.4) million. The Shipping and Sea Transport Services segment's revenue grew in most trades due to larger cargo volumes. The bunker price level was also higher than in the previous year and, therefore, bunker surcharges increased the turnover in In Port Operations, the revenue continued to rise due to increased external and internal cargo handling activities. The internal revenue between the segments was EUR 22.2 (18.2) million. Result before interest, taxes, depreciation and amortisation (EBITDA) was EUR (139.1) million, an increase of 9.5 per cent. Result before interest and taxes (EBIT) was EUR 94.0 (81.5) million. During 2017, Finnlines continued its strategy to optimise the traffic, which had a positive impact on the profitability. The result includes the gain on sale of EUR 0.7 million for MS Finneagle, whereas the 2016 result included the gain on sale of EUR 4.4 million for MS Finnsailor. As a result of the improved financial position, net financial 24
27 expenses decreased to EUR (-14.6) million. Financial income was EUR 0.3 (0.4) million and financial expenses EUR (-15.0) million. Result before taxes (EBT) improved by EUR 15.5 million and was EUR 82.5 (67.0) million. The result for the reporting period was EUR 82.7 (68.1) million. The most important business and share related key indicators are presented in the Five-Year Key Figures on page 35. STATEMENT OF FINANCIAL POSITION, FINANCING AND CASH-FLOW Even though the Company completed its Environmental Technology Investment Programme and launched a new Energy Efficiency and Emission Reduction Investment Programme, interest-bearing debt decreased by EUR 32.9 million to EUR (491.1) million, excluding leasing liabilities of EUR 2.4 (3.7) million. The equity ratio calculated from the balance sheet improved to 51.1 (48.9) per cent and gearing dropped to 68.9 (83.8) per cent. Due to the expired charter agreements, there were no vessel lease commitments at the end of 2017 nor The Group s liquidity position is strong and at the end of the period, cash and cash equivalents together with unused committed credit facilities amounted to EUR (130.5) million. Net cash generated from operating activities remained strong and was EUR (124.8) million. CAPITAL EXPENDITURE The Finnlines Group s gross capital expenditure in the reporting period totalled EUR 48.9 (46.3) million, including tangible and intangible assets. Total depreciation and amortisation amounted to EUR 58.4 (57.6) million. The investments consist of normal replacement expenditure of fixed assets, scrubber and reblading projects, lengthening of ro-ro vessels and dry-dockings. Finnlines EUR 100 million Environmental Technology Investment Programme, which covered scrubber orders and energy efficiency investments, was initiated in 2014 and concluded in The investment programme consisted of scrubber installations on board 20 vessels, propulsion upgrades for 9 vessels and special paint application on 2 vessels. Finnlines launched a new capex programme, the Energy Efficiency and Emission Reduction Investment Programme, in spring As the main part of the programme, Finnlines will lengthen four of its Breeze series vessels, with an option for two additional vessels. The close to 30 per cent capacity increase will considerably reduce the energy consumption per transported unit compared to the original vessel and thus contribute more to reducing emissions. The new Energy Efficiency and Emission Reduction Investment Programme is proceeding as planned and the first vessel that was converted, MS Finntide, was redelivered on 23 November 2017 and joined the Uusikaupunki/Turku Travemünde service. The second vessel to undergo the lengthening, MS Finnwave, arrived in Remontowa Shiprepair Yard in Gdansk, Poland on 28 November 2017 and is expected to return to service around the end of January The above investment programme will amount to approximately EUR 70 million if executed in full. Following a strategy to optimise the use of Finnlines vessels and routes in order to improve its profitability, Finnlines Plc sold the ro-pax vessel MS Finneagle to the Grimaldi Group in October A month later, in November 2017, Rederi Aktiebolaget Nordö-Link, a fully-owned subsidiary of Finnlines Plc, entered into a Memorandum of Agreement for the acquisition of the ropax vessel MS Europalink from the Grimaldi Group. The vessel is expected to join the Finnlines traffic during the first quarter of This will significantly increase the cargo-carrying capacity of Finnlines ro-pax network, with Europalink having a total lane length of 4,215 m compared to Finneagle s total lane length of 2,459 m. PERSONNEL The Group employed an average of 1,651 (1,653) persons during the reporting period, consisting of 944 (957) persons at sea and 707 (696) persons on shore. The number of persons employed at the end of the period was 1,570 (1,627) in total, of which 886 (934) at sea and 684 (693) on shore. The personnel expenses (including social costs) for the reporting period were EUR 89.5 (89.8) million. RESEARCH AND DEVELOPMENT The aim of Finnlines research and development work is to find and introduce new practical models and operating methods, which enable the Company to meet customer requirements in a more sustainable and cost-efficient way. In 2017, the focus continued to be on environmental investments in vessels and on improving their energy efficiency. In 2017, the Environmental Technology Investment Programme including the installation of exhaust gas scrubbers on board 20 vessels, was completed. The study on lengthening a ro-ro vessel series by 30 metres led to an order, and four vessels of the Breeze series are lengthened in The first ship arrived at Remontowa Shiprepair Yard for lengthening at the end of September 2017 and the second one in November The agreed conversions will be completed in spring The objective of lengthening vessels is to enabe profitable growth through increased transport capacity and improved energy efficiency while using bigger transport units also saw the continuation of harmonisation of the information systems in various services within the Finnlines Group and in the framework of the entire Grimaldi Group network. At the end of 2017, the Finnsteve companies introduced a new op- >> FINNLINES
28 BOARD OF DIRECTORS REPORT (CONTINUED) erative ERP system in ports. Improving the features of the system and implementing and introducing new functionalities will continue during At the end of 2017, the first stage of implementing the monitoring and ERP system of the operative vessel traffic was completed. Adding new features to the system will continue during THE FINNLINES SHARE The Company s paid-up and registered share capital on 31 December 2017 totalled EUR 103,006,282. The capital stock consisted of 51,503,141 shares. On 25 August 2016, Grimaldi Group gained title to all the shares in Finnlines Plc and the shares were thus delisted from the official list of Nasdaq Helsinki Oy. The shares and shareholders are dealt with in more detail in the Notes to the Consolidated Financial Statements, in Note 37. Shares and shareholders. DECISIONS TAKEN BY THE ANNUAL GENERAL MEETING Finnlines Plc s Annual General Meeting was held in Helsinki on 16 May The Annual General Meeting of Finnlines Plc approved the Financial Statements and discharged the members of the Board of Directors and President and CEO from liability for the financial year The Annual General Meeting authorised the Board of Directors to decide, at its discretion, on payment of dividend up to Finnlines Plc s result for the reporting period in The meeting decided that the number of Board Members be seven. The meeting re-elected the current board members Christer Backman, Tiina Bäckman, Emanuele Grimaldi, Gian Luca Grimaldi, Diego Pacella, and Jon-Aksel Torgersen and elected Guido Grimaldi as a new member of the Board of Directors for the term until the close of the Annual General Meeting in The yearly compensation to the Board will remain unchanged as follows: EUR 50,000 for the Chairman, EUR 40,000 for the Vice Chairman, and EUR 30,000 for each of the other members of the Board. The Annual General Meeting elected KPMG Oy Ab as the Company's auditor for the fiscal year It was decided that the external auditors will be reimbursed according to invoice. RISKS AND RISK MANAGEMENT Finnlines is exposed to business risks that arise from the capacity of the fleet existing in the market, counterparties, prospects for export and import of goods, and changes in the operating environment. The risk of overcapacity is reduced through scrapping of aging vessels, on the one hand, and the more stringent Sulphur Directive requirements, on the other. Finnlines operates mainly in the Emissions Control Areas where the emission limits are stricter than globally. The sulphur content limit for heavy fuel oil was reduced to 0.10 per cent as from 1 January 2015 in accordance with the MARPOL Convention. This has increased costs of sea transportation. However, with one of the youngest and largest fleets in Northern Europe and with investments in engine systems and energy efficiency, Finnlines is in a strong position to greatly mitigate this risk. The effect of fluctuations in the foreign trade is reduced by the fact that the Company operates in several geographical areas. This means that slow growth in one country is compensated by faster recovery in another. Finnlines continuously monitors the solidity and payment schedules of its customers and suppliers. Currently, there are no indications of imminent risks related to counterparties but the Company continues to monitor the financial position of its counterparties. Finnlines holds adequate credit lines to maintain liquidity in the current business environment. More detailed information on Finnlines financial risks and risk management can be found in the Notes to the Consolidated Financial Statements, in Note 33. Financial Risk Management. The risk management procedures of the Company are presented in more detail on the Company s website under Corporate Governance. LEGAL PROCEEDINGS The District Court of Helsinki rendered in February 2015 its decision on the dispute between Finnlines Plc and the State of Finland. According to Finnlines Plc, the Finnish Act on Fairway Dues in force until 1 January 2006 contained provisions which, according to EU law, were discriminatory. The Company has been charged excessive fairway dues during In its decision, the District Court of Helsinki ordered the State of Finland to refund to Finnlines Plc, as plaintiffs, the fairway dues, charged in excessive extent in totalling about EUR 17.0 million, including interest. The Finnish State appealed to the Helsinki Court of Appeal. The Court of Appeal rendered its decision in August 2016 by dismissing the judgment rendered by the District Court of Helsinki. The Court of Appeal considers that the claims of Finnlines have expired. The Supreme Court, in its decision made in February 2018, did not grant Finnlines Plc leave to appeal the judgment of the Court of Appeal. Thus, the judgment of the Court of Appeal is final. Finnlines will analyse the decision of the Supreme Court for possible further actions. The Company has summoned OMB Ostsee Mineralöl-Bunker GmbH ( OMB ) Rostock, Germany, to the District Court and claimed compensation for the damage occurred to the Company from the difference between the price paid for the supplied fuel and the market price, totalling EUR 2.76 million. The Company 26
29 bases its claim for compensation on the fact that OMB has abused its dominant position in the relevant market and the Company was forced to buy fuel from OMB, with OMB being the sole supplier. In its decision the District Court of Rostock dismissed the Company's claims in full. The Company has appealed to the Court of Appeal against the District Court s decision. The case at the Court of Appeal is pending. The Company s port operations subsidiaries have received a summons from 18 former employees. All employees claim for compensation based on groundless termination of their employment contracts and compensation according to the Non- Discrimination Act. The total amount of the claims is EUR 2.2 million. The subsidiaries consider the claims to be groundless. The District Court of Helsinki issued a decision in March The District Court dismissed the claims of the employees in their entirety. The employees have appealed to the Court of Appeal. The cases at the Appeal Court are pending. TONNAGE TAXATION Finnlines Plc entered into the Finnish tonnage taxation regime as from 1 January In tonnage taxation, the shipping operations transferred from taxation of business income to tonnagebased taxation. Finnlines Deutschland GmbH exited from the German tonnage tax scheme and transferred to business taxation on 1 February the port operations totalled some 970 tons, which includes the operations in Helsinki, Turku and Naantali. This is an increase of nearly 20 per cent compared with 2016 stemming from increased cargo volumes. SUSTAINABILITY REPORTING Finnlines sustainability reporting includes, in addition to financial figures, key indicators related to the employees and the environment. Finnlines sustainability reporting is part of the Grimaldi Group s Sustainability Report which is available on the Grimaldi Group s website: www. grimaldi.napoli.it. CORPORATE GOVERNANCE The Corporate Governance Statement can be reviewed on the Company s website: EVENTS AFTER THE REPORTING PERIOD MS Europalink was purchased from the Grimaldi Group in January The Supreme Court of Finland did not grant Finnlines leave to appeal on the fairway dues dispute between Finnlines and the Finnish State on 9 February As a result, the Helsinki Court of Appeal s decision of 8 August 2016 remains final. Otherwise there have been no significant events to report after the reporting period. ENVIRONMENT AND SAFETY Operating in ecologically sensitive areas, the objective of Finnlines safety and environmental policy is to provide safe, topquality services while making efforts to minimise the environmental impacts in every aspect of operations. During the past few years Finnlines environmental programme has included the installation of exhaust gas scrubbers, investments in propulsion and reblading, and silicone anti-fouling. In 2017, Finnlines continued to invest in energy efficiency having decided to lengthen four ro-ro vessels. The capacity increase, which is around 30 per cent, will decrease the energy consumption per transported unit compared to the original vessel. The IMO Ballast Water Management Convention became effective on 8 September 2017, which means that ships must be fitted with treatment equipment during a transitional period. Furthermore, exchange of ballast water has been mandatory after the entry-into-force date with the exception of ships operating solely within the Baltic Sea. Finnlines has investigated different technologies but has not yet placed any equipment orders. In 2017, Finnlines vessel traffic consumed 324,743 tons of heavy fuel oil and diesel oil, representing an increase of 4.5 per cent compared with The increase is due to growing cargo volumes and distances sailed. In 2017, the fuel consumption of OUTLOOK AND OPERATING ENVIRONMENT Looking to 2018, when Finland s economy is growing and this growth trend is likely to continue, this will affect our Company favourably. The investments we have made and the investments which are ongoing will further improve our efficiency and financial performance. Therefore, the Finnlines Group s result before taxes is expected to improve over the previous year s level. DIVIDEND DISTRIBUTION PROPOSAL The parent company Finnlines Plc s result for the reporting period was EUR 59.4 million. The distributable funds included in the parent company s shareholders equity equals to EUR million at the end of the reporting period. The Board of Directors proposes to the Annual General Meeting that a dividend of EUR 1.00 per share be paid out resulting in a total amount of proposed dividends of EUR 51,503,141. According to the consolidated statement of financial position, the equity attributable to parent company shareholders equals EUR (587.9) million at the end of the reporting period. Naples, 27 February 2018 Finnlines Plc, The Board of Directors FINNLINES
30 CONSOLIDATED STATEMENT OF COMPREHENSIVE INCOME, IFRS EUR 1,000 1 Jan 31 Dec Jan 31 Dec 2016 Revenue 536, ,711 Other income from operations 2,633 6,652 Materials and services -163, ,486 Personnel expenses -89,451-89,753 Depreciation, amortisation and impairment losses -58,368-57,587 Other operating expenses -133, ,009 Total operating expenses -444, ,835 Result before interest and taxes (EBIT) 94,017 81,528 Financial income Financial expense -11,769-14,978 Result before taxes (EBT) 82,506 66,961 Income taxes 235 1,162 Result for the reporting period 82,741 68,124 Other comprehensive income: Other comprehensive income to be reclassified to profit and loss in subsequent periods: Exchange differences on translating foreign operations Tax effect, net 0 Other comprehensive income to be reclassified to profit and loss in subsequent periods, total Other comprehensive income to be reclassified to profit and loss in subsequent periods, total Remeasurement of defined benefit plans Tax effect, net Other comprehensive income not being reclassified to profit and loss in subsequent periods, total 24-8 Total comprehensive income for the reporting period 82,753 68,046 Result for the reporting period attributable to: Parent company shareholders 82,748 68,133 Non-controlling interests ,741 68,124 Total comprehensive income for the reporting period attributable to: Parent company shareholders 82,760 68,056 Non-controlling interests ,753 68,046 Result for the reporting period attributable to parent company shareholders calculated as earnings per share (EUR/share) Undiluted / diluted earnings per share Most of the items recognised in the Consolidated Statement of Comprehensive Income fall under the tonnage tax scheme. This page is an extract of the audited Financial Statements. The complete audited Financial Statements of the Group and the parent company are available at The extracts of the audited Financial Statements presented in the Annual Report should be viewed together with the complete and audited Financial Statements. 28
31 CONSOLIDATED STATEMENT OF FINANCIAL POSITION, IFRS EUR 1, Dec Dec 2016 ASSETS Non-current assets Property, plant and equipment 929, ,629 Goodwill 105, ,644 Other intangible assets 3,516 3,529 Other financial assets 4,579 4,580 Receivables 1,642 1,720 Deferred tax assets 4,504 5,646 1,049,037 1,103,747 Current assets Inventories 6,340 6,700 Accounts receivable and other receivables 98,424 77,749 Income tax receivables Cash and cash equivalents 36,965 1, ,772 86,551 Non-current assets held for sale 15,121 15,121 Total assets 1,205,930 1,205,419 EQUITY Equity attributable to parent company shareholders Share capital 103, ,006 Share premium account 24,525 24,525 Translation differences Fund for invested unrestricted equity 40,016 40,016 Retained earnings 447, , , ,923 Non-controlling interests Total equity 615, ,100 LIABILITIES Long-term liabilities Deferred tax liabilities 49,851 51,425 Other long-term liabilities Pension liabilities 3,622 3,817 Provisions 1,730 1,757 Loans from financial institutions 292, , , ,663 Current liabilities Accounts payable and other liabilities 74,670 65,174 Current tax liabilities 13 9 Provisions Loans from financial institutions 167, , , ,415 Total liabilities 590, ,078 Liabilities related to long-term assets held for sale 241 Total shareholders equity and liabilities 1,205,930 1,205,419 This page is an extract of the audited Financial Statements. The complete audited Financial Statements of the Group and the parent company are available at The extracts of the audited Financial Statements presented in the Annual Report should be viewed together with the complete and audited Financial Statements. FINNLINES
32 CONSOLIDATED STATEMENT OF CHANGES IN EQUITY, IFRS EUR 1,000 Share capital Equity attributable to parent company shareholders Share issue premium Translation differences Fund for invested unrestricted equity Retained earnings Total Noncontrolling interests Reported equity 1 January ,006 24, , , , ,363 Comprehensive income for the reporting period: Result for the reporting period 68,133 68, ,124 Exchange differences on translating foreign operations Remeasurement of defined benefit plans Tax effect, net Total comprehensive income for the reporting period ,129 68, ,046 Dividend -41,203-41, ,309 Equity 31 December ,006 24, , , , ,100 Total equity EUR 1,000 Share capital Equity attributable to parent company shareholders Share issue premium Translation differences Fund for invested unrestricted equity Retained earnings Total Noncontrolling interests Reported equity 1 January ,006 24, , , , ,100 Comprehensive income for the reporting period: Result for the reporting period 82,748 82, ,741 Exchange differences on translating foreign operations Remeasurement of defined benefit plans Tax effect, net Total comprehensive income for the reporting period ,771 82, ,753 Dividend -55,623-55, ,666 Equity 31 December ,006 24, , , , ,187 Total equity This page is an extract of the audited Financial Statements. The complete audited Financial Statements of the Group and the parent company are available at The extracts of the audited Financial Statements presented in the Annual Report should be viewed together with the complete and audited Financial Statements. 30
33 CONSOLIDATED STATEMENT OF CASH FLOWS, IFRS EUR 1,000 1 Jan 31 Dec Jan 31 Dec 2016 Cash flows from operating activities Result for reporting period 82,741 68,124 Adjustments: Non-cash transactions 56,482 52,461 Unrealised foreign exchange gains (-) / losses (+) 1-11 Financial income and expenses 11,509 14,577 Taxes ,162 Changes in working capital: Change in accounts receivable and other receivables -20,792 1,565 Change in inventories 360-2,367 Change in accounts payable and other liabilities 4,418 6,471 Change in provisions Interest paid -8,434-11,394 Interest received Taxes paid Other financing items -3,336-3,842 Net cash generated from operating activities 122, ,845 Cash flows from investing activities Investments in tangible and intangible assets * -43,547-38,450 Sale of tangible assets ** 45,881 8,810 Proceeds from sale of investments -5 Dividends received 2 13 Net cash used in investing activities 2,335-29,632 Cash flows from financing activities Loan withdrawals 151, ,000 Net increase (+) / decrease (-) in current interest-bearing liabilities 6,580 8,035 Repayment of loans -191, ,662 Loans granted Increase / decrease in non-current receivables Dividends paid -55,623-41,309 Net cash used in financing activities -89,786-99,736 Change in cash and cash equivalents 35,020-4,523 Cash and cash equivalents 1 January 1,943 6,468 Effect of foreign exchange rate changes 3-3 Cash and cash equivalents 31 December 36,965 1,943 * Investments include environmental aid granted by the European Union, of which the Group received EUR 6.7 million during the reporting period The corresponding aid was not received in ** Includes sale of one vessel in both 2017 and This page is an extract of the audited Financial Statements. The complete audited Financial Statements of the Group and the parent company are available at The extracts of the audited Financial Statements presented in the Annual Report should be viewed together with the complete and audited Financial Statements. FINNLINES
34 PROFIT AND LOSS ACCOUNT, PARENT COMPANY, FAS EUR 1 Jan 31 Dec Jan 31 Dec 2016 Revenue 424,462, ,578, Other income from operations 7,182, ,975, Materials and services -157,027, ,963, Personnel expenses -43,798, ,630, Depreciation, amortisation and other write-offs -31,055, ,971, Other operating expenses -121,409, ,190, Operating profit 78,354, ,798, Financial income and expenses -7,359, ,231, Result before appropriations and taxes 70,995, ,566, Appropriations Group contributions -3,100, ,410, Replacement reserve change -15,856, Profit before tax 52,039, ,156, Other income taxes Tonnage tax -91, , Deferred taxes 7,424, ,943, Result for the reporting period 59,371, ,017, This page is an extract of the audited Financial Statements. The complete audited Financial Statements of the Group and the parent company are available at The extracts of the audited Financial Statements presented in the Annual Report should be viewed together with the complete and audited Financial Statements. 32
35 BALANCE SHEET, PARENT COMPANY, FAS EUR 31 Dec Dec 2016 ASSETS Non-current assets Intangible assets 2,163, ,560, Tangible assets 619,941, ,143, Investments Shares in group companies 153,480, ,480, Other investments 4,611, ,611, Total non-current assets 780,195, ,794, Current assets Inventories 5,303, ,629, Long-term receivables 149,981, ,424, Short-term receivables 105,860, ,367, Bank and cash 35,549, , Total current assets 296,694, ,025, Total assets 1,076,890, ,080,820, SHAREHOLDERS EQUITY AND LIABILITIES Shareholders equity Share capital 103,006, ,006, Share premium account 24,525, ,525, Unrestricted equity reserve 40,882, ,882, Retained earnings 271,069, ,675, Result for the reporting period 59,371, ,017, Total shareholders equity 498,855, ,107, Statutory provisions Pension obligation 784, , Voluntary provisions Replacement reserve 15,856, Liabilities Long-term liabilities Deferred tax liability 23,227, ,480, Interest-bearing 280,914, ,525, ,142, ,006, Current liabilities Interest-bearing 201,136, ,539, Interest-free 56,115, ,448, ,252, ,987, Total liabilities 561,395, ,994, Total shareholders equity and liabilities 1,076,890, ,080,820, This page is an extract of the audited Financial Statements. The complete audited Financial Statements of the Group and the parent company are available at The extracts of the audited Financial Statements presented in the Annual Report should be viewed together with the complete and audited Financial Statements. FINNLINES
36 CASH FLOW STATEMENT, PARENT COMPANY, FAS EUR 1 Jan 31 Dec Jan 31 Dec 2016 Cash flows from operating activities Result for the reporting period 59,371, ,017, Adjustments for: Depreciation, amortisation & impairment loss 31,055, ,971, Gains (-) and Losses (+) of disposals of fixed assets and other non-current assets -4,457, , Financial income and expenses 7,359, ,231, Income taxes -7,332, ,861, Other adjustments 18,956, ,410, ,952, ,145, Changes in working capital: Change in inventories, addition (-) and decrease (+) 325, ,076, Change in accounts receivable, addition (-) and decrease (+) -23,400, ,185, Change in accounts payable, addition (+) and decrease (-) 1,822, ,340, Change in provisions 65, , ,765, ,696, Interest paid -8,149, ,493, Dividends received 6,157, ,387, Interest received 3,735, ,076, Other financing items -3,039, ,321, Income taxes paid -98, , ,393, ,558, Net cash generated from operating activities 82,371, ,255, Cash flows from investing activities Investments in tangible and intangible assets -26,569, ,339, Proceeds from sale of tangible and intangible assets 45,708, , Investments in other shares , Change in internal loans (net) 18,171, ,502, Net cash used in investing activities 37,309, ,514, Net cash before financing activities 119,681, ,740, Cash flows from financing activities Proceeds from short-term borrowings 4,259, ,717, Repayment of short-term borrowings -5,862, Proceeds of long-term borrowings 151,000, ,000, Repayment of long-term borrowings -175,410, ,210, Dividends paid -55,623, ,202, Group contributions -3,100, ,410, Net cash used in financing activities -84,736, ,105, Change in cash and cash equivalents 34,944, ,365, Cash and cash equivalents on 1 January 604, ,969, Cash and cash equivalents on 31 December 35,549, , This page is an extract of the audited Financial Statements. The complete audited Financial Statements of the Group and the parent company are available at The extracts of the audited Financial Statements presented in the Annual Report should be viewed together with the complete and audited Financial Statements. 34
37 FIVE-YEAR KEY FIGURES EUR million IFRS IFRS IFRS IFRS IFRS Revenue Other income from operations Result before interest, taxes, depreciation and amortisation (EBITDA) % of revenue Result before interest and taxes (EBIT) % of revenue Associated companies Result before taxes (EBT) % of revenue Result for reporting period, continuing operations % of revenue Result for reporting period, discontinuing operations Result for reporting period % of revenue Total investments * % of revenue Return on equity (ROE), % Return on investment (ROI), % Assets total 1, , , , ,298.5 Equity ratio, % Gearing, % Average no. of employees 1,651 1,653 1,597 1,701 1, IFRS IFRS IFRS IFRS IFRS Earnings per share (EPS), EUR Earnings per share (EPS) less warrant dilution, EUR Shareholders equity per share, EUR Payout ratio, % n/a n/a Effective dividend yield, % n/a n/a Price/earnings ratio (P/E) n/a n/a Adjusted average number of outstanding shares (1,000) 51,503 51,503 51,503 51,503 49,782 Adjusted number of outstanding shares 31 Dec (1,000) 51,503 51,503 51,503 51,503 51,503 Number of outstanding shares at year-end (1,000) 51,503 51,503 51,503 51,503 51,503 * Includes continuing and discontinuing operations. Calculation of key ratios is presented on page 36. This page is an extract of the audited Financial Statements. The complete audited Financial Statements of the Group and the parent company are available at The extracts of the audited Financial Statements presented in the Annual Report should be viewed together with the complete and audited Financial Statements. FINNLINES
38 CALCULATION OF KEY RATIOS, IFRS Earnings per share (EPS), EUR = Result attributable to parent company shareholders Weighted average number of outstanding shares Shareholders equity per share, EUR = Shareholders equity attributable to parent company shareholders Undiluted number of shares at the end of period Payout ratio, % = Dividend paid for the year Result before tax +/ non-controlling interests of Group result +/ change in deferred tax liabilities taxes for the period x 100 Effective dividend yield, % = Dividend per share Share price on stock exchange at the end of period x 100 P/E ratio = Share price on stock exchange at the end of period Earnings per share Return on equity (ROE), % = Result for the reporting period Total equity (average) x 100 Return on investment (ROI), % = Result before tax + interest expense + other liability expenses Assets total interest-free liabilities (average) x 100 Gearing, % = Interest-bearing liabilities cash and bank equivalents Total equity x 100 Equity ratio, % = Total equity Assets total received advances x 100 The recognised income taxes are based on the year s estimated average income tax rate which is expected to realise during the entire reporting period. Finnlines Plc s Shipping and Sea Transport Services transferred to tonnage-based taxation in January This page is an extract of the audited Financial Statements. The complete audited Financial Statements of the Group and the parent company are available at The extracts of the audited Financial Statements presented in the Annual Report should be viewed together with the complete and audited Financial Statements. 36
39 QUARTERLY DATA, IFRS EUR million Q1/2017 Q1/2016 Q2/2017 Q2/2016 Q3/2017 Q3/2016 Q4/2017 Q4/2016 Revenue by segment Shipping and Sea Transport Services total Sales to third parties Sales to Port Operations Port Operations total Sales to third parties Sales to Port Operations Group internal revenue Revenue total Result before interest and taxes per segment Shipping and Sea Transport Services Port Operations ,8 Result before interest and taxes (EBIT) total Financial income and expenses Result before tax (EBT) Income taxes Result for the reporting period Quarterly consolidated key figures Result before interest and taxes, (% of revenue) Earnings per share, EUR Average number of outstanding shares (1,000) 51,503 51,503 51,503 51,503 51,503 51,503 51,503 51,503 This page is an extract of the audited Financial Statements. The complete audited Financial Statements of the Group and the parent company are available at The extracts of the audited Financial Statements presented in the Annual Report should be viewed together with the complete and audited Financial Statements. FINNLINES
40 BOARD S PROPOSAL FOR THE USE OF THE DISTRIBUTABLE FUNDS AND SIGNATURES TO THE BOARD OF DIRECTORS REPORT AND TO THE FINANCIAL STATEMENTS Distributable funds included in the parent company s shareholders equity on 31 December 2017: Retained earnings EUR 271,069, Unrestricted equity reserve EUR 40,882, Result for the reporting period EUR 59,371, Distributable funds total EUR 371,323, The Board of Directors proposes to the Annual General Meeting that a dividend of EUR 1.00 per share be paid out resulting in a total amount of proposed dividends of EUR 51,503,141. Naples, 27 February 2018 Jon-Aksel Torgersen Chairman of the Board Christer Backman Tiina Bäckman Gian Luca Grimaldi Diego Pacella Guido Grimaldi Emanuele Grimaldi President and CEO THE AUDITOR S NOTE Our auditor s report has been issued today. Helsinki, 27 February 2018 KPMG Oy Ab Kimmo Antonen Authorized Public Accountant This page is an extract of the audited Financial Statements. The complete audited Financial Statements of the Group and the parent company are available at The extracts of the audited Financial Statements presented in the Annual Report should be viewed together with the complete and audited Financial Statements. 38
41 AUDITOR S REPORT This document is an English translation of the Finnish auditor s report. Only the Finnish version of the report is legally binding. TO THE ANNUAL GENERAL MEETING OF FINNLINES OYJ REPORT ON THE AUDIT OF THE FINANCIAL STATEMENTS OPINION We have audited the financial statements of Finnlines Oyj (business identity code ) for the year ended 31 December, The financial statements comprise the consolidated balance sheet, statement of comprehensive income, statement of changes in equity, statement of cash flows and notes, including a summary of significant accounting policies, as well as the parent company s balance sheet, income statement, statement of cash flows and notes. In our opinion the consolidated financial statements give a true and fair view of the group s financial position, financial performance and cash flows in accordance with International Financial Reporting Standards (IFRS) as adopted by the EU the financial statements give a true and fair view of the parent company s financial performance and financial position in accordance with the laws and regulations governing the preparation of financial statements in Finland and comply with statutory requirements. BASIS FOR OPINION We conducted our audit in accordance with good auditing practice in Finland. Our responsibilities under good auditing practice are further described in the Auditor s Responsibilities for the Audit of the Financial Statements section of our report. We are independent of the parent company and of the group companies in accordance with the ethical requirements that are applicable in Finland and are relevant to our audit, and we have fulfilled our other ethical responsibilities in accordance with these requirements. We believe that the audit evidence we have obtained is sufficient and appropriate to provide a basis for our opinion. RESPONSIBILITIES OF THE BOARD OF DIRECTORS AND THE MANAGING DIRECTOR FOR THE FINANCIAL STATEMENTS The Board of Directors and the Managing Director are responsible for the preparation of consolidated financial statements that give a true and fair view in accordance with International Financial Reporting Standards (IFRS) as adopted by the EU, and of financial statements that give a true and fair view in accordance with the laws and regulations governing the preparation of financial statements in Finland and comply with statutory requirements. The Board of Directors and the Managing Director are also responsible for such internal control as they determine is necessary to enable the preparation of financial statements that are free from material misstatement, whether due to fraud or error. In preparing the financial statements, the Board of Directors and the Managing Director are responsible for assessing the parent company s and the group s ability to continue as going concern, disclosing, as applicable, matters relating to going concern and using the going concern basis of accounting. The financial statements are prepared using the going concern basis of accounting unless there is an intention to liquidate the parent company or the group or cease operations, or there is no realistic alternative but to do so. AUDITOR S RESPONSIBILITIES FOR THE AUDIT OF FINANCIAL STATEMENTS Our objectives are to obtain reasonable assurance on whether the financial statements as a whole are free from material misstatement, whether due to fraud or error, and to issue an auditor s report that includes our opinion. Reasonable assurance is a high level of assurance, but is not a guarantee that an audit conducted in accordance with good auditing practice will always detect a material misstatement when it exists. Misstatements can arise from fraud or error and are considered material if, individually or in aggregate, they could reasonably be expected to influence the economic decisions of users taken on the basis of the financial statements. As part of an audit in accordance with good auditing practice, we exercise professional judgment and maintain professional skepticism throughout the audit. We also: Identify and assess the risks of material misstatement of the financial statements, whether due to fraud or error, design and perform audit procedures responsive to those risks, and obtain audit evidence that is sufficient and appropriate to provide a basis for our opinion. The risk of not detecting a material misstatement resulting from fraud is higher than for one resulting from error, as fraud may involve collusion, forgery, intentional omissions, misrepresentations, or the override of internal control. Obtain an understanding of internal control relevant to the audit in order to design audit procedures that are appropriate in the circumstances, but not for the purpose of expressing an opinion on the effectiveness of the parent company s or the group s internal control. Evaluate the appropriateness of accounting policies used and the reasonableness of accounting estimates and related disclosures made by management. Conclude on the appropriateness of the Board of Directors and the Managing Director s use of the going concern basis of accounting and based on the audit evidence obtained, whether a material uncertainty exists related to events or conditions that may cast significant doubt on the parent company s or the group s ability to continue as a going concern. If we conclude that a material uncertainty exists, we are required to draw attention in our auditor s report to the related disclosures in the financial statements or, if such disclosures are inadequate, to modify our opinion. Our conclusions are based on the audit evidence obtained up to the date of our auditor s report. However, future events or conditions may cause the parent company or the group to cease to continue as a going concern. Evaluate the overall presentation, structure and content of the financial statements, including the disclosures, and whether the financial statements represent the underlying transactions and events so that the financial statements give a true and fair view. Obtain sufficient appropriate audit evidence regarding the financial information of the entities or business activities within the group to express an opinion on the consolidated financial statements. We are responsible for the direction, supervision and performance of the group audit. We remain solely responsible for our audit opinion. We communicate with those charged with governance regarding, among other matters, the planned scope and timing of the audit and significant audit findings, including any significant deficiencies in internal control that we identify during our audit. OTHER REPORTING REQUIREMENTS OTHER INFORMATION The Board of Directors and the Managing Director are responsible for the other information. The other information comprises the report of the Board of Directors. Our opinion on the financial statements does not cover the other information. In connection with our audit of the financial statements, our responsibility is to read the other information and, in doing so, consider whether the other information is materially inconsistent with the financial statements or our knowledge obtained in the audit, or otherwise appears to be materially misstated. Our responsibility also includes considering whether the report of the Board of Directors has been prepared in accordance with the applicable laws and regulations. In our opinion, the information in the report of the Board of Directors is consistent with the information in the financial statements and the report of the Board of Directors has been prepared in accordance with the applicable laws and regulations. If, based on the work we have performed, we conclude that there is a material misstatement of the report of the Board of Directors, we are required to report that fact. We have nothing to report in this regard. OTHER OPINIONS We support that the financial statements should be adopted. The proposal by the Board of Directors regarding the use of the profit shown in the balance sheet is in compliance with the Limited Liability Companies Act. We support that the Members of the Board of Directors and the Managing Director should be discharged from liability for the financial period audited by us. Helsinki, 27 February 2018 KIMMO ANTONEN Authorised Public Accountant, KHT Auditors report issued for the Board of Directors report and Financial Statements for the year ended on 31 December 2017 is available at FINNLINES
42 FINNLINES PLC CORPORATE GOVERNANCE STATEMENT Finnlines Plc applies the guidelines and provisions of the Finnish Limited Liability Companies Act and its own Articles of Association. Finnlines also applies the Finnish Corporate Governance Code for listed companies entered into force on 1 January 2016 with regard to Finnlines Corporate Governance Statement for the financial period ended on 31 December The Code is publicly available on This Corporate Governance Statement has been approved by Finnlines Board. TASKS AND RESPONSIBILITIES OF GOVERNING BODIES Management of the Finnlines Group is the responsibility of the Board of Directors elected by the General Meeting as well as of the President and CEO. Their duties are for the most part defined by the Finnish Limited Liability Companies Act. Day-to-day operational responsibility lies with the members of the Extended Board of Management supported by relevant staff and service functions. GENERAL MEETING OF SHAREHOLDERS The ultimate decision-making body in the Company is the General Meeting of Shareholders. It resolves issues as defined for the General Meeting in the Finnish Limited Liability Companies Act and the Company s Articles of Association. These include approving the financial statements, deciding on the distribution of dividends, discharging the Company s Board of Directors and CEO from the liability for the financial year, appointing the Company s Board of Directors and auditors and deciding on their remuneration. A General Meeting of Finnlines Plc is held at least once a year. The Annual General Meeting (AGM) must be held no later than the end of June. The notice to the Shareholders Meeting shall be given no earlier than three (3) months before the Shareholders Meeting and no later than one (1) week before the Shareholders Meeting. ANNUAL GENERAL MEETING 2017 The Annual General Meeting of Finnlines Plc, held on 16 May 2017, approved the Financial Statements and discharged the members of the Board of Directors and the Company's President and CEO and the Company's officers from liability for the financial year The meeting decided that the general meeting authorises the Board of Directors to decide, at its discretion, on the payment of dividend up to Finnlines Plc s result for the reporting period in AGM decided that the number of Board Members be seven. The meeting re-elected the current board members Christer Backman, Tiina Bäckman, Emanuele Grimaldi, Gian Luca Grimaldi, Diego Pacella, and Jon-Aksel Torgersen and elected Guido Grimaldi as the new member of the Board of Directors for the term until the close of the Annual General Meeting in The Board elected Mr Jon-Aksel Torgersen Chairman and Mr Diego Pacella Vice Chairman. The firm of authorised public accountants KPMG Oy Ab was appointed as the Company s auditors for AGM decided to change its 5 of the Articles of Association that the Board of Directors elects a Chairman and Vice Chairman among its members. All related documents can be found on Finnlines website: > About us > Corporate Governance > General Meeting BOARD OF DIRECTORS Responsibility for the management of the Company and proper organisation of its operations lies with the Company s Board of Directors, which has at least five (5) and at most eleven (11) members. The members of the Board are appointed by AGM for one year at a time. The majority of the directors shall be independent of the Company and at least two of the directors representing this majority shall be independent from significant shareholders of the Company. Information on the Board composition, Board members and their independence can be found on Finnlines website. The President and CEO is a member of the Board. The proposal for the Board composition shall be included in the notice of AGM. The names of candidates for membership of the Board of Directors, put forward by the Board of Directors or by shareholders with a minimum holding of 10 per cent of the Company s voting rights, are published in the notice of the AGM, provided that the candidates have given their consent to the election. The candidates proposed thereafter shall be disclosed separately. 40
43 The Board elects a chairman and a deputy chairman from among its members. The Board steers and supervises the Company s operations, and decides on policies, goals and strategies of major importance. The principles applied by the Board in its regular work are set out in the Rules of Procedure approved by the Board. The Board handles all issues in the presence of the entire Board. The Board does not have any separate committees. The Board considers all the matters stipulated to be the responsibility of a board of directors by legislation, other provisions and the Company s Articles of Association. Due to the limited extent of the Company s business, it is considered effective that the entire Board also handles the duties of the audit committee, the nomination committee as well as those of the remuneration committee. THE MAIN DUTIES AND WORKING PRINCIPLES DRAWN UP BY THE BOARD ARE: the annual and interim financial statements the matters to be put before General Meetings of Shareholders the appointment and dismissal of the President and CEO, the Deputy CEO, if any, and the members of the Executive Committee approval of internal supervision and organisation of the Company s financial supervision other matters related to the duties of the audit committee mentioned in the Finnish Corporate Governance Code approval of the Group s strategic plan and long-term goals approval of the Group s annual business plan and budget decisions concerning investments, acquisitions, or divestments that are significant or that deviate from the Group s strategy decisions on raising long-term loans and the granting of security or similar collateral commitments risk management principles the Group s organisational structure approval of the remuneration and pension benefits of the President and CEO, the Deputy CEO, if any, and the members of the Executive Committee monitoring and assessment of the performance of the President and CEO. In addition to matters requiring decisions, Board meetings are given updates on the Group s operations, financial position and risks. The Board of Directors reviews its operations and working methods annually. The Board convenes 6 8 times a year following a predetermined schedule. In addition to these meetings, the Board convenes as necessary. BOARD OF DIRECTORS 2017 In 2017, the Board consisted of 7 members: Jon-Aksel Torgersen, Chairman of the Board, born 1952, MBA, CEO of Astrup Fearnley AS, attended meetings: 12/12 Diego Pacella, Vice Chairman of the Board, born 1960, Degree with honours in Mech. Eng., Managing Director of Grimaldi Deep Sea S.p.A., attended meetings: 12/12 Christer Backman, born 1945, M.Pol.Sc., attended meetings: 12/12 Tiina Bäckman, born 1959, Master of Laws, Chairman of the Board of Pension Foundation of Rautaruukki, attended meetings: 12/12 Emanuele Grimaldi, born 1956, Degree in Economics and Commerce, Managing Director of Grimaldi Group S.p.A., President and CEO of Finnlines Plc, attended meetings: 12/12 Gian Luca Grimaldi, born 1955, Degree in Economics and Commerce, Managing Director of Grimaldi Euromed S.p.A., attended meetings: 12/12 Olav K. Rakkenes, born 1945, Master s License, former CEO of Atlantic Container Line AB, member of the Board until 16 May 2017, attended meetings: 3/4 Guido Grimaldi, born 1983, Degree in Economics, MBA, Corporate Short Sea Shipping Commercial Director, Grimaldi Group, member of the Board as from 16 May 2017, attended meetings: 7/8 During 2017, Finnlines Plc s Board of Directors held 12 meetings. The present Board of Directors can be found on Finnlines website: > About us > Corporate Governance > Board of Directors >> FINNLINES
44 CORPORATE GOVERNANCE STATEMENT (CONTINUED) INDEPENDENCE OF THE BOARD OF DIRECTORS Four Members, Mr Christer Backman, Ms Tiina Bäckman, Mr Olav K. Rakkenes and Mr Jon-Aksel Torgersen, are independent of the Company and of the major shareholders. Mr Gian Luca Grimaldi, Mr Diego Pacella and Guido Grimaldi are independent of the Company. Mr Emanuele Grimaldi is dependent of the Company and the shareholders. PRESIDENT AND CEO AND DEPUTY CEO The Board of Directors appoints a President for the Group who is also its Chief Executive Officer. The President and CEO is in charge of the day-to-day management of the Company and its administration in accordance with the Company s Articles of Association, the Finnish Limited Liability Companies Act and the instructions of the Board of Directors. He is assisted in this work by the Executive Committee. The current President and CEO of the Company is Mr Emanuele Grimaldi (born 1956, Degree in Economics and Commerce, University of Naples, Italy). He does not receive any compensation or other benefit in the form of salary, bonus or pension benefit from the Company. The Board of Directors appoints, if necessary, a Deputy CEO. The Company has no Deputy CEO at present. EXECUTIVE COMMITTEE AND BOARD OF MANAGEMENT The members of the Executive Committee are appointed by the Board of Directors. The Executive Committee convenes regularly, and is chaired by the President and CEO. The Executive Committee supports the President and CEO in his duties in implementing Group-level strategies and guidelines, in coordinating the Group s management, in finding practical solutions for reaching the targets determined by the Board, and in supervising the Company s operations. The Company has a Board of Management, headed by the President and CEO, which consists of the members of the Executive Committee and the heads of functions and Line Managers as well as heads of the main agencies. The heads of functions are responsible for the sales volumes and profitability of their respective units. The Board of Management supports the Executive Committee in their work upon request. The Company has an Extended Board of Management, headed by the President and CEO, which comprises, in addition to the Board of Management, heads of other agencies, the Company's internal auditor, as well as Junior Managers. The Extended Board of Management convenes regularly to discuss operative issues related to the Group business and service products. The retirement age of the members of the Extended Board of Management is based on local laws and there are no special pension schemes in place. Information on the members of the Executive Committee, the Board of Management, and the Extended Board of Management, including their areas of responsibility, is given on Finnlines' website: > About us > Corporate Governance > Management COMPENSATION The remunerations paid to the members of the Board of Management, and the principles underlying it, are determined by the Board of Directors. The members of the Extended Board of Management are included in a bonus scheme which is decided by the Board of Directors on a yearly basis. The Board of Directors also decides on any separate performance-based compensation schemes for the management. The bonuses are paid in cash. There are no other bonus schemes. REMUNERATION IN 2017 The annual remuneration for the Board of Directors in 2017 was EUR 50,000 for the Chairman, EUR 40,000 for the Vice Chairman and EUR 30,000 for the other Board members. The remuneration of the Board of Directors has remained the same as from A detailed specification of the management contracts, salaries, remuneration and benefits paid in 2017 is given in the Financial Statements of 2017, Transactions with Related Parties, and in Finnlines Remuneration Statement 2017 on Finnlines website: > About us > Corporate Governance > Compensation INTERNAL AUDIT The Group s internal audit is handled by the Company s Internal Audit unit, which reports to the President and CEO. The purpose of the Internal Audit is to analyse the Company s 42
45 operations and processes and the effectiveness and quality of its supervision mechanisms. The unit assists Finnlines to accomplish its objectives by bringing a systematic, disciplined approach to evaluate and improve the effectiveness of the internal control and governance processes. The Internal Audit unit carries out its task by determining whether the Company s risk management, internal control and governance processes, as designed and represented by the management, are adequate and functioning in a manner to ensure that: Risks are appropriately identified and managed. Interaction with the various governance groups occurs as needed. Significant financial, managerial and operating information is accurate, reliable and timely. Employees actions are in compliance with policies, standards, procedures and applicable laws and regulations. Resources are acquired economically, used efficiently and adequately protected. Programs and plans are properly implemented and objectives are achieved. Quality and continuous improvement are fostered in the Company s internal control processes. Significant legislative or regulatory issues impacting the Company s internal controls are recognised and addressed appropriately. The head of the Internal Audit unit prepares an annual plan using an appropriate risk-based methodology and taking into consideration potential risks or control concerns identified by the management. The scope of the audits within a fiscal year is planned so that it is representative and the focus is set on the business areas with the biggest risk potentials. The plan is approved by the President and CEO. The internal auditor also carries out special tasks assigned by the Chairman, the President and CEO or the Board of Directors. The internal auditor conducts the internal audits independently from operational units. In his auditing work the auditor complies with the corporate governance, ethical principles, policies and other guidelines of the Company. The audit reports are sent to the President and CEO and the CFO. The President and CEO and the CFO have at least once a year a closed session with the head of Internal Audit unit about the results of the conducted audits and the plans for the next period. Relevant issues are also brought to the attention of the Board of Directors. RISK MANAGEMENT Internal control in Finnlines is designed to support the Company in achieving its targets. The risks related to the achievement of the targets need to be identified and evaluated in order to be able to manage them. Thus, identification and assessment of risks is a prerequisite for internal control in Finnlines. Internal control mechanisms and procedures provide management assurance that the risk management actions are carried out as planned. Conscious and carefully evaluated risks are taken in selecting strategies, e.g. in expanding business operations, in enhancing market position and in creating new business. Financial, operational and damage/loss risks are avoided or reduced. The continuity of operations is ensured by safeguarding critical functions and essential resources. Crisis management, continuity and disaster recovery plans are prepared. The costs and resources involved in risk management are in proportion to the obtainable benefits. The Board of Directors of Finnlines is responsible for defining the Group s overall level of risk tolerance and for ensuring that Finnlines has adequate tools and resources for managing risks. The President and CEO, with the assistance of the Executive Committee, is responsible for organising and ensuring risk management in all Finnlines operations. Responsibilities for the Group s working capital, investments, financing, finances, human resources, communications, information management and procurement are centralised to the head office of the Company. The Group s payment transactions, external and internal accounting are managed centrally by the Financial Department, which reports to the CFO. The Group s foreign exchange and interest exposure is reviewed by the Board of Directors in each budgeting period. External long-term loan arrangements are submitted to the Board of Directors for approval. The Corporate Legal Affairs and Insurance unit is responsible for risks associated with the Company s noncurrent assets and any interruptions in operations, as well as for the management and coordination of the Group s insurance policies. The majority of the Group s non-current assets consist of its fleet. The fleet is always insured to its full value. The financial position and creditworthiness of the Group s customers are monitored continuously in order to minimise the risk of customer credit losses. Each business unit has a responsible controller who reports to the head of the relevant business unit and to the Group CFO. The heads of Finnlines business units are responsible for the >> FINNLINES
46 CORPORATE GOVERNANCE STATEMENT (CONTINUED) profit and working capital of their units. They set the operational targets for their units and ensure that resources are used efficiently and that operations are evaluated and improved. Finnlines most important strategic, operative and financial risks are described in the Financial Statements 2017, Financial Risk Management. INTERNAL CONTROL OVER THE FINANCIAL REPORTING Monitoring is a process that assesses the quality of Finnlines system of internal control and its performance over time. Monitoring is performed both on an ongoing basis, and through separate evaluations including internal, external and quality audits. The business unit is responsible for ensuring that relevant laws and regulations are complied with in their respective responsibility areas. The Internal Audit function assists the President and CEO and the Board of Directors in assessing and assuring the adequacy and effectiveness of internal controls and risk management by performing regular audits in the Group s legal entities and support functions according to its annual plan. Finnlines external auditor and other assurance providers such as quality auditors conduct evaluations of the Company s internal controls. The Company s financial performance is reviewed at each Board meeting. The Board reviews all interim and annual financial reports before they are released. The effectiveness of the process for assessing risks and the execution of control activities are monitored continuously at various levels. This involves reviews of results in comparison with budgets and plans. Responsibility for maintaining an effective control environment and operating the system for risk management and internal control of financial reporting is delegated to the President and CEO. The internal control in the Company is based on the Group s structure, whereby the Group s operations are organised into two segments and various business areas and support functions. Group functions issue corporate guidelines that stipulate responsibilities and authority, and constitute the control environment for specific areas, such as finance, accounting, and investments, purchasing and sales. The Company has a compliance program. Standard requirements have been defined for internal control over financial reporting. The management expects all employees to maintain high moral and ethical standards and those expectations are communicated to the employees through internal channels. The Group Finance & Control unit monitors that the financial reporting processes and controls are being followed. It also monitors the correctness of external and internal financial reporting. The external auditor verifies the correctness of external annual financial reports. The Board monitors the statutory audit of the financial statements and consolidated financial statements, evaluates the independence of the statutory auditor or audit firm, particularly the provision of related services to the Company and prepares the proposal for resolution on the election of the auditor. The Board reviews annually the description of the main features of the internal control and risk management systems in relation to the financial reporting process, which is included in this Corporate Governance Statement. INFORMATION MANAGEMENT An effective internal control system needs sufficient, timely and reliable information to enable the management to follow up the achievement of the Company s objectives. Both financial and non-financial information is needed, relating to both internal and external events and activities. Information management plays a key role in Finnlines internal control system. Information systems are critical for effective internal control as many of the control activities are programmed controls. The controls embedded in Finnlines business processes have a key role in ensuring effective internal control in Finnlines. Controls in the business processes help ensure the achievement of all the objectives of internal control in Finnlines, especially those related to the efficiency of operations and safeguarding Finnlines profitability and reputation. Business units and IT management are responsible for ensuring that in their area of respon- 44
47 sibility the defined Group level processes and controls are implemented and complied with. Where no Group level processes and controls exist, business units and IT management are responsible for ensuring that efficient business level processes with adequate controls have been described and implemented. The proper functioning of Finnlines information systems is guaranteed through extensive and thorough security programs and emergency systems. INSIDER MANAGEMENT Finnlines shares or other securities are not listed. Therefore, Finnlines does not apply MAR or other regulations applicable to inside information relating to listed issuers. RELATED PARTY TRANSACTIONS The Company will assess and monitor transactions carried out with related parties and ensure that any conflicts of interests will be appropriately considered in the Company s decision-making. The Company maintains a list of related parties in its Group administration. The Company provides information on related party transactions according to the Limited Liability Companies Act and regulations governing the preparation of the financial statements in the review by the Board of Directors and notes to the financial statements. of Directors. An auditor, in addition to fulfilling general competency requirements, must also comply with certain legal independence requirements guaranteeing the execution of an independent and reliable audit. AUDITOR IN 2017 In 2017, the Annual General Meeting elected KPMG Oy Ab as the Company s auditor for the fiscal year Mr Kimmo Antonen, APA, has been appointed the head auditor. It was decided that the external auditors will be reimbursed according to invoice. In 2017, EUR 118 thousand was paid to the auditors in remuneration for the audit of the consolidated, parent company and subsidiary financial statements. During the same year, EUR 70 thousand was paid for consulting services not related to auditing. COMMUNICATIONS The principal information on Finnlines administration and management is published on the Company s website. All press releases are published on the Company s website as soon as they are made public. EXTERNAL AUDIT The Company has one auditor which shall be an auditing firm authorised by the Central Chamber of Commerce. The auditor is elected by the Annual General Meeting to audit the accounts for the ongoing financial year and its duties cease at the close of the subsequent Annual General Meeting. The auditor is responsible for auditing the consolidated and parent company s financial statements and accounting records, and the administration of the parent company. On closing of the annual accounts, the external auditor submits the statutory auditor s report to the Company s shareholders, and also regularly reports the findings to the Board FINNLINES
48 BOARD OF DIRECTORS 31 DECEMBER 2017 JON-AKSEL TORGERSEN Chairman of the Board Member of Finnlines Board since 2007 Independent of the Company and major shareholders Born 1952 Master in Business Administration, University of St. Gallen, Switzerland Astrup Fearnley AS, CEO Current positions: Atlantic Container Line AB, Chairman Awilco LNG ASA, Board Member Chairman and Board Member of a number of private companies DIEGO PACELLA Vice Chairman of the Board Member of Finnlines Board since 2007 Independent of the Company Born 1960 Degree in Mechanics Engineering, University of Naples, Italy Grimaldi Group S.p.A., Managing Director Grimaldi Deep Sea S.p.A., Managing Director Grimaldi Euromed S.p.A., Managing Director Grimaldi Group, Finance Director Current positions: Minoan Lines, Greece, Board Member Malta Motorways of the Sea Ltd, Board Member Atlantic Container Line AB, Board Member Finance Committee of Confitarma, Member CHRISTER BACKMAN Member of Finnlines Board since 2012 Independent of the Company and major shareholders Born 1945 M.Pol.Sc., Åbo Akademi University TIINA BÄCKMAN Member of Finnlines Board since 2012 Independent of the Company and major shareholders Born 1959 Master of Laws LL.M., University of Lapland Pension Foundation of Rautaruukki, Chairman to the Board Current positions: OP Financial Group, Supervisory Board Member and Risk Management Committee Member Oulun Puhelin Oyj Pension foundation, Chairman to the Board Redemption Board of the Finland Chamber of Commerce, Member Board Partners (Pohjois-Suomen Hallituspartnerit ry), Vice Chairman Finnish Company Law Association, Board Member Finnish Medical Foundation, Advisory Board Member EMANUELE GRIMALDI Member of Finnlines Board since 2006 President and CEO of Finnlines Plc Born 1956 Degree in Economics and Commerce, University of Naples, Italy General Certificate of Education (scientific), Military School Nunziatella, Naples, Italy Grimaldi Group S.p.A., Managing Director Grimaldi Deep Sea S.p.A., Managing Director Grimaldi Euromed S.p.A., President Current positions: Minoan Lines, Greece, President Malta Motorways of the Sea Ltd, President Atlantic Container Line AB, Board Member International Chamber of Shipping, Vice Chairman European Community Shipowners Associations, Past President and Board Member Interferry Inc, Board Member GIAN LUCA GRIMALDI Member of Finnlines Board since 2007 Independent of the Company Born 1955 Degree in Economics and Commerce, University of Naples, Italy Honored as Cavaliere del Lavoro since 2014 Grimaldi Group S.p.A., President Grimaldi Deep Sea S.p.A., President Grimaldi Euromed S.p.A., Managing Director Current positions: Minoan Lines, Greece, Board Member Malta Motorways of the Sea, Board Member Atlantic Container Line AB, Board Member Antwerp Euro Terminal n.v. Antwerp (Belgium), President GUIDO GRIMALDI* Member of Finnlines Board since 2017 Independent of the Company Born 1983 Degree in Economics at the University Federico II of Naples, Italy and MBA Master Automotive Logistics of ECG Academy (European Vehicle Logistics Association) Corporate Short Sea Shipping Commercial Director, Grimaldi Group Current positions: ALIS, Italy, President CONFALIS, Italy, President Short Sea Shipping Commission, Confitarma, President Grimaldi Catania Agency, President Grimaldi Sardegna Agency, President Grimaldi Marangolo Terminal Catania, Board Member Grimaldi Tunisie Agency, Board Member Grimaldi Maroc Agency, Board Member Grimaldi Logistica Genova Agency, Board Member * Member of the Board as from 16 May More information on the members of the Board at 46
49 EXECUTIVE COMMITTEE 31 DECEMBER 2017 EMANUELE GRIMALDI President and CEO Member of Finnlines Board since 2006 Born 1956 Degree in Economics and Commerce, University of Naples, Italy General Certificate of Education (scientific), Military School Nunziatella, Naples, Italy THOMAS DOEPEL Head of Group Purchasing Born 1974 M.Sc. (Econ.), Master Mariner, Executive MBA in Shipping and Logistics (Copenhagen Business School) STAFFAN HERLIN Head of Group Marketing, Sales and Customer Service Line Manager Germany, North Sea ro-ro Born 1958 M.Sc. (Econ.) MIKAEL LINDHOLM Head of Ship Management Born 1958 Master Mariner, Business management education TOM PIPPINGSKÖLD CFO Born 1960 B.Sc., MBA ANTONIO RAIMO Line Manager FinnLink, NordöLink & Russia Born 1975 M.Sc. (Banking and Economics), Master in Business Administration KIELO VESIKKO Head of Passenger Services Line Manager HansaLink & Hanko Rostock Born 1957 Diploma in Translation TAPANI VOIONMAA Group General Counsel Born 1951 Master Mariner, LL.M., Pg Dipl BOARD OF MANAGMENT 31 DECEMBER 2017 (IN ADDITION TO THE EXECUTIVE COMMITTEE) UWE BAKOSCH, Managing Director, Finnlines Deutschland GmbH DOMENICO FERRAIUOLO, Head of Port Operations CLAUS HØGH, Line Manager, Scandinavia ro-ro AGNIESZKA WALENCIAK, Line Manager, Hanko Gdynia line KIMMO KOSTIA, Head of Group IT, Hardware SANTERI LAAKSO, Head of Financial Department JAN LAURELL, Head of Group HR* SANNA SIMPANEN-MÄENPÄÄ, Group Business Controller KRISTIINA UPPALA, Head of Customer Service, Passenger Services VESA VÄHÄMAA, Head of Group IT, Software EXTENDED BOARD OF MANAGEMENT 31 DECEMBER 2017 (IN ADDITION TO THE BOARD OF MANAGEMENT) LUC HENS, Managing Director, Finnlines Belgium N.V. MERJA KALLIO-MANNILA, Head of Sales & Customer Service Finland REIJO KROOK, Internal Auditor and Quality Manager RAFAL KWAPISZ, Managing Director, Finnlines Poland* BLASCO MAJORANA, Traffic Manager, North Sea TORSTI MUURI, Traffic Manager, North Sea BRIAN ROLFE, Managing Director, Finnlines UK Limited TORKEL SAARNIO, Head of Truck and Trailer Segment * Member as from 1 October More information on the members of the Management at FINNLINES
 NORDLINK * (2007) Length, o.a. (m) 218.8 Breadth, moulded (m) 30.")
 FINNFELLOW * (2000) Length, o.a. (m) 188.3 Breadth, moulded (m) 29.")
 FINNTRADER (1995 / 2007) Length, o.a. (m) 183.0 Breadth, moulded (m) 28.")
50 YOUNGEST, LARGEST AND STRONGEST FLEET FINNLINES FLEET 31 DECEMBER 2017 RO-PAX VESSELS FINNMAID * (2006) FINNSTAR * (2006) FINNLADY * (2007) NORDLINK * (2007) Length, o.a. (m) Breadth, moulded (m) 30.5 DWT metric tons 8,964 / 8,982 / 8,761 / 8,792 GT 45,923 Total lane length (m) 4,215 Passengers 554 Speed (knots) 22 Ice Class 1A Super FINNCLIPPER * (1999) FINNFELLOW * (2000) Length, o.a. (m) Breadth, moulded (m) 29.5 DWT metric tons 7,209 / 7,267 GT 33,958 / 33,724 Total lane length (m) 3,079 / 2,918 Passengers 440 Speed (knots) 22 Ice Class 1A FINNPARTNER (1995 / 2007) FINNTRADER (1995 / 2007) Length, o.a. (m) Breadth, moulded (m) 28.7 DWT metric tons 9,088 / 9,132 GT 33,313 Total lane length (m) 3,050 Passengers 270 Speed (knots) 21 Ice Class 1A Super 48
 4,192 Speed (knots) 21 Ice Class 1A FINNBREEZE * (2011) FINNSEA * (2011) FINNSKY * (2012) FINNSUN * (2012) Length, o.a. (m) 188.")
 2,606 Speed (knots) 18 Ice Class 1A FINNMILL * (2002 / 2009) FINNPULP * (2002 / 2009) Length, o.a. (m) 187.06 Breadth, moulded (m) 26.")
 1,853 Speed (knots) 20 Ice Class 1A Super FINNCARRIER * (1998) FINNMASTER * (1998) Lenght, o.a. (m) 154.5 Breadth, moulded (m) 22.")
51 RO-RO VESSELS FINNTIDE */** (2012/2017) FINNWAVE */** (2012/2018) Length, o.a. (m) Breadth, moulded (m) 26.5 DWT metric tons 14,509 / 14,498 GT 33,816 Total lane length (m) 4,192 Speed (knots) 21 Ice Class 1A FINNBREEZE * (2011) FINNSEA * (2011) FINNSKY * (2012) FINNSUN * (2012) Length, o.a. (m) Breadth, moulded (m) 26.5 DWT metric tons ~10,800 GT 28,002 Total lane length (m) 3,291 Speed (knots) 21 Ice Class 1A FINNMERCHANT * (2003) Length, o.a. (m) Breadth, moulded (m) 26.0 DWT metric tons 13,106 GT 23,235 Total lane length (m) 2,606 Speed (knots) 18 Ice Class 1A FINNMILL * (2002 / 2009) FINNPULP * (2002 / 2009) Length, o.a. (m) Breadth, moulded (m) 26.5 DWT metric tons 11,744 / 11,682 GT 25,732 Total lane length (m) 3,259 Speed (knots) 20 Ice Class 1A FINNKRAFT * (2000) FINNHAWK * (2001) Length, o.a. (m) Breadth, moulded (m) 20.6 DWT metric tons 9,041 / 9,035 GT 11,671 Total lane length (m) 1,853 Speed (knots) 20 Ice Class 1A Super FINNCARRIER * (1998) FINNMASTER * (1998) Lenght, o.a. (m) Breadth, moulded (m) 22.7 DWT, metric tons 8,689 / 8,647 GT 12,433 Total lane length (m) 1,775 Speed (knots) 20 Ice Class 1A Super * Exhaust gas scrubbers installed. ** Lengthened Breeze series vessels on 31 January DWT: Deadweight Tonnage (sea water density 1025 kg/m 3 ) GT: Gross Tonnage FINNLINES
52 OPERATING AREAS Finnlines main operating areas are the Baltic Sea and the North Sea. With more than 170 weekly freight departures and 80 passenger departures, Finnlines today provides efficient shipping services. Hull Tilbury Antwerp Zeebrugge Bilbao 50


53 Kapellskär Långnäs Uusikaupunki Naantali Turku Hanko Helsinki Kotka Paldiski St. Petersburg Aarhus Malmö Travemünde Lübeck Rostock Gdynia LINER TRAFFIC AREA 31 DECEMBER 2017 FINNLINES
54 CONTACT INFORMATION FINNLINES PLC Komentosilta Helsinki, Finland P.O. Box Helsinki, Finland tel +358 (0) FINNLINES DEUTSCHLAND GMBH Einsiedelstraße Lübeck, Germany P.O. Box Lübeck, Germany tel FINNLINES BELGIUM N.V. Blikken Haven Verrebroek, Belgium tel FINNLINES DANMARK A/S Multivej Aarhus C, Denmark tel FINNLINES POLSKA CO. LTD. ul. Aleja Solidarnosci 1C Gdynia, Poland tel FINNLINES UK LTD. Finhumber House Queen Elizabeth Dock Hedon Road Hull HU9 5PB, Great Britain tel REDERI AB NORDÖ-LINK Lappögatan 3B Malmö, Sweden P.O. Box Malmö, Sweden tel FINNSTEVE OY AB Komentosilta Helsinki, Finland P.O. Box Helsinki, Finland tel FIND US ONLINE 52
55 THE GRIMALDI GROUP With long experience dating back to 1947, the Grimaldi Group specialises in the operation of roll-on/roll-off vessels, car carriers and ferries. It is a dedicated supplier of integrated logistics services based on maritime transport for the world s major vehicle manufacturers. Through its maritime services, the Naples-based Group also transports containers, palletised/unitised cargo and passengers with a modern fleet of more than 120 owned ro-ro multipurpose vessels, pure car carriers and ferries, 35 of which were built in the last 5 years. The Group s presence in the maritime transport of vehicles started in 1969 when it introduced a regular service between Italy and England. The Group rapidly gained the trust of other major car manufacturers who chose Grimaldi s vessels to transport their production from Northern Europe to various Mediterranean countries. Throughout the years the Group rapidly developed and now serves over 130 ports in 50 countries in the Mediterranean Sea, Northern Europe, West Africa, North and South America. The shore personnel and crew consist of nearly 13,000 people. The Grimaldi Group comprises seven main shipping companies, including Atlantic Container Line (ACL), Malta Motorways of the Sea (MMS), Finnlines and Minoan Lines. The Finnish company Finnlines runs a fleet of ro-pax and ro-ro vessels in the Baltic Sea and Northern Europe, while the Greek ferry company Minoan Lines operates ro-pax service between Piraeus (the port of Athens) and Crete. Recently, the Grimaldi Group has also evolved to become a multimodal transport operator offering door to door logistics services. For this purpose, it currently operates, together with strategic partners, car and container terminals (totalling over 5.4 million sq. metres) in the Mediterranean, Northern Europe and West Africa as well as trucking companies for the transport of cars and containers. In recent years, the Group has also invested in development of the Motorways of the Sea in the Mediterranean Sea by introducing new and modern ro-pax ferries. Currently, its network covers Italy, Spain, Malta, Tunisia, Morocco, Libya, Montenegro and Greece for the transport of trailers, cars and passengers. The high-quality services offered by the Grimaldi Group are being regularly awarded by its international clientele such as General Motors, Fiat Auto, Ford, Renault-Nissan, Honda and Land Rover. Finally, the Grimaldi Group is the first Italian shipping company to have obtained the SMS, ISO 9001 and ISO certifications for Safety, Quality and Environment. Moreover, the Grimaldi Group is also the first shipping company in Italy to be awarded the status of Authorized Economic Operator Complete (AEO-F). Photos: Petri Artturi Asikainen, Carl Bergman, Nils Bergmann, Michal Czacharowski/Remontowa Shiprepair Yard, Tasha Doremus, Antti Henttonen, Seppo Kaksonen, Soile Kallio, Rami Lappalainen, Erik Mosoni/Vince&Vert, Jouni Saaristo/Port of Turku, Christiane Schroeder, Timo Virojärvi & Finnlines archives.


56 Finnlines Plc Komentosilta Helsinki, Finland P.O.Box 197, HELSINKI, Finland Phone
Finnlines Plc Annual General Meeting Tom Pippingsköld, CFO
 Finnlines Plc Annual General Meeting 12.4.2016 Tom Pippingsköld, CFO 1 Global Shipping Segments 1 Jan 2015 Source: http://www.statista.com/statistics/264024/number-of-merchant-ships-worldwide-by-type/
PASSENGER SERVICES, PAGE 15
 ANNUAL REPORT 2016 CONTENT Finnlines in 2016 2 70 Years of Experience in Shipping 3 CEO s Review 4 CFO s Review 6 Business Concept, Values and Strategic Goals 9 Business Environment 10 Shipping and Sea
Financial review January June July 2018 FINNLINES Q2
 Financial review January June 2018 31 July 2018 FINNLINES Q2 FINNLINES PLC FINANCIAL REVIEW JANUARY JUNE 2018 (unaudited) Media Release 31 July 2018 JANUARY JUNE 2018: Strong performance in January June,
Financial review January March May 2018 FINNLINES Q1
 Financial review January March 2018 8 May 2018 FINNLINES Q1 FINNLINES PLC FINANCIAL REVIEW JANUARY MARCH 2018 (unaudited) Media Release 8 May 2018 JANUARY MARCH 2018: Continued strength in first quarter
Annual General Meeting. 13 June 2017
 Annual General Meeting 13 June 2017 Agenda 1. Approval of the Annual Report of the financial year 2016 of AS Tallink Grupp 2. Proposal on distribution of profits 3. Extension of authorities of the members
Interim report January March May 2016 FINNLINES Q1
 Interim report January March 2016 11 May 2016 FINNLINES Q1 FINNLINES PLC INTERIM REPORT JANUARY-MARCH 2016 (unaudited) Stock Exchange Release 11 May 2016 at 13:15 JANUARY-MARCH 2016: Result for the reporting
Finnlines in CEO s review 4 Business concept, values and goals 6 Business environment 8. shipping and sea transport services, page 10
 Annual report 2012 Content Finnlines in 2012 2 CEO s review 4 Business concept, values and goals 6 Business environment 8 Shipping and Sea Transport Services 10 Passenger Services 12 Port Operations 14
Finnair Q Result
 Finnair Q1 2015 Result 7 May 2015 CEO Pekka Vauramo, Interim CFO Mika Stirkkinen 1 Turbulent market environment The weakness of the Finnish economy continued to be reflected in the demand in the first
NORWEGIAN AIR SHUTTLE ASA QUARTERLY REPORT SECOND QUARTER 2006 [This document is a translation from the original Norwegian version]
![NORWEGIAN AIR SHUTTLE ASA QUARTERLY REPORT SECOND QUARTER 2006 [This document is a translation from the original Norwegian version]](/thumbs/74/71229964.jpg "NORWEGIAN AIR SHUTTLE ASA QUARTERLY REPORT SECOND QUARTER 2006 [This document is a translation from the original Norwegian version]") NORWEGIAN AIR SHUTTLE ASA QUARTERLY REPORT SECOND QUARTER 2006 SECOND QUARTER IN BRIEF had earnings before tax of MNOK 24.8 (20.6) in the second quarter. The operating revenue increased by 44 % this quarter,
NORWEGIAN AIR SHUTTLE ASA QUARTERLY REPORT SECOND QUARTER 2006 SECOND QUARTER IN BRIEF had earnings before tax of MNOK 24.8 (20.6) in the second quarter. The operating revenue increased by 44 % this quarter,
Thank you for participating in the financial results for fiscal 2014.
 Thank you for participating in the financial results for fiscal 2014. ANA HOLDINGS strongly believes that safety is the most important principle of our air transportation business. The expansion of slots
Globus Maritime Limited Trading Update and Financial Highlights for the Three Months and Nine Months Ended September 30, 2007.
 Globus Maritime Limited Trading Update and Financial Highlights for the Three Months and Nine Months Ended September 30, 2007. Athens, Greece, November 15, 2007. Globus Maritime Limited (AIM: GLBS), a
GROUP ULJANIK PLOVIDBA CONSOLIDATED AUDITED FINANCIAL STATEMENTS FOR THE PERIOD JANUARY - DECEMBER 2014
 GROUP ULJANIK PLOVIDBA CONSOLIDATED AUDITED FINANCIAL STATEMENTS FOR THE PERIOD JANUARY - DECEMBER 2014 Pula, April 2015 CONTENT: Consolidated audited Financial Statements of GROUP ULJANIK PLOVIDBA with
PORT OF HELSINKI ALL OF FINLAND WITHIN YOUR REACH
 PORT OF HELSINKI ALL OF FINLAND WITHIN YOUR REACH PORT OF THE ENTIRE FINLAND One of the strengths of the Port of Helsinki is its excellent location at the heart of Finnish production, population and consumption.
SEA BOARD OF DIRECTORS: 2017 STATUTORY FINANCIAL STATEMENTS AND NON-FINANCIAL REPORT APPROVED
 SEA BOARD OF DIRECTORS: 2017 STATUTORY FINANCIAL STATEMENTS AND NON-FINANCIAL REPORT APPROVED SEA Group results Passenger traffic: 31.6 million, up 8.9% (22 million at Milan Malpensa, growth of 14.1%)
LASSILA & TIKANOJA Q Pekka Ojanpää, President and CEO 25 October Lassila & Tikanoja plc
 LASSILA & TIKANOJA Q3 2017 Pekka Ojanpää, President and CEO 25 October 2017 Lassila & Tikanoja plc HIGHLIGHTS OF Q3/2017 L&T completed the acquisition of Veolia FM AB (L&T FM AB) The integration process
Press Release. Bilfinger 2017: Stable foundation laid for the future
 Press Release February 14, 2018 Bilfinger 2017: Stable foundation laid for the future Organic growth in orders received after three years of decline Trend reversal: Output volume better than expected Growth
Flughafen Wien Group Maintains Upward Trend: Passenger Growth and Strong Earnings Improvement in the First Nine Months of 2016
 Flughafen Wien Group Maintains Upward Trend: Passenger Growth and Strong Earnings Improvement in the First Nine Months of 2016 REVENUE increase to 545.4 million (+10.2%), EBITDA rise to 306.5 million (+13.1%
2012 Result. Mika Vehviläinen CEO
 2012 Result Mika Vehviläinen CEO 1 Agenda Market environment in Q4 Business performance and strategy execution Outlook Financials 2 Market Environment According to IATA, Global air travel continues to
Finnair Q Result
 Finnair Q2 2015 Result 14 August 2015 CEO Pekka Vauramo, Interim CFO Mika Stirkkinen 1 Market environment shows signs of improvement There were signs of a recovery in the demand for consumer and business
DFDS A/S H Analyst meeting 30 August 2006
 DFDS A/S H1 2006 Analyst meeting 30 August 2006 DFDS A/S Contents The half-year in brief Strategy on track DFDS Seaways DFDS Tor Line Half-year accounts & profit forecast 2006 DFDS A/S H1 2006 in brief
Finnair Group Annual Report 1 January 31 December 2006
 Finnair Group Annual Report 1 January 31 December 2006 2006: A year for restructuring Scheduled Passenger Traffic transforming to meet Asian traffic demands Labour negotiations to cut 670 jobs 80 million
TARIFF OF HARBOUR DUES
 PORT OF GDYNIA AUTHORITY S.A. JOINT-STOCK COMPANY TARIFF OF HARBOUR DUES Valid from 1 July 2007 The Tariff established by the Port of Gdynia Authority, S.A. under Resolution no. 168/II/2004 of 18 August
NORWEGIAN AIR SHUTTLE ASA QUARTERLY REPORT FIRST QUARTER 2004 [This document is a translation from the original Norwegian version]
![NORWEGIAN AIR SHUTTLE ASA QUARTERLY REPORT FIRST QUARTER 2004 [This document is a translation from the original Norwegian version]](/thumbs/87/95085804.jpg "NORWEGIAN AIR SHUTTLE ASA QUARTERLY REPORT FIRST QUARTER 2004 [This document is a translation from the original Norwegian version]") NORWEGIAN AIR SHUTTLE ASA QUARTERLY REPORT 2004 IN BRIEF At the start of 2003, Norwegian has become a pure low-fare airline. The Fokker F-50 operations have been terminated, and during the quarter the
NORWEGIAN AIR SHUTTLE ASA QUARTERLY REPORT 2004 IN BRIEF At the start of 2003, Norwegian has become a pure low-fare airline. The Fokker F-50 operations have been terminated, and during the quarter the
Press Release. Bilfinger with dynamic start to financial year 2018
 Press Release May 15, 2018 Bilfinger with dynamic start to financial year 2018 Book-to-bill ratio reaches 1.2 in the first quarter Fourth consecutive growth quarter in orders received Adjusted EBITA above
AEROFLOT ANNOUNCES FY 2017 IFRS FINANCIAL RESULTS
 AEROFLOT ANNOUNCES FY 2017 IFRS FINANCIAL RESULTS Moscow, 1 March 2018 Aeroflot Group ( the Group, Moscow Exchange ticker: AFLT) today publishes its audited financial statements in accordance with International
20 ANNU 1 AL RE 1 PORT
 ANNUAL REPORT 2011 CONTENT Finnlines in 2011 2 CEO s Review 4 Business Concept, Values and Goals 6 Business Environment 8 Shipping and Sea Transport Services 10 Passenger Services 12 Port Operations 14
QANTAS HALF YEAR 2015 FINANCIAL RESULTS 1
 QANTAS HALF YEAR 2015 FINANCIAL RESULTS 1 Key points: Underlying Profit Before Tax: $367 million Statutory Profit After Tax: $206 million Transformation benefits: $374 million Comparable unit cost reduction:
The Nordic Morning Group s consolidated net revenue and operating profit declined in the first half of the year
 Nordic Morning Group s Interim Report, January 1 June 30, 2018 The Nordic Morning Group s consolidated net revenue and operating profit declined in the first half of the year The Nordic Morning Group s
Finnair Group Interim Report 1 January 30 September 2008
 Finnair Group Interim Report 1 January 30 September 2008 1 31/10/2008 Presentation name / Author Airline industry at a historical turning point Expensive fuel price in the beginning of 2008 has dramatical
OPERATING AND FINANCIAL HIGHLIGHTS SUBSEQUENT EVENTS
 Copa Holdings Reports Net Income of US$6.2 Million and EPS of US$0.14 for the Third Quarter of 2015 Excluding special items, adjusted net income came in at $37.4 million, or EPS of $0.85 per share Panama
Finnair Q Result
 17 August 2016 CEO Pekka Vauramo CFO Pekka Vähähyyppä Finnair Q2 2016 Result 1 Highlights of the second quarter The seventh consecutive quarter of profit improvement Fukuoka & Guangzhou route openings
QANTAS DELIVERS STRONG FIRST HALF RESULT DESPITE HIGHER FUEL BILL
 ASX and Media Release Sydney, 21 February 2019 QANTAS DELIVERS STRONG FIRST HALF RESULT DESPITE HIGHER FUEL BILL Underlying Profit Before Tax: $780 million (down $179 million) Statutory Profit Before Tax:
Ramsay Health Care Limited Results Briefing Half Year ended 31 December 2018
 Ramsay Health Care Limited Results Briefing Half Year ended 31 December 2018 Craig McNally, Group Managing Director & Bruce Soden, Group Finance Director 28 February 2019 ramsayhealth.com Agenda Group
SHIP-GENERATED WASTE MANAGEMENT
 SHIP-GENERATED WASTE MANAGEMENT Ellen Kaasik, Head of Quality and Environmental Management Department, Port of Tallinn at the Workshop Green Cruise Port Innovative Waste Management and Reception Facilities
2017 results: REVENUE up to million (+1.6%), NET PROFIT FOR THE PERIOD 1 shows significant increase to million (+12.
, NET PROFIT FOR THE PERIOD 1 shows significant increase to million (+12.") Business Results in 2017: Significant Rise in Profits of the Flughafen Wien Group Management Board Announces Substantial Upward Revision of Earnings Guidance and Traffic Figures for 2018 2017 results:
Business Results in 2017: Significant Rise in Profits of the Flughafen Wien Group Management Board Announces Substantial Upward Revision of Earnings Guidance and Traffic Figures for 2018 2017 results:
Cruise Industry Perspective on OWS and Waste Management
 Cruise Industry Perspective on OWS and Waste Management MAX1 OWS Studies Conference Wilmington, NC, 24 June 2015 James R. Van Langen, P.E. Environmental, Safety, Quality & Sustainability Consultant Cruise
Media Release. Qantas Group Full Year 2017 Financial Result 1. Sydney, 25 August 2017
 Media Release Qantas Group Full Year 2017 Financial Result 1 Sydney, 25 August 2017 Underlying Profit Before Tax: $1,401 million (second highest in Qantas history) Statutory Profit Before Tax: $1,181 million
BRISK Sub-regional risk of spill of oil and hazardous substances in the Baltic Sea
 BRISK Sub-regional risk of spill of oil and hazardous substances in the Baltic Sea Part-financed by the European Union Photo: Nikolay Vlasov / HELCOM Maritime traffic in the Baltic The Baltic Sea today
Feasible SOx solutions
 Feasible SOx solutions Wärtsilä s Environmental seminar in Helsinki at June 22 nd, 2010 Vesa Marttinen, Director, Environmental Services Wärtsilä 1 Wärtsilä 30 April 2010 Decreased fuel cost / Vesa Marttinen
GROWING WITH FINLAND. news 1/2018. a Grimaldi Group Company EXTRA CAPACITY TO MEET GROWING DEMAND AND INCREASED ENERGY EFFICIENCY
 a Grimaldi Group Company news 1/2018 GROWING WITH FINLAND EXTRA CAPACITY TO MEET GROWING DEMAND AND INCREASED ENERGY EFFICIENCY >> Modern >> Reliable >> Efficient Contents Editorial 2 Four ships 30 metres
Q Fast growth continued, Comparable operating result at record high levels Pekka Vauramo
 2018 Fast growth continued, Comparable operating result at record high levels 17.7.2018 Pekka Vauramo 2 A good - Comparable operating result increased to new seasonal high Revenue Comparable operating
Preliminary Figures FY 2016
 February 14, 2017 Preliminary Figures FY 2016 Capital Markets Day 2017 Tom Blades (CEO) Disclaimer This presentation has been produced for support of oral information purposes only and contains forwardlooking
El Al Israel Airlines announced today its financial results for the year 2016 and the fourth quarter of the year:
 El Al Israel Airlines announced today its financial results for the year 2016 and the fourth quarter of the year: The Company's revenues in 2016 amounted to approx. USD 2,038 million, compared to approx.
Copa Holdings Reports Record Earnings of US$41.8 Million for 4Q06 and US$134.2 Million for Full Year 2006
 Copa Holdings Reports Record Earnings of US$41.8 Million for 4Q06 and US$134.2 Million for Full Year 2006 Panama City, Panama --- March 7, 2007. Copa Holdings, S.A. (NYSE: CPA), parent company of Copa
Half-yearly Report 2013
 Half-yearly Report 2013 Financial result unchanged PORT OF ROTTERDAM THROUGHPUT DECREASED SLIGHTLY Throughput in the port of Rotterdam in the first half of the year decreased by 0.9% compared to the first
SHIP MANAGEMENT SURVEY. July December 2017
 SHIP MANAGEMENT SURVEY July December 2017 INTRODUCTION The Ship Management Survey is conducted by the Statistics Department of the Central Bank of Cyprus and concentrates primarily on transactions between
Flughafen Wien Group Continues on Success Path in the First Quarter of 2016
 Flughafen Wien Group Continues on Success Path in the First Quarter of 2016 Upward revaluation of stake in Malta Airport and good business development lead to strong increase in the net profit for the
26 October 2017 Icelandair Group Interim Report NET PROFIT USD 101 MILLION IN THIRD QUARTER
 NET PROFIT USD 101 MILLION IN THIRD QUARTER Total income in Q3 up by 10% between years, to USD 536.0 million Passenger revenue higher than expected EBITDA unchanged year on year, at USD 161.1 million Passenger
LOCATED AT THE GATEWAY OF THE TROPICAL PROVINCE, RIDING ON THE GROWTH MOMENTUM OF THE COUNTRY, WE ARE ON THE RIGHT TRACK OF TAKING OFF.
 LOCATED AT THE GATEWAY OF THE TROPICAL PROVINCE, RIDING ON THE GROWTH MOMENTUM OF THE COUNTRY, WE ARE ON THE RIGHT TRACK OF TAKING OFF. MANAGEMENT DISCUSSION INDUSTRY REVIEW Civil Aviation Industry in
OPERATING AND FINANCIAL HIGHLIGHTS SUBSEQUENT EVENTS
 Copa Holdings Reports Financial Results for the Third Quarter of 2016 Excluding special items, adjusted net income came in at $55.3 million, or adjusted EPS of $1.30 per share Panama City, Panama --- November
CONTACT: Investor Relations Corporate Communications
 NEWS RELEASE CONTACT: Investor Relations Corporate Communications 435.634.3200 435.634.3553 Investor.relations@skywest.com corporate.communications@skywest.com SkyWest, Inc. Announces Fourth Quarter 2017
CONTACT: Investor Relations Corporate Communications
 NEWS RELEASE CONTACT: Investor Relations Corporate Communications 435.634.3200 435.634.3553 Investor.relations@skywest.com corporate.communications@skywest.com SkyWest, Inc. Announces Second Quarter 2016
VERY GOOD RESULTS IN OUR MOST IMPORTANT QUARTER
 VERY GOOD RESULTS IN OUR MOST IMPORTANT QUARTER Q3 EBITDA USD 161.8 million, as compared to USD 155.6 million in the corresponding quarter last year 19% increase in passenger numbers on international flights
Analyst and Investor Conference Call Q Ulrik Svensson, CFO and Member of the Executive Board
 Analyst and Investor Conference Call Q2 2017 Ulrik Svensson, CFO and Member of the Executive Board Frankfurt, 2 August 2017 Disclaimer The information herein is based on publicly available information.
USD thousand Q Q Change % Change 12M 2015
 EBITDA POSITIVE IN FIRST-QUARTER EBITDA positive by USD 1.1 million, as compared to a negative outcome of USD 2.3 million last year Positive impact of low fuel prices on performance 21% increase in passenger
OPERATING AND FINANCIAL HIGHLIGHTS
 Copa Holdings Reports Net Income of US$32.0 Million and EPS of US$0.72 for the Second Quarter of 2012 Excluding special items, adjusted net income came in at $58.6 million, or EPS of $1.32 per share Panama
SHIP MANAGEMENT SURVEY. January June 2018
 CENTRAL BANK OF CYPRUS EUROSYSTEM SHIP MANAGEMENT SURVEY January June 2018 INTRODUCTION The Ship Management Survey (SMS) is conducted by the Statistics Department of the Central Bank of Cyprus and concentrates
WÄRTSILÄ CORPORATION JP MORGAN CAZENOVE EUROPEAN CAPITAL GOODS CEO CONFERENCE
 WÄRTSILÄ CORPORATION JP MORGAN CAZENOVE EUROPEAN CAPITAL GOODS CEO CONFERENCE Jaakko Eskola President & CEO 1 Wärtsilä PUBLIC 16 June 2017 Jaakko Eskola Wärtsilä s net sales by business Q1/2017 SERVICES,
Finnair Group Interim Report 1 January 31 March 2008
 Finnair Group Interim Report 1 January 31 March 2008 1 29/04/2008 Presentation name / Author Outlook for the industry less positive Growth of demand declining due to uncertainty of global economy Growth
VR Group s result for 2018 was excellent rail traffic volumes increased
 Press release 1 (5) VR Group s result for 2018 was excellent rail traffic volumes increased Financial details for 2018 presented in this press release are unaudited FAS figures. The figures in brackets
Wales. Andy Thomas. Route Managing Director Wales. Ken Skates, Cabinet Secretary for Economy and Infrastructure, Welsh Government
 Wales The railway in Wales and Borders plays a critical role in connecting people, businesses and communities to support both regional and national economic growth. We run the safest railway in Europe,
Air China Limited Announces 2009 Annual Results
 Air China Limited Announces 2009 Annual Results Record Operating Profit in Complex Market Environment Strengthened Position to Capture Growth Opportunities Hong Kong April 22, 2010 Air China Limited (
AIR CANADA REPORTS THIRD QUARTER RESULTS
 AIR CANADA REPORTS THIRD QUARTER RESULTS THIRD QUARTER OVERVIEW Operating income of $112 million compared to operating income of $351 million in the third quarter of 2007. Fuel expense increased 49 per
Finnair 2015 kolmannen vuosineljänneksen tulos
 Finnair 215 kolmannen vuosineljänneksen tulos Q3 Result 215 3 October 215 3.1.215 Toimitusjohtaja Pekka Vauramo Talousjohtaja Pekka Vähähyyppä 1 Highlights of the quarter Excellent Q3 result: Record result
Net sales by business area in % Services. Ship Power 31% Power Plants POWER PLANTS
 THIS IS WÄRTSILÄ Wärtsilä is a global leader in complete lifecycle power solutions for the marine and energy markets. By emphasising technological innovation and total efficiency, Wärtsilä maximises the
INTERIM REPORT JANUARY-JUNE 2013
 INTERIM REPORT JANUARY-JUNE 213 BJÖRN ROSENGREN, PRESIDENT & CEO 18 JULY 213 Wärtsilä Highlights Q2/213 NEW PIC Order intake EUR 1,71 million, -11% Net sales EUR 1,152 million, +5% Book-to-bill.93 EBITA
Ferrovial increases net profit by 12%, to 287 million euro
 All-time record backlog: 23.695 billion euro Ferrovial increases net profit by 12%, to 287 million euro Revenues expanded by 2.8% to 3.758 billion euro, supported by solid performance in the international
WÄRTSILÄ TO ACQUIRE L-3 MARINE SYSTEMS INTERNATIONAL
 WÄRTSILÄ TO ACQUIRE L-3 MARINE SYSTEMS INTERNATIONAL PRESS CONFERENCE 16.12.2014 Jaakko Eskola 1 The most complete marine offering on earth 2 Wärtsilä Corporate presentation 2014 L-3 Marine Systems International
Management Discussions and Analysis for the three-month period ended 31 March 2014 and Executive Summary
 Executive Summary Overview of the global economy during the first quarter of 2015 (Q1/2015) are as following; the US economy has been in recovery mode while rapidly dollar appreciation weighs on net exports
SPEECH BY WILLIE WALSH, CHIEF EXECUTIVE, INTERNATIONAL AIRLINES GROUP. Annual General Meeting, Thursday June 14, Check against delivery
 SPEECH BY WILLIE WALSH, CHIEF EXECUTIVE, INTERNATIONAL AIRLINES GROUP Annual General Meeting, Thursday June 14, 2018 Check against delivery FINANCIAL PERFORMANCE Good afternoon Ladies and Gentleman. I
Copa Holdings Reports Net Income of $49.9 million and EPS of $1.18 for the Second Quarter of 2018
 Copa Holdings Reports Net Income of $49.9 million and EPS of $1.18 for the Second Quarter of 2018 Panama City, Panama --- Aug 8, 2018. Copa Holdings, S.A. (NYSE: CPA), today announced financial results
INTESA SANPAOLO VITA RESULTS AT 31 MARCH 2017 APPROVED:
 INTESA SANPAOLO VITA RESULTS AT 31 MARCH 2017 APPROVED: Assets under management at 145,908.2 million euros (143,735.3 million euros at December 2016 +1.5%) Financial liabilities (unit and index linked)
Preparatory Course in Business (RMIT) SIM Global Education. Bachelor of Applied Science (Aviation) (Top-Up) RMIT University, Australia
 SIM Global Education. Bachelor of Applied Science (Aviation) (Top-Up) RMIT University, Australia") Preparatory Course in Business (RMIT) SIM Global Education Bachelor of Applied Science (Aviation) (Top-Up) RMIT University, Australia Brief Outline of Modules (Updated 18 September 2018) BUS005 MANAGING
Preparatory Course in Business (RMIT) SIM Global Education Bachelor of Applied Science (Aviation) (Top-Up) RMIT University, Australia Brief Outline of Modules (Updated 18 September 2018) BUS005 MANAGING
OPERATING AND FINANCIAL HIGHLIGHTS. Subsequent Events
 Copa Holdings Reports Net Income of $103.8 million and EPS of $2.45 for the Third Quarter of 2017 Excluding special items, adjusted net income came in at $100.8 million, or EPS of $2.38 per share Panama
FOURTH QUARTER AND FULL-YEAR RESULTS February 2008
 FOURTH QUARTER AND FULL-YEAR RESULTS 2 1 February 2 AGENDA CEO review Financial review Operating review of Mobile Concluding remarks Harri Koponen Lars Nilsson Harri Koponen Harri Koponen 2 29-2-1 Fourth
HARBOUR DUES. The Port of Helsingborg
 HARBOUR DUES The Port of Helsingborg Valid 1 January -- 31 December, 2018 1 Contents 1 Ships dues 2 Environmental discounts 3 Waste and environmental charge 4 Pumping charge 5 Harbour dues 6 Advance notification
For personal use only
 ASX and Media Release QANTAS DELIVERS RECORD FIRST HALF PROFIT, INVESTS IN AIRCRAFT AND TRAINING Sydney, 22 February 2018 Underlying Profit Before Tax: $976 million (up 15%) Record results for Qantas Domestic,
WÄRTSILÄ CORPORATION
 WÄRTSILÄ CORPORATION INTERIM REPORT JANUARY-JUNE 215 17 JULY 215 Björn Rosengren, President & CEO Wärtsilä Highlights Q2/215 Order intake EUR 1,159 million, +2% Net sales EUR 1,23 million, +1% Book-to-bill.94
OPERATING AND FINANCIAL HIGHLIGHTS
 Copa Holdings Reports Net Income of US$18.6 Million and EPS of US$0.42 for the Second Quarter of 2010 Excluding special items, adjusted net income came in at $26.3 million, or $0.60 per share Panama City,
EASYJET INTERIM MANAGEMENT STATEMENT FOR THE QUARTER ENDED 30 JUNE 2011
 22 July 2011 easyjet Interim Management Statement Page 1 of 5 22 July 2011 EASYJET INTERIM MANAGEMENT STATEMENT FOR THE QUARTER ENDED 30 JUNE 2011 Highlights (figures below are for the quarter ended 30
GIBRALTAR PORT: POWERHOUSE OF THE ECONOMY
 GIBRALTAR PORT: POWERHOUSE OF THE ECONOMY The Port of Gibraltar s emergent reputation as one of the world s leading maritime services hubs for international shipping in Western Europe is well deserved.
APPLICATION OF THE NO-SPECIAL-FEE SYSTEM IN THE BALTIC SEA AREA
 CONVENTION ON THE PROTECTION OF THE MARINE ENVIRONMENT OF THE BALTIC SEA AREA HELSINKI COMMISSION - Baltic Marine HELCOM 19/98 Environment Protection Commission 15/1 Annex 19 19th Meeting Helsinki, 23-27
PRESS RELEASE Financial Results. Rising passenger traffic at 12.5m Exceeding 1bn in consolidated revenue
 PRESS RELEASE 2016 Financial Results Rising passenger traffic at 12.5m Exceeding 1bn in consolidated revenue Kifissia, 23 March 2017 AEGEAN reports full year 2016 results with consolidated revenue at 1,020m,
Finnair Group Interim Report 1 January 30 June 2008
 Finnair Group Interim Report 1 January 30 June 2008 1 08/08/2008 Presentation name / Author Airline industry at a historical turning point Fuel price has a stranglehold on the business Average ticket prices
Air China Limited Annual Results. March Under IFRS
 Air China Limited 21 Annual Results Under IFRS March 211 Agenda Part 1 Highlights Part 2 Business Overview Part 3 Financial Overview Part 4 Outlook 2 Part 1 Highlights Steady Economic Growth; Asia Pacific
El Al Israel Airlines announced today its financial results for the second quarter and the first half of 2017.
 August 16, 2017 El Al Israel Airlines announced today its financial results for the second quarter and the first half of 2017. The Company's revenues in the second quarter of 2017 amounted to approx. USD
2Q 2008 INTERIM REPORT Unaudited
 2Q 2008 INTERIM REPORT Unaudited HIGH UTILISATION AND STRONG CASH FLOW IN 2Q 2008 Ocean HeavyLift ASA (OHL) continues to deliver strong results in the second quarter of 2008. TC equivalent revenues came
For personal use only
 HELLOWORLD TRAVEL LIMITED RESULTS ANNOUNCEMENT Highlights for the year ended 30 June 2018 Total Transaction Value (TTV) growth of 3.5% to $6.1 billion, underpinned by strong air ticket sales volume growth.
Finnair Q result. 25 October 2017 CEO Pekka Vauramo
 Finnair Q3 2017 result 25 October 2017 CEO Pekka Vauramo 1 All-time best quarter Revenue up by 15% to record level of 735 M Aircraft flew full, passenger load factor was 87% Asian routes and San Francisco
ICS Shipping Conference. (including MLC) 11 September 2013
 11 September 2013") ICS Shipping Conference Topical PSC Issues (including MLC) 11 September 2013 Brian Hogan Chairman a Paris MoU Structure of Presentation: Paris MoU New Inspection Regime - NIR HAVEP 2013 Cruise Ships Concentrated
ICS Shipping Conference Topical PSC Issues (including MLC) 11 September 2013 Brian Hogan Chairman a Paris MoU Structure of Presentation: Paris MoU New Inspection Regime - NIR HAVEP 2013 Cruise Ships Concentrated
Flughafen Wien AG results in Q1 2015: Increased revenue and earnings despite passenger decline
 Flughafen Wien AG results in Q1 2015: Increased revenue and earnings despite passenger decline REVENUE up slightly to 140.7 million (+0.9%), EBITDA improved to 54.0 million (+1.4%) and EBIT rose to 21.9
Helloworld Travel Limited results announcement Half year ended 31 December 2017
 Helloworld Travel Limited results announcement Half year ended 31 December 2017 HIGHLIGHTS FOR THE HALF YEAR ENDED 31 DECEMBER 2017 Total Transaction Value (TTV) growth of 2.7% to $2.968 billion. Earnings
PRESS RELEASE VINCI QUARTERLY INFORMATION AT 31 MARCH 2015
 Rueil Malmaison, 23 April 2015 PRESS RELEASE VINCI QUARTERLY INFORMATION AT 31 MARCH 2015 Revenue: 8.2 billion (down 5.3%) Buoyant traffic at VINCI Autoroutes (up 2.0%) and VINCI Airports (up 11.8%) Decline
1 st Quarter Results FY
 1 st Quarter Results FY 2004-05 05 Q1 Highlights p Context 8Improving economic context 8Strong economic growth in Americas and Asia 8Modest economic recovery in Europe 8Soaring fuel prices 8IPE Brent up
Copa Holdings Reports Fourth Quarter and Full Year 2007 Results
 Copa Holdings Reports Fourth Quarter and Full Year 2007 Results Panama City, Panama --- February 21, 2008. Copa Holdings, S.A. (NYSE: CPA), parent company of Copa Airlines and Aero Republica, today announced
Record Result. 2006/07 Full Year Results Investor Presentation. Moved on successfully following bid. Profit before tax % to $1,032 million
 2006/07 Full Year Results Investor Presentation August 16 2007 Record Result Moved on successfully following bid Profit before tax + 53.8% to $1,032 million Group returning above Cost of Capital 2 Key
Investor Update Issue Date: April 9, 2018
 Investor Update Issue Date: April 9, 2018 This investor update provides guidance and certain forward-looking statements about United Continental Holdings, Inc. (the Company or UAL ). The information in
Volaris Reports Strong First Quarter 2015: 32% Adjusted EBITDAR Margin, 9% Operating Margin
 Volaris Reports Strong First Quarter 2015: 32% Adjusted EBITDAR Margin, 9% Operating Margin Mexico City, Mexico, April 22, 2015 Volaris* (NYSE: VLRS and BMV: VOLAR), the ultra-low-cost airline serving
Bilfinger Berger: Preliminary Report on the 2004 Financial Year
 Bilfinger Berger AG Carl-Reiss-Platz 1-5 68165 Mannheim Germany www.bilfingerberger.com Contact: Sascha Bamberger Phone: +49 6 21/4 59-24 55 Fax: +49 6 21/4 59-25 00 E-mail: sbam@bilfinger.de Date: February
Q Finnair s growth continued Pekka Vähähyyppä
 2018 Finnair s growth continued 25.10.2018 Pekka Vähähyyppä 1 We continued to develop our services and network New route to Los Angeles in 2019, two daily flights to Hong Kong New digital service for exploring