2017 NINE MONTHS RESULTS. November 10, 2017
|
|
|
- Aldous Chapman
- 6 years ago
- Views:
Transcription
1 2017 NINE MONTHS RESULTS November 10, 2017
2 Safe Harbor Statement This Presentation contains certain forward-looking statements. Forward-looking statements concern future circumstances and results and other statements that are not historical facts, sometimes identified by the words "believes," "expects," "predicts," "intends," "projects," "plans," "estimates," "aims," "foresees," "anticipates," "targets," and similar expressions. The forward-looking statements contained in this Presentation, including assumptions, opinions and views of the Company or cited from third party sources, are solely opinions and forecasts reflecting current views with respect to future events and plans, estimates, projections and expectations which are uncertain and subject to risks. Market data used in this Presentation not attributed to a specific source are estimates of the Company and have not been independently verified. These statements are based on certain assumptions that, although reasonable at this time, may prove to be erroneous. By their nature, forward-looking statements involve a number of risks, uncertainties and assumptions that could cause actual results or events to differ materially from those expressed or implied by the forward-looking statements. If certain risks and uncertainties materialize, or if certain underlying assumptions prove incorrect, Fincantieri may not be able to achieve its financial targets and strategic objectives. A multitude of factors which are in some cases beyond the Company s control can cause actual events to differ significantly from any anticipated development. Forward-looking statements contained in this Presentation regarding past trends or activities should not be taken as a representation that such trends or activities will continue in the future. No one undertakes any obligation to update or revise any forward-looking statements, whether as a result of new information, future events or otherwise. Market data used in this Presentation not attributed to a specific source are estimates of the Company and have not been independently verified. Forward-looking statements speak only as of the date of this Presentation and are subject to change without notice. No representations or warranties, express or implied, are given as to the achievement or reasonableness of, and no reliance should be placed on, any forward-looking statements, including (but not limited to) any projections, estimates, forecasts or targets contained herein. Fincantieri does not undertake to provide any additional information or to remedy any omissions in or from this Presentation. Fincantieri does not intend, and does not assume any obligation, to update industry information or forward-looking statements set forth in this Presentation. This presentation does not constitute a recommendation regarding the securities of the Company. Declaration of the Manager responsible for preparing financial reports Pursuant to art. 15-BIS, par. 2, of the Unified Financial Act of February 2, 1998, the executive in charge of preparing the corporate accounting documents at Fincantieri, Carlo Gainelli, declares that the accounting information contained herein correspond to document results, books and accounting records. 2
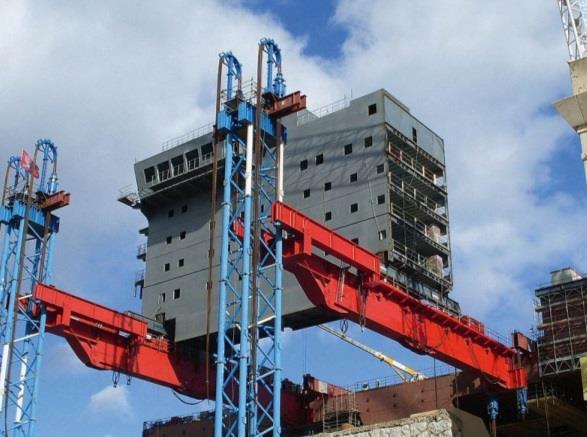
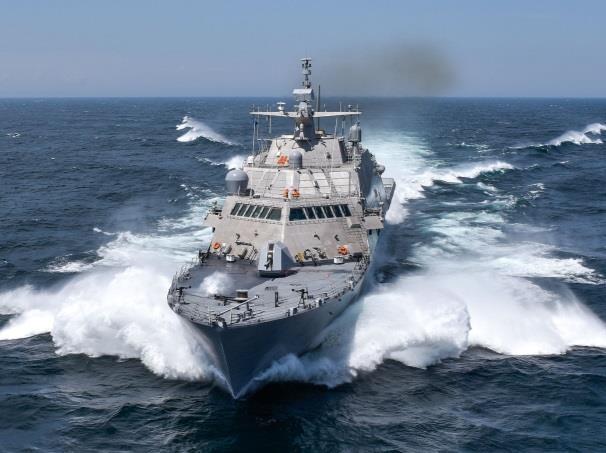
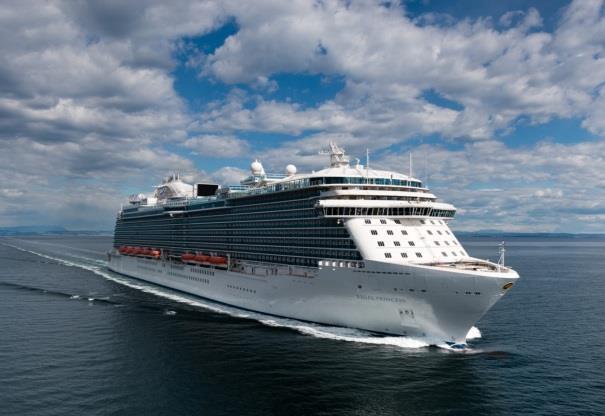
3 9M 2017 Key Messages 9M 2017 results in line with Business Plan targets: revenues up 10.7% vs 9M 2016 and EBITDA margin at 6.5% vs 5.7% 9M 2016 Total backlog (1) at 25.3 bln covering ~6 years of work if compared to 2016 revenues: Backlog at 20.3 bln (97 ships) up from 19.0 bln in 9M 2016 thanks to the conversion of soft backlog into firm orders Soft backlog (2) at 5.0 bln ( 2.8 bln in 9M 2016) Further commercial developments in cruise business with the conversion into order of a MoA for one cruise ship for the Princess Cruise brand, an order with Silversea for one cruise ship, a MoA with Carnival for one cruise ship for the luxury brand Cunard, for a total of 1 cruise ships (including options) acquired in 2017, in addition to a contract for the lengthening of the Silver Spirit ship Good operating performance confirmed with the delivery of nine units in the Shipbuilding segment: Four cruise ships: "Viking Sky", "Majestic Princess, Silver Muse and Viking Sun Three naval vessels: FREMM Rizzo, submarine Romeo Romei for Italian Navy and the LCS 9 for US Navy Two ATB units (Articulated Tug and Barge) for the transport of goods in the chemical/petroleum sector The cooperation agreement reached between the Italian and French governments will lead to the creation of a global leader in civil and military shipbuilding (1) Sum of backlog and soft backlog (2) Soft backlog which represents the value of existing contract options and letters of intent as well as contracts in advanced negotiation, none of which yet reflected in the order backlog 3


 1 cruise ship (sixth")


")
4 9M 2017 main orders Vessel Client Orders acquired in Q3 Delivery TBU cruise ships Norwegian Cruise Line Shipbuilding 1 cruise ship Holland America Line (Carnival Corporation) 1 cruise ship (sixth Royal Princess class vessel) Princess Cruises (Carnival Corporation) cruise ship Silversea Cruises krill fishing vessel Aker BioMarine live fish transportation vessel Fjordlaks Aqua 2018 Offshore 1 research expedition vessel Rosellinis Four-10 (wholly-owned by the industrialist Kjell Inge Røkke) expedition cruise vessel Coral Expeditions 2019


 Monfalcone Cruise ship")


5 9M 2017 main deliveries (1/2) Vessel Client Deliveries in Q3 Delivery Cruise ship Viking Sky Viking Ocean Cruises Ancona Cruise ship Majestic Princess Princess Cruises (Carnival Corporation) Monfalcone Cruise ship Silver Muse Silversea Cruises Sestri Ponente Shipbuilding FREMM Rizzo Italian Navy Muggiano Submarine Romeo Romei Italian Navy Muggiano Cruise ship Viking Sun Viking Ocean Cruises Ancona Littoral Combat Ship Little Rock (LCS 9) US Navy Marinette 5


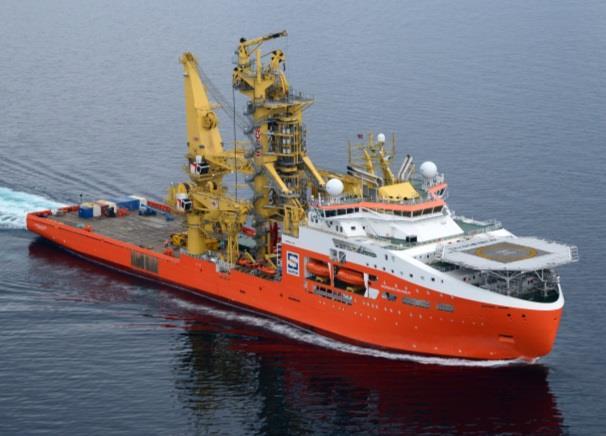
6 9M 2017 main deliveries (2/2) Vessel Client Deliveries in Q3 Delivery OSCV Skandi Buzios Techdof Vard Søviknes OSCV Far Superior Farstad Vard Vung Tau Offshore OSCV Skandi Vinland DOF Vard Langsten 2 Module Carrier Vessels Topaz Energy and Marine Vard Vung Tau 2 Module Carrier Vessels Kazmortransflot Vard Braila 6
7 Order intake and backlog by segment Order intake Total backlog (1) 2.0x 1.5x 5.2x 5.x 5.7x Backlog 18, Backlog 18, Backlog 20,299 (7) (31) (3) (697) (657) (800) (3) 9M 2016 FY M 2017 Shipbuilding Offshore Equipment, Systems & Services Eliminations Book-to-bill (Order intake / revenues) Total backlog / revenues Soft backlog (2) (1) Sum of backlog and soft backlog (2) Soft backlog represents the value of existing contract options and letters of intent as well as contracts in advanced negotiation, none of which yet reflected in the order backlog (3) For comparison purposes, 9M 2016 figures are restated following the redefinition of operating segments. Following the operational reorganization carried out in November 2016, the repair & conversion services, cabins & public areas business, as well as integrated systems business, all previously included in the Shipbuilding segment, have been relocated to the Equipment, Systems & Services segment starting from FY 2016 results. 7
8 Backlog deployment by segment and end market Shipbuilding Offshore Comments # ship deliveries (1) Cruise Naval (2) # ship deliveries 16 units delivered in 9M 2017, 1 units acquired in the period, 97 ships in backlog at September 30, Cruise: 23 vessels Deliveries up to 2025, stretching to 2027 in case of confirmation of the option for 2 ships for Norwegian Cruise Line Naval: 33 vessels Deliveries up to 2026, with 12 units scheduled after Offshore (3) : 1 vessels 7 expedition cruise vessels in backlog Additional 6 units scheduled after vessels in backlog Additional 12 units scheduled after vessels in backlog 1 vessels in backlog Delivered in 9M 2017 New orders in 9M 2017 (1) Articulated Tug Barge (ATB) is an articulated unit consisting of a barge and a tug, thus being counted as two vessels in one unit (2) Ships with length > 0 m (3) Offshore business generally has shorter production times and, as a consequence, shorter backlog and quicker order turnaround than Cruise and Naval 8
9 Revenues and EBITDA (1) by segment Revenues breakdown by segment (2) EBITDA and EBITDA margin 5.7% 6.5% % % 21.2% % % %.9% % % % % % 121 (186) (237) (3) (22) (2) (3) Shipbuilding Offshore Equipment, Systems & Services Shipbuilding Offshore Equipment, Systems & Services Eliminations % Total Other activities () % of Revenues (1) EBITDA is a Non-GAAP Financial Measure. The Company defines EBITDA as profit/(loss) for the period before (i) income taxes, (ii) share of profit/(loss) from equity investments, (iii) income/expense from investments, (iv) finance costs, (v) finance income, (vi) depreciation and amortization, (vii) wages guarantee fund Cassa Integrazione Guadagni, (viii) expenses for corporate restructuring, (ix) accruals to provision and cost of legal services for asbestos claims, (x) other non recurring items (2) Breakdown calculated on total revenues before eliminations (3) For comparison purposes, 9M 2016 figures are restated following the redefinition of operating segments. Following the operational reorganization carried out in November 2016, the repair & conversion services, cabins & public areas business, as well as integrated systems business, all previously included in the Shipbuilding segment, have been relocated to the Equipment, Systems & Services segment starting from FY 2016 results. () Other costs 9
10 Shipbuilding Revenues Comments EBITDA Capex , (1) 18 (1) % 5.0% 58 (1) 2, % 2.1% Other Shipbuilding Naval Cruise % of Revenues % of Revenues Revenues: 2,779 mln, up 19% vs 9M 2016 Growth of volumes in cruise reaching 51% of total Group revenues EBITDA: 18 mln, margin at 6.6% Further improvement due to the construction of cruise ships at higher margins, as well as to the improvement of production and design processes Capex: 58 mln 9M 2016 also saw upgrades at the Monfalcone yard Orders:,88 mln vs 5,133 mln in 9M 2016 cruise ships for Norwegian Cruise Line 1 cruise ship for Holland American Line 1 cruise ship for Princess Cruises 1 cruise ship for Silversea Cruises Backlog: 18,572 mln vs 17,022 mln in 9M 2016 Deliveries: 9 ships Viking Sky for Viking Ocean Cruises Majestic Princess for Princess Cruises Silver Muse for Silversea Cruises FREMM Rizzo and submarine Romeo Romei for Italian Navy Viking Sun for Viking Ocean Cruises LCS 9 for US Navy 2 ATB units (Articulated Tug and Barge) for Kirby Inland Marine (1) For comparison purposes, 9M 2016 figures are restated following the redefinition of operating segments. Following the operational reorganization carried out in November 2016, the repair & conversion services, cabins & public areas business, as well as integrated systems business, all previously included in the Shipbuilding segment, have been relocated to the Equipment, Systems & Services segment starting from FY 2016 results. 10
11 Offshore Revenues Comments Revenues: 666 mln, down 8% vs 9M 2016 Reduction of workload at Norwegian and Brasilian yards Positive effect of NOK/EUR exchange rate ( 10 mln) EBITDA: 33 mln, with margin at.9% Margins still do not yet fully benefit from the business diversification initiatives EBITDA Capex % 33.9% % of Revenues Capex: 28 mln Upgrades at Tulcea yard Orders: 86 mln vs 1,08 mln in 9M fishing vessel (1 for Aker BioMarine, 1 for Fjordlaks Aqua; 1 for Rosellinis Four-10) 2 Car- and Passenger Ferries for Torghattan Nord 1 Pelagic Trawler for Research Fishing Company 1 Expedition Cruise Vessel for Coral Expeditions Backlog: 1,300 mln vs 1,501 mln in 9M % % % of Revenues Deliveries: 7 ships Skandi Buzios for Techdof Far Superior for Farstad Skandi Vinland for DOF Topaz Amur and Topaz Belaya for Topaz Energy and Marine Barys and Berkut for Kazmortransflot 11
12 Equipment, Systems and Services Revenues EBITDA (1) Comments Revenues: 367 mln, up 1.9% vs 9M 2016 Despite the smaller contribution of ship conversion activities which benefited from the MSC Renaissance program in 9M 2016 EBITDA: 0 mln with margin at 11.0% Decrease due to the change in products/services mix vs 9M 2016 Orders: 65 mln vs 538 mln in 9M 2016 Backlog: 1,227 mln vs 1,151 mln in 9M % % % of Revenues Capex (1) 1.1% (1) 7 1.9% % of Revenues (1) For comparison purposes, 9M 2016 figures are restated following the redefinition of operating segments. Following the operational reorganization carried out in November 2016, the repair & conversion services, cabins & public areas business, as well as integrated systems business, all previously included in the Shipbuilding segment, have been relocated to the Equipment, Systems & Services segment starting from FY 2016 results. 12
13 Net working capital and net debt (1) Breakdown by main components Inventories and advances to suppliers Work in progress net of advances from customers Comments FY M 2017 Net working capital and net debt dynamics related to the production volumes in cruise and the cash-in of the final installments for the cruise ships delivered during the period Trade receivables Other current assets and liabilities Construction loans Trade payables Provisions for risks & charges (678) (868) (1.307) (1.526) (126) (13) Construction loans at 868 mln of which 615 mln related to VARD and 253 mln related to Fincantieri Most of the Group's debt is related to the financing of current assets associated with cruise ships construction and therefore consistent with net working capital changes Net working capital Net debt (1) Construction loans are committed working capital financing facilities, treated as part of Net working capital, not in Net financial position, as they are not general purpose loans and can be a source of financing only in connection with ship contracts 13
14 Outlook Shipbuilding Further increase of revenues in the last quarter of 2017 Delivery of a prototype for MSC, the largest ship ever built in Italy Italian Navy s fleet renewal program fully operational Full swing of design activities related to the Qatari order Offshore 2017 Guidance Crisis persisting in the Oil&Gas sector, although the first signs of a recovery in E&P investments VARD continues to implement the diversification actions already begun, as well as focusing on the products with greatest potential in its reference markets Equipment, Systems & Services Further increase of revenues in the last quarter of 2017 Deployment of the significant backlog related to the Italian Navy s fleet renewal program and to the Qatari order Commercial and organizational actions will be implemented to ensure stronger foothold and development of the after sales business in the cruise ship segment and in the most important geographical areas 1


15 Investor Relations contacts Investor Relations Team Cristiano Pasanisi VP Group Treasury, Corporate Finance & Investor Relations Matteo David Masi Head of Investor Relations Alberta Michelazzi Institutional Investors Individual Shareholders 15


16 Q&A 16
2016 HALF-YEAR RESULTS. 21 July 2016
 2016 HALF-YEAR RESULTS 21 July 2016 Safe Harbor Statement This Presentation contains certain forward-looking statements. Forward-looking statements concern future circumstances and results and other statements
Business Plan
 Business Plan 2018-2022 Safe Harbor Statement This Presentation contains certain forward-looking statements. Forward-looking statements concern future circumstances and results and other statements that
FINCANTIERI Investor Presentation. Trieste, September 2017
 FINCANTIERI Investor Presentation Trieste, September 2017 Safe Harbor Statement This Presentation contains certain forward-looking statements. Forward-looking statements concern future circumstances and
Investor Relations Update January 25, 2018
 General Overview Investor Relations Update Accounting Changes On January 1, 2018, the company adopted two new Accounting Standard Updates: (ASUs): ASU 2014-9: Revenue from Contracts with Customers (the
FINCANTIERI Investor Presentation. Trieste, April 2018
 FINCANTIERI Investor Presentation Trieste, April 2018 Safe Harbor Statement This Presentation contains certain forward-looking statements. Forward-looking statements concern future circumstances and results
Update on STX France. October, 2017
 Update on STX France October, 2017 Framework agreement between the Italian and French governments Overview The French and Italian Governments have reached an agreement aimed at facilitating the creation
Investor Relations Update October 25, 2018
 General Overview Investor Relations Update Revenue The company expects its fourth quarter total revenue per available seat mile (TRASM) to be up approximately 1.5 to 3.5 percent year-over-year. Fuel Based
FINCANTIERI Investor Presentation. Trieste, February 2017
 FINCANTIERI Investor Presentation Trieste, February 2017 Safe Harbor Statement This Presentation contains certain forward-looking statements. Forward-looking statements concern future circumstances and
M2 Group Ltd 2014 Interim Results
 M2 Group Ltd 2014 Interim Results 24 February 2014 Geoff Horth, CEO Presentation Content Record Financial Performance Strong Organic Growth FY14 Priorities and Guidance Slide 2, 24 February 2014 Record
Q3 FY18 Business Highlights
 Q3 FY18 RESULTS Q3 FY18 Business Highlights 1 2 3 4 5 6 7 Record passengers 7.1m, record revenues 423m Investing in growth 24% passenger growth in Q3 Disciplined cost management flat ex-fuel CASK Largest
MIRAMAR, Fla., April 29, 2015 (GLOBE NEWSWIRE) -- Spirit Airlines, Inc. (Nasdaq:SAVE) today reported first quarter 2015 financial results.
 -- Spirit Airlines, Inc. (Nasdaq:SAVE) today reported first quarter 2015 financial results.") April 29, 2015 Spirit Airlines Announces First Quarter 2015 Results; Adjusted Net Income Increases 87.1 Percent to $70.7 Million and Pre-Tax Margin Increases 900 Basis Points to 22.7 Percent MIRAMAR, Fla.,
April 29, 2015 Spirit Airlines Announces First Quarter 2015 Results; Adjusted Net Income Increases 87.1 Percent to $70.7 Million and Pre-Tax Margin Increases 900 Basis Points to 22.7 Percent MIRAMAR, Fla.,
Management Presentation. March 2016
 Management Presentation March 2016 Forward looking statements This presentation as well as oral statements made by officers or directors of Allegiant Travel Company, its advisors and affiliates (collectively
Second Quarter 2016 Presentation
 Second Quarter 2016 Presentation Scanship Holding ASA August 31, 2016 Henrik Badin CEO Christian Fr. Thyholdt - CFO Disclaimer This presentation (the Presentation ) has been produced by Scanship Holding
Copa Holdings Reports Record Earnings of US$41.8 Million for 4Q06 and US$134.2 Million for Full Year 2006
 Copa Holdings Reports Record Earnings of US$41.8 Million for 4Q06 and US$134.2 Million for Full Year 2006 Panama City, Panama --- March 7, 2007. Copa Holdings, S.A. (NYSE: CPA), parent company of Copa
Spirit Airlines Reports First Quarter 2017 Results
 Spirit Airlines Reports First Quarter 2017 Results MIRAMAR, Fla., April 28, 2017 - Spirit Airlines, Inc. (NASDAQ: SAVE) today reported first quarter 2017 financial results. GAAP net income for the first
Investor Update Issue Date: April 9, 2018
 Investor Update Issue Date: April 9, 2018 This investor update provides guidance and certain forward-looking statements about United Continental Holdings, Inc. (the Company or UAL ). The information in
4Q2016 Presentation. Henrik Badin CEO Erik Magelssen - CFO
 4Q2016 Presentation Henrik Badin CEO Erik Magelssen - CFO Disclaimer This presentation (the Presentation ) has been produced by Scanship Holding ASA ("Scanship" or the "Company") exclusively for information
INVESTOR PRESENTATION. Imperial Capital Global Opportunities Conference September 2015
 INVESTOR PRESENTATION Imperial Capital Global Opportunities Conference September 2015 Forward-looking Statements This presentation contains forward-looking statements within the meaning of the Private
Copa Holdings Reports Fourth Quarter and Full Year 2007 Results
 Copa Holdings Reports Fourth Quarter and Full Year 2007 Results Panama City, Panama --- February 21, 2008. Copa Holdings, S.A. (NYSE: CPA), parent company of Copa Airlines and Aero Republica, today announced
2nd quarter 2005: Status and outlook
 2nd quarter 2005: Status and outlook Oslo, 18 Agenda Aker Group update Leif-Arne Langøy, CEO Details 2Q05 financials Bengt A Rem, CFO Aker Seafoods 2Q status and outlook Yngve Myhre, CEO Aker American
Analyst and Investor Conference Call Q Ulrik Svensson, CFO and Member of the Executive Board
 Analyst and Investor Conference Call Q2 2017 Ulrik Svensson, CFO and Member of the Executive Board Frankfurt, 2 August 2017 Disclaimer The information herein is based on publicly available information.
OPERATING AND FINANCIAL HIGHLIGHTS
 Copa Holdings Reports Financial Results for the Fourth Quarter of 2018 Excluding special items, adjusted net profit came in at $44.0 million, or Adjusted EPS of $1.04 Panama City, Panama --- February 13,
Management Presentation. November 2018
 Management Presentation November 2018 Forward looking statements This presentation as well as oral statements made by officers or directors of Allegiant Travel Company, its advisors and affiliates (collectively
CONTACT: Investor Relations Corporate Communications
 NEWS RELEASE CONTACT: Investor Relations Corporate Communications 435.634.3200 435.634.3553 Investor.relations@skywest.com corporate.communications@skywest.com SkyWest, Inc. Announces Fourth Quarter 2017
INVESTOR PRESENTATION. May 2015
 INVESTOR PRESENTATION May 2015 Forward-looking Statements This presentation contains forward-looking statements within the meaning of the Private Securities Litigation Reform Act of 1995 that reflect the
OPERATING AND FINANCIAL HIGHLIGHTS. Subsequent Events
 Copa Holdings Reports Net Income of $103.8 million and EPS of $2.45 for the Third Quarter of 2017 Excluding special items, adjusted net income came in at $100.8 million, or EPS of $2.38 per share Panama
2Q 2017 Earnings Call. July 19, 2017
 2Q 2017 Earnings Call July 19, 2017 Safe Harbor Statement Certain statements included in this presentation are forward-looking and thus reflect our current expectations and beliefs with respect to certain
Thank you for participating in the financial results for fiscal 2014.
 Thank you for participating in the financial results for fiscal 2014. ANA HOLDINGS strongly believes that safety is the most important principle of our air transportation business. The expansion of slots
AIR CANADA REPORTS 2010 THIRD QUARTER RESULTS; Operating Income improved $259 million or 381 per cent from previous year s quarter
 AIR CANADA REPORTS 2010 THIRD QUARTER RESULTS; Operating Income improved $259 million or 381 per cent from previous year s quarter MONTRÉAL, November 4, 2010 Air Canada today reported operating income
Interim Report 6m 2014
 August 11, 2014 Interim Report 6m 2014 Investors and Analysts Conference Call on August 11, 2014 Joachim Müller, CFO Latest ad-hoc release (August 4, 2014) Reduction of forecast, primarily due to a further
ABX. Holdings, Inc. BB&T Transportation Conference. February 2008
 ABX Holdings, Inc. BB&T Transportation Conference February 2008 1 Safe Harbor Statement Except for historical information contained herein, the matters discussed in this presentation contain forward-looking
Copa Holdings Reports Net Income of $49.9 million and EPS of $1.18 for the Second Quarter of 2018
 Copa Holdings Reports Net Income of $49.9 million and EPS of $1.18 for the Second Quarter of 2018 Panama City, Panama --- Aug 8, 2018. Copa Holdings, S.A. (NYSE: CPA), today announced financial results
MGM Resorts International Reports Second Quarter Financial Results
 NEWS RELEASE MGM Resorts International Reports Second Quarter Financial Results 8/5/2014 Consolidated Adjusted EBITDA Increased 8%, Led By 10% Growth In Wholly Owned Domestic Resorts MGM China Declares
CONTACT: Investor Relations Corporate Communications
 NEWS RELEASE CONTACT: Investor Relations Corporate Communications 435.634.3200 435.634.3553 Investor.relations@skywest.com corporate.communications@skywest.com SkyWest, Inc. Announces Second Quarter 2017
Tiger Airways Holdings Limited FY11 Results
 Tiger Airways Holdings Limited FY11 Results May 2011 Financial Year Ended 31 March 2011 Disclaimer The information contained in this presentation (the "Information") is provided by Tiger Airways Holdings
OPERATING AND FINANCIAL HIGHLIGHTS
 Copa Holdings Reports Financial Results for the Fourth Quarter of 2015 Excluding special items, adjusted net income came in at $31.7 million, or EPS of $0.73 per share Panama City, Panama --- February
Spirit Airlines Reports Third Quarter 2017 Results
 Spirit Airlines Reports Third Quarter 2017 Results MIRAMAR, Fla., October 26, 2017 - Spirit Airlines, Inc. (NASDAQ: SAVE) today reported third quarter 2017 financial results. GAAP net income for the third
1Q 2017 Earnings Call. April 18, 2017
 1Q 2017 Earnings Call April 18, 2017 Safe Harbor Statement Certain statements included in this presentation are forward-looking and thus reflect our current expectations and beliefs with respect to certain
OPERATING AND FINANCIAL HIGHLIGHTS. Subsequent Events
 Copa Holdings Reports Financial Results for the First Quarter of 2016 Excluding special items, adjusted net income came in at US$69.9 million, or EPS of US$1.66 per share Panama City, Panama --- May 5,
Fourth Quarter 2015 Financial Results
 Fourth Quarter 2015 Financial Results AerCap Holdings N.V. February 23, 2016 Disclaimer Incl. Forward Looking Statements & Safe Harbor This presentation contains certain statements, estimates and forecasts
Half Year F1 Results. November 4, 2015
 Half Year F1 Results November 4, 2015 F17 Q1 Results 20 JULY 2016 Q1 BUSINESS HIGHLIGHTS Passenger growth of 18% to 5.8m pax on 17% seat growth Record underlying profit of 38.6m (+14%) despite Easter effect
Interim Report 3m Bilfinger Berger SE, Mannheim May 10, 2012 Joachim Müller, CFO
 Interim Report 3m 2012 Bilfinger Berger SE, Mannheim May 10, 2012 Joachim Müller, CFO Bilfinger Berger SE Interim report 3m 2012 May 10, 2012 Page 1 3m 2012: Highlights Growth in output volume and orders
Copa Holdings Reports Net Income of $57.7 million and EPS of $1.36 for the Third Quarter of 2018
 Copa Holdings Reports Net Income of $57.7 million and EPS of $1.36 for the Third Quarter of 2018 November 14, 2018 PANAMA CITY, Nov. 14, 2018 /PRNewswire/ -- Copa Holdings, S.A. (NYSE: CPA), today announced
FIRST QUARTER 2017 RESULTS. 4 May 2017
 FIRST QUARTER 2017 RESULTS 4 May 2017 A resilient start of the year, traffic up 4.2% 20.9 million passengers carried, up 5.2%, traffic (RPK) up 4.2%, capacity (ASK) up 3.3% and load factor up 0.7pts Confirmation
ABX HOLDINGS, INC. Shareholders Meeting. May 13, 2008
 Shareholders Meeting May 13, 2008 1 1 1 Safe Harbor Statement Except for historical information contained herein, the matters discussed in this presentation contain forward-looking statements that involve
Investor Update September 2017 PARTNER OF CHOICE EMPLOYER OF CHOICE INVESTMENT OF CHOICE
 Investor Update September 2017 PARTNER OF CHOICE EMPLOYER OF CHOICE INVESTMENT OF CHOICE 1 Forward Looking Statements In addition to historical information, this presentation contains forward-looking statements
CARNIVAL CORPORATION & PLC REPORTS SECOND QUARTER EARNINGS. Chairman and Chief Executive Officer Micky Arison commenting on these results:
 June 21, 2011 FOR IMMEDIATE RELEASE CARNIVAL CORPORATION & PLC REPORTS SECOND QUARTER EARNINGS Carnival Corporation & plc today reports earnings for the second quarter ended May 31, 2011. The earnings
1H 13 Results. July 25th, H 13 Results.
 July 25th, 2013 www.atresmediacorporacion.com 1 1H 13 Highlights According to Infoadex, Total Ad market declined by -14% in 1H 13 (TV and Radio down by -13% and -14% yoy respectively) Atresmedia Television
Management Presentation. November 2011
 Management Presentation November 2011 Forward looking statements This presentation as well as oral statements made by officers or directors of Allegiant Travel Company, its advisors and affiliates (collectively
9M 13 Results. October 31, M 13 Results.
 October 31, 2013 www.atresmediacorporacion.com 1 9M 13 Highlights According to Infoadex, Total Ad market declined by -12.6% in 9M 13 (TV and Radio down by -10.4% and -12.7% yoy respectively) Atresmedia
10TH ANNUAL WOLFE RESEARCH GLOBAL TRANSPORTATION CONFERENCE MAY 23, 2017
 1 10TH ANNUAL WOLFE RESEARCH GLOBAL TRANSPORTATION CONFERENCE MAY 23, 2017 SAFE HARBOR This presentation contains forward-looking statements within the meaning of the Private Securities Litigation Reform
IAG results presentation. Quarter One th May 2018
 IAG results presentation Quarter One 2018 4 th May 2018 Highlights Willie Walsh, Chief Executive Officer Highlights Another strong quarter performance with an operating profit of 280m (5.6% margin, +2.3pts)
Q4 & FY 2018 Financial Results
 Q4 & FY 2018 Financial Results FY 18 strong revenue growth and positive segment FCF at $134m All figures are segment figures used for management reporting (before non-recurring charges and IFRS 15), unless
Parques Reunidos Expands to Australia with the Acquisition of Wet n Wild Sydney July 2018
 Parques Reunidos Expands to Australia with the Acquisition of Wet n Wild Sydney July 2018 Disclaimer This document does not constitute or form part of any purchase, sales or exchange offer, nor is it an
Airbus. Tom Enders Airbus. 15 & 16 December 2011
 Airbus Tom Enders Airbus Global Investor Forum Global Investor Forum 15 & 16 December 2011 Safe Harbour Statement 2 Disclaimer This presentation includes forward-looking statements. Words such as anticipates,
Spirit Airlines Reports Third Quarter 2015 Pre-Tax Margin of 26.9 Percent
 October 27, 2015 Spirit Airlines Reports Third Quarter 2015 Pre-Tax Margin of 26.9 Percent MIRAMAR, Fla., Oct. 27, 2015 (GLOBE NEWSWIRE) -- Spirit Airlines, Inc. (NASDAQ:SAVE) today reported third quarter
PRESS RELEASE November 18, 2002 STAR CRUISES GROUP ANNOUNCES IMPROVED EARNINGS FOR THIRD QUARTER AND FIRST NINE MONTHS OF 2002
 PRESS RELEASE November 18, 2002 FOR IMMEDIATE RELEASE INTERNATIONAL STAR CRUISES GROUP ANNOUNCES IMPROVED EARNINGS FOR THIRD QUARTER AND FIRST NINE MONTHS OF 2002 Key points for the quarter and in comparison
Management Presentation. May 2013
 Management Presentation May 2013 Forward looking statements This presentation as well as oral statements made by officers or directors of Allegiant Travel Company, its advisors and affiliates (collectively
Spirit Airlines Reports Fourth Quarter and Full Year 2016 Results
 Spirit Airlines Reports Fourth Quarter and Full Year 2016 Results MIRAMAR, FL. (February 7, 2017) - Spirit Airlines, Inc. (NASDAQ: SAVE) today reported fourth quarter and full year 2016 financial results.
Preliminary Figures FY 2016
 February 14, 2017 Preliminary Figures FY 2016 Capital Markets Day 2017 Tom Blades (CEO) Disclaimer This presentation has been produced for support of oral information purposes only and contains forwardlooking
CONTACT: Investor Relations Corporate Communications
 NEWS RELEASE CONTACT: Investor Relations Corporate Communications 435.634.3200 435.634.3553 Investor.relations@skywest.com corporate.communications@skywest.com SkyWest, Inc. Announces Second Quarter 2016
OPERATING AND FINANCIAL HIGHLIGHTS SUBSEQUENT EVENTS
 Copa Holdings Reports Financial Results for the Third Quarter of 2016 Excluding special items, adjusted net income came in at $55.3 million, or adjusted EPS of $1.30 per share Panama City, Panama --- November
First Quarter Results August 31 st, 2006
 First Quarter Results 2006-07 August 31 st, 2006 Key features of the First Quarter Market context Sustained global economic growth, and a recovery in Europe Average jet fuel price of 691 $/t, up 25% year-on-year
Copa Holdings Reports Net Income of $136.5 million and EPS of $3.22 for the First Quarter of 2018
 Copa Holdings Reports Net Income of $136.5 million and EPS of $3.22 for the First Quarter of 2018 May 9, 2018 PANAMA CITY, May 9, 2018 /PRNewswire/ -- Copa Holdings, S.A. (NYSE: CPA), today announced financial
AIR CANADA REPORTS THIRD QUARTER RESULTS
 AIR CANADA REPORTS THIRD QUARTER RESULTS THIRD QUARTER OVERVIEW Operating income of $112 million compared to operating income of $351 million in the third quarter of 2007. Fuel expense increased 49 per
Copa Holdings Reports Net Income of US$51.9 Million for the Fourth Quarter of 2008 and US$152.2 Million for Full Year 2008
 Copa Holdings Reports Net Income of US$51.9 Million for the Fourth Quarter of 2008 and US$152.2 Million for Full Year 2008 Panama City, Panama --- February 19, 2009. Copa Holdings, S.A. (NYSE: CPA), parent
The Manager Company Announcements Australian Stock Exchange Limited Sydney NSW Dear Sir. Demerger of BHP Steel
 The Manager Company Announcements Australian Stock Exchange Limited Sydney NSW 2000 Dear Sir Demerger of BHP Steel At the time of the announcement of the creation of the DLC between BHP Limited and Billiton
FY 13 Results. February 26, FY 13 Results.
 February 26, 2014 www.atresmediacorporacion.com 1 FY 13 Highlights According to external sources, Total Ad market declined by -8.0% in 2013 (TV and Radio down by -6.2% and -11.0% yoy respectively) Atresmedia
JP Morgan Aviation, Transportation and Industrials Conference MARCH 15, 2017
 JP Morgan Aviation, Transportation and Industrials Conference MARCH 15, 2017 1 1 SAFE HARBOR This presentation contains forward-looking statements within the meaning of the Private Securities Litigation
SkyWest, Inc. Announces First Quarter 2018 Profit
 NEWS RELEASE CONTACT: Investor Relations Corporate Communications 435.634.3200 435.634.3553 Investor.relations@skywest.com corporate.communications@skywest.com SkyWest, Inc. Announces First Quarter 2018
Jazz Air Air Income Fund Fund
 Jazz Air Air Income Fund Fund JOE RANDELL National President Bank Financial & CEOInc. Fifth Annual Transportation NATHALIE & Logistics MEGANN Conference Director, - Toronto Corporate Communications and
Adjusted net income of $115 million versus an adjusted net loss of $7 million in the second quarter of 2012, an improvement of $122 million
 Air Canada Reports Record Second Quarter 2013 Results Highest Adjusted Net Income, Operating Income and EBITDAR Results for Second Quarter in Air Canada s History Adjusted net income of $115 million versus
RESULTS RELEASE 20 August GENTING HONG KONG GROUP ANNOUNCES FIRST HALF RESULTS FOR 2015 Highlights
 RESULTS RELEASE 20 August 2015 FOR IMMEDIATE RELEASE INTERNATIONAL GENTING HONG KONG GROUP ANNOUNCES FIRST HALF RESULTS FOR 2015 Highlights The commentary below is prepared based on a comparison of the
Parques Reunidos Corporate Presentation March 2016
 Parques Reunidos Corporate Presentation March 216 Disclaimer The information contained in this presentation (the Presentation ), including but not limited to forward-looking statements, is provided as
Citi Industrials Conference
 Citi Industrials Conference June 13, 2017 Andrew Levy Executive Vice President and Chief Financial Officer Safe Harbor Statement Certain statements included in this presentation are forward-looking and
Investor Presentation
 TUI Group Investor Presentation WestLB Deutschland Conference 2010 17 November 2010 TUI AG Investor Relations Seite 1 Future-related related statements This presentation contains a number of statements
Wizz Air aims to increase market share with F17 capacity growth of 20% Q3 passenger growth of 20%, Load Factor of 88% (+2.3ppt)
") Q3 F17 FINANCIAL RESULTS 1 FEBRUARY 2017 BUSINESS HIGHLIGHTS Current market conditions favour ULCCs Wizz Air aims to increase market share with F17 capacity growth of 20% Q3 passenger growth of 20%, Load
Q3 F17 FINANCIAL RESULTS 1 FEBRUARY 2017 BUSINESS HIGHLIGHTS Current market conditions favour ULCCs Wizz Air aims to increase market share with F17 capacity growth of 20% Q3 passenger growth of 20%, Load
Cebu Air, Inc. 2Q2014 Results of Operation
 Cebu Air, Inc. 2Q2014 Results of Operation 1 Disclaimer This information provided in this presentation is provided only for your reference. Such information has not been independently verified and, as
AIR CANADA REPORTS FULL YEAR AND FOURTH QUARTER 2010 RESULTS
 AIR CANADA REPORTS FULL YEAR AND FOURTH QUARTER 2010 RESULTS Record annual EBITDAR of $1.386 billion, 104 per cent improvement Operating income improvement of $677 million Employees to receive special
E190 REPLACEMENT & FLEET UPDATE JULY 11, 2018
 1 E190 REPLACEMENT & FLEET UPDATE JULY 11, 2018 SAFE HARBOR This presentation contains forward-looking statements within the meaning of the Private Securities Litigation Reform Act of 1995, Section 27A
Spirit Airlines Reports First Quarter 2018 Results
 Spirit Airlines Reports First Quarter 2018 Results MIRAMAR, Fla., April 26, 2018 - Spirit Airlines, Inc. (NYSE: SAVE) today reported first quarter 2018 financial results. For the first quarter 2018, Spirit
Management Presentation. September 2011
 Management Presentation September 2011 Forward looking statements This presentation as well as oral statements made by officers or directors of Allegiant Travel Company, its advisors and affiliates (collectively
World-Class. World-Wide.
 World-Class. World-Wide. FINCANTIERI MARINETTE MARINE FINCANTIERI BAY SHIPBUILDING FINCANTIERI ACE MARINE Complete Marine Solutions. Complete Marine Solutions. Complete Marine Solutions. Complete Marine
Joe Randell President and Chief Executive Officer Jolene Mahody Executive Vice President and Chief Financial Officer
 Joe Randell President and Chief Executive Officer Jolene Mahody Executive Vice President and Chief Financial Officer Nathalie Megann Vice President, Investor Relations and Corporate Affairs December, 2015
Fourth Quarter and Full Year 2009
 Investor and analyst meeting: Fourth Quarter and Full Year 29 25 th February 21 2 The views expressed here contain some information derived from publicly available sources that have not been independently
WÄRTSILÄ CORPORATION RESULT PRESENTATION JANUARY Björn Rosengren, President & CEO. Wärtsilä
 WÄRTSILÄ CORPORATION RESULT PRESENTATION 2014 29 JANUARY 2015 Björn Rosengren, President & CEO Wärtsilä Highlights 2014 good performance in challenging markets Order intake EUR 5,084 million, +5% Net sales
Forward-looking Statements
 September 21, 2011 Forward-looking Statements This presentation contains certain forward-looking statements with respect to the Corporation. These forward-looking statements, by their nature, necessarily
Annual General Meeting
 Annual General Meeting Aker Philadelphia Shipyard ASA Oslo, 2 April 2009 Presentation of Business Activities Aker Philadelphia Shipyard ASA Slide 2 Company Overview A U.S. shipyard that utilizes state-of-the-art
OPERATING AND FINANCIAL HIGHLIGHTS
 Copa Holdings Reports Net Income of US$32.0 Million and EPS of US$0.72 for the Second Quarter of 2012 Excluding special items, adjusted net income came in at $58.6 million, or EPS of $1.32 per share Panama
Quarterly Interim Management Statement. Three Months to June 30, 2015
 Quarterly Interim Management Statement Three Months to June 30, 2015 BUSINESS HIGHLIGHTS FOR Q1 Record Q1 profitability despite negative Easter effect Lower unit costs further increasing our cost advantage
1 sur 8 21/12/ :08
 1 sur 8 21/12/2010 17:08 Print Page Close Window Press Release Carnival Corporation & plc Reports Fourth Quarter and Full Year Earnings MIAMI, Dec. 21, 2010 /PRNewswire via COMTEX/ -- Carnival Corporation
SKYWEST, INC. ANNOUNCES THIRD QUARTER 2014 RESULTS
 NEWS RELEASE For Further Information Contact: Investor Relations Telephone: (435) 634-3203 Fax: (435) 634-3205 FOR IMMEDIATE RELEASE: October 29, 2014 SKYWEST, INC. ANNOUNCES THIRD QUARTER 2014 RESULTS
OPERATING AND FINANCIAL HIGHLIGHTS. Subsequent Events
 Copa Holdings Reports Net Income of US$113.1 Million and EPS of US$2.57 for the First Quarter of 2015 Excluding special items, adjusted net income came in at US$106.0 million, or EPS of US$2.41 per share
Spirit Airlines Reports Second Quarter 2018 Results
 Spirit Airlines Reports Second Quarter 2018 Results MIRAMAR, Fla., July 25, 2018 - Spirit Airlines, Inc. (NYSE: SAVE) today reported second quarter 2018 financial results. GAAP net income for the second
OPERATING AND FINANCIAL HIGHLIGHTS
 Copa Holdings Reports Net Income of US$18.6 Million and EPS of US$0.42 for the Second Quarter of 2010 Excluding special items, adjusted net income came in at $26.3 million, or $0.60 per share Panama City,
J.P. Morgan Aviation, Transportation and Industrials Conference
 J.P. Morgan Aviation, Transportation and Industrials Conference March 3, 08 Scott Kirby President Safe Harbor Statement Certain statements included in this presentation are forward-looking and thus reflect
Spirit Airlines Reports Highest Second Quarter Pre-Tax Margin in Company History
 July 24, 2013 Spirit Airlines Reports Highest Second Quarter Pre-Tax Margin in Company History MIRAMAR, Fla., July 24, 2013 (GLOBE NEWSWIRE) -- Spirit Airlines, Inc. (Nasdaq:SAVE) today reported second
Management Presentation. August 2012
 Management Presentation August 2012 Forward looking statements This presentation as well as oral statements made by officers or directors of Allegiant Travel Company, its advisors and affiliates (collectively
HK GAAP RESULTS RELEASE 12 August 2008 STAR CRUISES GROUP ANNOUNCES FIRST HALF RESULTS FOR 2008
 HK GAAP RESULTS RELEASE 12 August 2008 FOR IMMEDIATE RELEASE INTERNATIONAL STAR CRUISES GROUP ANNOUNCES FIRST HALF RESULTS FOR 2008 The below commentary is prepared based on the comparison of the results
PLC. IFRS Summary Financial Statement (excluding Directors Report and Directors Remuneration Report) Year ended November 30, 2006
 Year ended November 30, 2006") C A R N I V A L PLC IFRS Summary Financial Statement (excluding Directors Report and Directors Remuneration Report) Year ended November 30, 2006 Registered number: 4039524 The standalone Carnival plc consolidated
C A R N I V A L PLC IFRS Summary Financial Statement (excluding Directors Report and Directors Remuneration Report) Year ended November 30, 2006 Registered number: 4039524 The standalone Carnival plc consolidated