February SAT Passenger Count was Up 6% Over February 2015 YTD thru February 2016 Total Passengers Increased 5% over Same 2015 Period
|
|
|
- Ashlyn Gibbs
- 5 years ago
- Views:
Transcription

 total passenger number (1,235,900) was 4.")

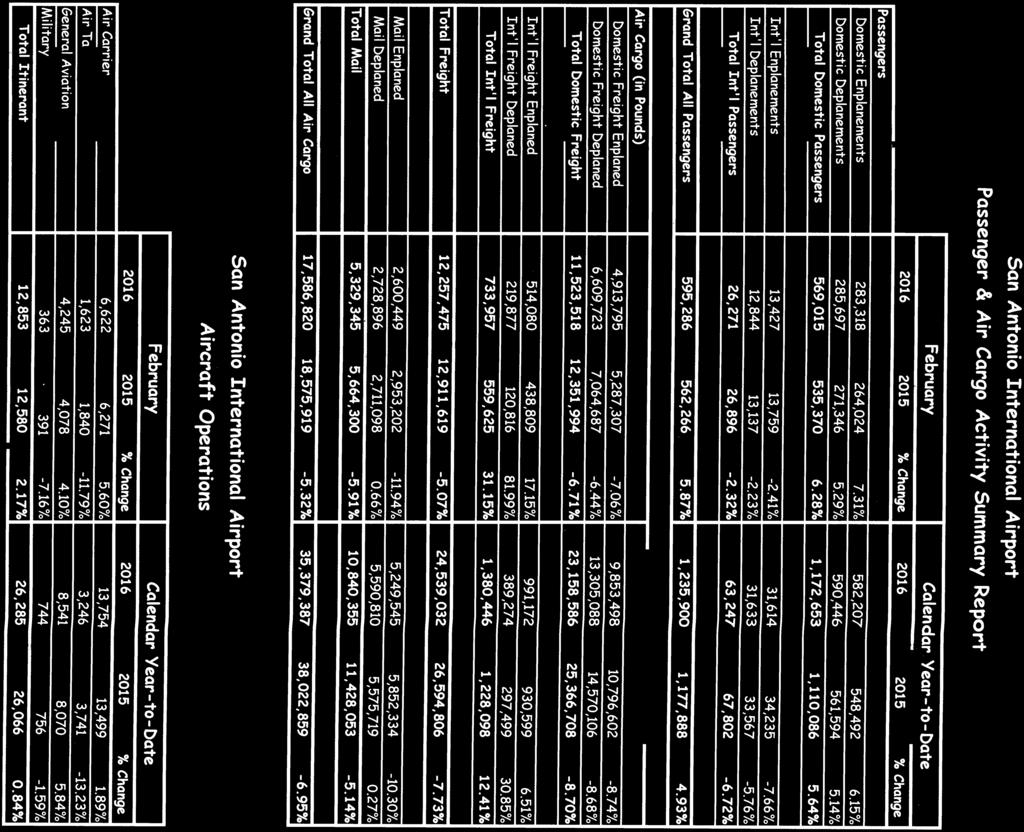
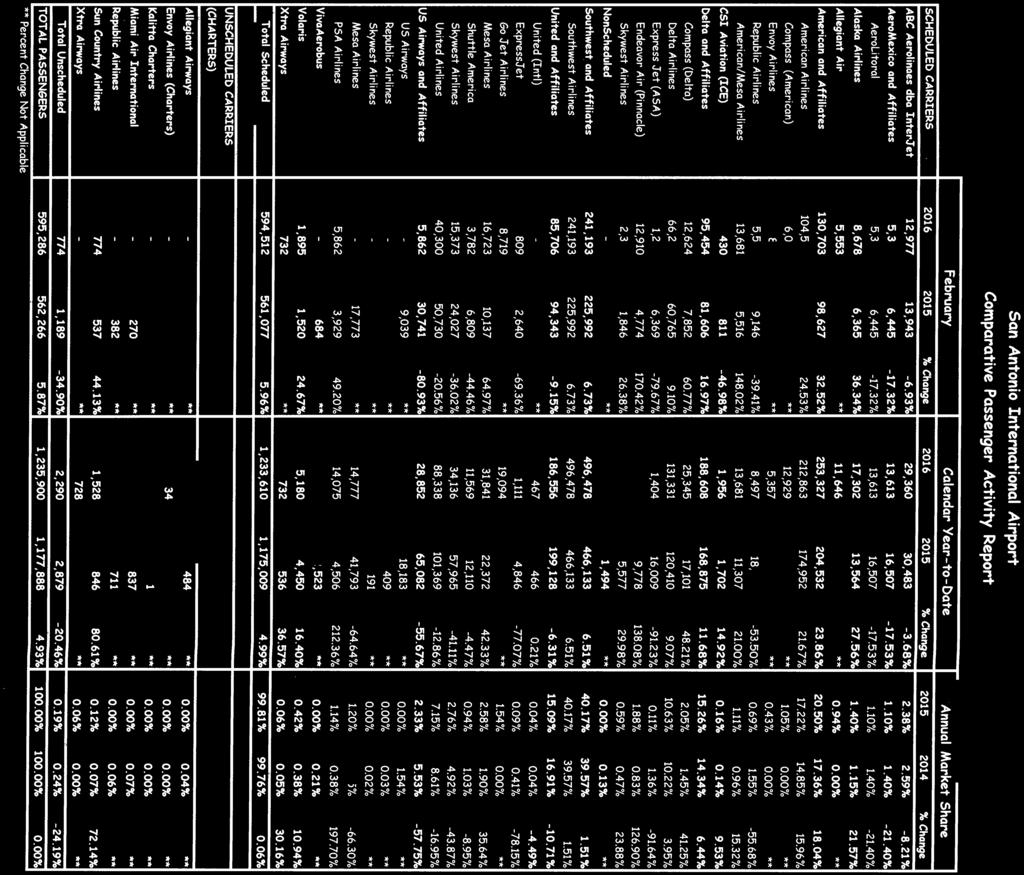
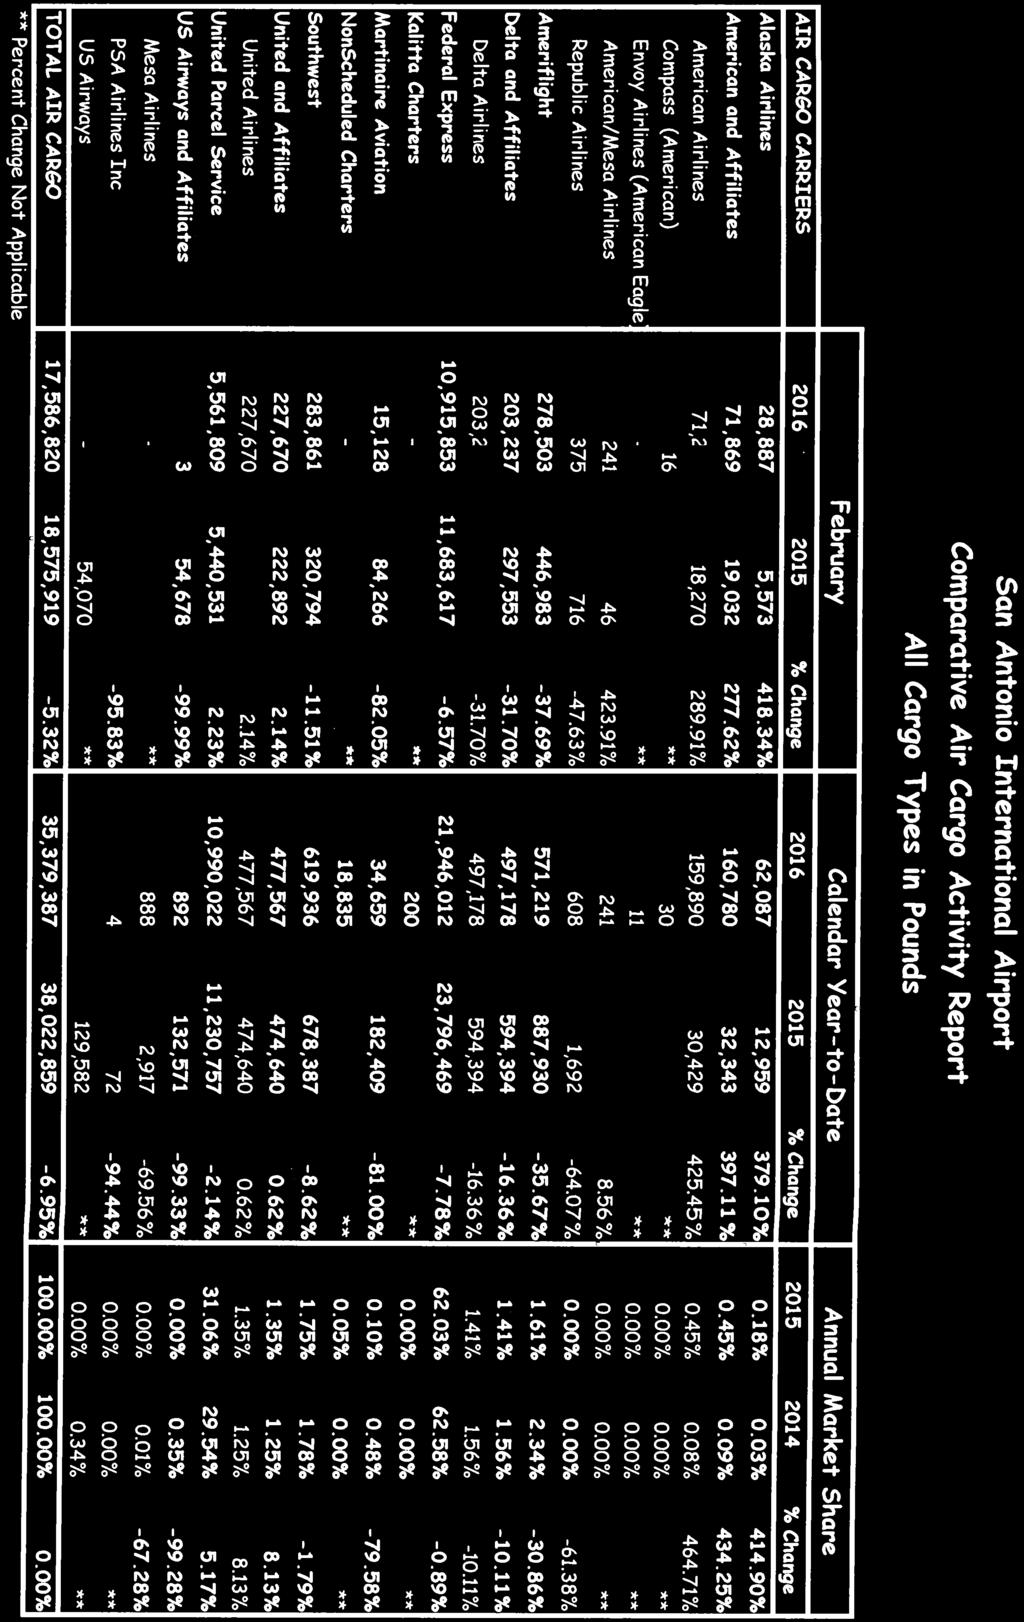
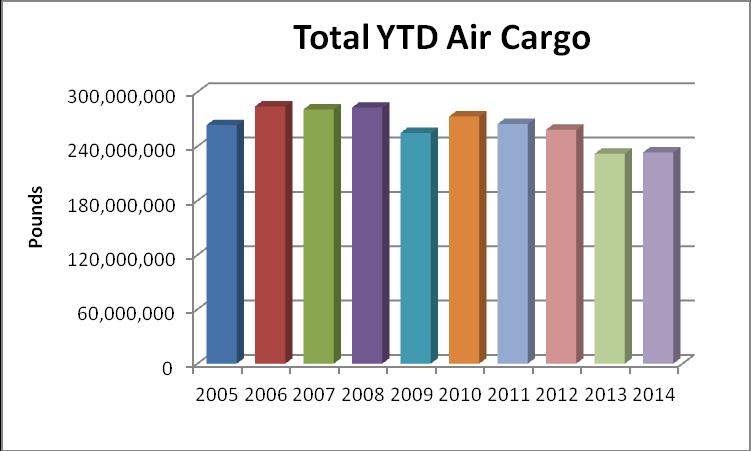
1 February SAT Passenger Count was Up 6% Over February 2015 YTD thru February 2016 Total Passengers Increased 5% over Same 2015 Period The February 2016 San Antonio International Airport (SAT) passenger count (595,286) increased 5.9% over February The Year-to-Date (YTD) total passenger number (1,235,900) was 4.9% higher than the same YTD period in The YTD domestic passenger total was up 5.6% over YTD February 2015, while the international passenger count was down 6.7%. February 2016 YTD total air cargo (35,379,387 pounds in air freight and mail) was 7% lower than the same YTD period in 2015.

2


3

4
5 SAT January 2015 Passengers Increased 1.3% over Same Month in 2014 SAT International Passenger Count was 9.1% Higher than January 2014 Total January 2015 passengers (615,622) increased 1.3% compared to January Domestic passengers (574,716) were up 0.8% over January 2014, while international passengers (40,906) increased 9.1%. The international passenger count was the highest ever recorded for January and included scheduled Mexican service and Canadian passenger charters. Air Cargo (19,446,940 in pounds) for January 2015 showed a 0.25% decline from January ,000,000 Total YTD Air Cargo Pounds 20,000,000 15,000,000 10,000,000 5,000,
6
7
8
 in 2015 increased 1.")
 increased 10.1%.")
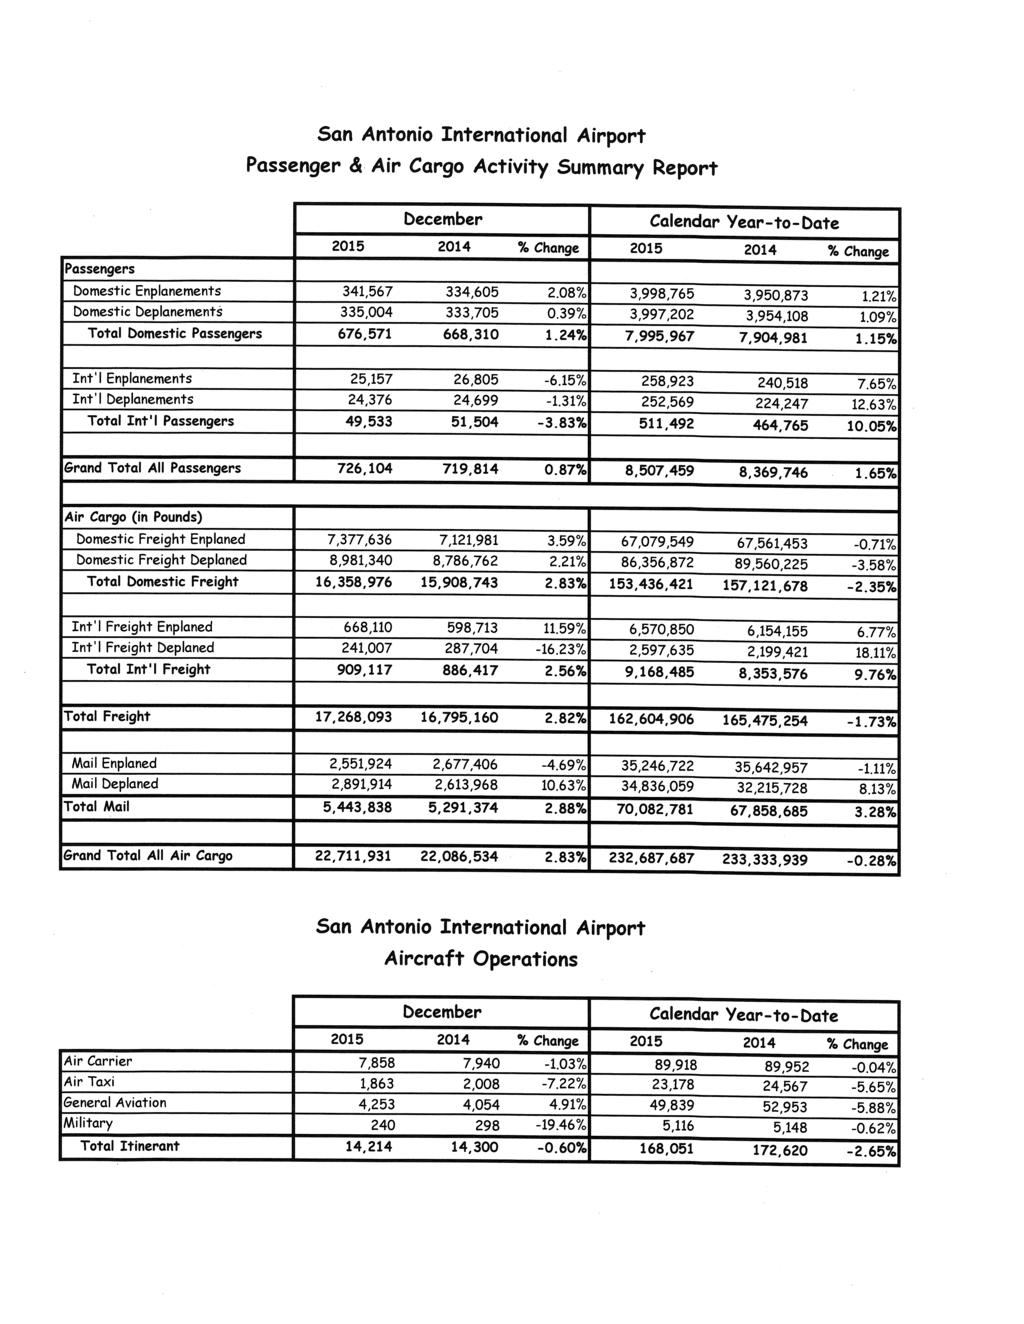
9 SAT Ends 2015 with a Record Total Passenger Count 8.5 Million Up 1.6% from 2014 International Passengers Set a New SAT Record - Over 500,000, up 10% from 2014 The total SAT passenger count (8,507,459) in 2015 increased 1.6% over The annual total domestic passenger count (7,995,967) increased 1.2% compared to January-December 2014, while the international passenger number (511,492) increased 10.1%. For the month of December 2015, the total passenger count (726,104) was up 0.9% compared to the same month in January-December 2015 total air cargo (232,687,687 pounds) was unchanged when compared to 2014.
10
11
12
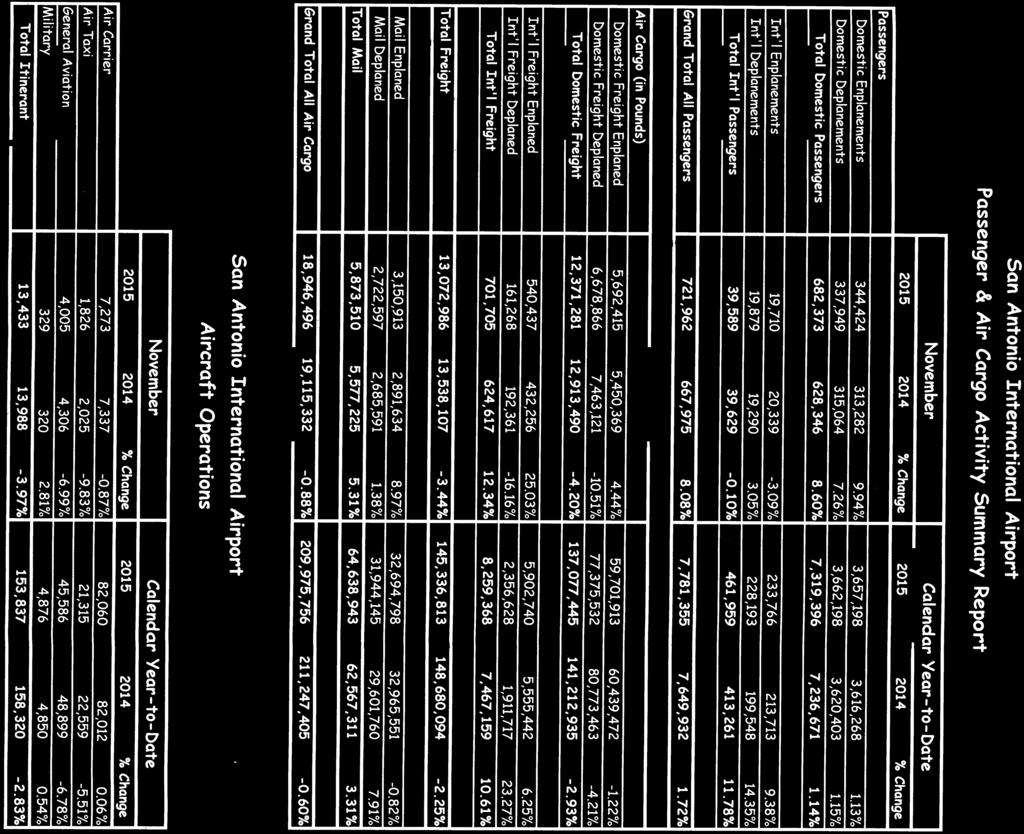
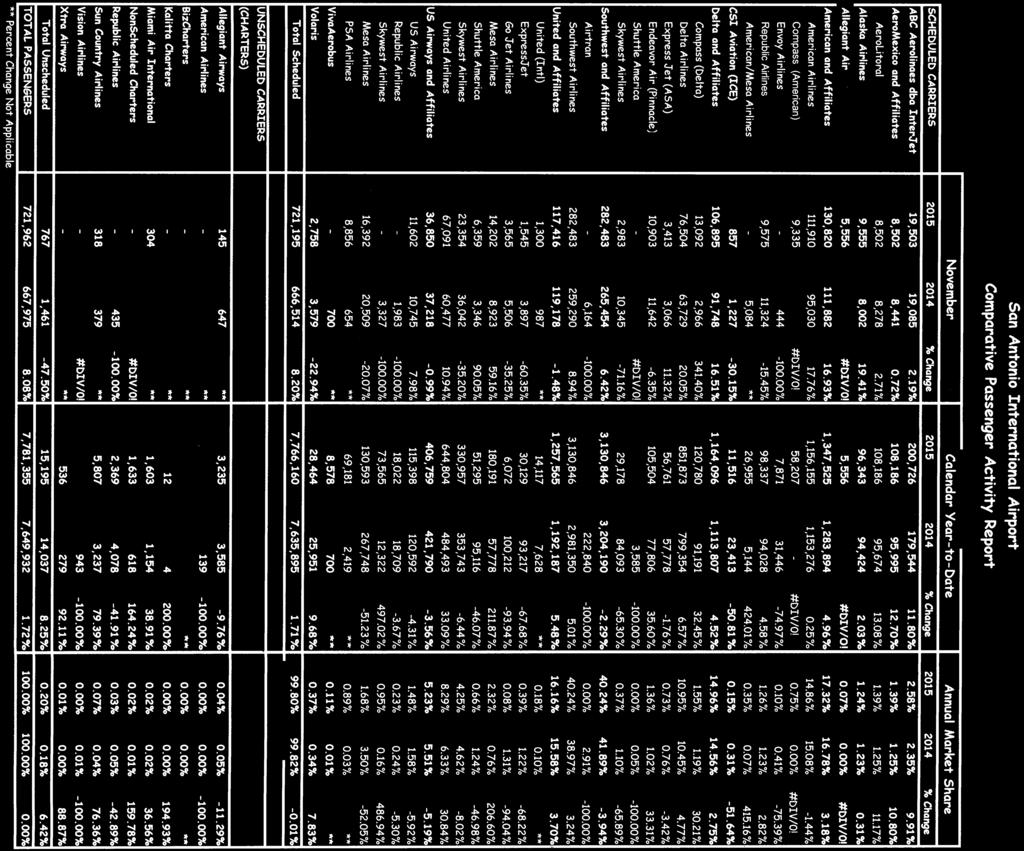
13 YTD Total Passenger Traffic through November 2015 Up 1.7% From 2014 Total International Passenger Count Up 11.8% Over YTD 2014 The total SAT year-to-date (YTD) passenger count (7,781,355) through November 2015 increased 1.7% compared to the same period in The YTD total domestic passenger count (7,319,396) increased 1.1% compared to January-November 2014, while the international passenger number (461,959) increased 11.8%. For the month of November 2015, the total passenger count (721,962) was up 8.1% compared to the same month in Total YTD Domestic Passengers Total YTD Int'l Passengers 8,000, ,000 6,400, ,000 4,800, ,000 3,200, ,000 1,600, , January-November 2015 total air cargo (209,975,756 pounds) was down 0.60% compared to the same elevenmonth period in ,000,000 Total YTD Air Cargo 220,000,000 Pounds 165,000, ,000,000 55,000,
14
15
16 San Antonio International Airport Comparative Air Cargo Activity Report All Cargo Types in Pounds AIR CARGO CARRIERS 2015 Alaska Airlines 23,907 American and Affiliates 55,468 American Airlines 52,961 Compass (American) 1,337 Envoy Airlines (American Eagle) American/Mesa Airlines Republic Airlines 1,170 Ameriflight 278,111 belta and Affiliates 311,817 Delta Airlines 311,817 Federal Express 11,825,019 Kalitta Charters 31,460 Martinaire Aviation 16,930 NonScheduled Charters - Sauthwest 386,167 Vnited and Affiliates 420,762 Continental Airlines United Airlines 420,762 Vnited Parcel Service 5,563,536 VS Airways and Affiliates 33,319 Mesa Airlines 595 PSA Airlines Inc 145 Republic Airlines Skywest Airlines - US Airways 32,579 TOT AL AIR CARGO 18,946,496 Percent Change Not Applicable November Calendar Year-to-Date 2014 % Change % Change 6, % 206,333 62, % 19, % 486, , % 18, ,792 91, % #DIV/0! 4,722 - #DIV/0! % % 10,463 9, % 448, % 4,374,856 5,238, % 249, % 3,406,745 2,924, % 249, ,406,745 2,924, % 11,792, % 130,271, ,234, % 5, , , % 112, % 452,334 1,312, % ,864 17, % 380, % 4,561,462 4,782, % 204, % 3,742,046 1,829, % , % 3,742,046 1,829, % 5,819, % 61,900,467 61,786, % 77, % 457, , % 2, % 10,144 26, % -.. 1, % % % 74, % 445, , ,115, % 209,975, ,247, % Annual Market Share % Change 0. 10% 0.03% % 0.23% 0. 05% % 0.22% 0.04% % 0.00% 0.00% #DIV/0! % 0.00% % 0.00% 0.00% 0.00% 0.00% 9.29% 2. 08% 2.48% % 1. 62% 1.38% 17.19% % 17.19% % 62.60% % 0. 04% 0.07% % 0.22% 0.62% % 0.01% 0.01% 61.60% 2.17% 2. 26% -4.04% 1.78% 0. 87% % 0.00% 0.00% % 0.87% % 29.48% 29.25% 0. 79% 0. 22% 0.38% % 0.00% % 0.00% 0.00% % 0.00% % 0.00% 0.00% % 0.21% 0.37% % % % 0.00%,.
 total passenger count (4,975,582) for the first seven months in 2015")
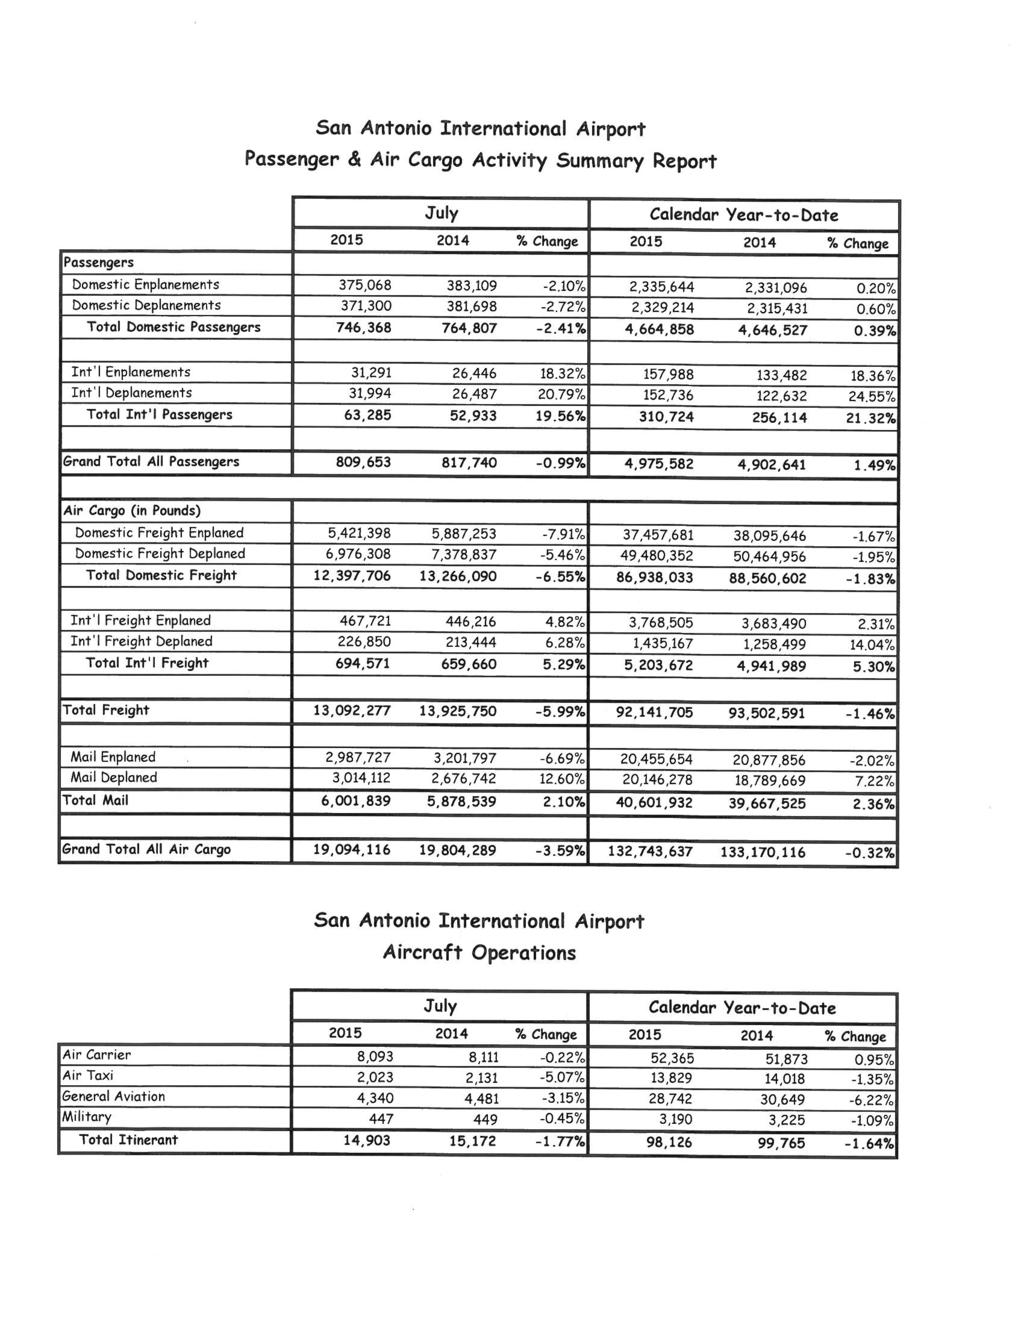
17 Total SAT Passenger Traffic for January-July 2015 YTD Increased 1.5% Compared to January-July 2014 Total International Passenger Count was Up 21% Over the Same YTD 2014 Period Year-to-date (YTD) total passenger count (4,975,582) for the first seven months in 2015 was up 1.5% compared to the same seven-month period in For the same period, 2015 YTD domestic passenger count (4,664,858) increased 0.4% compared to January-July 2014, while the international passenger numbers (310,724) increased 21.3%. For the month of July 2015, the total passenger count (809,653) was down 1.0% compared to July Total YTD Domestic Passengers Total YTD Int'l Passengers 4,250, ,000 3,400, ,000 2,550, ,000 1,700, , ,000 50, January-July 2015 total air cargo (132,743,637 pounds) decreased 0.32% compared to the same period in ,000,000 Total YTD Air Cargo 120,000,000 Pounds 90,000,000 60,000,000 30,000,
18
19
20
 increased 0.9% and international passengers (197,950) increased 23.1%.")

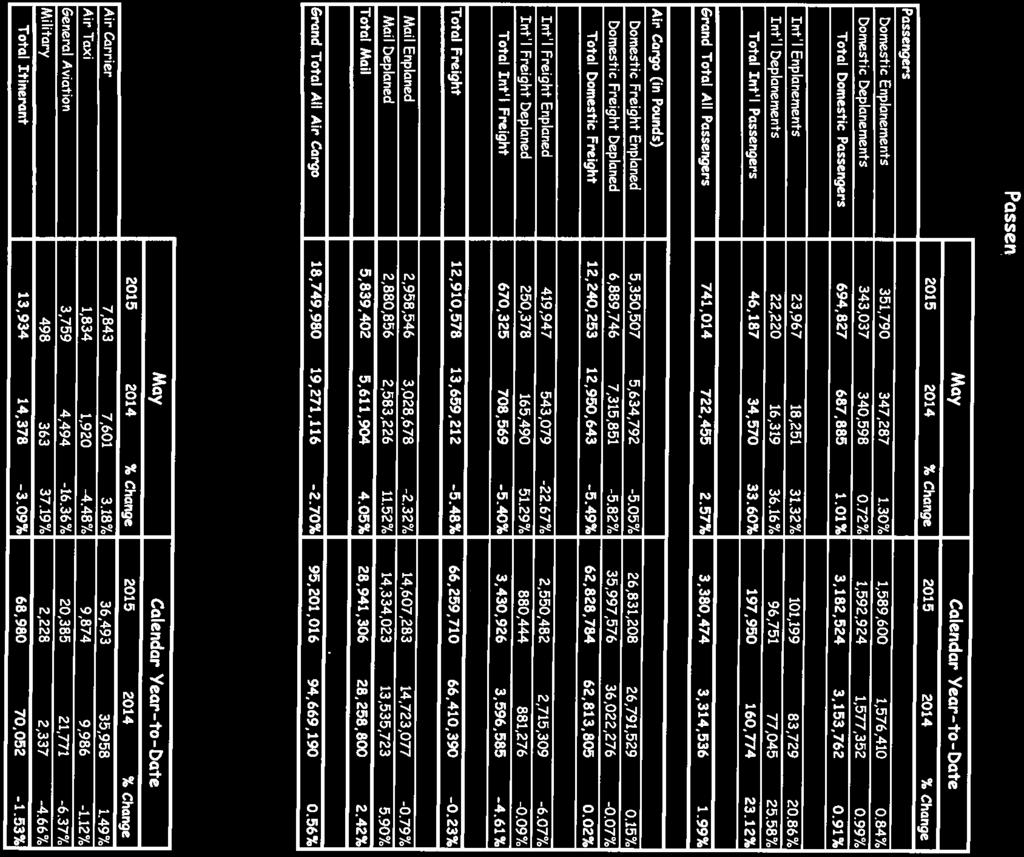
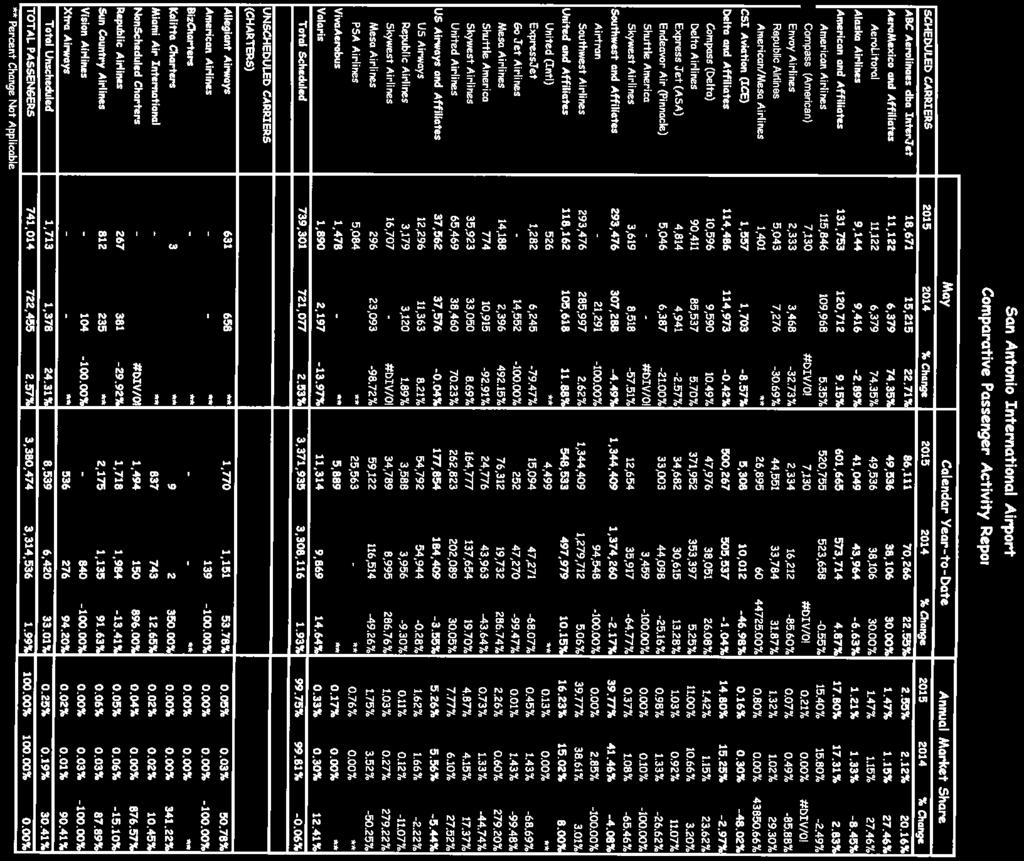
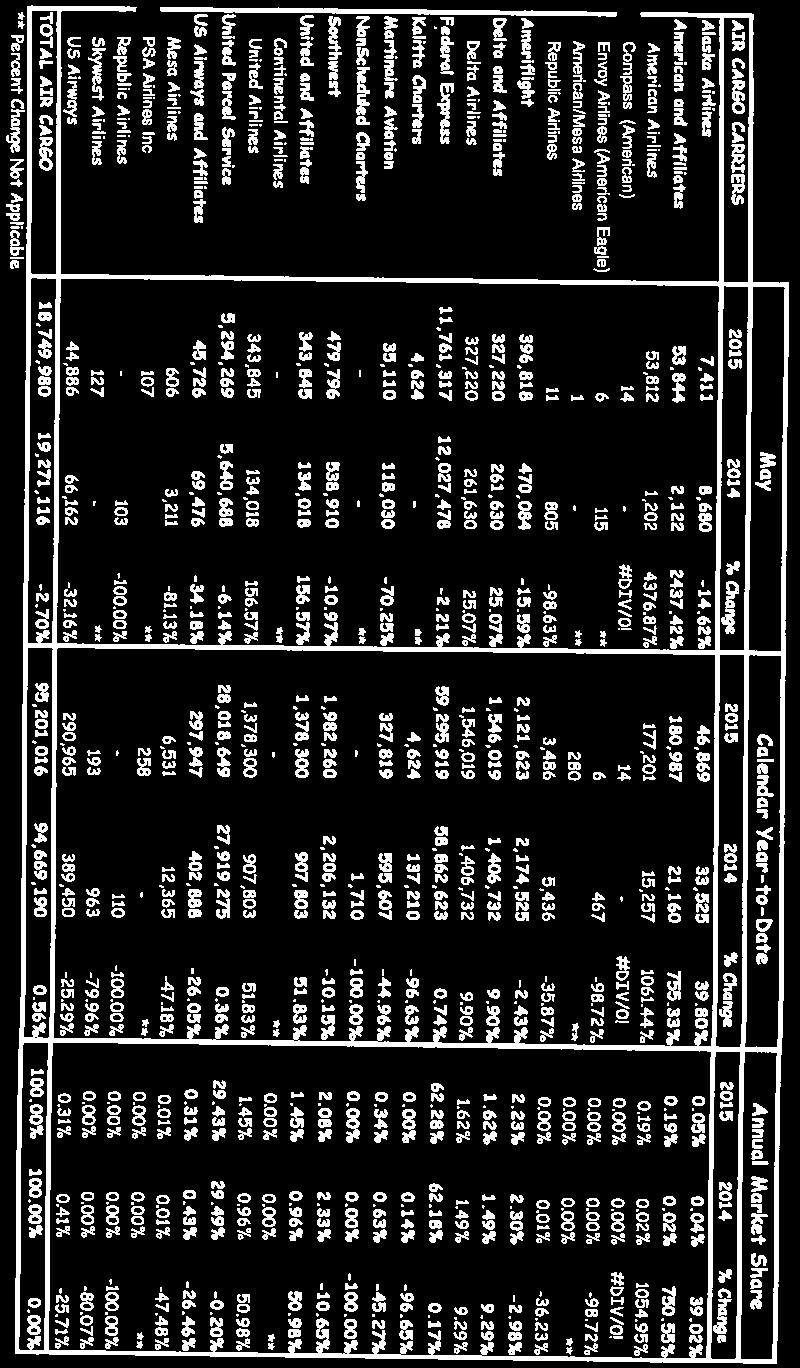
21 2015 Y-T-D thru May SAT Passengers Up 2% over Same Period in Y-T-D SAT International Passenger Count was Up 23% Year-to-date (Y-T-D) total passenger numbers (3,380,474) through May 2015 were up 2% compared to the same five-month period in The Y-T-D domestic passenger count (3,182,524) increased 0.9% and international passengers (197,950) increased 23.1%. For the month of May 2015, the total passenger count (741,014) was up 2.6% compared to May Total YTD Domestic Passengers Total YTD Int'l Passengers 3,500, ,000 2,800, ,000 2,100, ,000 1,400,000 80, ,000 40, For the January-May 2015 time period, SAT total air cargo pounds (95,201,016) increased 0.6%% when compared to the same five months in ,000,000 Total YTD Air Cargo 100,000,000 Pounds 75,000,000 50,000,000 25,000,

22
23

24
 total passenger numbers (2,639,460) through April 2015 were up 1.8% compared to the same four-month period in 2014. The Y-T-D domestic passenger count (2,487,697) increased 0.")
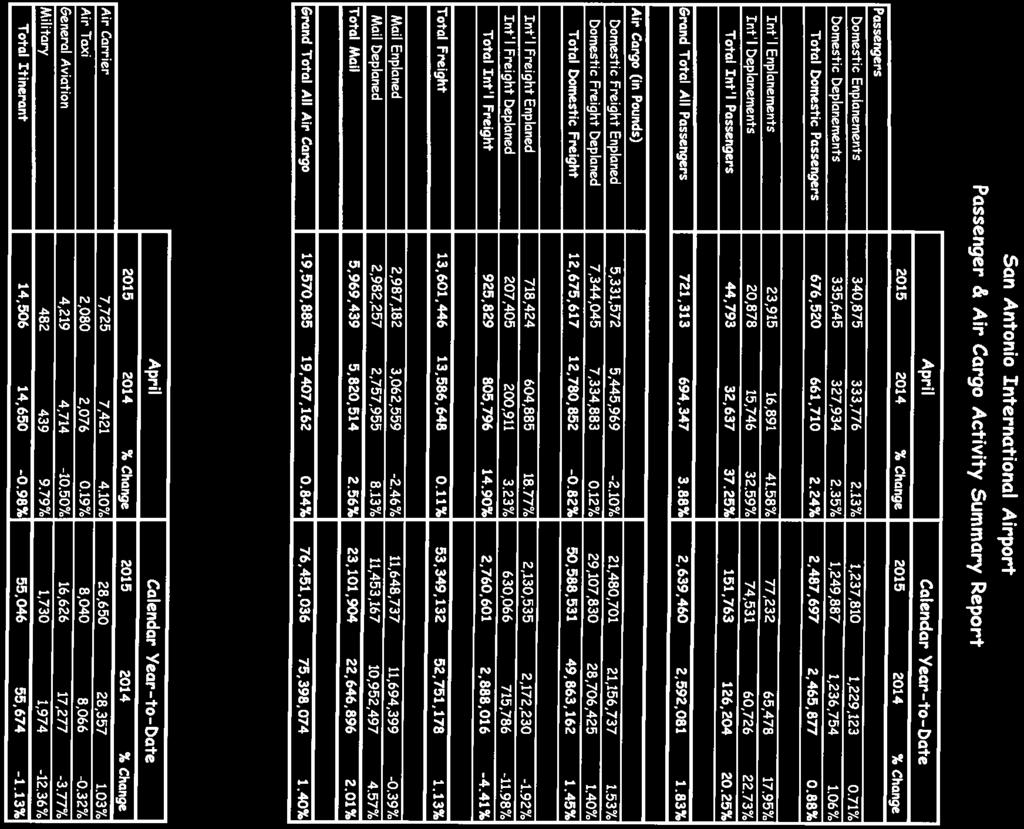
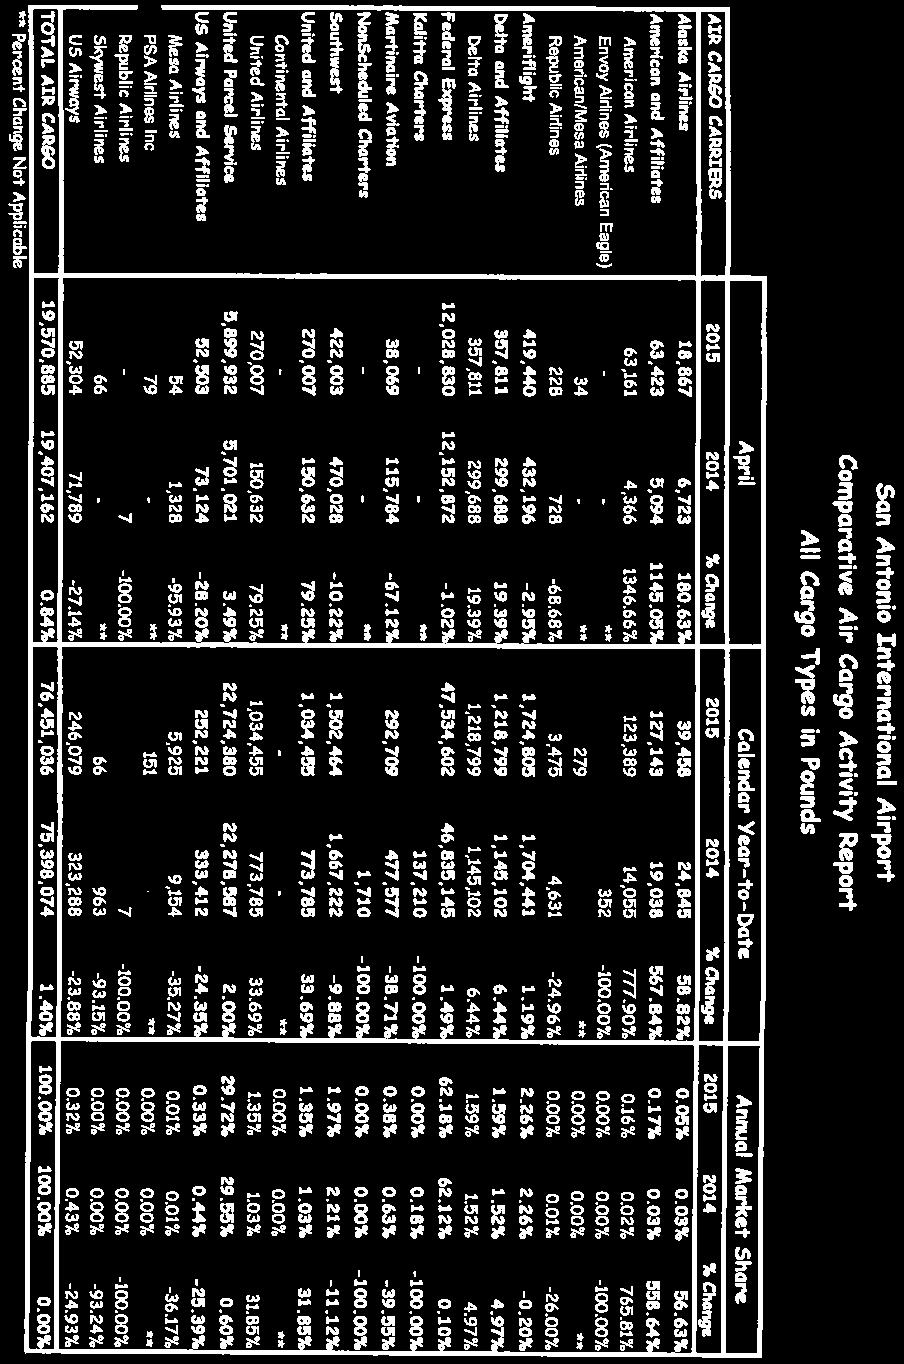
25 2015 Calendar Y-T-D thru April SAT Passengers Up 1.8% over Same Period in Y-T-D SAT International Passenger Count was Up 20.3% Year-to-date (Y-T-D) total passenger numbers (2,639,460) through April 2015 were up 1.8% compared to the same four-month period in The Y-T-D domestic passenger count (2,487,697) increased 0.9% and international passengers (151,763) increased 20.3%. For the month of April 2015, the total passenger count (721,313) was up 3.9% compared to April Total YTD Domestic Passengers Total YTD Int'l Passengers 2,750,000 2,200,000 1,650,000 1,100, , , ,000 70, , , For the January-April 2015 time period, SAT total air cargo pounds (76,451,036) increased 1.4%% when compared to the same four months in ,000,000 80,000,000 Total YTD Air Cargo Pounds 60,000,000 40,000,000 20,000,
26
27
28
 increased 0.12% and international passengers (67,802) increased 8.4%.")

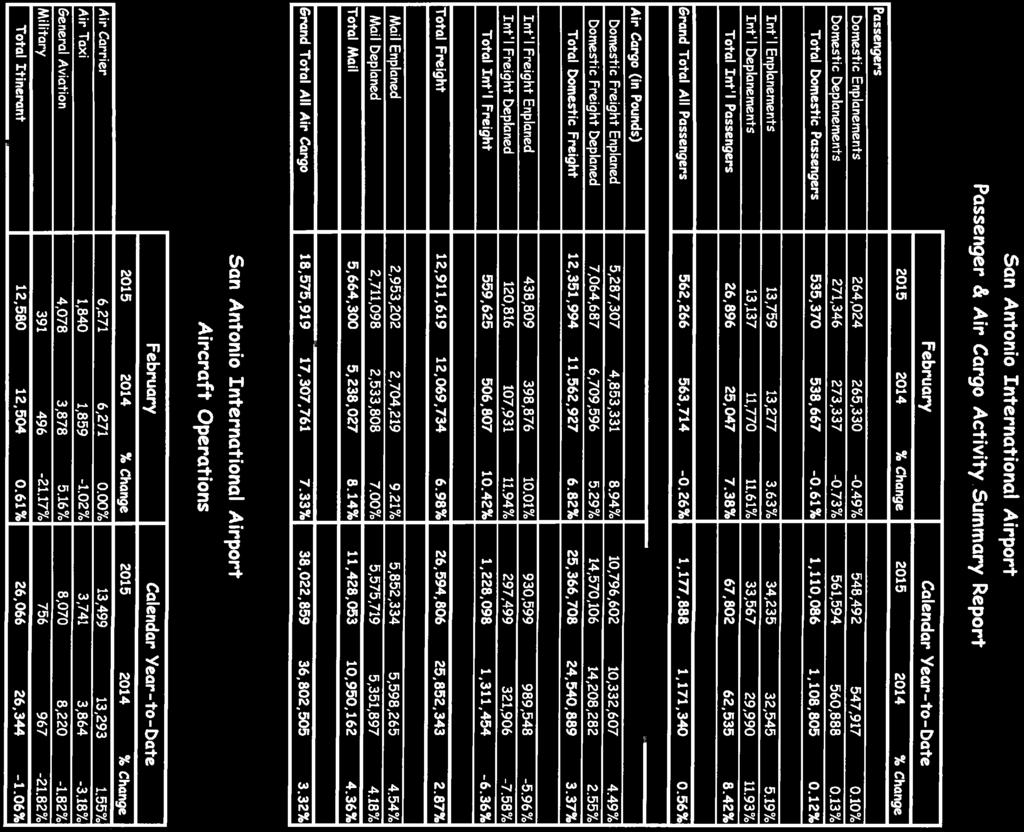
29 February 2015 YTD Passengers Increased 0.6% over Same Period in 2014 YTD International Passenger Count was Up 8.4% 2015 year-to-date (YTD) total passenger numbers (1,177,888) were up 0.6% compared to the same two-month period in The YTD domestic passenger numbers (1,110,086) increased 0.12% and international passengers (67,802) increased 8.4%. For the month of February 2015, the total passenger count (562,266) remained unchanged when compared to February Total YTD Domestic Passengers Total YTD Int'l Passengers 1,500,000 1,200, ,000 75,000 60,000 45, ,000 30, , , YTD total air cargo pounds (38,022,859) through February increased 3.3% when compared to the same period in ,000,000 Total YTD Air Cargo 40,000,000 Pounds 30,000,000 20,000,000 10,000,
30
31
32
33 SAT January 2015 Passengers Increased 1.3% over Same Month in 2014 SAT International Passenger Count was 9.1% Higher than January 2014 Total January 2015 passengers (615,622) increased 1.3% compared to January Domestic passengers (574,716) were up 0.8% over January 2014, while international passengers (40,906) increased 9.1%. The international passenger count was the highest ever recorded for January and included scheduled Mexican service and Canadian passenger charters. Air Cargo (19,446,940 in pounds) for January 2015 showed a 0.25% decline from January ,000,000 Total YTD Air Cargo Pounds 20,000,000 15,000,000 10,000,000 5,000,
34
35
36


37
38
39
40
Hillsboro Airport Operations 20,453 18, % 148, , % Troutdale Airport Operations 6,349 7, % 52,433 59,
 PORTLAND INTERNATIONAL AIRPORT (PDX) Monthly Traffic Report This Month Calendar Year to Date 2004 2003 % Chg 2004 2003 % Chg Total PDX Flight Operations * 21,944 22,594-2.9% 199,422 201,759-1.2% Military
Hillsboro Airport Operations 12,874 10, % 180, , % Troutdale Airport Operations 3,944 4, % 62,945 69,370-9.
 Monthly Traffic Report ember, 2004 This Month Calendar Year to Date 2004 2003 % Chg 2004 2003 % Chg Total PDX Flight Operations * 20,633 20,732-0.5% 241,236 245,333-1.7% Military 462 771-40.1% 6,974 7,884-11.5%
PORTLAND INTERNATIONAL AIRPORT (PDX)
") Monthly Traffic Report This Month Calendar Year to Date 2006 2005 %Chg 2006 2005 %Chg Total PDX Flight Operations * 21,304 22,342-4.6% 61,057 63,232-3.4% Military 564 564 0.0% 1,503 1,443 4.2% General
Monthly Traffic Report This Month Calendar Year to Date 2006 2005 %Chg 2006 2005 %Chg Total PDX Flight Operations * 21,304 22,342-4.6% 61,057 63,232-3.4% Military 564 564 0.0% 1,503 1,443 4.2% General
PORTLAND INTERNATIONAL AIRPORT (PDX) Monthly Traffic Report November, 2006
 Monthly Traffic Report November, 2006") Monthly Traffic Report This Month Calendar Year to Date 2006 2005 %Chg 2006 2005 %Chg Total PDX Flight Operations * 20,714 21,257-2.6% 238,877 241,667-1.2% Military 355 476-25.4% 4,695 6,127-23.4% General
Monthly Traffic Report This Month Calendar Year to Date 2006 2005 %Chg 2006 2005 %Chg Total PDX Flight Operations * 20,714 21,257-2.6% 238,877 241,667-1.2% Military 355 476-25.4% 4,695 6,127-23.4% General
PORTLAND INTERNATIONAL AIRPORT (PDX)
") Monthly Traffic Report This Month Calendar Year to Date 2007 2006 %Chg 2007 2006 %Chg Total PDX Flight Operations * 21,618 21,633-0.1% 264,518 260,510 1.5% Military 97 328-70.4% 3,707 5,023-26.2% General
Monthly Traffic Report This Month Calendar Year to Date 2007 2006 %Chg 2007 2006 %Chg Total PDX Flight Operations * 21,618 21,633-0.1% 264,518 260,510 1.5% Military 97 328-70.4% 3,707 5,023-26.2% General
PORTLAND INTERNATIONAL AIRPORT (PDX)
") Monthly Traffic Report ember, 20: Calendar Year Report This Month Calendar Year to Date 20 20 %Chg 20 20 %Chg Total PDX Flight Operations * 18,0 21,618-16.7% 252,572 264,518-4.5% Military 238 97 145.4%
Monthly Traffic Report ember, 20: Calendar Year Report This Month Calendar Year to Date 20 20 %Chg 20 20 %Chg Total PDX Flight Operations * 18,0 21,618-16.7% 252,572 264,518-4.5% Military 238 97 145.4%
PORTLAND INTERNATIONAL AIRPORT (PDX)
") Monthly Traffic Report il, 20 This Month Calendar Year to Date 20 20 %Chg 20 20 %Chg Total PDX Flight Operations * 21,262 20,818 2.1% 84,051 81,875 2.7% Military 354 419-15.5% 1,481 1,922-22.9% General
Monthly Traffic Report il, 20 This Month Calendar Year to Date 20 20 %Chg 20 20 %Chg Total PDX Flight Operations * 21,262 20,818 2.1% 84,051 81,875 2.7% Military 354 419-15.5% 1,481 1,922-22.9% General
Monthly Airport Passenger Activity Summary. December 2011
 T F Green Airport 01/17/12 Monthly Airport Passenger Activity Summary December 2011 Calendar Year Basis Year Year December December Percent to Date to Date Percent 2011 2010 Change 2011 2010 Change Enplaned
Los Angeles World Airports (LAWA) Traffic Comparison (TCOM) Ontario International Airport Calendar YTD January to January
 Traffic Comparison (TCOM) Ontario International Airport Calendar YTD January to January") Los Angeles World Airports (LAWA) Traffic Comparison (TCOM) Ontario Airport Calendar YTD January to January Jan-215 Jan-214 to to Jan-215 Jan-214 % Change Jan-215 Jan-214 % Change Passenger Traffic s 2,14
Los Angeles World Airports (LAWA) Traffic Comparison (TCOM) Ontario Airport Calendar YTD January to January Jan-215 Jan-214 to to Jan-215 Jan-214 % Change Jan-215 Jan-214 % Change Passenger Traffic s 2,14
Monthly Airport Passenger Activity Summary. March2017
 T F Green Airport 04/17/17 Monthly Airport Passenger Activity Summary March2017 Calendar Year Basis Year Year March March Percent to Date to Date Percent 2017 2016 Change 2017 2016 Change Enplaned 152,513
Monthly Airport Passenger Activity Summary. December 2010
 T F Green Airport 01/13/11 Monthly Airport Passenger Activity Summary December 2010 Calendar Year Basis Year Year December December Percent to Date to Date Percent 2010 2009 Change 2010 2009 Change Enplaned
Monthly Airport Passenger Activity Summary. February 2017
 T F Green Airport 03/24/17 Monthly Airport Passenger Activity Summary February 2017 Calendar Year Basis Year Year Febuary Febuary Percent to Date to Date Percent 2017 2016 Change 2017 2016 Change Enplaned
Monthly Airport Passenger Activity Summary. May 2017
 T F Green Airport Monthly Airport Passenger Activity Summary May 2017 Calendar Year Basis Year Year May May Percent to Date to Date Percent 2017 2016 Change 2017 2016 Change Enplaned 158,331 158,270 0.04%
PORTLAND INTERNATIONAL AIRPORT (PDX)
") Monthly Traffic Report This Month Calendar Year to Date 20 20 %Chg 20 20 %Chg Total PDX Flight Operations * 15,731 15,520 1.4% 33,326 32,280 3.2% Military 211 0.2% 478 381 25.5% General Aviation 942 926
Monthly Traffic Report This Month Calendar Year to Date 20 20 %Chg 20 20 %Chg Total PDX Flight Operations * 15,731 15,520 1.4% 33,326 32,280 3.2% Military 211 0.2% 478 381 25.5% General Aviation 942 926
PORTLAND INTERNATIONAL AIRPORT (PDX)
") Monthly Traffic Report ember, 20 This Month Calendar Year to Date 20 20 %Chg 20 20 %Chg Total PDX Flight Operations * 21,586 21,810-1.0% 263,253 263,6 0.1% Military 489 481 1.7% 6,616 7,455-11.3% General
Monthly Traffic Report ember, 20 This Month Calendar Year to Date 20 20 %Chg 20 20 %Chg Total PDX Flight Operations * 21,586 21,810-1.0% 263,253 263,6 0.1% Military 489 481 1.7% 6,616 7,455-11.3% General
Monthly Airport Passenger Activity Summary. December 2007
 T F Green Airport 06/23/08 Monthly Airport Passenger Activity Summary December 2007 Calendar Year Basis Year Year December December Percent to Date to Date Percent 2007 2006 Change 2007 2006 Change Enplaned
PORTLAND INTERNATIONAL AIRPORT (PDX)
") Monthly Traffic Report e, 20: Fiscal Year Report This Month Fiscal Year to Date 20 20 %Chg 20 20 %Chg Total PDX Flight Operations * 21,213 20,651 2.7% 228,846 222,979 2.6% Military 334 374-10.7% 3,829
Monthly Traffic Report e, 20: Fiscal Year Report This Month Fiscal Year to Date 20 20 %Chg 20 20 %Chg Total PDX Flight Operations * 21,213 20,651 2.7% 228,846 222,979 2.6% Military 334 374-10.7% 3,829
Monthly Airport Passenger Activity Summary. Jun 2017
 T F Green Airport Monthly Airport Passenger Activity Summary Jun 2017 Calendar Year Basis Year Year Jun Jun Percent to Date to Date Percent 2017 2016 Change 2017 2016 Change Enplaned 161,324 156,458 3.11%
PORTLAND INTERNATIONAL AIRPORT (PDX)
") Monthly Traffic Report This Month Calendar Year to Date 2005 2004 %Chg 2005 2004 %Chg Total PDX Flight Operations * 20,800 18,649 11.5% 20,800 18,649 11.5% Military 524 530-1.1% 524 530-1.1% General Aviation
Monthly Traffic Report This Month Calendar Year to Date 2005 2004 %Chg 2005 2004 %Chg Total PDX Flight Operations * 20,800 18,649 11.5% 20,800 18,649 11.5% Military 524 530-1.1% 524 530-1.1% General Aviation
Monthly Airport Passenger Activity Summary
 T F Green Airport Monthly Airport Passenger Activity Summary January 2018 Calendar Year Basis Year Year Jan Jan Percent to Date to Date Percent 2018 2017 Change 2018 2017 Change Total Enplaned 148,452
Calendar Year Basis Year Year Apr Apr Percent to Date to Date Percent Change Change
 T F Green Airport Monthly Airport Passenger Activity Summary April 2018 Calendar Year Basis Year Year Apr Apr Percent to Date to Date Percent 2018 2017 Change 2018 2017 Change Total Enplaned 194,510 157,788
PORTLAND INTERNATIONAL AIRPORT (PDX)
") Monthly Traffic Report This Month Calendar Year to Date 20 20 %Chg 20 20 %Chg Total PDX Flight Operations * 19,211,625 3.1% 233,993 228,949 2.2% Military 9 310-42.3% 3,520 4,144-15.1% General Aviation
Monthly Traffic Report This Month Calendar Year to Date 20 20 %Chg 20 20 %Chg Total PDX Flight Operations * 19,211,625 3.1% 233,993 228,949 2.2% Military 9 310-42.3% 3,520 4,144-15.1% General Aviation
AIRPORT OPERATIONS COUNT FOR THE CALENDAR YEAR ENDED DECEMBER, 2005
 AIRPORT OPERATIONS COUNT FOR THE CALENDAR YEAR ENDED DECEMBER, 2005 ITINERANT(1) LOCAL(2) TOTAL Month-Year AC(a) AT(b) GA(c) MI(d) CI(a) MI(b) Operations (3) January-05 4,452 2,153 1,650 30 8,285 244 0
PORTLAND INTERNATIONAL AIRPORT (PDX)
") Monthly Traffic Report e, 20: Fiscal Year Report This Month Fiscal Year to Date 20 20 %Chg 20 20 %Chg Total PDX Flight Operations * 23,003 22,256 3.4% 263,777 260,745 1.2% Military 410 450-8.9% 4,445 6,431-30.9%
Monthly Traffic Report e, 20: Fiscal Year Report This Month Fiscal Year to Date 20 20 %Chg 20 20 %Chg Total PDX Flight Operations * 23,003 22,256 3.4% 263,777 260,745 1.2% Military 410 450-8.9% 4,445 6,431-30.9%
PORTLAND INTERNATIONAL AIRPORT (PDX)
") Monthly Traffic Report uary, 20 This Month Calendar Year to Date 20 20 %Chg 20 20 %Chg Total PDX Flight Operations * 17,502 17,957-2.5% 17,502 17,957-2.5% Military 373 298 25.2% 373 298 25.2% General Aviation
Monthly Traffic Report uary, 20 This Month Calendar Year to Date 20 20 %Chg 20 20 %Chg Total PDX Flight Operations * 17,502 17,957-2.5% 17,502 17,957-2.5% Military 373 298 25.2% 373 298 25.2% General Aviation
Los Angeles World Airports (LAWA) Traffic Comparison (TCOM) Ontario International Airport Calendar YTD January to April
 Traffic Comparison (TCOM) Ontario International Airport Calendar YTD January to April") Passenger Traffic s Los Angeles World Airports (LAWA) Traffic Comparison (TCOM) Ontario Airport Calendar YTD January to April 5/25/216, 8:3 AM Jan-216 Jan-215 to to Apr-216 Apr-215 % Change Apr-216 Apr-215
Passenger Traffic s Los Angeles World Airports (LAWA) Traffic Comparison (TCOM) Ontario Airport Calendar YTD January to April 5/25/216, 8:3 AM Jan-216 Jan-215 to to Apr-216 Apr-215 % Change Apr-216 Apr-215
Monthly Airport Passenger Activity Summary. Aug 2017
 T F Green Airport Monthly Airport Passenger Activity Summary Aug 2017 Calendar Year Basis Year Year Aug Aug Percent to Date to Date Percent 2017 2016 Change 2017 2016 Change Total Enplaned 190,676 169,667
Monthly Airport Passenger Activity Summary. Sep 2017
 T F Green Airport Monthly Airport Passenger Activity Summary Sep 2017 Calendar Year Basis Year Year Sep Sep Percent to Date to Date Percent 2017 2016 Change 2017 2016 Change Total Enplaned 161,165 151,982
PORTLAND INTERNATIONAL AIRPORT (PDX)
") Monthly Traffic Report ember, 20: Calendar Year Report This Month Calendar Year to Date 20 20 %Chg 20 20 %Chg Total PDX Flight Operations * 18,625 18,586 0.2% 228,949 227,709 0.5% Military 310 254 22.0%
Monthly Traffic Report ember, 20: Calendar Year Report This Month Calendar Year to Date 20 20 %Chg 20 20 %Chg Total PDX Flight Operations * 18,625 18,586 0.2% 228,949 227,709 0.5% Military 310 254 22.0%
PORTLAND INTERNATIONAL AIRPORT (PDX)
") Monthly Traffic Report ch, 20 This Month Calendar Year to Date 20 20 %Chg 20 20 %Chg Total PDX Flight Operations * 21,537 22,218-3.1% 62,490 62,789-0.5% Military 242 474-48.9% 739 1,127-34.4% General Aviation
Monthly Traffic Report ch, 20 This Month Calendar Year to Date 20 20 %Chg 20 20 %Chg Total PDX Flight Operations * 21,537 22,218-3.1% 62,490 62,789-0.5% Military 242 474-48.9% 739 1,127-34.4% General Aviation
Calendar Year Basis Year Year August August Percent to Date to Date Percent Change Change
 T F Green Airport Monthly Airport Passenger Activity Summary August 2018 Calendar Year Basis Year Year August August Percent to Date to Date Percent 2018 2017 Change 2018 2017 Change Total Enplaned 202,148
Monthly Airport Passenger Activity Summary. October 2017
 T F Green Airport Monthly Airport Passenger Activity Summary October 2017 Calendar Year Basis Year Year Oct Oct Percent to Date to Date Percent 2017 2016 Change 2017 2016 Change Total Enplaned 196,345
PORTLAND INTERNATIONAL AIRPORT (PDX)
") Monthly Traffic Report ch, 20 This Month Calendar Year to Date 20 20 %Chg 20 20 %Chg Total PDX Flight Operations * 22,218 21,304 4.3% 62,789 61,057 2.8% Military 474 564-16.0% 1,127 1,503-25.0% General
Monthly Traffic Report ch, 20 This Month Calendar Year to Date 20 20 %Chg 20 20 %Chg Total PDX Flight Operations * 22,218 21,304 4.3% 62,789 61,057 2.8% Military 474 564-16.0% 1,127 1,503-25.0% General
Los Angeles World Airports (LAWA) Traffic Comparison (TCOM) Ontario International Airport Calendar YTD January to March
 Traffic Comparison (TCOM) Ontario International Airport Calendar YTD January to March") Passenger Traffic s Los Angeles World Airports (LAWA) Traffic Comparison (TCOM) Ontario Airport Calendar YTD January to March 4/25/216, 8:42 AM Jan-216 Jan-215 to to Mar-216 Mar-215 % Change Mar-216 Mar-215
Passenger Traffic s Los Angeles World Airports (LAWA) Traffic Comparison (TCOM) Ontario Airport Calendar YTD January to March 4/25/216, 8:42 AM Jan-216 Jan-215 to to Mar-216 Mar-215 % Change Mar-216 Mar-215
MONTHLY AIRPORT TRAFFIC REPORT November 2013
 MONTHLY AIRPORT TRAFFIC REPORT AIRCRAFT OPERATIONS 2013 2012 Change Domestic Air Carrier 52,937 54,739-3.29% Air Taxi 13,964 13,566 2.93% General Aviation 504 515-2.14% Military 25 28-10.71% Subtotal 67,430
MONTHLY AIRPORT TRAFFIC REPORT. April 2014
 MONTHLY AIRPORT TRAFFIC REPORT AIRCRAFT OPERATIONS 2014 2013 Change Domestic Air Carrier 55,529 55,119 0.74% Air Taxi 11,149 15,077-26.05% General Aviation 639 723-11.62% Military 13 14-7.14% Subtotal
Monthly Airport Passenger Activity Summary
 T F Green Airport Monthly Airport Passenger Activity Summary December 2017 Calendar Year Basis Year Year Dec Dec Percent to Date to Date Percent 2017 2016 Change 2017 2016 Change Total Enplaned 175,889
PORTLAND INTERNATIONAL AIRPORT (PDX)
") Monthly Traffic Report This Month Calendar Year to Date 2005 2004 %Chg 2005 2004 %Chg Total PDX Flight Operations * 22,342 22,611-1.2% 63,232 61,699 2.5% Military 564 830-32.0% 1,443 2,052-29.7% General
Monthly Traffic Report This Month Calendar Year to Date 2005 2004 %Chg 2005 2004 %Chg Total PDX Flight Operations * 22,342 22,611-1.2% 63,232 61,699 2.5% Military 564 830-32.0% 1,443 2,052-29.7% General
Calendar Year Basis Year Year May May Percent to Date to Date Percent Change Change
 T F Green Airport Monthly Airport Passenger Activity Summary May 2018 Calendar Year Basis Year Year May May Percent to Date to Date Percent 2018 2017 Change 2018 2017 Change Total Enplaned 192,063 158,331
MONTHLY STATISTICAL REPORT SUMMARY. for the month of January 2018
 MONTHLY STATISTICAL REPORT SUMMARY for the month of January 2018 MONTHLY PERFORMANCE COMPARISON VS. JANUARY 2017 COMMERCIAL PASSENGERS 2018 2017 %CHANGE DOM. INT. TOTAL DOM. INT. TOTAL DOM. INT. TOTAL
May 2011 Passenger and Cargo Traffic Statistics Reno-Tahoe International Airport
 May 2011 Passenger and Cargo Traffic Statistics Reno-Tahoe International Airport July 5, 2011 U.S. DOMESTIC INDUSTRY OVERVIEW FOR MAY 2011 All RNO Carriers Systemwide year over year comparison Average
MONTHLY AIRPORT TRAFFIC REPORT August 2018
 MONTHLY AIRPORT TRAFFIC REPORT AIRCRAFT OPERATIONS 2018 2017 Change Domestic Air Carrier 65,465 63,201 3.58% Air Taxi 7,607 7,533 0.98% General Aviation 594 609-2.46% Military 15 3 400.00% Subtotal 73,681
Statistical Report Calendar Year 2013
 Statistical Report Year 213 Houston Airports P.O. Box 616 Houston, TX 7725-16 Request for User Input The intent of the monthly and annual statistical reports is to provide data that is both relevant and
DENVER INTERNATIONAL AIRPORT TOTAL OPERATIONS AND TRAFFIC DECEMBER 2003
 DENVER INTERNATIONAL AIRPORT TOTAL OPERATIONS AND TRAFFIC DECEMBER 2003 DECEMBER YEAR TO DATE % OF % OF % GRAND % GRAND INCR./ INCR./ TOTAL INCR./ INCR./ TOTAL 2003 2002 (10) DECR. DECR. 2003 2003 (9)
Operations and Traffic March 2018
 Operations and Traffic Operations(¹) 2018 2017 Change % Change % Total YTD 2018 YTD 2017 Change % Change % Total Air Carrier 37,359 39,210 (1,851) (4.7%) 75.8% 103,577 107,908 (4,331) (4.0%) 75.6% Air
r:\traffic\aviation Activity.xls CHARLOTTE DOUGLAS INTERNATIONAL AIRPORT AVIATION ACTIVITY FOR FEBRUARY 2005
 CHARLOTTE DOUGLAS INTERNATIONAL AIRPORT AVIATION ACTIVITY FOR FEBRUARY 2005 FEBRUARY FEBRUARY MTD % 2005 2004 YTD % 2005 2004 CHANGE TO DATE TO DATE CHANGE AIRCRAFT OPERATIONS Air Carrier 19,014 16,796
MONTHLY AIRPORT TRAFFIC REPORT May 2015
 MONTHLY AIRPORT TRAFFIC REPORT AIRCRAFT OPERATIONS 2015 2014 Change Domestic Air Carrier 60,427 57,339 5.39% Air Taxi 7,825 10,967-28.65% General Aviation 547 635-13.86% Military 135 27 400.00% Subtotal
MONTHLY AIRPORT TRAFFIC REPORT January 2018
 MONTHLY AIRPORT TRAFFIC REPORT AIRCRAFT OPERATIONS 2018 2017 Change Domestic Air Carrier 55,461 55,980-0.93% Air Taxi 7,166 7,330-2.24% General Aviation 690 625 10.40% Military 6 11-45.45% Subtotal 63,323
MONTHLY AIRPORT TRAFFIC REPORT April 2017
 MONTHLY AIRPORT TRAFFIC REPORT AIRCRAFT OPERATIONS 2017 2016 Change Domestic Air Carrier 56,570 60,697-6.80% Air Taxi 7,771 7,806-0.45% General Aviation 833 699 19.17% Military 23 14 64.29% Subtotal 65,197
The Conference Board Consumer Confidence Index decreased in July The Index now stands at 96.7 down from 97.4 in June.
 Interoffice Memo Date: August 31, 2016 To: Distribution From: Brian Baker Re: Air Traffic Statistics July 2016 Please review the attached report and return any comments or questions to Brian Baker. Reports
air traffic statistics
 July 23 air traffic statistics Prepared by the Office of Finance Department of Internal Controls, Compliance and Financial Strategy Air Traffic Summary July 23 Below is a summary of the July 23 Air Traffic
DENVER INTERNATIONAL AIRPORT. TOTAL OPERATIONS AND TRAFFIC January 2012
 DENVER INTERNATIONAL AIRPORT TOTAL OPERATIONS AND TRAFFIC January 2012 January YEAR TO DATE % of % of % Grand % Grand Incr./ Incr./ Total Incr./ Incr./ Total 2012 2011 (9) Decr. Decr. 2012 2012 2011 (9)
MEMPHIS INTERNATIONAL AIRPORT ACTIVITY REPORT FEBRUARY 2018
 MEMPHIS INTERNATIONAL AIRPORT ACTIVITY REPORT FEBRUARY 2018 Scott A. Brockman, President & CEO Forrest B. Artz, Vice President & CFO Terry S. Blue, Vice President MAJOR Scheduled DOMESTIC INTERNATIONAL
U.S. DOMESTIC INDUSTRY OVERVIEW FOR MARCH
 Inter-Office Memo Reno-Tahoe Airport Authority Date: April 30, 2009 To: Statistics Recipients From: Krys T. Bart, A.A.E., President/CEO Subject: RENO-TAHOE INTERNATIONAL AIRPORT PASSENGER STATISTICS U.S.
Operations and Traffic June 2018
 Operations and Traffic Operations(¹) 2018 2017 Change % Change % Total YTD 2018 YTD 2017 Change % Change % Total Air Carrier 41,390 41,225 165 0.4% 76.7% 221,390 225,992 (4,602) (2.0%) 76.4% Air Taxi 12,124
MONTHLY AIRPORT TRAFFIC REPORT September 2016
 MONTHLY AIRPORT TRAFFIC REPORT AIRCRAFT OPERATIONS 2016 2015 Change Domestic Air Carrier 59,030 59,038-0.01% Air Taxi 7,779 7,201 8.03% General Aviation 704 571 23.29% Military 21 12 75.00% Subtotal 67,534
MONTHLY AIRPORT TRAFFIC REPORT February 2014
 MONTHLY AIRPORT TRAFFIC REPORT AIRCRAFT OPERATIONS 2014 2013 Change Domestic Air Carrier 44,741 48,627-7.99% Air Taxi 11,144 13,003-14.30% General Aviation 569 543 4.79% Military 17 15 13.33% Subtotal
Operations and Traffic August 2018
 Operations and Traffic Operations(¹) 2018 2017 Change % Change % Total YTD 2018 YTD 2017 Change % Change % Total Air Carrier 42,212 43,007 (795) (1.8%) 76.4% 305,876 311,886 (6,010) (1.9%) 76.4% Air Taxi
Airline Activity Report
 Airline Activity Report March 215 Airline Activity Summary For Month Ending March 215 Passenger Domestic Mar (cur) Mar (pre) Difference % Change YTD Mar (cur) YTD Mar (pre) Difference % Change Scheduled
Airline Activity Report
 Airline Activity Report January 216 Airline Activity Summary For Month Ending January 216 Passenger Domestic Jan (cur) Jan (pre) Difference % Change YTD Jan (cur) YTD Jan (pre) Difference % Change Scheduled
air traffic statistics
 June 23 air traffic statistics Prepared by the Office of Finance Department of Internal Controls, Compliance and Financial Strategy Metropolitan Washington Airports Authority Air Traffic Statistics Table
U.S. DOMESTIC INDUSTRY OVERVIEW FOR OCTOBER 2010 All RNO Carriers Systemwide year over year comparison
 Inter-Office Memo Reno-Tahoe Airport Authority Date: November 22, 2010 To: Chairman and Board of Trustees From: Krys T. Bart, A.A.E., President/CEO Subject: RENO-TAHOE INTERNATIONAL AIRPORT OCTOBER 2010
MONTHLY AIRPORT TRAFFIC REPORT December 2018
 MONTHLY AIRPORT TRAFFIC REPORT AIRCRAFT OPERATIONS 2018 2017 Change Domestic Air Carrier 58,905 55,828 5.51% Air Taxi 6,948 6,810 2.03% General Aviation 499 565-11.68% Military 24 25-4.00% Subtotal 66,376
MONTHLY AIRPORT TRAFFIC REPORT July 2018-(Revised)
") MONTHLY AIRPORT TRAFFIC REPORT AIRCRAFT OPERATIONS 2018 2017 Change Domestic Air Carrier 64,066 63,535 0.84% Air Taxi 7,468 7,291 2.43% General Aviation 550 630-12.70% Military 5 15-66.67% Subtotal 72,089
MONTHLY AIRPORT TRAFFIC REPORT AIRCRAFT OPERATIONS 2018 2017 Change Domestic Air Carrier 64,066 63,535 0.84% Air Taxi 7,468 7,291 2.43% General Aviation 550 630-12.70% Military 5 15-66.67% Subtotal 72,089
Sacramento International Airport Airline Passenger Statistics August 2013
 Sacramento International Airport Airline Passenger Statistics August 2013 CURRENT MONTH FISCAL YEAR TO DATE CALENDAR YEAR TO DATE THIS YEAR LAST YEAR % + / ( - ) 2013/14 2012/13 % + / ( - ) 2013 2012 %
MONTHLY AIRPORT TRAFFIC REPORT September 2018
 MONTHLY AIRPORT TRAFFIC REPORT AIRCRAFT OPERATIONS 2018 2017 Change Domestic Air Carrier 58,763 55,902 5.12% Air Taxi 6,537 6,689-2.27% General Aviation 605 658-8.05% Military 14 17-17.65% Subtotal 65,919
MONTHLY AIRPORT TRAFFIC REPORT March 2017
 MONTHLY AIRPORT TRAFFIC REPORT AIRCRAFT OPERATIONS 2017 2016 Change Domestic Air Carrier 60,360 61,951-2.57% Air Taxi 8,591 8,270 3.88% General Aviation 717 615 16.59% Military 14 27-48.15% Subtotal 69,682
Airline Activity Report
 Airline Activity Report September 218 Airline Activity Summary For Month Ending September 218 Passenger Domestic Sep (cur) Sep (pre) Difference % Change YTD Sep (cur) YTD Sep (pre) Difference % Change
MONTHLY AIRPORT TRAFFIC REPORT February 2018
 MONTHLY AIRPORT TRAFFIC REPORT AIRCRAFT OPERATIONS 2018 2017 Change Domestic Air Carrier 51,809 51,854-0.09% Air Taxi 6,659 6,988-4.71% General Aviation 651 540 20.56% Military 6 9-33.33% Subtotal 59,125
MONTHLY AIRPORT TRAFFIC REPORT July 2016
 MONTHLY AIRPORT TRAFFIC REPORT AIRCRAFT OPERATIONS 2016 2015 Change Domestic Air Carrier 63,680 62,789 1.42% Air Taxi 7,548 8,007-5.73% General Aviation 717 558 28.49% Military 11 146-92.47% Subtotal 71,956
Operations and Traffic November 2018
 Operations and Traffic Operations(¹) 2018 2017 Change % Change % Total YTD 2018 YTD 2017 Change % Change % Total Air Carrier 37,928 36,266 1,662 4.6% 77.8% 422,673 424,886 (2,213) (0.5%) 76.6% Air Taxi
Operations and Traffic December 2018
 Operations and Traffic Operations(¹) 2018 2017 Change % Change % Total YTD 2018 YTD 2017 Change % Change % Total Air Carrier 38,468 37,106 1,362 3.7% 77.0% 462,276 461,992 284 0.1% 76.6% Air Taxi 11,198
Sacramento International Airport Airline Passenger Statistics June 2010
 Sacramento International Airport Airline Passenger Statistics June 2010 CURRENT MONTH FISCAL YEAR TO DATE CALENDAR YEAR TO DATE THIS YEAR LAST YEAR % + / ( - ) 2009/10 2008/09 % + / ( - ) 2010 2009 % +
The Conference Board Consumer Confidence Index increased in August The Index now stands at up from 96.7 in July.
 Interoffice Memo Date: October 3, 2016 To: Distribution From: Brian Baker Re: Air Traffic Statistics August 2016 Please review the attached report and return any comments or questions to Brian Baker. Reports
MONTHLY AIRPORT TRAFFIC REPORT April 2018
 MONTHLY AIRPORT TRAFFIC REPORT AIRCRAFT OPERATIONS 2018 2017 Change Domestic Air Carrier 60,928 56,570 7.70% Air Taxi 6,995 7,771-9.99% General Aviation 654 833-21.49% Military 9 23-60.87% Subtotal 68,586
DENVER INTERNATIONAL AIRPORT. TOTAL OPERATIONS AND TRAFFIC January 2017
 January YEAR TO DATE % of % of % Grand % Grand Incr./ Incr./ Total Incr./ Incr./ Total 2017 2016 Decr. Decr. 2017 2017 2016 Decr. Decr. 2017 OPERATIONS (1) Air Carrier 35,779 35,235 544 1.5% 78.0% 35,779
December 2012 Passenger and Cargo Traffic Statistics Reno-Tahoe International Airport
 December 2012 Passenger and Cargo Traffic Statistics Reno-Tahoe International Airport January 29, 2013 U.S. DOMESTIC INDUSTRY OVERVIEW FOR DECEMBER 2012 All RNO Carriers Systemwide year over year comparison
MONTHLY AIRPORT TRAFFIC REPORT June 2017
 MONTHLY AIRPORT TRAFFIC REPORT AIRCRAFT OPERATIONS 2017 2016 Change Domestic Air Carrier 61,445 62,662-1.94% Air Taxi 8,267 7,656 7.98% General Aviation 644 685-5.99% Military 8 18-55.56% Subtotal 70,364
DENVER INTERNATIONAL AIRPORT
 DENVER INTERNATIONAL AIRPORT TOTAL OPERATIONS AND TRAFFIC December YEAR TO DATE % of % of % Grand % Grand cr./ cr./ Total cr./ cr./ Total 2011 2010 Decr. Decr. 2011 2011 (9) 2010 (10) Decr. Decr. 2011
MONTHLY AIRPORT TRAFFIC REPORT July 2017
 MONTHLY AIRPORT TRAFFIC REPORT AIRCRAFT OPERATIONS 2017 2016 Change Domestic Air Carrier 63,535 63,680-0.23% Air Taxi 7,291 7,548-3.40% General Aviation 630 717-12.13% Military 15 11 36.36% Subtotal 71,471
August 2014 Passenger and Cargo Traffic Statistics Reno-Tahoe International Airport
 August 2014 Passenger and Cargo Traffic Statistics Reno-Tahoe International Airport October 8, 2014 U.S. DOMESTIC INDUSTRY OVERVIEW FOR AUGUST 2014 All RNO Carriers Domestic Systemwide year over year comparison
Airline Activity Report
 Airline Activity Report November 218 Airline Activity Summary For Month Ending November 218 Passenger Domestic Nov (cur) Nov (pre) Difference % Change YTD Nov (cur) YTD Nov (pre) Difference % Change Scheduled
Sacramento International Airport Airline Passenger Statistics December 2012
 Sacramento International Airport Airline Passenger Statistics December 2012 CURRENT MONTH FISCAL YEAR TO DATE CALENDAR YEAR TO DATE THIS YEAR LAST YEAR % + / ( - ) 2012/13 2011/12 % + / ( - ) 2012 2011
Airline Activity Report
 Airline Activity Report August 217 Airline Activity Summary For Month Ending August 217 Passenger Domestic Aug (cur) Aug (pre) Difference % Change YTD Aug (cur) YTD Aug (pre) Difference % Change Scheduled
Airline Activity Report
 Airline Activity Report October 217 Indianapolis International Airport Airline Activity Summary For Month Ending October 217 Passenger Domestic Oct (cur) Oct (pre) Difference % Change YTD Oct (cur) YTD
December 2013 Passenger and Cargo Traffic Statistics Reno-Tahoe International Airport
 December 2013 Passenger and Cargo Traffic Statistics Reno-Tahoe International Airport January 24, 2014 U.S. DOMESTIC INDUSTRY OVERVIEW FOR DECEMBER 2013 All RNO Carriers Domestic Systemwide year over year
ATLANTIC SOUTHEAST AIRLINES Scheduled ATLAS AIR INC. Nonscheduled
 TABLE 1. Summary of Aircraft Departures and Enplaned Passengers, Freight, and Mail by Carrier Group, Air Carrier, and Type of Service: 2008 ( Major carriers ) Aircraft Departures Enplaned revenue-tones
AUGUST 2008 MONTHLY PASSENGER AND CARGO STATISTICS
 Inter-Office Memo Reno-Tahoe Airport Authority Date: October 2, 2008 To: Statistics Recipients From: Tom Medland, Director Air Service Business Development Subject: RENO-TAHOE INTERNATIONAL AIRPORT PASSENGER
MONTHLY AIRPORT TRAFFIC REPORT December 2017
 MONTHLY AIRPORT TRAFFIC REPORT AIRCRAFT OPERATIONS 2017 2016 Change Domestic Air Carrier 55,828 57,943-3.65% Air Taxi 6,810 7,642-10.89% General Aviation 565 569-0.70% Military 25 32-21.88% Subtotal 63,228
Reno-Tahoe Airport Authority U.S. DOMESTIC INDUSTRY OVERVIEW FOR FEBRUARY
 Inter-Office Memo Reno-Tahoe Airport Authority Date: March 30, 2009 To: Statistics Recipients From: Krys T. Bart, A.A.E., President/CEO Subject: RENO-TAHOE INTERNATIONAL AIRPORT PASSENGER STATISTICS U.S.
December Calendar Year Monthly Summary
 December Calendar Year Monthly Summary CY 2013/2012 % Change December YTD Total Passengers 2,594,922 32,389,544 2,415,409 32,242,473 7.4% 0.5% Domestic Passengers (2) 2,350,358 29,493,972 2,187,880 29,426,451
Passenger and Cargo Statistics Report
 Passenger and Cargo Statistics Report Reno-Tahoe International Airport December 2014 U.S. DOMESTIC INDUSTRY OVERVIEW FOR DECEMBER 2014 All RNO Carriers Domestic Systemwide year over year comparison Average
DENVER INTERNATIONAL AIRPORT
 DENVER INTERNATIONAL AIRPORT TOTAL OPERATIONS AND TRAFFIC October 2013 October YEAR TO DATE % of % of % Grand % Grand cr./ cr./ Total cr./ cr./ Total 2013 2012 Decr. Decr. 2013 2013 2012 Decr. Decr. 2013
December Calendar Year Monthly Summary
 December Calendar Year Monthly Summary Calendar Year 2010 Calendar Year 2009 CY 2010/2009 % Change December YTD Total Passengers 2,556,434 32,377,064 2,421,852 31,357,388 5.6% 3.3% Domestic Passengers
Table of Contents PAGE
 FEBRUARY 2018 EL PASO INTERNATIONAL AIRPORT MONTHLY ACTIVITY REPORT February 2018 Table of Contents PAGE AIRPORT ACTIVITY OVERVIEW 1 NONSTOP DESTINATION ANALYSIS 2 MAP OF NONSTOP DESTINATIONS 3 FLIGHT
MEMPHIS INTERNATIONAL AIRPORT ACTIVITY REPORT FEBRUARY 2019
 MEMPHIS INTERNATIONAL AIRPORT ACTIVITY REPORT FEBRUARY 2019 Scott A. Brockman, President & CEO Forrest B. Artz, Vice President & CFO Terry S. Blue, Vice President MAJOR Scheduled DOMESTIC INTERNATIONAL
November 2013 Passenger and Cargo Traffic Statistics Reno-Tahoe International Airport
 November 2013 Passenger and Cargo Traffic Statistics Reno-Tahoe International Airport December 26, 2013 U.S. DOMESTIC INDUSTRY OVERVIEW FOR NOVEMBER 2013 All RNO Carriers Domestic Systemwide year over
October 2013 Passenger and Cargo Traffic Statistics Reno-Tahoe International Airport
 October 2013 Passenger and Cargo Traffic Statistics Reno-Tahoe International Airport December 4, 2013 U.S. DOMESTIC INDUSTRY OVERVIEW FOR OCTOBER 2013 All RNO Carriers Systemwide year over year comparison
DENVER INTERNATIONAL AIRPORT. TOTAL OPERATIONS AND TRAFFIC December 2013
 DENVER INTERNATIONAL AIRPORT TOTAL OPERATIONS AND TRAFFIC December 2013 December YEAR TO DATE % of % of % Grand % Grand cr./ cr./ cr./ cr./ 2013 2012 Decr. Decr. 2013 2013 2012 Decr. Decr. 2013 OPERATIONS
STATISTICAL REPORT Fiscal YEAR SUMMARY. Houston Airport System P.O. Box Houston, TX
 STATISTICAL REPORT 215 Fiscal YEAR SUMMARY P.O. Box 616 Houston, TX 7725 16 Table of Contents 1 Aircraft Operations 2 3 George Bush Intercontinental 4 William P. Hobby 5 Originating Enplaned 6 7 8 Passenger