Operations and Traffic August 2018
|
|
|
- Franklin Burke
- 5 years ago
- Views:
Transcription
1 Operations and Traffic Operations(¹) Change % Change % Total YTD 2018 YTD 2017 Change % Change % Total Air Carrier 42,212 43,007 (795) (1.8%) 76.4% 305, ,886 (6,010) (1.9%) 76.4% Air Taxi 12,574 10,253 2, % 22.8% 91,525 77,792 13, % 22.9% General % 0.8% 2,696 2,736 (40) (1.5%) 0.7% AviationMilitary % 0.0% % 0.0% Operations Total 55,226 53,679 1, % 100.0% 400, ,454 7, % 100.0% Passengers(²) Domestic Inbound 2,869,081 2,759, , % 48.0% 20,423,581 19,664, , % 47.6% Outbound 2,848,804 2,744, , % 47.7% 20,447,297 19,702, , % 47.6% Domestic Total 5,717,885 5,503, , % 95.7% 40,870,878 39,366,834 1,504, % 95.2% Customs Inbound 78,569 69,538 9, % 1.3% 713, ,489 90, % 1.7% Outbound 71,990 63,993 7, % 1.2% 690, ,871 93, % 1.6% Customs Total 150, ,531 17, % 2.5% 1,403,445 1,219, , % 3.3% Pre-Cleared Inbound 54,347 45,821 8, % 0.9% 319, ,704 47, % 0.7% Outbound 50,705 44,107 6, % 0.8% 321, ,365 44, % 0.7% Pre-Cleared Total 105,052 89,928 15, % 1.8% 641, ,069 92, % 1.5% International Total 255, ,459 32, % 4.3% 2,044,553 1,768, , % 4.8% Passenger Total 5,973,496 5,727, , % 100.0% 42,915,431 41,135,263 1,780, % 100.0% Airline Category(³) Major/National 5,023,639 4,909, , % 84.1% 36,380,710 35,232,401 1,148, % 84.8% Foreign Flag 129, ,040 26, % 2.2% 887, , , % 2.1% Regional 819, , , % 13.7% 5,645,909 5,223, , % 13.2% Charter/Misc (300) (82.0%) 0.0% 1,502 2,289 (787) (34.4%) 0.0% Passenger Total 5,973,496 5,727, , % 100.0% 42,915,431 41,135,263 1,780, % 100.0% Cargo(⁴) Air Mail Inbound 2,691,191 2,717,425 (26,234) (1.0%) 4.8% 20,546,827 19,747, , % 5.2% Outbound 2,048,507 2,687,082 (638,575) (23.8%) 3.6% 15,758,862 17,712,440 (1,953,578) (11.0%) 4.0% Air Mail Total 4,739,698 5,404,507 (664,809) (12.3%) 8.4% 36,305,689 37,460,098 (1,154,409) (3.1%) 9.3% Freight & Express Inbound 30,661,490 28,497,371 2,164, % 54.6% 208,182, ,098,897 5,083, % 53.1% Outbound 20,735,760 18,355,828 2,379, % 36.9% 147,417, ,165,315 11,251, % 37.6% F&E Total 51,397,250 46,853,199 4,544, % 91.6% 355,600, ,264,212 16,335, % 90.7% Total Cargo 56,136,948 52,257,706 3,879, % 100.0% 391,905, ,724,310 15,181, % 100.0% By Carrier Type Cargo 40,347,374 38,006,056 2,341, % 71.9% 280,857, ,699,595 11,158, % 71.7% Passenger 15,789,574 14,251,650 1,537, % 28.1% 111,047, ,024,715 4,023, % 28.3% Total Cargo 56,136,948 52,257,706 3,879, % 100.0% 391,905, ,724,310 15,181, % 100.0% (1) An aircraft operation is either a landing or takeoff or contact with the control tower (as reported by FAA). (2) Revenue and non-revenue domestic and international passengers (as reported by the individual airlines). (3) Airline Category includes the following: Major/National (i.e. United, Southwest, Frontier, etc.); Foreign Flag (i.e. Lufthansa, British Airways, etc.); Regional (i.e. United Express, Delta Connection, etc.); Charter/Misc (i.e. charter operations, diversions, etc.) (4) For additional detail see the Cargo Report.
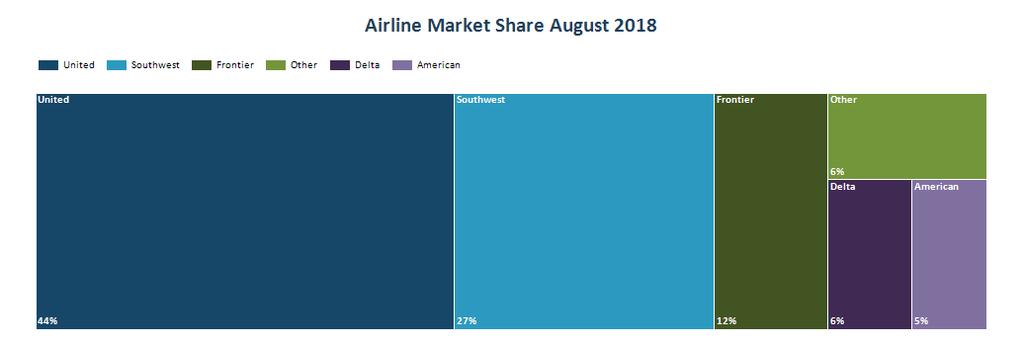
2 Total Passengers by Airline August Year To Date Airline Change % Change Change % Change 2018 Market Share 2017 Market Share United United Air Lines, Inc. 1,785,179 1,672, , % 12,502,449 12,147, , % 29.1% 29.5% United Int'l 35,922 27,848 8, % 413, ,111 58, % 1.0% 0.9% United Int'l Pre-clear 29,351 30,051 (700) (2.3%) 189, ,239 3, % 0.4% 0.5% Total United 1,850,452 1,730, , % 13,105,035 12,689, , % 30.5% 30.8% United Express Air Wisconsin Airlines Corporation 5, , % 15, , % 0.0% 0.0% ExpressJet/United Express % (230) (100.0%) 0.0% 0.0% GoJet Airlines, LLC 78, ,947 (22,990) (22.6%) 609, ,948 (140,952) (18.8%) 1.4% 1.8% GoJet Int'l. 6,377 6,644 (267) (4.0%) 53,825 47,242 6, % 0.1% 0.1% Republic/United Express 61,027 58,279 2, % 375, ,647 4, % 0.9% 0.9% Republic/United Express (Int'l) (810) (100.0%) ,672 (15,077) (96.2%) 0.0% 0.0% Shuttle America Corporation % (247) (100.0%) 0.0% 0.0% SkyWest Airlines, Inc. 451, ,573 85, % 3,091,371 2,520, , % 7.2% 6.1% SkyWest Airlines/UAX Int'l. 26,609 26, % 157, ,937 6, % 0.4% 0.4% Trans States Airlines/UAX 151,480 92,450 59, % 1,086, , , % 2.5% 1.9% Total United Express 781, , , % 5,390,933 4,654, , % 12.6% 11.3% Total United 2,632,093 2,383, , % 18,495,968 17,343,681 1,152, % 43.1% 42.2% Southwest Southwest Airlines Co. 1,616,116 1,661,546 (45,430) (2.7%) 12,236,830 11,879, , % 28.5% 28.9% Southwest Airlines Co. Int'l. 13,864 17,832 (3,968) (22.3%) 222, ,381 15, % 0.5% 0.5% Total Southwest 1,629,980 1,679,378 (49,398) (2.9%) 12,458,963 12,086, , % 29.0% 29.4% Frontier Frontier Airlines, Inc. 699, ,103 45, % 4,718,025 4,668,450 49, % 11.0% 11.3% Frontier Int'l 9,557 11,056 (1,499) (13.6%) 107, ,133 (21,247) (16.5%) 0.3% 0.3% Frontier Int'l Pre-clear 3, , % 11, , % 0.0% 0.0% Total Frontier 712, ,159 47, % 4,836,952 4,797,583 39, % 11.3% 11.7% American American Airlines, Inc. 288, ,580 (35,158) (10.9%) 2,203,781 2,199,917 3, % 5.1% 5.3% Compass/American Eagle 7, , % 21,447 58,459 (37,012) (63.3%) 0.0% 0.1% Envoy (formerly American Eagle) % % 0.0% 0.0% ExpressJet/American Eagle % % 0.0% 0.0% Mesa/American Eagle % % 0.0% 0.0% Skywest/American Eagle % 1, , % 0.0% 0.0% Total American 295, ,580 (27,657) (8.5%) 2,227,663 2,258,647 (30,984) (1.4%) 5.2% 5.5% Delta Compass Airlines/Delta Connection 3, , % 58,278 74,730 (16,452) (22.0%) 0.1% 0.2% Delta Air Lines, Inc. 316, ,681 39, % 2,215,498 1,825, , % 5.2% 4.4% Endeavor Air/Delta Connection (164) (22.5%) 3,950 5,999 (2,049) (34.2%) 0.0% 0.0% GoJet dba Delta Connection % 0 4,097 (4,097) (100.0%) 0.0% 0.0% SkyWest/Delta Connection 14,446 42,435 (27,989) (66.0%) 73, ,008 (208,014) (73.8%) 0.2% 0.7% Total Delta 334, ,844 15, % 2,351,720 2,191, , % 5.5% 5.3% Other Aerodynamics, Inc. d/b/a California 4,087 3, % 29,980 26,860 3, % 0.1% 0.1% Aerovias de Mexico S.A. de C.V. 0 2,702 (2,702) (100.0%) 19,748 24,155 (4,407) (18.2%) 0.0% 0.1% Air Canada 15,067 15,074 (7) (0.0%) 111, ,237 8, % 0.3% 0.3% Air Canada Rouge % 0 95 (95) (100.0%) 0.0% 0.0% Air Transat (Canada) % (104) (100.0%) 0.0% 0.0% Alaska Airlines, Inc. 56,510 54,340 2, % 442, ,488 77, % 1.0% 0.9% Allegiant Air, LLC 7,599 3,201 4, % 42,061 12,481 29, % 0.1% 0.0% Atlas Air, Inc (158) (100.0%) (158) (100.0%) 0.0% 0.0% Boutique Air, Inc. 5,033 5,338 (305) (5.7%) 38,727 36,818 1, % 0.1% 0.1% British Airways, Plc 18,174 19,104 (930) (4.9%) 133, , % 0.3% 0.3% Compania Panamena de Aviacion S.A. 4, , % 37, , % 0.1% 0.0% Concesionaria Vuela Compañía de 8,213 6,799 1, % 70,047 61,657 8, % 0.2% 0.1% Edelweiss Air AG 4, , % 12, , % 0.0% 0.0% Elite Airways (70) (51.5%) 1, % 0.0% 0.0% Great Lakes Aviation, LTD. 0 3,813 (3,813) (100.0%) 3,918 33,364 (29,446) (88.3%) 0.0% 0.1% Icelandair ehf 11,446 12,952 (1,506) (11.6%) 65,996 74,712 (8,716) (11.7%) 0.2% 0.2% Jazz Aviation LP 8,836 7,483 1, % 50,536 23,783 26, % 0.1% 0.1% JetBlue Airways Corporation 30,289 36,162 (5,873) (16.2%) 217, ,488 (8,746) (3.9%) 0.5% 0.6% Key Lime Air Corporation d/b/a Denver 3,359 2, % 22,247 19,311 2, % 0.1% 0.0% Lufthansa German Airlines 32,044 35,238 (3,194) (9.1%) 240, ,877 6, % 0.6% 0.6% Miami Air International, Inc % % 0.0% 0.0% Miami Air International, Inc.-Int'l % (476) (74.0%) 0.0% 0.0% MN Airlines, LLC 8,048 8,767 (719) (8.2%) 49,115 51,497 (2,382) (4.6%) 0.1% 0.1% Norwegian Air Shuttle ASA Limited 4, , % 39, , % 0.1% 0.0% Norwegian Air UK Ltd. 7, , % 39, , % 0.1% 0.0% Peninsula Airways Inc. 0 3,270 (3,270) (100.0%) 0 25,231 (25,231) (100.0%) 0.0% 0.1% Sierra Pacific Airlines, Inc (72) (100.0%) 0 72 (72) (100.0%) 0.0% 0.0% Sky Regional Airlines, Inc. 7,349 3,688 3, % 25,700 21,864 3, % 0.1% 0.1% Spirit Airlines, Inc. 123, ,631 13, % 795, ,204 (25,911) (3.2%) 1.9% 2.0% Sun Country (Int'l) % 1, , % 0.0% 0.0% Via Airlines LLC (392) (100.0%) 0 1,916 (1,916) (100.0%) 0.0% 0.0% Virgin America Inc 0 21,618 (21,618) (100.0%) 12, ,066 (145,410) (92.0%) 0.0% 0.4% WestJet Airlines 7, , % 40, , % 0.1% 0.0% Xtra Airways % (474) (100.0%) 0.0% 0.0% Total Other 367, ,954 11, % 2,544,165 2,457,084 87, % 5.9% 6.0% Grand Total(¹) 5,973,496 5,727, , % 42,915,431 41,135,263 1,780, % 100.0% 100.0% (1) Passenger totals represent revenue and non-revenue passengers as reported by the individual airlines.
3
4 Cargo Report Airline Air Mail Freight & Express Total Cargo Inbound Outbound Inbound Outbound Change % Change % Share Alpine Air Express, Inc , , , ,564 (1,919) (0.7%) 0.5% Atlas Air, Inc ,088,507 1,190,973 3,279,480 25,656 3,253, % 5.8% Atlas Air/DHL Express ,807 10, , % 0.0% Bemidji Aviation Services, Inc ,553 65,544 89,097 61,706 27, % 0.2% Federal Express Corporation ,528,045 9,270,135 21,798,180 21,689, , % 38.8% Southern Air Inc , , , , % 0.6% United Parcel Service Co. 134,108 84,305 8,367,379 5,992,561 14,578,353 15,788,687 (1,210,334) (7.7%) 26.0% Total Cargo-Only 134,108 84,305 23,063,784 17,065,177 40,347,374 38,031,712 2,315, % 71.9% Alaska Airlines, Inc. 0 3,981 93,860 11, ,906 90,638 18, % 0.2% American Airlines, Inc. 241, ,959 1,047,401 45,788 1,435, ,107 1,068, % 2.6% British Airways, Plc , , , ,901 (120,599) (13.1%) 1.4% Compass/American Eagle % 0.0% Delta Air Lines, Inc. 318, , ,287 47, , , , % 1.2% Icelandair ehf ,923 3,657 23,580 13,598 9, % 0.0% Lufthansa German Airlines 0 0 1,147, ,794 1,528,780 1,434,769 94, % 2.7% MN Airlines, LLC 207 1,597 12, ,187 21,010 (6,823) (32.5%) 0.0% Norwegian Air Shuttle ASA Limited , , , % 0.1% Norwegian Air UK Ltd , , , % 0.2% Southwest Airlines Co ,729,599 1,434,934 3,164,533 3,144,748 19, % 5.6% United Air Lines, Inc. 1,996,563 1,666,244 1,614, ,620 6,223,231 6,984,583 (761,352) (10.9%) 11.1% United Int'l 0 0 1,237, ,168 1,669, , , % 3.0% Total Passengers/Other 2,557,083 1,964,202 7,597,706 3,670,583 15,789,574 14,225,994 1,563, % 28.1% Grand Total 2,691,191 2,048,507 30,661,490 20,735,760 56,136,948 52,257,706 3,879, % 100.0%
5 Cargo Report Year To Date Through Airline Air Mail Freight & Express Total Cargo Inbound Outbound Inbound Outbound Change % Change % Share ABX Air, Inc ,225 15,552 16, , % 0.0% Alpine Air Express, Inc. 100, , ,095 1,129,583 1,874,977 1,684, , % 0.5% Atlas Air, Inc ,738,978 3,062,984 8,801,962 25,656 8,776, % 2.2% Atlas Air/DHL Express , , ,226 1,331,987 (405,761) (30.5%) 0.2% Bemidji Aviation Services, Inc , , , , , % 0.2% Federal Express Corporation ,937,954 68,531, ,469, ,298, , % 40.7% Kalitta Air, LLC ,386 (98,386) (100.0%) 0.0% KFS Kalitta Chrt ,995 (54,995) (100.0%) 0.0% Southern Air Inc ,928,745 1,615,030 3,543,775 3,825,447 (281,672) (7.4%) 0.9% United Parcel Service Co. 702, ,300 60,405,840 44,098, ,607, ,965,671 2,641, % 26.9% Total Cargo-Only 803, , ,788, ,548, ,857, ,725,251 11,132, % 71.7% Alaska Airlines, Inc. 0 63, ,349 77, , ,563 (17,086) (3.2%) 0.1% American Airlines, Inc. 2,155, ,067 1,727, ,051 4,940,216 2,739,256 2,200, % 1.3% British Airways, Plc 0 0 3,895,660 2,947,765 6,843,425 7,924,517 (1,081,092) (13.6%) 1.7% Compass/American Eagle ,637 (14,715) (94.1%) 0.0% Delta Air Lines, Inc. 2,493,899 1,291,521 1,320, ,987 5,535,168 2,822,789 2,712, % 1.4% Icelandair ehf ,071 8, ,910 98,076 98, % 0.1% Lufthansa German Airlines 0 0 6,606,016 3,483,878 10,089,894 11,303,836 (1,213,942) (10.7%) 2.6% MN Airlines, LLC 29,093 41,369 70, , ,718 (1,208) (0.9%) 0.0% Norwegian Air Shuttle ASA Limited , , , % 0.2% Norwegian Air UK Ltd , , , % 0.1% Skywest/American Eagle % 0.0% Southwest Airlines Co ,198,389 9,258,756 21,457,145 22,506,814 (1,049,669) (4.7%) 5.5% United Air Lines, Inc. 15,065,464 13,103,672 12,765,354 7,913,412 48,847,902 51,646,614 (2,798,712) (5.4%) 12.5% United Int'l 0 0 7,887,101 3,231,108 11,118,209 7,263,239 3,854, % 2.8% Total Passengers/Other 19,743,686 15,040,944 48,394,403 27,868, ,047, ,999,059 4,048, % 28.3% Grand Total 20,546,827 15,758, ,182, ,417, ,905, ,724,310 15,181, % 100.0%
Operations and Traffic December 2018
 Operations and Traffic Operations(¹) 2018 2017 Change % Change % Total YTD 2018 YTD 2017 Change % Change % Total Air Carrier 38,468 37,106 1,362 3.7% 77.0% 462,276 461,992 284 0.1% 76.6% Air Taxi 11,198
Operations and Traffic November 2018
 Operations and Traffic Operations(¹) 2018 2017 Change % Change % Total YTD 2018 YTD 2017 Change % Change % Total Air Carrier 37,928 36,266 1,662 4.6% 77.8% 422,673 424,886 (2,213) (0.5%) 76.6% Air Taxi
Operations and Traffic March 2018
 Operations and Traffic Operations(¹) 2018 2017 Change % Change % Total YTD 2018 YTD 2017 Change % Change % Total Air Carrier 37,359 39,210 (1,851) (4.7%) 75.8% 103,577 107,908 (4,331) (4.0%) 75.6% Air
Operations and Traffic June 2018
 Operations and Traffic Operations(¹) 2018 2017 Change % Change % Total YTD 2018 YTD 2017 Change % Change % Total Air Carrier 41,390 41,225 165 0.4% 76.7% 221,390 225,992 (4,602) (2.0%) 76.4% Air Taxi 12,124
DENVER INTERNATIONAL AIRPORT. TOTAL OPERATIONS AND TRAFFIC September 2017
 September YEAR TO DATE % of % of % Grand % Grand cr./ cr./ cr./ cr./ 2017 2016 Decr. Decr. 2017 2017 2016 Decr. Decr. 2017 OPERATIONS (1) Air Carrier 37,972 38,529 (557) -1.4% 79.5% 349,858 332,457 17,401
DENVER INTERNATIONAL AIRPORT. TOTAL OPERATIONS AND TRAFFIC October 2017
 October YEAR TO DATE % of % of % Grand % Grand cr./ cr./ cr./ cr./ 2017 2016 Decr. Decr. 2017 2017 2016 Decr. Decr. 2017 OPERATIONS (1) Air Carrier 38,762 38,970 (208) -0.5% 79.6% 388,620 371,427 17,193
DENVER INTERNATIONAL AIRPORT. TOTAL OPERATIONS AND TRAFFIC January 2017
 January YEAR TO DATE % of % of % Grand % Grand Incr./ Incr./ Total Incr./ Incr./ Total 2017 2016 Decr. Decr. 2017 2017 2016 Decr. Decr. 2017 OPERATIONS (1) Air Carrier 35,779 35,235 544 1.5% 78.0% 35,779
DENVER INTERNATIONAL AIRPORT. TOTAL OPERATIONS AND TRAFFIC June 2015 Revised 11/23/15
 DENVER INTERNATIONAL AIRPORT TOTAL OPERATIONS AND TRAFFIC June 2015 Revised 11/23/15 June YEAR TO DATE % of % of % Grand % Grand cr./ cr./ cr./ cr./ 2015 (9) 2014 Decr. Decr. 2015 2015 (9) 2014 Decr. Decr.
DENVER INTERNATIONAL AIRPORT. TOTAL OPERATIONS AND TRAFFIC December 2014
 DENVER INTERNATIONAL AIRPORT TOTAL OPERATIONS AND TRAFFIC December 2014 December YEAR TO DATE % of % of % Grand % Grand cr./ cr./ cr./ cr./ 2014 2013 Decr. Decr. 2014 2014 2013 Decr. Decr. 2014 OPERATIONS
DENVER INTERNATIONAL AIRPORT. TOTAL OPERATIONS AND TRAFFIC February 2014
 DENVER INTERNATIONAL AIRPORT TOTAL OPERATIONS AND TRAFFIC February 2014 February YEAR TO DATE % of % of % Grand % Grand cr./ cr./ cr./ cr./ 2014 2013 Decr. Decr. 2014 2014 2013 Decr. Decr. 2014 OPERATIONS
DENVER INTERNATIONAL AIRPORT
 DENVER INTERNATIONAL AIRPORT TOTAL OPERATIONS AND TRAFFIC October 2013 October YEAR TO DATE % of % of % Grand % Grand cr./ cr./ Total cr./ cr./ Total 2013 2012 Decr. Decr. 2013 2013 2012 Decr. Decr. 2013
DENVER INTERNATIONAL AIRPORT. TOTAL OPERATIONS AND TRAFFIC December 2013
 DENVER INTERNATIONAL AIRPORT TOTAL OPERATIONS AND TRAFFIC December 2013 December YEAR TO DATE % of % of % Grand % Grand cr./ cr./ cr./ cr./ 2013 2012 Decr. Decr. 2013 2013 2012 Decr. Decr. 2013 OPERATIONS
DENVER INTERNATIONAL AIRPORT. TOTAL OPERATIONS AND TRAFFIC November 2013
 DENVER INTERNATIONAL AIRPORT TOTAL OPERATIONS AND TRAFFIC November 2013 November YEAR TO DATE % of % of % Grand % Grand cr./ cr./ cr./ cr./ 2013 2012 Decr. Decr. 2013 2013 2012 Decr. Decr. 2013 OPERATIONS
DENVER INTERNATIONAL AIRPORT. TOTAL OPERATIONS AND TRAFFIC January 2012
 DENVER INTERNATIONAL AIRPORT TOTAL OPERATIONS AND TRAFFIC January 2012 January YEAR TO DATE % of % of % Grand % Grand Incr./ Incr./ Total Incr./ Incr./ Total 2012 2011 (9) Decr. Decr. 2012 2012 2011 (9)
DENVER INTERNATIONAL AIRPORT
 DENVER INTERNATIONAL AIRPORT TOTAL OPERATIONS AND TRAFFIC December YEAR TO DATE % of % of % Grand % Grand cr./ cr./ Total cr./ cr./ Total 2011 2010 Decr. Decr. 2011 2011 (9) 2010 (10) Decr. Decr. 2011
Los Angeles World Airports (LAWA) Traffic Comparison (TCOM) Los Angeles International Airport Calendar YTD January to December
 Traffic Comparison (TCOM) Los Angeles International Airport Calendar YTD January to December") Los Angeles World Airports (LAWA) Traffic Comparison (TCOM) Los Angeles Airport Calendar YTD January to December Jan-214 Jan-213 to to Dec-214 Dec-213 % Change Dec-214 Dec-213 % Change Passenger Traffic
Los Angeles World Airports (LAWA) Traffic Comparison (TCOM) Los Angeles Airport Calendar YTD January to December Jan-214 Jan-213 to to Dec-214 Dec-213 % Change Dec-214 Dec-213 % Change Passenger Traffic
MONTHLY AIRPORT TRAFFIC REPORT May 2015
 MONTHLY AIRPORT TRAFFIC REPORT AIRCRAFT OPERATIONS 2015 2014 Change Domestic Air Carrier 60,427 57,339 5.39% Air Taxi 7,825 10,967-28.65% General Aviation 547 635-13.86% Military 135 27 400.00% Subtotal
MONTHLY AIRPORT TRAFFIC REPORT April 2017
 MONTHLY AIRPORT TRAFFIC REPORT AIRCRAFT OPERATIONS 2017 2016 Change Domestic Air Carrier 56,570 60,697-6.80% Air Taxi 7,771 7,806-0.45% General Aviation 833 699 19.17% Military 23 14 64.29% Subtotal 65,197
MONTHLY AIRPORT TRAFFIC REPORT. April 2014
 MONTHLY AIRPORT TRAFFIC REPORT AIRCRAFT OPERATIONS 2014 2013 Change Domestic Air Carrier 55,529 55,119 0.74% Air Taxi 11,149 15,077-26.05% General Aviation 639 723-11.62% Military 13 14-7.14% Subtotal
Los Angeles World Airports (LAWA) Traffic Comparison (TCOM) Ontario International Airport Calendar YTD January to April
 Traffic Comparison (TCOM) Ontario International Airport Calendar YTD January to April") Passenger Traffic s Los Angeles World Airports (LAWA) Traffic Comparison (TCOM) Ontario Airport Calendar YTD January to April 5/25/216, 8:3 AM Jan-216 Jan-215 to to Apr-216 Apr-215 % Change Apr-216 Apr-215
Passenger Traffic s Los Angeles World Airports (LAWA) Traffic Comparison (TCOM) Ontario Airport Calendar YTD January to April 5/25/216, 8:3 AM Jan-216 Jan-215 to to Apr-216 Apr-215 % Change Apr-216 Apr-215
MONTHLY AIRPORT TRAFFIC REPORT September 2018
 MONTHLY AIRPORT TRAFFIC REPORT AIRCRAFT OPERATIONS 2018 2017 Change Domestic Air Carrier 58,763 55,902 5.12% Air Taxi 6,537 6,689-2.27% General Aviation 605 658-8.05% Military 14 17-17.65% Subtotal 65,919
MONTHLY AIRPORT TRAFFIC REPORT December 2018
 MONTHLY AIRPORT TRAFFIC REPORT AIRCRAFT OPERATIONS 2018 2017 Change Domestic Air Carrier 58,905 55,828 5.51% Air Taxi 6,948 6,810 2.03% General Aviation 499 565-11.68% Military 24 25-4.00% Subtotal 66,376
MONTHLY AIRPORT TRAFFIC REPORT December 2017
 MONTHLY AIRPORT TRAFFIC REPORT AIRCRAFT OPERATIONS 2017 2016 Change Domestic Air Carrier 55,828 57,943-3.65% Air Taxi 6,810 7,642-10.89% General Aviation 565 569-0.70% Military 25 32-21.88% Subtotal 63,228
MONTHLY AIRPORT TRAFFIC REPORT June 2017
 MONTHLY AIRPORT TRAFFIC REPORT AIRCRAFT OPERATIONS 2017 2016 Change Domestic Air Carrier 61,445 62,662-1.94% Air Taxi 8,267 7,656 7.98% General Aviation 644 685-5.99% Military 8 18-55.56% Subtotal 70,364
MONTHLY AIRPORT TRAFFIC REPORT August 2018
 MONTHLY AIRPORT TRAFFIC REPORT AIRCRAFT OPERATIONS 2018 2017 Change Domestic Air Carrier 65,465 63,201 3.58% Air Taxi 7,607 7,533 0.98% General Aviation 594 609-2.46% Military 15 3 400.00% Subtotal 73,681
MONTHLY AIRPORT TRAFFIC REPORT July 2017
 MONTHLY AIRPORT TRAFFIC REPORT AIRCRAFT OPERATIONS 2017 2016 Change Domestic Air Carrier 63,535 63,680-0.23% Air Taxi 7,291 7,548-3.40% General Aviation 630 717-12.13% Military 15 11 36.36% Subtotal 71,471
MONTHLY AIRPORT TRAFFIC REPORT January 2018
 MONTHLY AIRPORT TRAFFIC REPORT AIRCRAFT OPERATIONS 2018 2017 Change Domestic Air Carrier 55,461 55,980-0.93% Air Taxi 7,166 7,330-2.24% General Aviation 690 625 10.40% Military 6 11-45.45% Subtotal 63,323
MONTHLY AIRPORT TRAFFIC REPORT September 2016
 MONTHLY AIRPORT TRAFFIC REPORT AIRCRAFT OPERATIONS 2016 2015 Change Domestic Air Carrier 59,030 59,038-0.01% Air Taxi 7,779 7,201 8.03% General Aviation 704 571 23.29% Military 21 12 75.00% Subtotal 67,534
MONTHLY AIRPORT TRAFFIC REPORT March 2017
 MONTHLY AIRPORT TRAFFIC REPORT AIRCRAFT OPERATIONS 2017 2016 Change Domestic Air Carrier 60,360 61,951-2.57% Air Taxi 8,591 8,270 3.88% General Aviation 717 615 16.59% Military 14 27-48.15% Subtotal 69,682
MONTHLY AIRPORT TRAFFIC REPORT July 2018-(Revised)
") MONTHLY AIRPORT TRAFFIC REPORT AIRCRAFT OPERATIONS 2018 2017 Change Domestic Air Carrier 64,066 63,535 0.84% Air Taxi 7,468 7,291 2.43% General Aviation 550 630-12.70% Military 5 15-66.67% Subtotal 72,089
MONTHLY AIRPORT TRAFFIC REPORT AIRCRAFT OPERATIONS 2018 2017 Change Domestic Air Carrier 64,066 63,535 0.84% Air Taxi 7,468 7,291 2.43% General Aviation 550 630-12.70% Military 5 15-66.67% Subtotal 72,089
MONTHLY AIRPORT TRAFFIC REPORT February 2018
 MONTHLY AIRPORT TRAFFIC REPORT AIRCRAFT OPERATIONS 2018 2017 Change Domestic Air Carrier 51,809 51,854-0.09% Air Taxi 6,659 6,988-4.71% General Aviation 651 540 20.56% Military 6 9-33.33% Subtotal 59,125
Los Angeles World Airports (LAWA) Traffic Comparison (TCOM) Los Angeles International Airport
 Traffic Comparison (TCOM) Los Angeles International Airport") Los Angeles World Airports (LAWA) Traffic Comparison (TCOM) Los Angeles Airport Passenger Traffic s 1 3,43,69 1,6,73 September 1 3,85,664 1,5,195 4.47% Calendar YTD September 9 % Change 1 9 3,4,561 31,6,815
Los Angeles World Airports (LAWA) Traffic Comparison (TCOM) Los Angeles Airport Passenger Traffic s 1 3,43,69 1,6,73 September 1 3,85,664 1,5,195 4.47% Calendar YTD September 9 % Change 1 9 3,4,561 31,6,815
Los Angeles World Airports (LAWA) Traffic Comparison (TCOM) Los Angeles International Airport
 Traffic Comparison (TCOM) Los Angeles International Airport") Los Angeles World Airports (LAWA) Traffic Comparison (TCOM) Los Angeles Airport Passenger Traffic s 1 3,75,6 1,34,133 December 1 3,474,16 1,35,576 7.% Calendar YTD December 9 % Change 1 9 43,134,145 41,419,913
Los Angeles World Airports (LAWA) Traffic Comparison (TCOM) Los Angeles Airport Passenger Traffic s 1 3,75,6 1,34,133 December 1 3,474,16 1,35,576 7.% Calendar YTD December 9 % Change 1 9 43,134,145 41,419,913
MONTHLY AIRPORT TRAFFIC REPORT April 2018
 MONTHLY AIRPORT TRAFFIC REPORT AIRCRAFT OPERATIONS 2018 2017 Change Domestic Air Carrier 60,928 56,570 7.70% Air Taxi 6,995 7,771-9.99% General Aviation 654 833-21.49% Military 9 23-60.87% Subtotal 68,586
MONTHLY AIRPORT TRAFFIC REPORT November 2013
 MONTHLY AIRPORT TRAFFIC REPORT AIRCRAFT OPERATIONS 2013 2012 Change Domestic Air Carrier 52,937 54,739-3.29% Air Taxi 13,964 13,566 2.93% General Aviation 504 515-2.14% Military 25 28-10.71% Subtotal 67,430
Los Angeles World Airports (LAWA) Traffic Comparison (TCOM) Ontario International Airport Calendar YTD January to March
 Traffic Comparison (TCOM) Ontario International Airport Calendar YTD January to March") Passenger Traffic s Los Angeles World Airports (LAWA) Traffic Comparison (TCOM) Ontario Airport Calendar YTD January to March 4/25/216, 8:42 AM Jan-216 Jan-215 to to Mar-216 Mar-215 % Change Mar-216 Mar-215
Passenger Traffic s Los Angeles World Airports (LAWA) Traffic Comparison (TCOM) Ontario Airport Calendar YTD January to March 4/25/216, 8:42 AM Jan-216 Jan-215 to to Mar-216 Mar-215 % Change Mar-216 Mar-215
MONTHLY AIRPORT TRAFFIC REPORT July 2016
 MONTHLY AIRPORT TRAFFIC REPORT AIRCRAFT OPERATIONS 2016 2015 Change Domestic Air Carrier 63,680 62,789 1.42% Air Taxi 7,548 8,007-5.73% General Aviation 717 558 28.49% Military 11 146-92.47% Subtotal 71,956
MONTHLY AIRPORT TRAFFIC REPORT February 2014
 MONTHLY AIRPORT TRAFFIC REPORT AIRCRAFT OPERATIONS 2014 2013 Change Domestic Air Carrier 44,741 48,627-7.99% Air Taxi 11,144 13,003-14.30% General Aviation 569 543 4.79% Military 17 15 13.33% Subtotal
PORTLAND INTERNATIONAL AIRPORT (PDX)
") Monthly Traffic Report e, 20: Fiscal Year Report This Month Fiscal Year to Date 20 20 %Chg 20 20 %Chg Total PDX Flight Operations * 23,003 22,256 3.4% 263,777 260,745 1.2% Military 410 450-8.9% 4,445 6,431-30.9%
Monthly Traffic Report e, 20: Fiscal Year Report This Month Fiscal Year to Date 20 20 %Chg 20 20 %Chg Total PDX Flight Operations * 23,003 22,256 3.4% 263,777 260,745 1.2% Military 410 450-8.9% 4,445 6,431-30.9%
PORTLAND INTERNATIONAL AIRPORT (PDX)
") Monthly Traffic Report This Month Calendar Year to Date 2007 2006 %Chg 2007 2006 %Chg Total PDX Flight Operations * 21,618 21,633-0.1% 264,518 260,510 1.5% Military 97 328-70.4% 3,707 5,023-26.2% General
Monthly Traffic Report This Month Calendar Year to Date 2007 2006 %Chg 2007 2006 %Chg Total PDX Flight Operations * 21,618 21,633-0.1% 264,518 260,510 1.5% Military 97 328-70.4% 3,707 5,023-26.2% General
MONTHLY STATISTICAL REPORT SUMMARY. for the month of January 2018
 MONTHLY STATISTICAL REPORT SUMMARY for the month of January 2018 MONTHLY PERFORMANCE COMPARISON VS. JANUARY 2017 COMMERCIAL PASSENGERS 2018 2017 %CHANGE DOM. INT. TOTAL DOM. INT. TOTAL DOM. INT. TOTAL
PORTLAND INTERNATIONAL AIRPORT (PDX)
") Monthly Traffic Report This Month Calendar Year to Date 20 20 %Chg 20 20 %Chg Total PDX Flight Operations * 19,211,625 3.1% 233,993 228,949 2.2% Military 9 310-42.3% 3,520 4,144-15.1% General Aviation
Monthly Traffic Report This Month Calendar Year to Date 20 20 %Chg 20 20 %Chg Total PDX Flight Operations * 19,211,625 3.1% 233,993 228,949 2.2% Military 9 310-42.3% 3,520 4,144-15.1% General Aviation
PORTLAND INTERNATIONAL AIRPORT (PDX)
") Monthly Traffic Report ch, 20 This Month Calendar Year to Date 20 20 %Chg 20 20 %Chg Total PDX Flight Operations * 22,218 21,304 4.3% 62,789 61,057 2.8% Military 474 564-16.0% 1,127 1,503-25.0% General
Monthly Traffic Report ch, 20 This Month Calendar Year to Date 20 20 %Chg 20 20 %Chg Total PDX Flight Operations * 22,218 21,304 4.3% 62,789 61,057 2.8% Military 474 564-16.0% 1,127 1,503-25.0% General
PORTLAND INTERNATIONAL AIRPORT (PDX) Monthly Traffic Report November, 2006
 Monthly Traffic Report November, 2006") Monthly Traffic Report This Month Calendar Year to Date 2006 2005 %Chg 2006 2005 %Chg Total PDX Flight Operations * 20,714 21,257-2.6% 238,877 241,667-1.2% Military 355 476-25.4% 4,695 6,127-23.4% General
Monthly Traffic Report This Month Calendar Year to Date 2006 2005 %Chg 2006 2005 %Chg Total PDX Flight Operations * 20,714 21,257-2.6% 238,877 241,667-1.2% Military 355 476-25.4% 4,695 6,127-23.4% General
PORTLAND INTERNATIONAL AIRPORT (PDX)
") Monthly Traffic Report ch, 20 This Month Calendar Year to Date 20 20 %Chg 20 20 %Chg Total PDX Flight Operations * 21,537 22,218-3.1% 62,490 62,789-0.5% Military 242 474-48.9% 739 1,127-34.4% General Aviation
Monthly Traffic Report ch, 20 This Month Calendar Year to Date 20 20 %Chg 20 20 %Chg Total PDX Flight Operations * 21,537 22,218-3.1% 62,490 62,789-0.5% Military 242 474-48.9% 739 1,127-34.4% General Aviation
PORTLAND INTERNATIONAL AIRPORT (PDX)
") Monthly Traffic Report ember, 20: Calendar Year Report This Month Calendar Year to Date 20 20 %Chg 20 20 %Chg Total PDX Flight Operations * 18,625 18,586 0.2% 228,949 227,709 0.5% Military 310 254 22.0%
Monthly Traffic Report ember, 20: Calendar Year Report This Month Calendar Year to Date 20 20 %Chg 20 20 %Chg Total PDX Flight Operations * 18,625 18,586 0.2% 228,949 227,709 0.5% Military 310 254 22.0%
PORTLAND INTERNATIONAL AIRPORT (PDX)
") Monthly Traffic Report This Month Calendar Year to Date 20 20 %Chg 20 20 %Chg Total PDX Flight Operations * 15,731 15,520 1.4% 33,326 32,280 3.2% Military 211 0.2% 478 381 25.5% General Aviation 942 926
Monthly Traffic Report This Month Calendar Year to Date 20 20 %Chg 20 20 %Chg Total PDX Flight Operations * 15,731 15,520 1.4% 33,326 32,280 3.2% Military 211 0.2% 478 381 25.5% General Aviation 942 926
Airline Activity Report
 Airline Activity Report March 215 Airline Activity Summary For Month Ending March 215 Passenger Domestic Mar (cur) Mar (pre) Difference % Change YTD Mar (cur) YTD Mar (pre) Difference % Change Scheduled
PORTLAND INTERNATIONAL AIRPORT (PDX)
") Monthly Traffic Report e, 20: Fiscal Year Report This Month Fiscal Year to Date 20 20 %Chg 20 20 %Chg Total PDX Flight Operations * 21,213 20,651 2.7% 228,846 222,979 2.6% Military 334 374-10.7% 3,829
Monthly Traffic Report e, 20: Fiscal Year Report This Month Fiscal Year to Date 20 20 %Chg 20 20 %Chg Total PDX Flight Operations * 21,213 20,651 2.7% 228,846 222,979 2.6% Military 334 374-10.7% 3,829
PORTLAND INTERNATIONAL AIRPORT (PDX)
") Monthly Traffic Report il, 20 This Month Calendar Year to Date 20 20 %Chg 20 20 %Chg Total PDX Flight Operations * 21,262 20,818 2.1% 84,051 81,875 2.7% Military 354 419-15.5% 1,481 1,922-22.9% General
Monthly Traffic Report il, 20 This Month Calendar Year to Date 20 20 %Chg 20 20 %Chg Total PDX Flight Operations * 21,262 20,818 2.1% 84,051 81,875 2.7% Military 354 419-15.5% 1,481 1,922-22.9% General
PORTLAND INTERNATIONAL AIRPORT (PDX)
") Monthly Traffic Report uary, 20 This Month Calendar Year to Date 20 20 %Chg 20 20 %Chg Total PDX Flight Operations * 17,502 17,957-2.5% 17,502 17,957-2.5% Military 373 298 25.2% 373 298 25.2% General Aviation
Monthly Traffic Report uary, 20 This Month Calendar Year to Date 20 20 %Chg 20 20 %Chg Total PDX Flight Operations * 17,502 17,957-2.5% 17,502 17,957-2.5% Military 373 298 25.2% 373 298 25.2% General Aviation
ATLANTIC SOUTHEAST AIRLINES Scheduled ATLAS AIR INC. Nonscheduled
 TABLE 1. Summary of Aircraft Departures and Enplaned Passengers, Freight, and Mail by Carrier Group, Air Carrier, and Type of Service: 2008 ( Major carriers ) Aircraft Departures Enplaned revenue-tones
Los Angeles World Airports (LAWA) Traffic Comparison (TCOM) Ontario International Airport Calendar YTD January to January
 Traffic Comparison (TCOM) Ontario International Airport Calendar YTD January to January") Los Angeles World Airports (LAWA) Traffic Comparison (TCOM) Ontario Airport Calendar YTD January to January Jan-215 Jan-214 to to Jan-215 Jan-214 % Change Jan-215 Jan-214 % Change Passenger Traffic s 2,14
Los Angeles World Airports (LAWA) Traffic Comparison (TCOM) Ontario Airport Calendar YTD January to January Jan-215 Jan-214 to to Jan-215 Jan-214 % Change Jan-215 Jan-214 % Change Passenger Traffic s 2,14
ATLANTIC SOUTHEAST AIRLINES Scheduled
 TABLE 1. Summary of Aircraft Departures and Enplaned Passengers, Freight, and Mail by Carrier Group, Air Carrier, and Type of Service: 2007 ( Major carriers ) Aircraft Departures Enplaned revenue-tones
PORTLAND INTERNATIONAL AIRPORT (PDX)
") Monthly Traffic Report ember, 20: Calendar Year Report This Month Calendar Year to Date 20 20 %Chg 20 20 %Chg Total PDX Flight Operations * 18,0 21,618-16.7% 252,572 264,518-4.5% Military 238 97 145.4%
Monthly Traffic Report ember, 20: Calendar Year Report This Month Calendar Year to Date 20 20 %Chg 20 20 %Chg Total PDX Flight Operations * 18,0 21,618-16.7% 252,572 264,518-4.5% Military 238 97 145.4%
SAN FRANCISCO INTERNATIONAL AIRPORT
 SAN FRANCISCO INTERNATIONAL AIRPORT COMPARATIVE TRAFFIC REPORT March 2005 Fiscal Year-To-Date Mar 2005 Mar 2004 % Change 2005 2004 % Change Flight Operations - Total * Air Carrier Air Taxi Civil Military
SAN FRANCISCO INTERNATIONAL AIRPORT
 SAN FRANCISCO INTERNATIONAL AIRPORT COMPARATIVE TRAFFIC REPORT February 2005 Fiscal Year-To-Date Feb 2005 Feb 2004 % Change 2005 2004 % Change Flight Operations - Total * Air Carrier Air Taxi Civil Military
PORTLAND INTERNATIONAL AIRPORT (PDX)
") Monthly Traffic Report This Month Calendar Year to Date 2006 2005 %Chg 2006 2005 %Chg Total PDX Flight Operations * 21,304 22,342-4.6% 61,057 63,232-3.4% Military 564 564 0.0% 1,503 1,443 4.2% General
Monthly Traffic Report This Month Calendar Year to Date 2006 2005 %Chg 2006 2005 %Chg Total PDX Flight Operations * 21,304 22,342-4.6% 61,057 63,232-3.4% Military 564 564 0.0% 1,503 1,443 4.2% General
PORTLAND INTERNATIONAL AIRPORT (PDX)
") Monthly Traffic Report ember, 20 This Month Calendar Year to Date 20 20 %Chg 20 20 %Chg Total PDX Flight Operations * 21,586 21,810-1.0% 263,253 263,6 0.1% Military 489 481 1.7% 6,616 7,455-11.3% General
Monthly Traffic Report ember, 20 This Month Calendar Year to Date 20 20 %Chg 20 20 %Chg Total PDX Flight Operations * 21,586 21,810-1.0% 263,253 263,6 0.1% Military 489 481 1.7% 6,616 7,455-11.3% General
SAN FRANCISCO INTERNATIONAL AIRPORT
 SAN FRANCISCO INTERNATIONAL AIRPORT COMPARATIVE TRAFFIC REPORT December 2004 Fiscal Year-To-Date Dec 2004 Dec 2003 % Change 2004 2003 % Change Flight Operations - Total * Air Carrier Air Taxi Civil Military
DENVER INTERNATIONAL AIRPORT TOTAL OPERATIONS AND TRAFFIC DECEMBER 2003
 DENVER INTERNATIONAL AIRPORT TOTAL OPERATIONS AND TRAFFIC DECEMBER 2003 DECEMBER YEAR TO DATE % OF % OF % GRAND % GRAND INCR./ INCR./ TOTAL INCR./ INCR./ TOTAL 2003 2002 (10) DECR. DECR. 2003 2003 (9)
Since'&~~ Greater Orlando Aviation Authority. Orlando International Airport One Jeff Fuqua Boulevard Orlando, Florida (407)
") Greater Orlando Aviation Authority One Jeff Fuqua Boulevard Orlando, Florida 32827-4399 (407) 825-2001 March 25,2015 Digital Assurance Certification 390 North Orange A venue Suite 1750 Orlando, FL 32801
Greater Orlando Aviation Authority One Jeff Fuqua Boulevard Orlando, Florida 32827-4399 (407) 825-2001 March 25,2015 Digital Assurance Certification 390 North Orange A venue Suite 1750 Orlando, FL 32801
Calendar Year Basis Year Year Apr Apr Percent to Date to Date Percent Change Change
 T F Green Airport Monthly Airport Passenger Activity Summary April 2018 Calendar Year Basis Year Year Apr Apr Percent to Date to Date Percent 2018 2017 Change 2018 2017 Change Total Enplaned 194,510 157,788
Statistical Report Calendar Year 2013
 Statistical Report Year 213 Houston Airports P.O. Box 616 Houston, TX 7725-16 Request for User Input The intent of the monthly and annual statistical reports is to provide data that is both relevant and
Calendar Year Basis Year Year August August Percent to Date to Date Percent Change Change
 T F Green Airport Monthly Airport Passenger Activity Summary August 2018 Calendar Year Basis Year Year August August Percent to Date to Date Percent 2018 2017 Change 2018 2017 Change Total Enplaned 202,148
MEMPHIS INTERNATIONAL AIRPORT ACTIVITY REPORT FEBRUARY 2018
 MEMPHIS INTERNATIONAL AIRPORT ACTIVITY REPORT FEBRUARY 2018 Scott A. Brockman, President & CEO Forrest B. Artz, Vice President & CFO Terry S. Blue, Vice President MAJOR Scheduled DOMESTIC INTERNATIONAL
Calendar Year Basis Year Year May May Percent to Date to Date Percent Change Change
 T F Green Airport Monthly Airport Passenger Activity Summary May 2018 Calendar Year Basis Year Year May May Percent to Date to Date Percent 2018 2017 Change 2018 2017 Change Total Enplaned 192,063 158,331
Hillsboro Airport Operations 20,453 18, % 148, , % Troutdale Airport Operations 6,349 7, % 52,433 59,
 PORTLAND INTERNATIONAL AIRPORT (PDX) Monthly Traffic Report This Month Calendar Year to Date 2004 2003 % Chg 2004 2003 % Chg Total PDX Flight Operations * 21,944 22,594-2.9% 199,422 201,759-1.2% Military
Hillsboro Airport Operations 12,874 10, % 180, , % Troutdale Airport Operations 3,944 4, % 62,945 69,370-9.
 Monthly Traffic Report ember, 2004 This Month Calendar Year to Date 2004 2003 % Chg 2004 2003 % Chg Total PDX Flight Operations * 20,633 20,732-0.5% 241,236 245,333-1.7% Military 462 771-40.1% 6,974 7,884-11.5%
Monthly Airport Passenger Activity Summary
 T F Green Airport Monthly Airport Passenger Activity Summary December 2017 Calendar Year Basis Year Year Dec Dec Percent to Date to Date Percent 2017 2016 Change 2017 2016 Change Total Enplaned 175,889
Miami-Dade Aviation Department Aviation Statistics Flight Ops - All Airlines Facility: MIA Units: Flight Operations. Wednesday, February 28,
 17,034 17,868 13,465 12,598 60,965-0.92 American Airlines Inc 61,533 17,495 18,251 13,281 12,506 7,601 8,548 2,275 1,271 19,695 21.51 Envoy Air Inc 16,209 5,735 6,764 2,394 1,316 4,504 5,579 1,440 353
KANSAS CITY INTERNATIONAL AIRPORT TRAFFIC AND OPERATIONS Jan-19 MONTH TO DATE MONTH TO DATE
 TRAFFIC AND OPERATIONS % Change from 2018 YEAR YEAR MONTH TO DATE MONTH TO DATE Scheduled Enplaned 413,708 413,708 2.01 2.01 Deplaned 413,956 413,956 1.95 1.95 Total 827,664 827,664 1.98 1.98 Charter Enplaned
KANSAS CITY INTERNATIONAL AIRPORT TRAFFIC AND OPERATIONS Dec-18 MONTH TO DATE MONTH TO DATE
 TRAFFIC AND OPERATIONS % Change from 2017 YEAR YEAR MONTH TO DATE MONTH TO DATE Scheduled Enplaned 477,661 5,930,388 3.52 3.23 Deplaned 469,187 5,910,901 3.77 2.85 Total 946,848 11,841,289 3.64 3.04 Charter
LOUIS ARMSTRONG NEW ORLEANS INTERNATIONAL AIRPORT For the Period Ending September 30, Enplaned Passengers by Airline
 Domestic Scheduled Enplaned Passengers by Airline Alaska Airlines 7,070 4,331 63.2% 59,552 42,265 40.9% 1.2% 1.0% Virgin America 0 803-100.0% 12,231 803 1423.2% 0.3% 0.0% Allegiant Air 1,333 2,063-35.4%
DENVER INTERNATIONAL AIRPORT TOTAL OPERATIONS AND TRAFFIC JANUARY 2007
 TOTAL OPERATIONS AND TRAFFIC JANUARY % OF % GRAND INCR./ INCR./ TOTAL 2007 2006 DECR. DECR. 2007 OPERATIONS (1) Air Carrier 36,969 33,542 3,427 10.2% 72.9% Air Taxi 13,335 13,909-574 -4.1% 26.3% Military
Miami-Dade Aviation Department Aviation Statistics Flight Ops - All Airlines Facility: MIA Units: Flight Operations. Tuesday, December 11, 2018
 50,946 53,422 40,332 37,789 182,489 0.60 American Airlines Inc 181,392 51,073 53,402 39,639 37,278 21,657 24,554 6,780 3,758 56,749 6.75 Envoy Air Inc 53,160 19,786 22,807 6,837 3,730 11,093 13,991 3,698
KANSAS CITY INTERNATIONAL AIRPORT TRAFFIC AND OPERATIONS Jun-18 MONTH TO DATE MONTH TO DATE
 TRAFFIC AND OPERATIONS % Change from 2017 YEAR YEAR MONTH TO DATE MONTH TO DATE Scheduled Enplaned 560,613 2,875,583 4.73 2.71 Deplaned 564,014 2,851,413 4.37 2.37 Total 1,124,627 5,726,996 4.55 2.54 Charter
Miami-Dade Aviation Department Aviation Statistics Flight Ops - All Airlines Facility: MIA Units: Flight Operations
 38,439 40,280 30,403 28,506 137,628-0.58 American Airlines Inc 138,425 39,112 40,846 30,101 28,366 16,268 18,488 5,123 2,803 42,682 10.30 Envoy Air Inc 38,697 14,122 16,408 5,265 2,902 9,491 11,910 3,096
Miami-Dade Aviation Department Aviation Statistics Flight Ops - All Airlines Facility: MIA Units: Flight Operations. Friday, December 28, 2018
 51,124 53,607 40,295 37,729 182,755 0.87 American Airlines Inc 181,179 50,824 53,173 39,776 37,406 21,401 24,296 6,787 3,767 56,251 4.16 Envoy Air Inc 54,002 20,245 23,243 6,798 3,716 10,978 13,972 3,744
Monthly Airport Passenger Activity Summary
 T F Green Airport Monthly Airport Passenger Activity Summary January 2018 Calendar Year Basis Year Year Jan Jan Percent to Date to Date Percent 2018 2017 Change 2018 2017 Change Total Enplaned 148,452
Miami-Dade Aviation Department Aviation Statistics Flight Ops - All Airlines Facility: MIA Units: Flight Operations. Wednesday, January 23, 2019
 51,338 53,806 40,322 37,775 183,241 1.61 American Airlines Inc 180,331 50,557 52,914 39,628 37,232 21,274 24,183 6,752 3,735 55,944 1.84 Envoy Air Inc 54,934 20,745 23,694 6,774 3,721 10,931 13,914 3,698
AIR WISCONSIN AIRLINES CORP Scheduled
 06891 2U K 11 0 0 3 3 06891 2U K 2 0 0 51 169 TABLE 1. Summary of Aircraft Departures and Enplaned Passengers, Freight, and Mail by Carrier Group, Air Carrier, and Type of Service: 2004 ( Major carriers
Airline Activity Report
 Airline Activity Report September 218 Airline Activity Summary For Month Ending September 218 Passenger Domestic Sep (cur) Sep (pre) Difference % Change YTD Sep (cur) YTD Sep (pre) Difference % Change
MEMPHIS INTERNATIONAL AIRPORT ACTIVITY REPORT FEBRUARY 2019
 MEMPHIS INTERNATIONAL AIRPORT ACTIVITY REPORT FEBRUARY 2019 Scott A. Brockman, President & CEO Forrest B. Artz, Vice President & CFO Terry S. Blue, Vice President MAJOR Scheduled DOMESTIC INTERNATIONAL
Monthly Airport Passenger Activity Summary. October 2017
 T F Green Airport Monthly Airport Passenger Activity Summary October 2017 Calendar Year Basis Year Year Oct Oct Percent to Date to Date Percent 2017 2016 Change 2017 2016 Change Total Enplaned 196,345
DENVER INTERNATIONAL AIRPORT TOTAL OPERATIONS AND TRAFFIC MARCH 2008
 TOTAL OPERATIONS AND TRAFFIC MARCH 2008 MARCH YEAR TO DATE % OF % OF % GRAND % GRAND INCR./ INCR./ TOTAL INCR./ INCR./ TOTAL 2008 2007 (9) DECR. DECR. 2008 2008 2007 (10) DECR. DECR. 2008 OPERATIONS (1)
DENVER INTERNATIONAL AIRPORT TOTAL OPERATIONS AND TRAFFIC MARCH 2007 revised
 TOTAL OPERATIONS AND TRAFFIC revised 7.11.07 MARCH YEAR TO DATE % OF % OF % GRAND % GRAND INCR./ INCR./ TOTAL INCR./ INCR./ TOTAL 2007 2006 DECR. DECR. 2007 2007 (9) 2006 DECR. DECR. 2007 OPERATIONS (1)
PORTLAND INTERNATIONAL AIRPORT (PDX)
") Monthly Traffic Report This Month Calendar Year to Date 2005 2004 %Chg 2005 2004 %Chg Total PDX Flight Operations * 22,342 22,611-1.2% 63,232 61,699 2.5% Military 564 830-32.0% 1,443 2,052-29.7% General
Monthly Traffic Report This Month Calendar Year to Date 2005 2004 %Chg 2005 2004 %Chg Total PDX Flight Operations * 22,342 22,611-1.2% 63,232 61,699 2.5% Military 564 830-32.0% 1,443 2,052-29.7% General
Monthly Airport Passenger Activity Summary. Sep 2017
 T F Green Airport Monthly Airport Passenger Activity Summary Sep 2017 Calendar Year Basis Year Year Sep Sep Percent to Date to Date Percent 2017 2016 Change 2017 2016 Change Total Enplaned 161,165 151,982
Airline Activity Report
 Airline Activity Report November 218 Airline Activity Summary For Month Ending November 218 Passenger Domestic Nov (cur) Nov (pre) Difference % Change YTD Nov (cur) YTD Nov (pre) Difference % Change Scheduled
February SAT Passenger Count was Up 6% Over February 2015 YTD thru February 2016 Total Passengers Increased 5% over Same 2015 Period
 February 2016 - SAT Passenger Count was Up 6% Over February 2015 YTD thru February 2016 Total Passengers Increased 5% over Same 2015 Period The February 2016 San Antonio International Airport (SAT) passenger
Airline Activity Report
 Airline Activity Report October 217 Indianapolis International Airport Airline Activity Summary For Month Ending October 217 Passenger Domestic Oct (cur) Oct (pre) Difference % Change YTD Oct (cur) YTD
Airline Activity Report
 Airline Activity Report January 216 Airline Activity Summary For Month Ending January 216 Passenger Domestic Jan (cur) Jan (pre) Difference % Change YTD Jan (cur) YTD Jan (pre) Difference % Change Scheduled
1 01/21/ :04:38 PM
 McCarran International Airport ABC Aerolinease DBA Interjet Aeromexico Air Canada Air North AirTran Airberlin PLC & Co. Luftverkehrs KG Alaska Allegiant American DETAILED PASSENGER TYPE //4 4:4:8 PM,5
Airline Activity Report
 Airline Activity Report May 218 Indianapolis International Airport Airline Activity Summary For Month Ending May 218 Passenger Domestic May (cur) May (pre) Difference % Change YTD May (cur) YTD May (pre)
Monthly Airport Passenger Activity Summary. Aug 2017
 T F Green Airport Monthly Airport Passenger Activity Summary Aug 2017 Calendar Year Basis Year Year Aug Aug Percent to Date to Date Percent 2017 2016 Change 2017 2016 Change Total Enplaned 190,676 169,667
December Calendar Year Monthly Summary
 December Calendar Year Monthly Summary CY 2015/2014 % Change December YTD Total Passengers (1) 2,663,910 33,440,112 2,560,404 32,513,555 4.0% 2.8% Domestic Passengers (2) 2,456,317 30,572,043 2,328,675
PORTLAND INTERNATIONAL AIRPORT (PDX)
") Monthly Traffic Report This Month Calendar Year to Date 2005 2004 %Chg 2005 2004 %Chg Total PDX Flight Operations * 20,800 18,649 11.5% 20,800 18,649 11.5% Military 524 530-1.1% 524 530-1.1% General Aviation
Monthly Traffic Report This Month Calendar Year to Date 2005 2004 %Chg 2005 2004 %Chg Total PDX Flight Operations * 20,800 18,649 11.5% 20,800 18,649 11.5% Military 524 530-1.1% 524 530-1.1% General Aviation
Airline Activity Report
 Airline Activity Report August 217 Airline Activity Summary For Month Ending August 217 Passenger Domestic Aug (cur) Aug (pre) Difference % Change YTD Aug (cur) YTD Aug (pre) Difference % Change Scheduled
Airline Activity Report
 Airline Activity Report December 216 Indianapolis International Airport Airline Activity Summary For Month Ending December 216 Passenger Domestic Dec (cur) Dec (pre) Difference % Change YTD Dec (cur) YTD