North East Rail Trail Preliminary Demand and Economic Benefit Assessment
|
|
|
- Brianna Foster
- 6 years ago
- Views:
Transcription


1 North East Rail Trail Preliminary Demand and Economic Benefit Assessment Prepared for: February 2014 Prepared by:
2 Disclaimer Any representation, statement, opinion or advice, expressed or implied in this document is made in good faith with the information available to TRC Tourism Pty Ltd at the time of writing. On that basis TRC Tourism Pty Ltd is not liable to any person for any damage or loss whatsoever which has occurred or may occur in relation to that person taking or not taking action in respect of the any representation, statement or advice referred to in this document. The market demand assessment undertaken by TRC Tourism has been completed using existing data sources only. Assumptions made are stated in the report. TRC Tourism recommends that further assessment of the market demand for the Rail trail is undertaken to more thoroughly conclude the results. NORTH EAST RAIL TRAIL Preliminary demand and economic benefit assessment i

3 EXECUTIVE SUMMARY The North East Rail Trail involves the re-development of 89.6 kms of disused rail corridor from Launceston to Billycock Hill in the North East of Tasmania. This will create a shared use rail trail spanning a total length of 98.2 kms for non-motorised recreational users, which may include walkers and mountain bikers. The North East Rail Trail will travel through Dorset and Launceston City Municipalities linking towns and communities and potentially benefitting associated businesses in Dorset, Launceston, Scottsdale, Lilydale, Karoola, Lalla, Tunnel, Lebrina, Nabowla and Billycock Hill. Investment of $3.89 million in the construction of the rail trail is likely to bring significant socio economic benefit to the region and state. These benefits have been quantified by other rail trails in Australia and New Zealand. The preliminary assessment concludes that at five years post construction it is estimated the North East Rail Trail would increase direct tourism expenditure in the region by $3.5 million per annum. The flow-on impacts of this expenditure are significant and total output is expected to increase across Tasmania by $6.8million per annum and will also increase and gross state product (GSP) by $3.3 million per annum. This increase in economic activity is estimated to support 40 jobs (measured as full-time- equivalents, FTEs). The impact of the North East Rail Trail is expected to become progressively greater at ten and fifteen years post construction due to greater participation on the Trail. At fifteen years post construction the North East Rail Trail is estimated to increase output in Tasmania by $11.2 million per annum, increase GSP by $5.4million per annum and support 67 jobs (FTEs). In particular the employment impact of the rail trail will be significant for the communities of North East Tasmania given that a large proportion of the jobs created would be within the local region. Employment opportunities in remote or regional areas can be limited and the rail trail may provide a well needed boost to these communities. Participation in rail trail activities offers many social, health-related and cultural benefits to residents of North East Tasmania. It is envisaged that the participation rate in cycling in the North will increase with the development of the rail trail. This has the capacity to increase social morale as well as providing health benefits for the local population. This investment will provide a significant enhancement to the already funded $4 million network of mountain bike trails at Hollybank/Mount Arthur and Derby-Cascade Forest/Weldborough-Blue Tier making the region a truly competitive tourism and cycling destination. NORTH EAST RAIL TRAIL Preliminary demand and economic benefit assessment i
4 The benefits of the North East Rail Trail can be summarised as follows: North East Rail Trail Benefits Short-Term Medium-Term Long-Term Creation of short term jobs through trail design and construction Creation of demand for secondary services throughout region as construction progresses Creation of community, government, and business engagement Employment growth directly related to rail trail operations Employment growth indirectly related to the mountain bike trails, North East Rail Trail and cycle way development, in the tourism, accommodation and services sectors Regional investment in the cycle trails and related businesses Increased employment and economic development opportunities for regional economies Increased employment and economic development opportunities for the state economy Enhanced Tasmania s reputation as a national and international cycle tourism destination Increased complementary benefits for Tasmanians such as active transport, recreation, health, social and cultural experiences Diversification of the state and region s tourism product mix Increased international awareness of the Tasmania through branding and marketing Greater attraction of a high value and fast growing segment of Tasmania s visitor market (increase in cycle tourists) NORTH EAST RAIL TRAIL Preliminary demand and economic benefit assessment ii
5 Table of Contents EXECUTIVE SUMMARY... i 1 INTRODUCTION Purpose of this report MARKET ANALYSIS Trends in Cycling and Walking Cycle Tourism Cycle tourism is a growth market in Australia Tasmania s interstate cycling market also showing strong growth Tasmanians are taking more overnight cycling trips than ever before Cycling by international visitors is also showing strong growth Domestic interstate and international cycling visitors spend more Recreational Cycling and Walking Recreational cyclists are a large market across Australia and Tasmania 5 3 OVERVIEW OF CYCLING TOURISM AND RAIL TRAILS Cycling is becoming a tourism product and key travel motivator Strong growth in rail trails and other multi use trails Rail trails bring visitors to the region Rail trails appeal to a broad range of markets including families with children The economic impact of rail trail tourism is strong Rail trails provide opportunities for business diversification The mountain bike success story Regional revitalisation is also part of the benefit of a rail trail Cycling events are a key economic driver Social and health benefits of cycling are increasingly important The industry is strong, stable and innovative Characteristics of other rail trails THE NORTH EAST RAIL TRAIL EXPERIENCE FORECAST DEMAND FOR THE NORTH EAST RAIL TRAIL Local participation on the rail trail: Intrastate participation on the rail trail: SOCIO ECONOMIC IMPACT Economic Impact: Construction period Post-construction period Scenarios Other impacts Employment Health and lifestyle benefits for the community Investment attraction and regional stimulus Enhanced profile of North East Tasmania as a cycling tourism destination Conclusion Attachment 1. Case study Attachment 2. Case study Attachment 3. North East Rail Trail Budget NORTH EAST RAIL TRAIL Preliminary demand and economic benefit assessment i
6 1 INTRODUCTION The North East Rail Trail involves the re-development of 89.6km of disused rail corridor from Launceston to Billycock Hill in the North East of Tasmania. This will create a shared use rail trail spanning a total length of 98.2km for nonmotorised recreational users, which may include walkers and mountain bikers. The North East Rail Trail will travel through Dorset and Launceston City Municipalities linking towns and communities and potentially benefitting associated businesses in Dorset, Launceston, Scottsdale, Lilydale, Karoola, Lalla, Tunnel, Lebrina, Nabowla and Billycock Hill (refer Figure 1 and 2). An investment of $3.89 million is required for the development of the 68.9km section between Launceston and Scottsdale to join up with the existing 31.3km section between Scottsdale and Billycock Hill. The rail trail development opportunity has been identified as having the potential to deliver benefits to the communities and wider region in a number of State and regional plans including the Trails Tasmania Strategy , the Northern Tasmania Regional Recreation Trails Strategy (2004) 2, Tasmanian Mountain Bike Plan and the Northern Tasmania Destination Management Plan Framework Investment of $3.89 million will provide a significant enhancement to the already funded $4 million dollar network of mountain bike trails at Hollybank/Mount Arthur and Derby-Cascade Forest/Weldborough-Blue Tier making the region a truly competitive tourism and cycling destination. 1.1 Purpose of this report This report provides an assessment of the estimated market demand and socio-economic impact of establishing the North East Rail Trail in Tasmania. It considers the type and extent of the existing visitor markets and makes a preliminary assessment of the markets offering the most potential for the North East Rail Trail. The report considers the potential economic benefit of rail trail tourism and draws on research and anecdotal evidence from established rail trails in Australia and around the world. The analysis has been completed using best available data as well as case studies from the development of similar trail networks in comparable destinations in Australia and New Zealand. Professional judgement has been used where data is not readily available. Relevant data, reports and strategies include: Trails Tasmania Strategy Northern Tasmania Regional Recreation Trails Strategy (2004) 6 Tasmanian Mountain Bike Plan Australian Bureau of Statistics Australian Sports Commission. Exercise, Recreation and Sport Survey (ERASS) Latest research from Tourism Research Australia and Tourism Tasmania. 1 Trails Tasmania Strategy (2007), Inspiring Places Pty Ltd. 2 Northern Tasmania Regional Recreation Trails Strategy (2004). Inspiring Place Pty. Ltd. 3 Sport and Recreation Tasmania (2009), Tasmanian Mountain Bike Plan, Department of Economic Development, Tourism and the Arts, Hobart, by Inspiring Place Pty. Ltd. 4 Tourism Northern Tasmania Destination Management Plan Framework Urban Enterprise Trails Tasmania Strategy (2007 Inspiring Places Pty.Ltd. 6 Northern Tasmania Regional Recreation Trails Strategy (2004). Inspiring Places Pty. Ltd. 7 Sport and Recreation Tasmania (2009), Tasmanian Mountain Bike Plan, Department of Economic Development, Tourism and the Arts, Hobart, by Inspiring Place Pty. Ltd. NORTH EAST RAIL TRAIL Preliminary demand and economic benefit assessment 1

7 Map 1. North East Tasmania proposed Rail Trail development route and profile NORTH EAST RAIL TRAIL Preliminary demand and economic benefit assessment 2

8 Map 2. North East Tasmania proposed rail trail development - region overview NORTH EAST RAIL TRAIL Preliminary demand and economic benefit assessment 3
9 2 MARKET ANALYSIS An assessment of the potential market for the North East Rail Trail has been undertaken to provide a basis for forecasting demand (refer Section 3). The assessment has considered participation in recreation, usage of trail networks, recent trail developments and visitor preferences as well as general trends in cycling tourism. 2.1 Trends in Cycling and Walking The market for the North East Rail Trail experience will be a combination of those who already walk or cycle while away from home (e.g. tourists), recreational cyclists and walkers (e.g. those who cycle and walk at home) and a broader potential market that does not cycle currently. 2.2 Cycle Tourism Cycle tourism includes visits to places outside the home region for the purpose of holiday, pleasure or sport, where participation in cycling is either a primary or secondary activity. Cycle tourism is a growing market within the Australian tourism sector, particularly within the nature based tourism segment. It includes both domestic and international visitors, mostly staying overnight but can include day trippers. It includes cycle tourers, mountain bikers and road cyclists. Data sourced from the Tourism Research Australia 8 and Tourism Tasmania 9 provides useful information on cycle tourism in Australia and Tasmania which is summarized below Cycle tourism is a growth market in Australia In 2012/13, approximately 1.3 million domestic overnight visitors in Australia participated in cycling during their trip representing 21% growth in this market since 2005/06. In 2012/13 over 1 million visitors went cycling on a day trip representing an increase of 33% over the period from 2005/ This growth far outweighs growth in other soft adventure markets such as bushwalking over the same period. Victoria, New South Wales and followed by Queensland continue to win the lion s share of cycling tourism Tasmania s interstate cycling market also showing strong growth In 2012/13 Tasmania received 31,800 visitors who cycled while in Tasmania representing a growth of 35.5% from the previous year. Growth in the market has been strong since 2009/10. The average length of stay was 17 nights which is well above the average length of stay for other visitors including bushwalkers. Australian residents that generate the majority overnight cycling trips across are from NSW (Sydney) and Victoria (Melbourne) Tasmanians are taking more overnight cycling trips than ever before 45,000 Tasmania residents took and overnight cycling trip in 2012/13 which increased by 28.6% from the previous year. 173,000 nights were spent by Tasmanian residents on a cycling holiday in Tasmania in 2012/13, representing a significant increase on the previous year NVS trend data , IVS trend data TVS 2012/13 10 TVS NVS 2013 September Quarter 2012 NORTH EAST RAIL TRAIL Preliminary demand and economic benefit assessment 4
10 The average length of stay for Tasmanian residents on a cycling trip was 3.8 nights which is considerably higher when compared to the average length of stay for Tasmanian residents which is 2.5 nights Cycling by international visitors is also showing strong growth In 2012/13 Australia recorded approximately 316,000 international overnight visitors who participated in cycling. Growth in this market has been exceptionally strong with 25% growth in total number of international visitors who cycle and 32% growth in international visitor nights since 2005/06. It is estimated that around 14,000 international visitors participate in cycling as an activity when visiting Tasmania. The average expenditure is $2072 per trip and their length of stay is 17 nights Domestic interstate and international cycling visitors spend more There is strong evidence that recreational cyclists are a high yield, high spending market and provide numerous economic and social opportunities for regions. Cycling tourists spend average of $2072 per trip while in Tasmania Recreational Cycling and Walking Recreational cyclists are a large market across Australia and Tasmania General cycling was rated as the fourth most popular activity in Australia in 2010, with an estimated 2.1 million participants. A similar trend has been experienced in Tasmania where cycling participation is at 11.1% or 44,564 residents. Cycling participation has increased 45 per cent over the period Walking is also a popular activity amongst Tasmanians Around 38.4 % of Tasmanians participate in walking (excludes bushwalking) and around 8% participate in running. Table 1. Recreation Participation Rates for Tasmanian Residents Activity Participation Rate Total Tasmanians (Over 15 years) Cycling 11.1% 44,600 Walking 38.4% 154,700 Running 8% 32,100 Total 231,400 Recreational cycling and walking are activities that takes place from home and do not involve an overnight stay. Participation in recreational activities by Australian and Tasmanian residents aged 15 or more years has been measured annually by the Australian Sports Commission (ASC) over the period from 2001 to A summary of the participation rates are presented in Table 1 below. 12 Australian Sports Commission. Exercise, Recreation and Sport Survey (ERASS) Australian Sports Commission. Exercise, Recreation and Sport Survey (ERASS). on ABS population of 15 years and over ) NORTH EAST RAIL TRAIL Preliminary demand and economic benefit assessment 5
11 3 O V E R V I E W O F C Y C L I N G T O U R I S M A N D RAIL TRAILS 3.1 Cycling is becoming a tourism product and key travel motivator Following on from increasing participation in outdoor recreation is an increase in travel with an adventure or outdoor recreation component. Walking and cycling holidays and related services have become familiar products in the tourism industry. This is evidenced by the development of trails and associated products, notably in Victoria and New Zealand where Government investment has assisted in the development of a range of trails. 3.2 Strong growth in rail trails and other multi use trails Rail trails have been successfully developed in all other states of Australia. They are also well established in New Zealand, Europe and North America. Victoria and South Australia have led the way with the development of a range of high standard cycling trails. Victoria s Cycle Tourism Action Plan establishes the priority trails selected on the basis of their potential to attract interstate and intrastate visitation and increase length of stay. Victoria now has over 850km of high standard rail trails, the most economically successful being the 100km+ Murray to the Mountains Rail Trail (refer Attachment 1). South Australia possesses a highly developed product offering, including rail trails and a number of cycle friendly businesses. Cycle friendly businesses are typically businesses that encourage cycle tourists by offering safe bicycle storage, providing water and are able to inform the cyclist on tracks and trails as well as maintenance and support services. The Riesling Trail is a highly successful rail trail through the Claire Valley (refer Attachment 2). New Zealand is a strong competitor in rail trails and cycling trails generally. Renowned cycling products in New Zealand include the Otago Rail Trail (refer Attachment 3) and the newly established Hauraki Rail Trail. An assessment of how the North East Rail Trail is likely to compare to these trails is presented in Section Tourism Victoria Rail trails bring visitors to the region Tourism to some of the country s key cycling areas demonstrates the growth and importance of cycling. A summary of visitor numbers using the popular rail trails in NZ and Australia is presented below: NORTH EAST RAIL TRAIL Preliminary demand and economic benefit assessment 6 Hauraki Rail Trail - 21,000 visitors per annum including walkers The Otago Central Rail Trail, NZ - 10,000 and 12,000 visitors per annum and a further 20-30,000 walk or cycle sections of it 15 Murray to the Mountains, VIC - 45,000 visitors per annum including walkers From January 2013 to April 2013 the Hauraki Rail Trail averaged over 7,000 cyclists a month 16. The trail is particularly popular with the "baby boomer" and family clientele from Auckland and the wider Waikato, with 24% of users coming from Auckland, 15% from Hamilton, and a large proportion of users being older riders 17.. Both local businesses and the local Council agree that the trail had a significant economic benefit for the region, and had already become a major promotional asset for tourism. 3.4 Rail trails appeal to a broad range of markets including families with children A key advantage of rail trail construction is the gradient given most rail lines have a gradient of less than three degrees, this allows and encourages use by almost all population groups, regardless of age. They also provide excellent opportunities for people with mobility disabilities, e.g. wheelchair users, special cycles, walking with support, or sight/ hearing impediments. 15 "Pioneering Otago rail trail joins national cycleway". 2 January Retrieved 7 February Nga Haerenga - The New Zealand Cycle Trail Evaluation Report, Ministry of Business Innovation and and Employment, New Zealand Government Bike trail economy booster" Hauraki Herald. 10 May 2010.
12 Research indicates that rail trail infrastructure appeals predominantly to couples aged fifty plus and families with children, who seek an experience that allows them to spend quality time with friends and family 18.. These markets align with Tourism Tasmania s most profitable prospects in the domestic market known as life-long learners 19. This market can be divided into two age brackets - aged 40+ couples seeking a touring experience and aged couples wanting a short break 20. They primarily live on the Eastern Seaboard of Australia and when they go on holidays they prefer less crowded, more interesting places. Their reasons for taking a holiday were either to discover and understand new people and places - go exploring - or to escape and spend time together and create new memories. 3.5 The economic impact of rail trail tourism is strong There is strong evidence that rail trails provide numerous economic and social opportunities for regional Australia. The following examples provide an indication of the types of economic impacts of rail trail tourism: La Trobe University undertook an economic study of three Victorian rail trails in 2009 in order to ascertain the economic inputs into the communities the trails pass through. The report concluded that the average spend per visitor is $244 per day 21. This compared favourably with TRA data from 2007, which found that average nightly expenditure in the region at that time was $ (TRA, 2008; Tourism Australia, 2008). Based on the Australian Tourism Satellite Accounts, indirect expenditure is also significant, bringing the overall value of the economic contribution of visitors to the trail to $ per person, per day 22. In a study for SA s Office for Recreation and Sport (ORS), the Riesling Trail in SA s Clare Valley (a 25 km walking and cycling trail linking wineries and heritage attractions, and well serviced by accommodation) was estimated to contribute slightly over $1 million a year to the Clare Valley economy (on the basis of an average expenditure of $216 per visitor) 23. Research shows that trail tourism on the 150 km cycling and walking Central Otago Rail Trail in New Zealand had positive impacts on many local businesses 24. The trail was estimated to generate greater than $6.2 million and employing 121 EFT for the NZ economy in 2010/2011. The largest impacts are in the areas of accommodation, package operators as well as food and consumables 25. The impact of the rail trail on the Central Otago economy has continued to grow. In 2008 it was previously estimated to contribute between 0.5% - 1% towards the local economy. This is now between 1% and 2% The Hauraki Rail Trail is one of the most popular cycle trails in New Zealand, despite only having been open for less than a year. Visitor expenditure to the Hauraki Rail Trail in NZ was predominantly on accommodation, café s/restaurants, cycle trail transport, snacks and groceries and petrol/fuel. Both local businesses and Council agree that the trail had a significant economic benefit for the region, and had already become a major promotional asset for tourism. 3.6 Rail trails provide opportunities for business diversification Rail trails present opportunities for businesses to develop products and services to meet the needs of visiting cyclists and walkers. This includes transport, merchandise, accommodation or provisioning and guiding services. Cyclists do more while on holiday when compared with other tourists, making them a stronger source of income for regional economies. This pattern of use has resulted in the diversification of the tourism product mix in some regional areas 26. Research undertaken in New Zealand suggests that a modest number of businesses have been started as a result of the trails as follows: 18 Victorian Government, Victorian Cycling Strategy Tourism Tasmania 20 Tourism Tasmania 22 & 22 Beeton, S. Cycling in Regional Communities: A Longitudinal Study of the Murray to Mountains Rail Trail, Victoria, Australia, Research Report, La Trobe University, Bundoora) (2009) 23 ORS, Recreational Research Trail Project Jellum C & Reis A, Otago Central Rail Trail Economic Impact and Trends Survey User Survey, 2010/11, Central Otago District Council, June New Zealand Cycleway Market Research TRC Tourism 2008 NORTH EAST RAIL TRAIL Preliminary demand and economic benefit assessment 7
13 One in seven local businesses surveyed in rail trail regions in NZ 27 said that they had expanded their business (added capacity or added new service) as a result of the trail opening in their region. In some cases these expansions were significant in terms of either capacity or services, but the majority were smaller, such as accommodation providers purchasing several bicycles for hire. Overall about one quarter of business surveyed believed that the trail had been good for their business, about half believed it would be good for their business in the future. While some of the trails were built as a result of local initiatives, it is clear that without the NZ Government s funding many of the trails would not have been built. 3.7 The mountain bike success story Numerous towns, regions and countries around the world have tapped into the lucrative mountain bike (MTB) visitor market, and the success of these initiatives, many times in regional or remote locations previously unknown to tourists, has sparked interest around the world 28. Northern Tasmania is developing its potential as a national mountain bike destination. In recent years the region has seen the number of trails and riding areas increase dramatically 29 and $4 million dollar network of mountain bike trails at Hollybank/Mount Arthur and Derby-Cascade Forest/Weldborough-Blue Tier is under construction making the region a truly competitive mountain bike destination. The region has obvious natural advantages with wild, iconic natural and cultural landscapes that are already a major attraction for visitors to the area. Development of the North East Rail Trail is likely to strengthen the region s positioning as a cycling destination for a range of markets that extends beyond mountain bikers and attract visitors and recreational cyclists across a broad range of ages. 3.8 Regional revitalisation is also part of the benefit of a rail trail Available research demonstrates rail trails have been highly successful in developing cycle tourism product and delivering significant economic, social, environmental and cultural benefits to regional Australia. Quality rail trails and riding experiences bring cyclists and walkers to regions and small communities. We have seen from other destinations that riders will travel, sometimes to previously unknown destinations if the rail trail is appealing. Visitors using the rail trail bring money to a region and drive local economic activity. In other destinations cyclists on rail trails often stay longer and spend on average more than other visitors over the length of their stay. The development of rail trails has resulted in revitalization of villages and businesses, the creation of new businesses and adaptation of farms and other buildings as character accommodation. Small communities such as those between Launceston and Scottsdale have the potential to offer these services and become vibrant centers along the trail. 3.9 Cycling events are a key economic driver Events and festivals that center on cycling can build awareness and generate economic development opportunities. For example the Blue Dragon Challenge, a two day endurance race around the Blue Tier and Derby, has established itself on the national event calendar and raised the profile of the region significantly. Other events include Wildside MTB Race Tasmania, Tour of Tasmania, and Great Tasmanian Bike Ride. Cycle Salute is a celebration of cycling in Victoria s North East that stages 50 cycle-centric events to cater for all ride styles, abilities over three weeks. Many of the events are developed around the rail trail, existing mountain bike trails and popular road riding routes. 27 New Zealand Cycle Trail Evaluation Four Cycle Trail Case Studies Angus and Associates in association with TRC Tourism 28 Mountain Bike Tourism Potential in Northern Tasmania, Six Dot Consulting, Mountain Bike Tourism Potential in Northern Tasmania, Six Dot Consulting, 2011 NORTH EAST RAIL TRAIL Preliminary demand and economic benefit assessment 8
14 The Great Victorian Bike Ride is an annual participatory touring event run over 9 days by Bicycle Victoria. This event has been running since 1984 and regularly attracts between 3,500 to 8,100 riders. Total expenditure estimates for the 2005 ride (about 4,000 riders and over 400 volunteers) were around A$4 million 30. The North East Rail Trail offers significant potential to stage numerous events in conjunction with other festivals and events in the local region Social and health benefits of cycling are increasingly important. A well-built, well-planned rail trail that is set in an attractive environment will actively encourage people to exercise more to maintain their health. This will contribute to physical and mental health improvements, assisting with disease prevention particularly cardiovascular, musculoskeletal, respiratory, nervous and endocrine systems as well as reducing obesity, hypertension, depression and anxiety. The economic impact of premature morbidity and mortality on Tasmania that can be attributed to physical inactivity is estimated to be $823.2 million. People who are sufficiently active as a result of regular sport and recreation participation therefore avoid an additional cost to society of $718.4 million. 31 The economic benefit to society of getting an inactive person to walk or cycle is calculated between $5,000 and $7,000/year. The economic benefit to society of getting an active person to walk or cycle is between $850 and $2,550/year. 32 The obesity epidemic alone is now estimated to cost Australia $1.3 billion/year (Australian Bicycle Council). One heart attack is estimated to cost in the vicinity of $400,000 in direct and indirect costs. A cost-benefit analysis in Norway (Institute of Transport Economics, 2002) assessed cycle network improvements that encouraged commuting and local exercise and costed their economic value to society. The study found that there was a significant reduction in severe diseases stemming from increased exercise activity on cycle networks. The costs savings to society from this reduction made up 50-66% of the total benefit of investment in cycle networks. 33 There is a significant communal benefit to rail trails in regional and remote areas. Importantly, they assist in connecting people to places, and people to people, bringing new faces into small rural communities and enhancing social interaction. Opportunities can be created for community participation in conservation and revegetation work, fostering a sense of pride and community identity. Rail trails also often provide unprecedented access to and through some spectacular scenery and bushland. There exists opportunities for the community to experience natural and cultural environments previously unseen in their own area The industry is strong, stable and innovative Bicycle sales can also be seen as a reflection of Australians interest in cycling. Annual bikes sales in Australia have increased from $131 million in to $240 million in , outselling motor vehicles for the ninth consecutive year in numbers.. The industry today has a wider variety of products being sold to a greater range of consumers. Bicycles are now more comfortable, reliable and function specific and cater to the needs of a broader market from beginners to novices Characteristics of other rail trails. The following table presents rail trail usage and regional visitation with characteristics and tourism profiles similar to North East region. ** Some analyses have differentiated between users who undertake the entire length of the trail and users who only undertake a section. This differentiation has been shown where it exists. 30 New Zealand Cycleway Market Research TRC Tourism data/assets/pdf_file/0016/47122/summary_-_12_july.pdf NORTH EAST RAIL TRAIL Preliminary demand and economic benefit assessment 9


15 Table 2. Comparison of demand characteristics for other rail trails in Australia and New Zealand Trail Annual usage Total regional visitation 2012/13 Hauraki Rail Trail NZ Established in ,000 visitors per annum One third day visitors Domestic visitors (local within 2 hours) prominent market Families and younger people are main users 67% indicated that the rail trail was their main purpose of visit Average length of stay 1 night 3 million visitors to Corramandel Peninsula The Otago Central Rail Trail, NZ Established in 2011 Murray to the Mountains, VIC Established in ,000 and 12,000 visitors per annum (conservative estimate) and a further 20-30,000 visitors walk or cycle sections of it34 The majority of Rail Trail users are over 50 years old, are an average age of 44 years, slightly more likely to be female Majority of visitors from Auckland, Canterbury or somewhere else in the North Island; and a first time visitor to the rail trail travel The largest international visitor market is Australia 9% guided tour customers, 50% independent travellers (renting a bicycle) and 41% New Zealanders bringing their own bicycles 1,000 full and part-time jobs and having created 200 additional or part-time jobs35 The market is a good example of dual use with 45,000 users per annum including walkers For the majority (59%, 26,550) cycling is the main reason for undertaking the trip 85% come from within the State of Victoria 63% are male and travel with partner or family groups Most are aged between 31 and 60 and Most cyclists spend 2 or 3 days on the trail 932,000 visitors to Otago (2009) 2.5 million visitors to High Country Region 34 "Pioneering Otago rail trail joins national cycleway". 2 January Retrieved 7 February "Cycleway the only way"hueber, Andre (19 June The New Zealand Herald NORTH EAST RAIL TRAIL Preliminary demand and economic benefit assessment 10
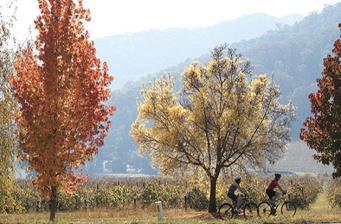
16 4 THE NORTH EAST RAIL TRAIL EXPERIENCE In general, cycle tourists want easy multi-day trips with good supporting services or events. The holidays can also be location-based and utilise nearby trail networks. They require trips that take in the region s landscape, natural environment and culture. Cycle tourists and recreational riders are not primarily focused on cycling but on the broader experience. This group is likely to be older or consist of families rather than single visitors or couples. Both markets are looking for easy access to safe and traffic-free trails. The case studies in Attachments 1 3 show that the entire visitor experience is important, not just the cycling aspect. This is particularly true for those markets whose primary motivation is not cycling. Accommodation, services, information, scenic values and other activities combine to make the experience more appealing to a broader range of visitors. The success of off-road trails depends on their ability to offer cyclists a safe, traffic-free environment. Easier trails will have a broader user appeal and the North East Rail Trail is well placed to offer that experience. The North East Rail Trail provides multiple access points and a safe, easy trail for beginners and families and will be wide enough for cyclists to ride two or three abreast enhance the social aspect of the cycle experience. Trail gradient is a critical factor in successfully designing a trail for a specific market or type of rider. For a large portion of the location-based cycling and cycling holiday market average trail gradients of 2-3 are required. The strength of the North East Rail Trail is the gentle gradient that will appeal to a broad market. The other strengths for the North East Rail Trail when compared to other rail trails around Australia can be summarized as follows: It can leverage off Tasmania s established, high profile reputation as a nature-based and soft adventure tourism destination, with the potential to bundle rail trail activities with other tourism products, including food, wine and historic heritage in the region. It offers outstanding natural scenery and opportunities for cyclists and walkers to experience a range of typical Tasmanian landscapes and terrains within a short period of time and explore the villages and communities along the way. The area is already popular with road touring riders who are likely to have a high propensity to convert to rail trail tourism with family and friends. It is in close proximity to Melbourne, a main source market for cycle tourism and opportunities for the short break market. Cool climate riding and stable weather (relative to the mainland) makes Tasmania and the North East Rail Trail an attractive destination in summer when riding in many mainland areas becomes difficult because of the heat and bushfires. MTB product currently being established in the region will raise the profile of the region as a cycling destination generally. It has the potential to leverage off the profile of events such as the Blue Dragon Challenge and other events statewide that have put Tasmania on the cycling map. Launceston provides a central base a whole variety of riding exists within close range and has a strong cycling network in the community. Links with other high profile cycling products such as the Blue Tier an iconic location with potential to develop quality rides based on scenery, history and location. Land managers, tourism industry, both local governments and the community are supportive of the concept. Attractiveness of small communities places like Lillydale and Ringarooma are experiences in themselves. There is a dedicated and enthusiastic local trail builders and volunteers willing to support development. NORTH EAST RAIL TRAIL Preliminary demand and economic benefit assessment 11

17 NORTH EAST RAIL TRAIL Preliminary demand and economic benefit assessment 12

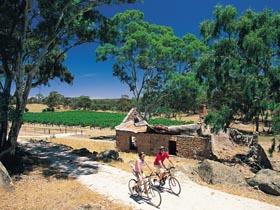
18 Photo. Businesses in small regional town on the Murray to Mountains Rail Trail in Victoria (Greg Hutchison) NORTH EAST RAIL TRAIL Preliminary demand and economic benefit assessment 13
19 5 F O R E C A S T D E M A N D F O R T H E N O R T H E A S T R A I L T R A I L There is no survey data to specifically quantify the market demand of a rail trail in North East Tasmania. Instead the market demand has been estimated through analysis of other data sources. These included: Competitor data e.g. usage of other Rails Trails in Australia and NZ Trail usage in Tasmania both walking and cycling trails Recreational activities undertaken by visitors in Tasmania (via IVS data) Market trends in cycling participation Market trends in visitor behaviour. These data sources were used to estimate of the usage of the trail, five, ten and fifteen years post-construction. Assumptions made in the calculations have been documented. It is estimated that five years post-construction there would be close to 23,000 trips made on the North East Rail Trail during the year. This includes people undertaking both a short day trip or completing the full length of the trail. After ten years it is estimated the number of trips made on the rail trail will increase to just under 30,000 and after fifteen years this will grow to 35,000. A breakdown of the usage of the Trail by visitor type is provided in Table 3. Table 3. Estimated usage of the Rail Trail five and ten years post-construction TRIPS MADE ON THE RAIL TRAIL PER ANNUM User type 5 years post construction 10 years post construction 15 years post construction Locals * 13,300 17,000 1,9700 Visitors intrastate 5,400 6,900 8,000 Visitors interstate / 7,600 international 4,100 6,000 TOTAL 22,800 29,900 35,300 * Locals refers to the population of North East Tasmania Key assumptions: Rail trail will be constructed as planned with a quality visitor experience that is comparable to other rail trails around the world. Rail trail will receive considerable promotional support from local, regional and state tourism promotional authorities. Tasmania will continue to grow as a tourist destination and visitor arrivals will continue to grow at current rates. Tasmania will enhance its profile as a cycling and adventure tourism destination through marketing and promotional activities at a national and international level. Participation in cycling will continue to grow at its current rate Notes on calculations: Local participation on the rail trail: Population of North East Tasmania estimated to be 143,000 (ABS Population Data). Assumed that the recreational behaviour of this population is relative to that of total Tasmania. NORTH EAST RAIL TRAIL Preliminary demand and economic benefit assessment 14
20 Participation rate of locals in cycling and bushwalking is reflective to that of total Tasmania as outlined in the ERASS 2010 survey on recreational participation. Estimated that one-in-four locals who participate in cycling or bushwalking would undertake on average 2.5 trips on the rail trail p.a. (after five years). Estimated that one-in-thirty other locals who participate in some other form of recreation would make on average one trip on the rail trail p.a. (after five years). The number of locals to use the rail trail will grow at 5% p.a. during year 5-10 of the trail and at a slower growth rate of 3% p.a. for the years post-construction. This is a balanced figure that is consistent with broader participation trends in cycling across Australia as well as growth rates experienced on comparable rail trails. Local participation on the rail trail is comparable to local participation experienced on the Hauraki Rail Trail in NZ. Intrastate participation on the rail trail: The population of Tasmania, excluding the North East, is estimated to be 363,000. Assuming that 62,000 of this population participate in cycling or bushwalking activities each year (ERASS, 2010). Estimated that one-in-thirteen of this group will undertake on average 1.1 trips on the rail trail p.a. (at five years post construction). Estimated that one-in-four hundred other Tasmania s who participate in some other type of recreational activity would make on average one trip on the rail trail p.a. (after five years). The number of Tasmanians to use the rail trail will grow at the same rate as the local users. Interstate / international participation on the rail trail: Annual visitor arrivals to Tasmania is 1 million (IVS, 2013) 370,000 of visitors participate in cycling or bushwalking during their visit (IVS, 2013) Estimated that one-in-a hundred of these visitors who participate in cycling or bushwalking will undertake on average 1 trip on the Rail Trail p.a. (after five years). This is based on an assessment of competition for trails in Tasmania, the market appeal of the rail trail and visitation statistics of international rail trails Estimated that one-in-four hundred other visitors who participated in some other form of recreation (132,000 visitors IVS, 2013) would make on average one trip on the rail trail p.a. (after five years) The number of visitors to use the rail trail will grow at 8% p.a. during year 5-10 of the trail and at a slower growth rate of 5% p.a. for the years post-construction. It is assumed that Tasmania will continue to promote its trails and activities at a national and international level and Tasmania s profile as an adventure destination will steadily grow along with visitor arrivals. NORTH EAST RAIL TRAIL Preliminary demand and economic benefit assessment 15
21 6 SOCIO ECONOMIC IMPACT The socio-economic impact of the proposed North East Rail Trail to Tasmania has been estimated based on an assessment of the economic, social and environment impacts from developing the rail trail. It is an assessment of the length of the rail trail from Launceston to Billycock Hill of which the total construction cost is $3.89m. It is important to note that the impact of the trail cannot be calculated from simply the number of visitors who use the rail trail multiplied by their total expenditure in Tasmania. Whilst this is often used as a simplistic measure for determining economic impacts the approach is incorrect as it: Assumes that the rail trail is the sole purpose of visitation by all users of the trail regardless to whether it is or not, Ignores the broader impact that the rail trail such as its impact on increasing Tasmania s profile as a cycling or adventure destination as a whole. Instead the impact of the rail trail has been calculated as the additional expenditure undertaken as a consequence of the rail trail. Many other factors other than market demand and average expenditure are considered within this assessment. All assumptions accompany the assessment results. 6.1 Economic Impact: The economic impact has been determined at two different stages: 1) During construction of the rail trail 2) At fifteen years post-construction of the rail trail Construction period It is estimated that the construction of the trail will support employment of 7.8 full-time equivalents (FTEs) across Tasmania during the two year period of trail construction. It is believed the majority of this employment would be local to the Northern Tasmania region given the nature of the construction activities. Notes on the calculations: 1 FTE is supported per annum for every $250,000 in construction expenditure in the region 85% of employment is generated is local to the region (i.e. within Northern Tasmania ), with the remaining 15% from other areas of Tasmania Construction is completed over a two year period Total construction cost is $3.89 million as per the breakdown in the Appendix Post-construction period The annual economic impact of the rail trail has been estimated at a period of five, ten and fifteen years post construction. This is shown in Table 4. At five years post construction it is estimated the rail trail would increase direct tourism expenditure in the region by $3.5 million per annum. The flowon impacts of this expenditure are significant and total output is expected to increase across Tasmania by $6.8million per annum and will also increase and gross state product (GSP) by $3.3 million per annum. This increase in economic activity is estimated to support 40 jobs (measured as full-timeequivalents, FTEs). The impact of the rail trail is expected to become progressively greater at ten and fifteen years post construction due to greater participation on the Trail. At fifteen years post construction the Rail trail is estimated to increase output in Tasmania by $11.2 million per annum, increase GSP by $5.4million per annum and support 67 jobs (FTEs). 36 Constructions costs provided by Northern Tasmanian Development 2014 NORTH EAST RAIL TRAIL Preliminary demand and economic benefit assessment 16
22 Table 4. Estimated economic impact of the Rail Trail Time period (years post construction) Direct expenditure* Indirect expenditure* Total output GSP Jobs (FTE) 5 years $3,549,604 $3,230,140 $6,779,744 $3,257, years $4,768,709 $4,339,525 $9,108,234 $4,376, years $5,847,719 $5,321,424 $11,169,143 $5,366, *Direct expenditure refers to the immediate effect of expenditure made by tourists or the amount visitors spent in the region. **Indirect expenditure refers to expenditure that occurs from other industries not in direct contact with tourists (TRA, 2010). This activity represents a significant economic impact, especially considering much of this activity is likely to occur in regional areas where the Trail is located. Notes on the calculations: The same proportion of direct spend : GVA for Australia is applicable in Tasmania 37. The GVA multiplier for Tasmania is not known. The multiple applied by Tourism Research Australia throughout Australia to determine indirect GVA at a national level (TRA, 2010) has been applied. The tourism expenditure multiplier for Tasmania is not known. A multiplier of 0.91 has been used to calculate indirect tourism expenditure. This multiplier is used by Tourism Research Australia 38 to calculate indirect expenditure at a national level. Expenditure is provided in real terms. The expenditure behaviour of rail trail users is representative of average expenditure behavior of total visitors to Tasmania % of Interstate / International users of the rail Trail extend their stay by 2.4 nights due to the rail trail. This is comparable to the purpose of visitation to competitor rail trails in Otago and Hauraki NZ. It is also assumed that the rail trail influenced this market segment s decision to travel to Tasmania by 20%. Assumed that 50% of intrastate users visited the region due to the rail trail. Also assumed that only 24% of this market stayed overnight (for an average of 1.4 nights) this is reflective of total travel behavior for the intrastate market in Tasmania 40. Locals use the rail trail as a day visit only. Their expenditure per visit as a result of the rail trail is $17 this is comparable to the local markets expenditure on the Hauraki Rail Trail NZ. In general the impact of the rail trail on Tasmania s profile influences on average 0.02% of tourism expenditure in the region by visitors who undertake a cycling or bushwalking activity during their stay. Every $1 million of direct tourism expenditure supports 11.4 FTE jobs Scenarios Due to the limited data available to support market demand estimates and expenditure behaviour two alternate scenarios are presented to show the potential range of economic impacts of the rail trail. The conservative scenario assumes that visitation by locals is 10% less and visitation by all other markets is 20% less than expected. Table 5. The optimistic scenario assumes that visitation by locals is 10% greater and visitation by all other markets is 20% greater than expected. Table 6. The optimistic scenario shows that the Rail Trail could contribute $6.7 million p.a. to GSP in Tasmania after fifteen years. 37 Tourism Satellite Accounts, 2013 Note: this is also reflective of the ratio of Real GSP: Expenditure applied by Deloitte Access Economics in Economic Impact of Tourism Marketing In Tasmania, Tourism Contribution to the Australian Economy, Tourism Research Australia IVS 2013, NVS NVS, Tourism Research Australia, 2010 NORTH EAST RAIL TRAIL Preliminary demand and economic benefit assessment 17
23 Table 5. Optimistic scenario OPTIMISTIC SCENARIO Direct expenditure Indirect expenditure Total output GSP Jobs (FTE) 5 years $ 4,426,403 $4,028,027 $ 8,454,430 $4,062, years $ 5,947,355 $5,412,093 $11,359,448 $5,457, yeas $7,293,962 $6,637,505 $13,931,467 $ 6,693, Table 6. Conservative scenario CONSERVATIVE SCENARIO Direct expenditure Indirect expenditure Total output GSP Jobs (FTE) 5 years $ 3,099,604 $ 2,820,640 $ 5,920,244 $ 2,844, years $ 4,184,932 $ 3,808,288 $ 7,993,219 $ 3,840, years $ 5,262,947 $ 4,789,282 $ 10,052,229 $ 4,829, Table 7. provides a comparison of estimated expenditure on the North East rail trail after five years with estimated contribution from other rail trails in NZ and Victoria. Table 7. Comparison of Expenditure North East Rail Trail and other trails in Victoria and NZ Trail Date of assessment Direct Expenditure $M Indirect Expenditure $M Total $M North East Rail 2012 (forward m Trail, TAS est.) Otago Central, NZ m 4.16m 12.28m Murray to the Mountains, VIC m 0.306m 0.473m 6.2 Other impacts Employment In particular the employment impact of the rail trail will be significant for the communities of North East Tasmania given that a large proportion of the jobs created would be within the local region. Employment opportunities in remote or regional areas can be limited and the rail trail may provide a well needed boost to these communities. There are significant social benefits from employment opportunities for local workers. This includes reducing the commuting time for workers who previously may have been required to travel to larger centres such as Launceston. Following construction the jobs created from the rail trail will be primarily in the hospitality, accommodation and food and services industries. However, the employment benefits can be far reaching and impact other trades and services. This is illustrated in in the figure below. NORTH EAST RAIL TRAIL Preliminary demand and economic benefit assessment 18

24 NORTH EAST RAIL TRAIL Preliminary demand and economic benefit assessment 19
25 6.2.2 Health and lifestyle benefits for the community Participation in rail trail activities offers many social, health-related and cultural benefits to residents and visitors alike. Often it is difficult for these benefits to be quantified in market economy terms. However this does not detract from the importance of these benefits that highlights the purpose of their provision; long term health, leisure, family, community, wellbeing and societal benefits to be gained by all. The trend in population loss of year olds is a problem for regional Tasmania 42 and although not the only solution, the rail trail will contribute towards reversing this trend by increasing liveability. The North East Rail Trail will also provide enhanced lifestyle for the existing communities. It is envisaged that the participation rate in cycling in the North will increase with the development of the rail trail. This has the capacity to increase social morale as well as providing health benefits for the local population. The Otago Rail Trail is estimated to be used by 30,000 40,000 local residents each year. It provides a significant recreational asset for the community and no doubt has contributed to enhancing the lifestyle of the residents. Participation by North East Tasmania residents is also estimated to be significant with close to 20,000 trips p.a. expected to be taken by local residents on the rail trail after fifteen years post construction. This is expected to support a similar enhancement to local lifestyle as the Otago Rail Trail has supported for its communities. An increased profile for the North East as a result of the rail trail may also contribute towards enhancing regional pride within the local communities. Other regional locations in Australia have successfully increased community participation and spirit through similar tourism-related projects. It could be expected that the project will help to mobilise the local community and provide optimism and energy across the local economy and communities. There is a significant communal benefit to rail trails in regional and remote areas. Importantly, they assist in connecting people to places, and people to 42 Facing The Future, COTA 2013 people, bringing new faces into small rural communities and enhancing social interaction. An increase in visitation and economic activity in the region is likely to also increase investment and development of service and support industries such as in hospitality. This may give local residents more choice and variety of cafés or restaurants Investment attraction and regional stimulus Increased visitation and expenditure in the region as a result of the rail trail is also likely to attract further investment within North Tasmania. Research undertaken on the Otago Rail Trail 43 indicates that nearly one third of survey respondents (29.7%) reported that the rail trail was very important in their decision to buy or start their business. The North East Rail Trail presents an opportunity for entrepreneurs to develop products and services to meet the needs of visiting cyclists. This could include transport, merchandise, accommodation or provisioning and guiding services. There are existing operators in the region that will also stand to benefit considerably from the increase in visitation. They are likely to capitalise on this opportunity and provide additional services, products and experiences for the rail trail users. The increased expenditure will also provide significant stimulus to the regional communities of Northern Tasmania. There will be increased expenditure particularly within the accommodation and food services industry. An increased length of stay for existing markets will improve the occupancy rate of accommodation facilities and may also result in investment in new accommodation infrastructure to meet market needs Enhanced profile of North East Tasmania as a cycling tourism destination The project will also contribute towards enhancing the profile of Tasmania as a cycling destination and more broadly as an adventure tourism destination. This is aligned to the strategic goals of Tourism Tasmania. 43 Otago Central Rail Trail Economic Impact and Trends Survey Jellum,C. and Reis, A NORTH EAST RAIL TRAIL Preliminary demand and economic benefit assessment 20

26 7 Conclusion The preliminary assessment of the proposed North East Rail Trail indicates that it is likely to provide a major tourism and recreational product of state and national significance, capable of generating new, innovative and complimentary tourism investment along the length of the trail and contributing to the economic growth of the wider region. It is likely to offer a competitive rail trail product providing positive economic returns to the state and is worthy of further assessment to confirm the preliminary findings of this paper. The short to medium term benefits that are likely to arise from the construction of the North East Rail Trail are: creation of short term jobs through trail design and construction creation of demand for secondary services throughout region as construction progresses creation of community, government, and business engagement employment growth directly related to North East Rail Trail operations employment growth indirectly related to the current investment in mountain bike trail development, as well as the North East Rail Trail and cycle way development, in the tourism, accommodation and services sectors regional investment in the North East Rail Trail and related businesses increased complementary benefits for Tasmanians such as active transport, recreation, health, social and cultural experiences Diversification of the state and region s tourism product mix increased international awareness of Tasmania through branding and marketing greater attraction of a high value and fast growing segment of Tasmania s visitor market (increase in cycle tourists). Longer term benefits are likely to be: increased employment and economic development opportunities for regional economies increased employment and economic development opportunities for the state economy enhanced Tasmania s reputation as a national and international cycle tourism destination. NORTH EAST RAIL TRAIL Preliminary demand and economic benefit assessment 21
LORD HOWE ISLAND MARINE PARK PROFILE OF LOCAL BUSINESSES. Department of Environment Climate Change & Water. Prepared For: Prepared By:
 LORD HOWE ISLAND MARINE PARK PROFILE OF LOCAL BUSINESSES Prepared For: Department of Environment Climate Change & Water Prepared By: Arche Consulting Pty Ltd Version: June 2010 Arche Consulting T + 61
Warburton Mountain Bike Destination Revised Economic Impact Assessment
 Warburton Mountain Bike Destination Revised Economic Impact Assessment March 2018 Acknowledgements The Warburton Mountain Bike Destination Economic Impact Assessment report has been prepared by TRC Tourism
Economic Impact Analysis. Tourism on Tasmania s King Island
 Economic Impact Analysis Tourism on Tasmania s King Island i Economic Impact Analysis Tourism on Tasmania s King Island This project has been conducted by REMPLAN Project Team Matthew Nichol Principal
Economic Contribution of Tourism to NSW
 Economic Contribution of Tourism to NSW 2013-14 Tourism is a significant part of the NSW economy. In 2013-14, tourism contributed $34.9 billion (Tourism Consumption) to the NSW economy and employed 272,000
Grampians Tourism Strategic Plan
 Grampians Tourism 2016-20 Strategic Plan Grampians Tourism Board Inc. June 2016 BACKGROUND Grampians Tourism Board Inc. has developed a new four-year strategic plan to develop the Visitor Economy in the
Economic Contribution of Tourism to NSW
 Economic Contribution of Tourism to NSW 2015-16 Tourism is a significant part of the NSW economy. In 2015-16, tourism contributed $38.1 billion (Tourism Consumption) to the NSW economy and employed 261,100
NICKI KENYON GENERAL MANAGER CONSUMER MARKETS VISIT VICTORIA. VICTORIAN TOURISM CONFERENCE 25 July 2017
 NICKI KENYON GENERAL MANAGER CONSUMER MARKETS VISIT VICTORIA VICTORIAN TOURISM CONFERENCE 25 July 2017 OVERVIEW Victoria s Visitor Economy Strategy & Targets Victoria s tourism performance Priorities for
Gold Coast: Modelled Future PIA Queensland Awards for Planning Excellence 2014 Nomination under Cutting Edge Research category
 Gold Coast: Modelled Future PIA Queensland Awards for Planning Excellence 2014 Nomination under Cutting Edge Research category Jointly nominated by SGS Economics and Planning and City of Gold Coast August
SHORT BREAKS TO NSW INTRODUCTION
 SHORT BREAKS TO NSW March 2016 INTRODUCTION This document provides demographic profile of domestic and international short break 1 visitors to NSW, and their travel behaviour. It makes comparisons in terms
visitor insights 2016
 visitor insights 2016 table of contents Purpose of Report 3 Surf Coast Data Regions 3 Maps 3 Executive Summary 4 Summary of Total Visitation to Surf Coast 5 Total Visitation and Visitor Nights 5 Total
KANGAROO ISLAND WATERGAP PROJECT
 KANGAROO ISLAND WATERGAP PROJECT 1. BACKGROUND Although Kangaroo Island is only 112km from Adelaide, it is economically and socially disadvantaged by its 16km watergap separation from the mainland. There
30 th January Local Government s critical role in driving the tourism economy. January 2016 de Waal
 30 th January 2016 Local Government s critical role in driving the tourism economy January 2016 de Waal Contents Local Government can make or break tourism in their jurisdiction... 3 TNQ Tourism Vision...
Economic Impact Assessment of the Cruise Shipping Industry in Australia, Executive Summary Cruise Down Under
 Economic Impact Assessment of the Cruise Shipping Industry in Australia, 2013-14 Executive Summary Cruise Down Under September, 2014 Disclaimer: Whilst all care and diligence have been exercised in the
CRUISE TOURISM S CONTRIBUTION TO THE NEW ZEALAND ECONOMY 2017
 CRUISE TOURISM S CONTRIBUTION TO THE NEW ZEALAND ECONOMY 2017 21 August 2017 CRUISE TOURISM S CONTRIBUTION TO THE NEW ZEALAND ECONOMY 2017 Prepared for New Zealand Cruise Association Document reference:
June TEQ Marketing Strategy 2025 Executive Summary
 June 2017 TEQ Marketing Strategy 2025 Executive Summary Vision and The Opportunity Tourism and Events Queensland s (TEQ) Marketing Strategy 2025 provides a platform to realise the TEQ vision of inspiring
June TEQ Marketing Strategy 2025 Executive Summary
 June 2018 TEQ Marketing Strategy 2025 Executive Summary Vision and The Opportunity Tourism and Events Queensland s (TEQ) Marketing Strategy 2025 provides a platform to realise the TEQ vision of inspiring
GREAT SOUTHERN BIKE TRAIL
 GREAT SOUTHERN BIKE TRAIL A STRONG PLAN FOR REAL CHANGE 1 We re ready. Over the last four years, we ve been working hard developing our vision for the future of South Australia. Not just policies, but
The Economic Impact of Tourism in North Carolina. Tourism Satellite Account Calendar Year 2015
 The Economic Impact of Tourism in North Carolina Tourism Satellite Account Calendar Year 2015 Key results 2 Total tourism demand tallied $28.3 billion in 2015, expanding 3.6%. This marks another new high
Domestic VFR travel to NSW
 Domestic VFR travel to NSW Year ended December 2015 INTRODUCTION The and (VFR) market is of considerable importance to Australia and NSW. It is the second largest purpose of visit segment, after the Holiday
Economic contribution of the Qantas Group s regional operations Qantas Group. Commercial-in-confidence
 Commercial-in-confidence Deloitte Access Economics Pty Ltd ACN 149 633 116 8 Brindabella Circuit Brindabella Business Park Canberra Airport Canberra, ACT, 2609 Australia Phone: +61 2 6263 7000 Fax: +61
HEALTH SECTOR ECONOMIC INDICATORS REPORT
 HEALTH SECTOR ECONOMIC INDICATORS REPORT For: Mid North Coast Local Health District Report prepared by: April 2013 Table of Contents Introduction 3 Executive Summary 4 Output 5 Value-Added 7 Workforce
1. FORECAST VISITATION FOR GREAT OCEAN ROAD
 1. FORECAST VISITATION FOR GREAT OCEAN ROAD 1.1. INTRODUCTION This section provides a 20-year forecast of visitation to the Great Ocean Road Region, modelled from Australian Tourism Forecast Committee
Economic Impact Assessment of the Cruise Shipping Industry in Australia, Cruise Down Under. Final Report September, 2010
 Economic Impact Assessment of the Cruise Shipping Industry in Australia, 2009-10 Cruise Down Under Final Report September, 2010 Document Control Job ID: 15640 Job Name: Project Director: Project Manager:
State of the States October 2017 State & territory economic performance report. Executive Summary
 State of the States October 2017 State & territory economic performance report. Executive Summary NSW ON TOP; VICTORIA CLOSES IN How are Australia s states and territories performing? Each quarter CommSec
The Economic Impact of Tourism in North Carolina. Tourism Satellite Account Calendar Year 2013
 The Economic Impact of Tourism in North Carolina Tourism Satellite Account Calendar Year 2013 Key results 2 Total tourism demand tallied $26 billion in 2013, expanding 3.9%. This marks another new high
Economic Impacts of Campgrounds in New York State
 Economic Impacts of Campgrounds in New York State June 2017 Report Submitted to: Executive Summary Executive Summary New York State is home to approximately 350 privately owned campgrounds with 30,000
Australian Casino Association ECONOMIC REPORT. Prepared for. Australian Casino Association. June Finance and Economics
 Australian Casino Association ECONOMIC REPORT Prepared for Australian Casino Association June 2004 Finance and Economics Contents Executive Summary--------------------------------------------------------------------------------------------
Destination Visitor Survey Strategic Regional Research Queensland: Understanding the Queensland Touring Group
 Destination Visitor Survey Strategic Regional Research : Understanding the Touring Group Introduction Tourism is a major industry for (Qld), directly contributing around 124,000 jobs annually. In the year
Produced by: Destination Research Sergi Jarques, Director
 Produced by: Destination Research Sergi Jarques, Director Economic Impact of Tourism North Norfolk District - 2016 Contents Page Summary Results 2 Contextual analysis 4 Volume of Tourism 7 Staying Visitors
Produced by: Destination Research Sergi Jarques, Director
 Produced by: Destination Research Sergi Jarques, Director Economic Impact of Tourism Norfolk - 2016 Contents Page Summary Results 2 Contextual analysis 4 Volume of Tourism 7 Staying Visitors - Accommodation
Self Catering Holidays in England Economic Impact 2015
 Self Catering Holidays in England Economic Impact 2015 An overview of the economic impact of self catering holidays in England Published by The South West Research Company Ltd March 2017 Contents Page
TOURISM: SUPERCHARGING AUSTRALIA S FUTURE
 TOURISM: SUPERCHARGING AUSTRALIA S FUTURE In partnership with ABOUT TTF The Tourism & Transport Forum (TTF) is the peak industry group for the Australian tourism, transport, aviation and investment sectors.
Tourism Satellite Account Calendar Year 2010
 The Economic Impact of Tourism in Georgia Tourism Satellite Account Calendar Year 2010 Highlights The Georgia visitor economy rebounded in 2010, recovering 98% of the losses experienced during the recession
Produced by: Destination Research Sergi Jarques, Director
 Produced by: Destination Research Sergi Jarques, Director Economic Impact of Tourism Oxfordshire - 2015 Economic Impact of Tourism Headline Figures Oxfordshire - 2015 Total number of trips (day & staying)
Rural NSW needs a bottom-up strategy to create a better tourism experience.
 International Centre for Responsible Tourism - Australia Rural NSW needs a bottom-up strategy to create a better tourism experience. Christopher Warren Director of the International Centre of Responsible
La Trobe University s Regional Economic Contribution
 La Trobe University s Regional Economic Contribution REPORT FOR LA TROBE UNIVERSITY JULY 2017 Table of contents Executive Summary... 3 1. Introduction... 6 2. La Trobe University and graduate outcomes...7
Norfolk Island tourism industry
 Norfolk Island tourism industry Significance of tourism The tourism industry is Norfolk Island s main export and is a major driver of the Island s economy. Using expected distribution and value of tourist
Nature Based Tourism in Australia Manifesto
 Nature Based Tourism in Australia Manifesto COVER NOTE This draft Manifesto has been crafted through consultation with State and Federal Governments; tourism and parks agencies; the investment community;
The tourism value of the natural environment and outdoor activities in
 The tourism value of the natural environment and outdoor activities in the South West Produced on behalf of the South West Coast Path Association By The South West Research Company Ltd January 2016 1 Contents
Produced by: Destination Research Sergi Jarques, Director
 Produced by: Destination Research Sergi Jarques, Director Economic Impact of Tourism Norfolk - 2017 Contents Page Summary Results 2 Contextual analysis 4 Volume of Tourism 7 Staying Visitors - Accommodation
Regional Universities Network. Introduction. Regional Universities Network. Economic Impact of the Universities in the Regional Universities Network
 Regional Universities Network Economic Impact of the Universities in the Regional Universities Network Introduction The Regional Universities Network (RUN) is a network of six universities with headquarters
Lord Howe Island Visitor Survey 2017
 INTRODUCTION Lord Howe Island Visitor Survey 2017 Lord Howe Island is one of Australia s premier holiday destinations, part of a World Heritage-listed island group that is known for its outstanding natural
OVERVIEW. Currently South Australia contributes $6.3 billion to the Australian tourism economy.
 OVERVIEW Currently contributes $6.3 billion to the Australian tourism economy. has achieved 79 per cent of its $8.0 billion maximum potential by 2020. $6.3b $6.5b $8b 2016 2017 2020 Annual Visitor Summary
Queensland Regional Tourism Satellite Accounts Tourism Research Australia
 Queensland Regional Tourism Satellite Accounts 2013-14 Tourism Research Australia August 2015 Contents Executive Summary... i 1 Introduction... 1 1.1 Industry context... 1 1.2 Satellite accounting... 1
State Tourism Satellite Accounts
 State Tourism Satellite Accounts 2012 13 Acknowledgments The State Tourism Satellite Accounts series has been produced as part of a modelling program established and funded in partnership with the Australian
T A S M A N I A N G A M B L I N G S E I S I S S U E S P A P E R. Background on the Social and Economic Impact Study of Gambling
 T A S M A N I A N G A M B L I N G S E I S I S S U E S P A P E R Overview of this issues paper This document is an issues paper and public submission invitation as part of the 2017 Social and Economic Impact
Regional Economies and the place of tourism
 David Hamper, International Grammar School Figure One: While large capital cities, like Sydney, often form the backdrop of Australia s tourism industry 46% of all tourism economic activity takes place
ROTORUA REGIONAL AIRPORT
 ROTORUA REGIONAL AIRPORT TRANS-TASMAN DEMAND AND ECONOMIC IMPACT ASSESSMENT PREPARED FOR ROTORUA DISTRICT COUNCIL BY APR CONSULTANTS SEPTEMBER 2005 EXECUTIVE SUMMARY This report presents information on
Economic Impact of Tourism. Cambridgeshire 2010 Results
 Economic Impact of Tourism Cambridgeshire 2010 Results Produced by: Tourism South East Research Department 40 Chamberlayne Road, Eastleigh, Hampshire, SO50 5JH sjarques@tourismse.com http://www.tourismsoutheast.com
The Economic Benefits of Agritourism in Missouri Farms
 The Economic Benefits of Agritourism in Missouri Farms Presented to: Missouri Department of Agriculture Prepared by: Carla Barbieri, Ph.D. Christine Tew, M.S. September 2010 University of Missouri Department
Nova Scotia Tourism Agency Department of Economic and Rural Development and Tourism Statement of Mandate
 Nova Scotia Tourism Agency Department of Economic and Rural Development and Tourism Statement of Mandate 2014-15 Message from the Minister and the CEO Tourism is a key economic driver for communities throughout
The Economic Impact of Tourism on Scarborough District 2014
 The Economic Impact of Tourism on Scarborough District 2014 Prepared by: Tourism South East Research Unit 40 Chamberlayne Road Eastleigh Hampshire SO50 5JH CONTENTS 1. Summary of Results 1 2. Table of
Commerce Committee. 2015/16 Estimates Examination. Vote Business, Science and Innovation. Tourism Portfolio
 Commerce Committee 2015/16 Estimates Examination Vote Business, Science and Innovation Tourism Portfolio Ministry of Business, Innovation and Employment Responses Supplementary Questions 124-131 June 2015
Blue Mountains Visitors. International overnight, domestic overnight and domestic daytrip visitors. Sep-11. Jun-11. Sep-10. Dec-10. Dec-11.
 Dec-08 Mar-09 Jun-09 Sep-09 Dec-09 Mar-10 Jun-10 Sep-10 Dec-10 Mar-11 Jun-11 Sep-11 Dec-11 Mar-12 Jun-12 Sep-12 Dec-12 Mar-13 Jun-13 Sep-13 Dec-13 Mar-14 Jun-14 Sep-14 Visitors (000's) OVERVIEW LGA PROFILE
Brisbane. Social Indicators te.queensland.com/research
 Brisbane Social Indicators 2013 This study examines the social impacts of tourism on the local communities, as perceived by its residents. The research is intended to inform the decision making of state
Pre-Budget Submission
 sdrftsdfsdfsdfsdw Pre-Budget Submission For WA State Budget 2019 1 P age Budget Submission Highlights Tourism in Western Australia contributes $11.8 billion in Gross State Product and generates 103,900
Produced by: Destination Research Sergi Jarques, Director
 Produced by: Destination Research Sergi Jarques, Director Economic Impact of Tourism Oxfordshire - 2016 Economic Impact of Tourism Headline Figures Oxfordshire - 2016 number of trips (day & staying) 27,592,106
COFFS HARBOUR MARKETSNAPSHOT
 MARKETSNAPSHOT NEW SOUTH WALES The Mid North Coast region is ranked fourth in Australia for business confidence with its regional economy growing at a healthy 4.1% p.a. and produces an annual Gross Regional
DESTINATION GIPPSLAND RESEARCH PROGRAM. Health of Tourism Preliminary Results
 DESTINATION GIPPSLAND RESEARCH PROGRAM Health of Tourism Preliminary Results Mike Ruzzene Director, Urban Enterprise CITY OF GREATER GEELONG OVERVIEW OF THE RESEARCH HEALTH OF TOURISM STUDY BUSINESS SURVEY
OVERVIEW Four year annual average to the year ending September 2014
 LGA PROFILE - Mid-Western Regional OVERVIEW Key Measures Mid-Western Regional NSW Total Visitors (overnight and domestic daytrip) (000's) 524 80,316 Total Overnight Visitors (000's) 298 28,105 Total Nights
TRANSPORT AFFORDABILITY INDEX
 TRANSPORT AFFORDABILITY INDEX Report - March 2018 AAA 1 AAA 2 Table of contents Foreword 4 Section One Overview 6 Section Two Summary of Results 8 Section Three Detailed Results 14 Section Four State by
Fraser Coast. Destination Tourism Strategy
 Fraser Coast Destination Tourism Strategy 2012 2016 Fraser Coast The Fraser Coast is home to two of the great icons of Queensland tourism, the world heritage listed Fraser Island and the whale watching
The impact of investments & storms on the economic benefits provided by the South West Coast Path National Trail to the region between 2010 and 2014
 Cumulatve increase since 2010 The impact of investments & storms on the economic benefits provided by the South West Coast Path National Trail to the region between 2010 and 2014 Key findings Between 2010
OVERVIEW Four year annual average to the year ending September 2014
 Dec-08 Mar-09 Jun-09 Sep-09 Dec-09 Mar-10 Jun-10 Sep-10 Dec-10 Mar-11 Jun-11 Sep-11 Dec-11 Mar-12 Jun-12 Sep-12 Dec-12 Mar-13 Jun-13 Sep-13 Dec-13 Mar-14 Jun-14 Sep-14 Visitors (000's) LGA PROFILE - Great
The Economic Impact of Tourism on Calderdale Prepared by: Tourism South East Research Unit 40 Chamberlayne Road Eastleigh Hampshire SO50 5JH
 The Economic Impact of Tourism on Calderdale 2015 Prepared by: Tourism South East Research Unit 40 Chamberlayne Road Eastleigh Hampshire SO50 5JH CONTENTS 1. Summary of Results 1 2. Table of Results Table
1. Overview and Key Issues
 1. Overview and Key Issues 1.1 Role of State Government in Tourism The core tourism objective of state government is to maximise visitor expenditure in the state economy, by maximising the state s market
Mackay Region. Destination Tourism Strategy
 Mackay Region Destination Tourism Strategy 2012 2016 Mackay Region The Mackay region offers an abundance of natural attractions including national parks, gorges, the Great Barrier Reef, numerous islands
REAUTHORISATION OF THE ALLIANCE BETWEEN AIR NEW ZEALAND AND CATHAY PACIFIC
 Chair Cabinet Economic Growth and Infrastructure Committee Office of the Minister of Transport REAUTHORISATION OF THE ALLIANCE BETWEEN AIR NEW ZEALAND AND CATHAY PACIFIC Proposal 1. I propose that the
Agritourism in Missouri: A Profile of Farms by Visitor Numbers
 Agritourism in Missouri: A Profile of Farms by Visitor Numbers Presented to: Sarah Gehring Missouri Department of Agriculture Prepared by: Carla Barbieri, Ph.D. Christine Tew, MS candidate April 2010 University
Department of Premier and Cabinet Casino to Murwillumbah Rail Trail Study Final Report
 Casino to Murwillumbah Rail Trail Study Casino to Murwillumbah Rail Trail Report Final 6 May 2014 This report takes into account the particular instructions and requirements of our client. It is not intended
Contents Manningham at a Glance... 6 Location and Area... 6 Manningham Activity Centres... 6 Manningham Suburbs... 6 Population... 8 Forecast... 9 For
 Contents Manningham at a Glance... 6 Location and Area... 6 Manningham Activity Centres... 6 Manningham Suburbs... 6 Population... 8 Forecast... 9 Forecast 2011 2036... 9 Population Forecast... 9 Gross
TRANSPORT AFFORDABILITY INDEX
 TRANSPORT AFFORDABILITY INDEX Report - December 2016 AAA 1 AAA 2 Table of contents Foreword 4 Section One Overview 6 Section Two Summary of Results 7 Section Three Detailed Results 9 Section Four City
Produced by: Destination Research Sergi Jarques, Director
 Produced by: Destination Research Sergi Jarques, Director Economic Impact of Tourism Epping Forest - 2014 Economic Impact of Tourism Headline Figures Epping Forest - 2014 Total number of trips (day & staying)
5 Rail demand in Western Sydney
 5 Rail demand in Western Sydney About this chapter To better understand where new or enhanced rail services are needed, this chapter presents an overview of the existing and future demand on the rail network
T O U R I S M P L A N 2020
 T O U R I S M P L A N 2020 2 CITY OF HOLDFAST BAY TOURISM PLAN 2020 CONTENTS Executive Summary 4 Introduction 7 Tourism at a State and National Level 7 Tourism in the City of Holdfast Bay 7 Our Focus 8
OVERVIEW Four year annual average to the year ending September 2014
 Dec-08 Mar-09 Jun-09 Sep-09 Dec-09 Mar-10 Jun-10 Sep-10 Dec-10 Mar-11 Jun-11 Sep-11 Dec-11 Mar-12 Jun-12 Sep-12 Dec-12 Mar-13 Jun-13 Sep-13 Dec-13 Mar-14 Jun-14 Sep-14 Visitors (000's) LGA PROFILE - Oberon
USING SPECIAL INTERESTS TO DRIVE TRAVEL. Chris Atkinson TNZ Marketing Communications Manager Sectors Wednesday 12 March, 9am
 USING SPECIAL INTERESTS TO DRIVE TRAVEL Chris Atkinson TNZ Marketing Communications Manager Sectors Wednesday 12 March, 9am Agenda 1. Introduction 2. Special Interest (SI) overview and definition 3. Recap:
OVERVIEW Four year annual average to the year ending September 2014
 Dec-08 Mar-09 Jun-09 Sep-09 Dec-09 Mar-10 Jun-10 Sep-10 Dec-10 Mar-11 Jun-11 Sep-11 Dec-11 Mar-12 Jun-12 Sep-12 Dec-12 Mar-13 Jun-13 Sep-13 Dec-13 Mar-14 Jun-14 Sep-14 Visitors (000's) LGA PROFILE - Newcastle
CAIRNS RECTANGULAR PITCH STADIUM NEEDS STUDY PART 1 CAIRNS REGIONAL COUNCIL DRAFT REPORT SEPTEMBER 2011
 CAIRNS RECTANGULAR PITCH STADIUM NEEDS STUDY PART 1 CAIRNS REGIONAL COUNCIL DRAFT REPORT SEPTEMBER 2011 CAIRNS RECTANGULAR PITCH STADIUM NEEDS STUDY PART 1 Cairns Regional Council September 2011 Coffey
Events Tasmania Research Program Hobart Baroque Festival
 Events Tasmania Research Program Hobart Baroque Festival Research Report 2014 Prepared by This report has been prepared by Enterprise Marketing and Research Services Pty. Ltd. 60 Main Road, Moonah, 7009
OVERVIEW Four year annual average to the year ending September 2014
 Dec-08 Mar-09 Jun-09 Sep-09 Dec-09 Mar-10 Jun-10 Sep-10 Dec-10 Mar-11 Jun-11 Sep-11 Dec-11 Mar-12 Jun-12 Sep-12 Dec-12 Mar-13 Jun-13 Sep-13 Dec-13 Mar-14 Jun-14 Sep-14 Visitors (000's) LGA PROFILE - Tenterfield
OVERVIEW Four year annual average to the year ending September 2014
 LGA PROFILE - Tweed OVERVIEW Total Visitors (overnight and domestic daytrip) (000's) 1,444 80,316 Total Overnight Visitors (000's) 534 28,105 Total Nights (000's) 2,054 154,563 Total Spend (overnight and
OVERVIEW Four year annual average to the year ending September 2014
 Dec-08 Mar-09 Jun-09 Sep-09 Dec-09 Mar-10 Jun-10 Sep-10 Dec-10 Mar-11 Jun-11 Sep-11 Dec-11 Mar-12 Jun-12 Sep-12 Dec-12 Mar-13 Jun-13 Sep-13 Dec-13 Mar-14 Jun-14 Sep-14 Visitors (000's) LGA PROFILE - Eurobodalla
TOURISM AS AN ECONOMIC ENGINE FOR GREATER PHILADELPHIA
 TOURISM AS AN ECONOMIC ENGINE FOR GREATER PHILADELPHIA 2015 Visitation and Economic Impact Report FINAL REPORT SUBMITTED TO: VISIT PHILADELPHIA 30 S. 17 th St, Suite 2010 Philadelphia, PA 19103 FINAL REPORT
Foregone Economic Benefits from Airport Capacity Constraints in EU 28 in 2035
 Foregone Economic Benefits from Airport Capacity Constraints in EU 28 in 2035 Foregone Economic Benefits from Airport Capacity Constraints in EU 28 in 2035 George Anjaparidze IATA, February 2015 Version1.1
OVERVIEW Four year annual average to the year ending September 2014
 Dec-08 Mar-09 Jun-09 Sep-09 Dec-09 Mar-10 Jun-10 Sep-10 Dec-10 Mar-11 Jun-11 Sep-11 Dec-11 Mar-12 Jun-12 Sep-12 Dec-12 Mar-13 Jun-13 Sep-13 Dec-13 Mar-14 Jun-14 Sep-14 Visitors (000's) LGA PROFILE - Snowy
The Economic Impact of Tourism New Forest Prepared by: Tourism South East Research Unit 40 Chamberlayne Road Eastleigh Hampshire SO50 5JH
 The Economic Impact of Tourism New Forest 2008 Prepared by: Tourism South East Research Unit 40 Chamberlayne Road Eastleigh Hampshire SO50 5JH CONTENTS Glossary of terms 1 1. Summary of Results 4 2. Table
Copyrighted material - Taylor & Francis
 444 CHAPTER ELEVEN The public sector and tourism BOX 11.2: CASE STUDY: THE SCOTTISH TOURISM FRAMEWORK FOR ACTION 2002 2005 AND SCOTTISH TOURISM THE NEXT DECADE: A FRAMEWORK FOR TOURISM CHANGE 2006 2015
Estimating Tourism Expenditures for the Burlington Waterfront Path and the Island Line Trail
 A report by the University of Vermont Transportation Research Center Estimating Tourism Expenditures for the Burlington Waterfront Path and the Island Line Trail Report # 10-003 February 2010 Estimating
Greater Melbourne s Destination Management Visitor Plan. Executive Summary
 Greater Melbourne s Destination Management Visitor Plan Executive Summary Funding Partners The Australian Government through the Tourism Demand-Driver Program, administered by the Victoria State Government
EXPO 88 IMPACT THE IMPACT OF WORLD EXPO 88 ON QUEENSLAND'S TOURISM INDUSTRY QUEENSLAND TOURIST AND TRAVEL CORPORATION GPO BOX 328, BRISBANE, 4001
 EXPO 88 IMPACT THE IMPACT OF WORLD EXPO 88 ON QUEENSLAND'S TOURISM INDUSTRY QUEENSLAND TOURIST AND TRAVEL CORPORATION GPO BOX 328, BRISBANE, 4001 Prepared by The National Centre for Studies in Travel and
Cooma-Monaro Visitors. International overnight, domestic overnight and domestic daytrip visitors. Sep-11. Sep-10. Jun-11. Dec-11. Dec-10.
 OVERVIEW LGA PROFILE - Cooma-Monaro Key Measures Cooma- Monaro NSW Total Visitors (overnight and domestic daytrip) (000's) 301 80,316 Total Overnight Visitors (000's) 119 28,105 Total Nights (000's) 346
OVERVIEW Four year annual average to the year ending September 2014
 Dec-08 Mar-09 Jun-09 Sep-09 Dec-09 Mar-10 Jun-10 Sep-10 Dec-10 Mar-11 Jun-11 Sep-11 Dec-11 Mar-12 Jun-12 Sep-12 Dec-12 Mar-13 Jun-13 Sep-13 Dec-13 Mar-14 Jun-14 Sep-14 Visitors (000's) LGA PROFILE - Forbes
New Tourism Strategic Plan Northern Territory
 New Tourism Strategic Plan Northern Territory Submission of Accommodation Association of Australia, 2012 EXECUTIVE SUMMARY Without it being overly detrimental to existing tourism accommodation businesses,
The Economic Impact of Tourism Brighton & Hove Prepared by: Tourism South East Research Unit 40 Chamberlayne Road Eastleigh Hampshire SO50 5JH
 The Economic Impact of Tourism Brighton & Hove 2013 Prepared by: Tourism South East Research Unit 40 Chamberlayne Road Eastleigh Hampshire SO50 5JH CONTENTS 1. Summary of Results 1 1.1 Introduction 1 1.2
Case study: outbound tourism from New Zealand
 66 related crime, less concerned about the stability and certainty offered by booking a package holiday, and may choose to be independent travellers, organizing their travel and itinerary themselves. Tourists
From: OECD Tourism Trends and Policies Access the complete publication at: Ireland
 From: OECD Tourism Trends and Policies 2014 Access the complete publication at: http://dx.doi.org/10.1787/tour-2014-en Ireland Please cite this chapter as: OECD (2014), Ireland, in OECD Tourism Trends
The Economic Impact of Tourism on the District of Thanet 2011
 The Economic Impact of Tourism on the District of Thanet 2011 Prepared by: Tourism South East Research Unit 40 Chamberlayne Road Eastleigh Hampshire SO50 5JH CONTENTS 1. Summary of Results 1 2. Table of
Crown Corporation BUSINESS PLANS FOR THE FISCAL YEAR Trade Centre Limited. Table of Contents. Business Plan
 Crown Corporation BUSINESS PLANS FOR THE FISCAL YEAR 2014 2015 Trade Centre Limited Business Plan 2014 2015 Table of Contents Message from the CEO and the Chair... Mission... Planning Context... Strategic
OVERVIEW Four year annual average to the year ending September 2014
 LGA PROFILE - Forbes OVERVIEW Total Visitors (overnight and domestic daytrip) (000's) 155 80,316 Total Overnight Visitors (000's) 69 28,105 Total Nights (000's) 191 154,563 Total Spend (overnight and domestic