Voluntary Reporting Programs
|
|
|
- Christal Ball
- 5 years ago
- Views:
Transcription

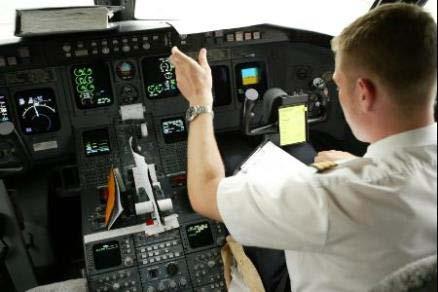
1 Voluntary Reporting Programs Presented to: KOCA By: Anthony Ferrante Date: April 30, 2014
2 Strategy for Overseeing a Large Exploit all resources Organization The people performing the service have valuable insights Technology will not take you everywhere you need to go Some mandatory reports could be automatically captured by software Encourage a safety culture Voluntary safety reporting programs are part of a positive, vibrant, safety culture

3 Philosophy for Voluntary Reporting Programs Value mistakes Learn from mistakes Make safety improvements 誤解の価値を理解する事 from mistakes 誤解から学ぶ事


4 Components of a Voluntary Reporting Program REGULATOR Employee Reports EVENT REVIEW COMMITTEE MANAGEMENT REPRESENTATIVE EMPLOYEE REPRESENTATIVE
5 Voluntary Reporting Programs An oversight authority is a critical component of a voluntary reporting program These programs use employee input to identify: significant safety concerns and issues, operational deficiencies, non-compliance with regulations, deviations from policies and procedures, and unusual safety events
6 Acceptable Reports Must be inadvertent Must not involve gross negligence (that is, the individual did not intentionally introduce risk) Must not appear to involve criminal activity Must not appear to involve substance abuse, controlled substances, or alcohol Must not appear to involve intentional falsification
7 FAA Voluntary Reporting Programs Aviation Safety Information Analysis and Sharing (ASIAS) Aviation Safety Action Program (ASAP)- Industry employees Air Traffic Safety Action Program (ATSAP)- Air Traffic Control employees ATO Safety and Technical Training Program (T-SAP) Technical Operations Services employees
 ASIAS")
8 Aviation Safety Information Analysis and Sharing (ASIAS) ASIAS Overview

9 What is ASIAS. A collaborative Government and Industry initiative on data sharing & analysis to proactively discover safety concerns before accidents or incidents occur, leading to timely mitigation and prevention.


10 ASIAS moves from REACTIVE Analysis to PROACTIVE Analysis From What went wrong? To What COULD go wrong? 10 Photo Credits: National Transportation Safety Board
11 4 Government Members FAA NASA Naval Air Force Atlantic USAF Safety Center 9 Industry Members A4A AIA Airbus ALPA APA (representing CAPA) Boeing NACA NATCA RAA 9 General Aviation Members Altria Boeing Executive CitationAir Flexjet Jet Edge International Midwest Aviation NetJets Pfizer Travel Management Company ASIAS Members 46 Commercial Members ABX Air Air Wisconsin Airlines Alaska Airlines Allegiant Air Aloha Air Cargo American Airlines American Eagle Airlines (Envoy) Atlas Air Cape Air Chautauqua Airlines CommutAir Compass Airlines Delta Air Lines Empire Airlines Endeavor Air Evergreen International Airlines ExpressJet FedEx Express Frontier Airlines GoJet Airlines Hawaiian Airlines Horizon Air JetBlue Airways Kalitta Air As of 1 February 2014 Mesa Airlines Miami Air International National Airlines North American Airlines Omni Air International Piedmont Airlines Polar Air Cargo PSA Airlines Republic Airlines Shuttle America Silver Airways SkyWest Airlines Southern Air Southwest Airlines Spirit Airlines Sun Country Airlines Trans States Airlines United Airlines United Parcel Service US Airways Virgin America World Airways
12 Part 121 and Part 121/135 Operators ASIAS Members Non-ASIAS Members Ineligible for ASIAS Membership (No approved ASAP or FOQA Program) ASIAS Proprietary Do Not Distribute 12


13 Example Aviation Datasets Airline Safety Reports Aircraft Data ATC Safety Reports Radar Weather Infrastructure


14 ASIAS is Governed by Formal Principles Data used solely for advancement of safety Endorsement of voluntary submission of safety-sensitive data Carrier/OEM/MRO data are de-identified Transparency knowledge of how data are used Procedures & policies established through collaborative governance Analyses approved by an ASIAS Executive Board 14


15 ASIAS Is a Key Component of Continuous Improvement in Aviation Safety A collaborative government and industry initiative on data sharing and analysis to proactively discover safety concerns before accidents or incidents occur, leading to timely mitigation and prevention 15
16 ASIAS Executive Board Membership Paul Morell, VP, Safety and Regulatory Compliance USAirways (Industry Co-Chair) Peggy Gilligan, Associate Administrator for Aviation Safety, FAA (Government Co-Chair) Government members: John Duncan, Director, Flight Standards Service, AFS-1 Dorenda Baker, Director, Aircraft Certification Service, AIR-1 Joseph Teixeira, VP Safety Services, Air Traffic Organization Douglas Rohn, Director, NASA Aviation Safety Program Industry members: Mark Millam, Vice President, Operations, A4A Chuck Hogeman, Executive Air Safety Chairman, ALPA Craig Hoskins, VP, Safety and Technical Affairs, Airbus Corky Townsend, Director Aviation Safety, Boeing George Novak, Assistant Vice President of Civil Aviation, AIA Steve Hansen, National Air Traffic Controllers Association Stacey Bechdolt, Director-Safety & Technical Affairs, RAA
17 Completed ASIAS Studies/Metrics ASIAS Directed Studies Risk of Runway Overrun Missed Approaches Class B Airspace Excursions Energy State Management Final Approach Overshoot Vulnerability Discovery Terrain Awareness Warning System (TAWS) Runway Safety Traffic Alert and Collision Avoidance System (TCAS) Unstable Approach Rejected Takeoffs RNAV Departures Pilot/Controller Communications RNAV Arrivals (Misconfigured Takeoffs) Known Risk Monitoring Safety Enhancement Metrics Terrain Awareness Warning System Traffic Alert and Collision Avoidance System Unstable Approach Risk of Runway Overrun Excessive Float Thrust Lever not Idle at Touchdown Rejected Takeoffs Approach and Landing Reduction (ALAR) Risk of Near Mid-Air Collision Controlled Flight into Terrain (CFIT) Loss of Control Airport & Airline Benchmarks

18 Example Analysis: TCAS RA Density Map

19 QUESTIONS?
Aviation Safety Information Analysis and Sharing (ASIAS) ASIAS Overview. Gerardo Hueto May 2013
 ASIAS Overview. Gerardo Hueto May 2013") Aviation Safety Information Analysis and Sharing (ASIAS) ASIAS Overview Gerardo Hueto May 2013 Accidents Have Become Less Frequent and Less Severe 32 Accidents 1,023 Fatalities 11 Accidents 518 Fatalities
Aviation Safety Information Analysis and Sharing (ASIAS) ASIAS Overview Gerardo Hueto May 2013 Accidents Have Become Less Frequent and Less Severe 32 Accidents 1,023 Fatalities 11 Accidents 518 Fatalities
Commercial Aviation Safety Team (CAST) Initiatives to Improve Runway Safety
 Initiatives to Improve Runway Safety") Commercial Aviation Safety Team (CAST) Initiatives to Improve Runway Safety Presented to: Second MID Regional Runway Safety Seminar By: James Fee Date: Presentation Overview Voluntary Safety Philosophy
Commercial Aviation Safety Team (CAST) Initiatives to Improve Runway Safety Presented to: Second MID Regional Runway Safety Seminar By: James Fee Date: Presentation Overview Voluntary Safety Philosophy
Aviation Safety Information Analysis and Sharing ASIAS Overview PA-RAST Meeting March 2016 ASIAS Proprietary Do Not Distribute
 Aviation Safety Information Analysis and Sharing ASIAS Overview PA-RAST Meeting March 2016 ASIAS Proprietary Do Not Distribute Updated: March 2016 2 12 How can safety be improved in an environment of near-zero
ATLANTIC SOUTHEAST AIRLINES Scheduled
 TABLE 1. Summary of Aircraft Departures and Enplaned Passengers, Freight, and Mail by Carrier Group, Air Carrier, and Type of Service: 2007 ( Major carriers ) Aircraft Departures Enplaned revenue-tones
ATLANTIC SOUTHEAST AIRLINES Scheduled ATLAS AIR INC. Nonscheduled
 TABLE 1. Summary of Aircraft Departures and Enplaned Passengers, Freight, and Mail by Carrier Group, Air Carrier, and Type of Service: 2008 ( Major carriers ) Aircraft Departures Enplaned revenue-tones
Commercial Aviation Safety Team
 Commercial Aviation Safety Team WHITE HOUSE COMMISSION ON AVIATION SAFETY AND THE NATIONAL CIVIL AVIATION REVIEW COMMISSION (NCARC) 1.1... Reduce Fatal Accident Rate...... Strategic Plan to Improve Safety......
MONTHLY STATISTICAL REPORT SUMMARY. for the month of January 2018
 MONTHLY STATISTICAL REPORT SUMMARY for the month of January 2018 MONTHLY PERFORMANCE COMPARISON VS. JANUARY 2017 COMMERCIAL PASSENGERS 2018 2017 %CHANGE DOM. INT. TOTAL DOM. INT. TOTAL DOM. INT. TOTAL
MONTHLY AIRPORT TRAFFIC REPORT December 2017
 MONTHLY AIRPORT TRAFFIC REPORT AIRCRAFT OPERATIONS 2017 2016 Change Domestic Air Carrier 55,828 57,943-3.65% Air Taxi 6,810 7,642-10.89% General Aviation 565 569-0.70% Military 25 32-21.88% Subtotal 63,228
MONTHLY AIRPORT TRAFFIC REPORT July 2017
 MONTHLY AIRPORT TRAFFIC REPORT AIRCRAFT OPERATIONS 2017 2016 Change Domestic Air Carrier 63,535 63,680-0.23% Air Taxi 7,291 7,548-3.40% General Aviation 630 717-12.13% Military 15 11 36.36% Subtotal 71,471
MONTHLY AIRPORT TRAFFIC REPORT May 2015
 MONTHLY AIRPORT TRAFFIC REPORT AIRCRAFT OPERATIONS 2015 2014 Change Domestic Air Carrier 60,427 57,339 5.39% Air Taxi 7,825 10,967-28.65% General Aviation 547 635-13.86% Military 135 27 400.00% Subtotal
MONTHLY AIRPORT TRAFFIC REPORT November 2013
 MONTHLY AIRPORT TRAFFIC REPORT AIRCRAFT OPERATIONS 2013 2012 Change Domestic Air Carrier 52,937 54,739-3.29% Air Taxi 13,964 13,566 2.93% General Aviation 504 515-2.14% Military 25 28-10.71% Subtotal 67,430
MONTHLY AIRPORT TRAFFIC REPORT January 2018
 MONTHLY AIRPORT TRAFFIC REPORT AIRCRAFT OPERATIONS 2018 2017 Change Domestic Air Carrier 55,461 55,980-0.93% Air Taxi 7,166 7,330-2.24% General Aviation 690 625 10.40% Military 6 11-45.45% Subtotal 63,323
Commercial Aviation Safety Team (CAST) Overview
 Overview") Commercial Aviation Safety Team (CAST) Overview PA-RAST March, 2016 In the U.S., our focus was set by the White House Commission on Aviation Safety, and The National Civil Aviation Review Commission (NCARC)
Commercial Aviation Safety Team (CAST) Overview PA-RAST March, 2016 In the U.S., our focus was set by the White House Commission on Aviation Safety, and The National Civil Aviation Review Commission (NCARC)
MONTHLY AIRPORT TRAFFIC REPORT September 2018
 MONTHLY AIRPORT TRAFFIC REPORT AIRCRAFT OPERATIONS 2018 2017 Change Domestic Air Carrier 58,763 55,902 5.12% Air Taxi 6,537 6,689-2.27% General Aviation 605 658-8.05% Military 14 17-17.65% Subtotal 65,919
MONTHLY AIRPORT TRAFFIC REPORT. April 2014
 MONTHLY AIRPORT TRAFFIC REPORT AIRCRAFT OPERATIONS 2014 2013 Change Domestic Air Carrier 55,529 55,119 0.74% Air Taxi 11,149 15,077-26.05% General Aviation 639 723-11.62% Military 13 14-7.14% Subtotal
MONTHLY AIRPORT TRAFFIC REPORT April 2017
 MONTHLY AIRPORT TRAFFIC REPORT AIRCRAFT OPERATIONS 2017 2016 Change Domestic Air Carrier 56,570 60,697-6.80% Air Taxi 7,771 7,806-0.45% General Aviation 833 699 19.17% Military 23 14 64.29% Subtotal 65,197
MONTHLY AIRPORT TRAFFIC REPORT December 2018
 MONTHLY AIRPORT TRAFFIC REPORT AIRCRAFT OPERATIONS 2018 2017 Change Domestic Air Carrier 58,905 55,828 5.51% Air Taxi 6,948 6,810 2.03% General Aviation 499 565-11.68% Military 24 25-4.00% Subtotal 66,376
MONTHLY AIRPORT TRAFFIC REPORT June 2017
 MONTHLY AIRPORT TRAFFIC REPORT AIRCRAFT OPERATIONS 2017 2016 Change Domestic Air Carrier 61,445 62,662-1.94% Air Taxi 8,267 7,656 7.98% General Aviation 644 685-5.99% Military 8 18-55.56% Subtotal 70,364
AIR WISCONSIN AIRLINES CORP Scheduled
 06891 2U K 11 0 0 3 3 06891 2U K 2 0 0 51 169 TABLE 1. Summary of Aircraft Departures and Enplaned Passengers, Freight, and Mail by Carrier Group, Air Carrier, and Type of Service: 2004 ( Major carriers
MEMPHIS INTERNATIONAL AIRPORT ACTIVITY REPORT FEBRUARY 2018
 MEMPHIS INTERNATIONAL AIRPORT ACTIVITY REPORT FEBRUARY 2018 Scott A. Brockman, President & CEO Forrest B. Artz, Vice President & CFO Terry S. Blue, Vice President MAJOR Scheduled DOMESTIC INTERNATIONAL
MONTHLY AIRPORT TRAFFIC REPORT March 2017
 MONTHLY AIRPORT TRAFFIC REPORT AIRCRAFT OPERATIONS 2017 2016 Change Domestic Air Carrier 60,360 61,951-2.57% Air Taxi 8,591 8,270 3.88% General Aviation 717 615 16.59% Military 14 27-48.15% Subtotal 69,682
MEMPHIS INTERNATIONAL AIRPORT ACTIVITY REPORT FEBRUARY 2019
 MEMPHIS INTERNATIONAL AIRPORT ACTIVITY REPORT FEBRUARY 2019 Scott A. Brockman, President & CEO Forrest B. Artz, Vice President & CFO Terry S. Blue, Vice President MAJOR Scheduled DOMESTIC INTERNATIONAL
MONTHLY AIRPORT TRAFFIC REPORT August 2018
 MONTHLY AIRPORT TRAFFIC REPORT AIRCRAFT OPERATIONS 2018 2017 Change Domestic Air Carrier 65,465 63,201 3.58% Air Taxi 7,607 7,533 0.98% General Aviation 594 609-2.46% Military 15 3 400.00% Subtotal 73,681
MONTHLY AIRPORT TRAFFIC REPORT July 2018-(Revised)
") MONTHLY AIRPORT TRAFFIC REPORT AIRCRAFT OPERATIONS 2018 2017 Change Domestic Air Carrier 64,066 63,535 0.84% Air Taxi 7,468 7,291 2.43% General Aviation 550 630-12.70% Military 5 15-66.67% Subtotal 72,089
MONTHLY AIRPORT TRAFFIC REPORT AIRCRAFT OPERATIONS 2018 2017 Change Domestic Air Carrier 64,066 63,535 0.84% Air Taxi 7,468 7,291 2.43% General Aviation 550 630-12.70% Military 5 15-66.67% Subtotal 72,089
MONTHLY AIRPORT TRAFFIC REPORT February 2018
 MONTHLY AIRPORT TRAFFIC REPORT AIRCRAFT OPERATIONS 2018 2017 Change Domestic Air Carrier 51,809 51,854-0.09% Air Taxi 6,659 6,988-4.71% General Aviation 651 540 20.56% Military 6 9-33.33% Subtotal 59,125
DEPARTMENT CODES UPDATE
 DeptID Description 100001 President 100002 First Vice President 100003 VP Administration 100004 VP Finance 100005 Executive Administrator 100008 Executive Staff Management Dpt 100010 Human Resources 100011
MONTHLY AIRPORT TRAFFIC REPORT April 2018
 MONTHLY AIRPORT TRAFFIC REPORT AIRCRAFT OPERATIONS 2018 2017 Change Domestic Air Carrier 60,928 56,570 7.70% Air Taxi 6,995 7,771-9.99% General Aviation 654 833-21.49% Military 9 23-60.87% Subtotal 68,586
MONTHLY AIRPORT TRAFFIC REPORT February 2014
 MONTHLY AIRPORT TRAFFIC REPORT AIRCRAFT OPERATIONS 2014 2013 Change Domestic Air Carrier 44,741 48,627-7.99% Air Taxi 11,144 13,003-14.30% General Aviation 569 543 4.79% Military 17 15 13.33% Subtotal
MONTHLY AIRPORT TRAFFIC REPORT September 2016
 MONTHLY AIRPORT TRAFFIC REPORT AIRCRAFT OPERATIONS 2016 2015 Change Domestic Air Carrier 59,030 59,038-0.01% Air Taxi 7,779 7,201 8.03% General Aviation 704 571 23.29% Military 21 12 75.00% Subtotal 67,534
MONTHLY AIRPORT TRAFFIC REPORT July 2016
 MONTHLY AIRPORT TRAFFIC REPORT AIRCRAFT OPERATIONS 2016 2015 Change Domestic Air Carrier 63,680 62,789 1.42% Air Taxi 7,548 8,007-5.73% General Aviation 717 558 28.49% Military 11 146-92.47% Subtotal 71,956
Safety Enhancement 186R3.2 TCAS-Sensitivity Level Command
 Safety Enhancement Action: Statement of Work: Total Relation to Current Aviation Community Initiatives: Performance Goal Indicators: Key Milestones: Safety Enhancement 186R3.2 TCAS-Sensitivity Level Command
Calendar Year Basis Year Year Apr Apr Percent to Date to Date Percent Change Change
 T F Green Airport Monthly Airport Passenger Activity Summary April 2018 Calendar Year Basis Year Year Apr Apr Percent to Date to Date Percent 2018 2017 Change 2018 2017 Change Total Enplaned 194,510 157,788
Safety Information Analysis Program Update. Marc Champion, UAL FOQA/ASAP Project Team Lead
 Safety Information Analysis Program Update Marc Champion, UAL FOQA/ASAP Project Team Lead Safety Information Analysis Program The mission of the Safety Information Analysis Program is to develop and maintain
Monthly Airport Passenger Activity Summary
 T F Green Airport Monthly Airport Passenger Activity Summary December 2017 Calendar Year Basis Year Year Dec Dec Percent to Date to Date Percent 2017 2016 Change 2017 2016 Change Total Enplaned 175,889
NextGen Equipage Impact on Airlines and MROs April 16, 2013
 NextGen Equipage Impact on Airlines and MROs April 16, 2013 www.nexacapital.com Without NextGen equipage by operators, there will be no NextGen Marion C. Blakey President, Aerospace Industries Association
Monthly Airport Passenger Activity Summary
 T F Green Airport Monthly Airport Passenger Activity Summary January 2018 Calendar Year Basis Year Year Jan Jan Percent to Date to Date Percent 2018 2017 Change 2018 2017 Change Total Enplaned 148,452
Calendar Year Basis Year Year August August Percent to Date to Date Percent Change Change
 T F Green Airport Monthly Airport Passenger Activity Summary August 2018 Calendar Year Basis Year Year August August Percent to Date to Date Percent 2018 2017 Change 2018 2017 Change Total Enplaned 202,148
PORTLAND INTERNATIONAL AIRPORT (PDX)
") Monthly Traffic Report ember, 20: Calendar Year Report This Month Calendar Year to Date 20 20 %Chg 20 20 %Chg Total PDX Flight Operations * 18,0 21,618-16.7% 252,572 264,518-4.5% Military 238 97 145.4%
Monthly Traffic Report ember, 20: Calendar Year Report This Month Calendar Year to Date 20 20 %Chg 20 20 %Chg Total PDX Flight Operations * 18,0 21,618-16.7% 252,572 264,518-4.5% Military 238 97 145.4%
Operations and Traffic March 2018
 Operations and Traffic Operations(¹) 2018 2017 Change % Change % Total YTD 2018 YTD 2017 Change % Change % Total Air Carrier 37,359 39,210 (1,851) (4.7%) 75.8% 103,577 107,908 (4,331) (4.0%) 75.6% Air
PORTLAND INTERNATIONAL AIRPORT (PDX)
") Monthly Traffic Report This Month Calendar Year to Date 2007 2006 %Chg 2007 2006 %Chg Total PDX Flight Operations * 21,618 21,633-0.1% 264,518 260,510 1.5% Military 97 328-70.4% 3,707 5,023-26.2% General
Monthly Traffic Report This Month Calendar Year to Date 2007 2006 %Chg 2007 2006 %Chg Total PDX Flight Operations * 21,618 21,633-0.1% 264,518 260,510 1.5% Military 97 328-70.4% 3,707 5,023-26.2% General
Calendar Year Basis Year Year May May Percent to Date to Date Percent Change Change
 T F Green Airport Monthly Airport Passenger Activity Summary May 2018 Calendar Year Basis Year Year May May Percent to Date to Date Percent 2018 2017 Change 2018 2017 Change Total Enplaned 192,063 158,331
Operations and Traffic June 2018
 Operations and Traffic Operations(¹) 2018 2017 Change % Change % Total YTD 2018 YTD 2017 Change % Change % Total Air Carrier 41,390 41,225 165 0.4% 76.7% 221,390 225,992 (4,602) (2.0%) 76.4% Air Taxi 12,124
Safety Enhancement RNAV Safe Operating and Design Practices for STARs and RNAV Departures
 Safety Enhancement Action: Implementers: Statement of Work: Safety Enhancement 213.5 RNAV Safe Operating and Design Practices for STARs and RNAV Departures To mitigate errors on Standard Terminal Arrival
Operations and Traffic August 2018
 Operations and Traffic Operations(¹) 2018 2017 Change % Change % Total YTD 2018 YTD 2017 Change % Change % Total Air Carrier 42,212 43,007 (795) (1.8%) 76.4% 305,876 311,886 (6,010) (1.9%) 76.4% Air Taxi
Operations and Traffic December 2018
 Operations and Traffic Operations(¹) 2018 2017 Change % Change % Total YTD 2018 YTD 2017 Change % Change % Total Air Carrier 38,468 37,106 1,362 3.7% 77.0% 462,276 461,992 284 0.1% 76.6% Air Taxi 11,198
Operations and Traffic November 2018
 Operations and Traffic Operations(¹) 2018 2017 Change % Change % Total YTD 2018 YTD 2017 Change % Change % Total Air Carrier 37,928 36,266 1,662 4.6% 77.8% 422,673 424,886 (2,213) (0.5%) 76.6% Air Taxi
PORTLAND INTERNATIONAL AIRPORT (PDX)
") Monthly Traffic Report e, 20: Fiscal Year Report This Month Fiscal Year to Date 20 20 %Chg 20 20 %Chg Total PDX Flight Operations * 23,003 22,256 3.4% 263,777 260,745 1.2% Military 410 450-8.9% 4,445 6,431-30.9%
Monthly Traffic Report e, 20: Fiscal Year Report This Month Fiscal Year to Date 20 20 %Chg 20 20 %Chg Total PDX Flight Operations * 23,003 22,256 3.4% 263,777 260,745 1.2% Military 410 450-8.9% 4,445 6,431-30.9%
Monthly Airport Passenger Activity Summary. October 2017
 T F Green Airport Monthly Airport Passenger Activity Summary October 2017 Calendar Year Basis Year Year Oct Oct Percent to Date to Date Percent 2017 2016 Change 2017 2016 Change Total Enplaned 196,345
PORTLAND INTERNATIONAL AIRPORT (PDX)
") Monthly Traffic Report ch, 20 This Month Calendar Year to Date 20 20 %Chg 20 20 %Chg Total PDX Flight Operations * 21,537 22,218-3.1% 62,490 62,789-0.5% Military 242 474-48.9% 739 1,127-34.4% General Aviation
Monthly Traffic Report ch, 20 This Month Calendar Year to Date 20 20 %Chg 20 20 %Chg Total PDX Flight Operations * 21,537 22,218-3.1% 62,490 62,789-0.5% Military 242 474-48.9% 739 1,127-34.4% General Aviation
Monthly Airport Passenger Activity Summary. Sep 2017
 T F Green Airport Monthly Airport Passenger Activity Summary Sep 2017 Calendar Year Basis Year Year Sep Sep Percent to Date to Date Percent 2017 2016 Change 2017 2016 Change Total Enplaned 161,165 151,982
Approach and Landing Accident Reduction Joint Safety Implementation Team
 SE 22 (21) Approach and Landing Accident Reduction Joint Safety Implementation Team Implementation Plan For Flight Deck Equipment Upgrade/Installation to Improve Altitude Awareness and Checklist Completion
DENVER INTERNATIONAL AIRPORT. TOTAL OPERATIONS AND TRAFFIC December 2014
 DENVER INTERNATIONAL AIRPORT TOTAL OPERATIONS AND TRAFFIC December 2014 December YEAR TO DATE % of % of % Grand % Grand cr./ cr./ cr./ cr./ 2014 2013 Decr. Decr. 2014 2014 2013 Decr. Decr. 2014 OPERATIONS
PORTLAND INTERNATIONAL AIRPORT (PDX)
") Monthly Traffic Report This Month Calendar Year to Date 20 20 %Chg 20 20 %Chg Total PDX Flight Operations * 19,211,625 3.1% 233,993 228,949 2.2% Military 9 310-42.3% 3,520 4,144-15.1% General Aviation
Monthly Traffic Report This Month Calendar Year to Date 20 20 %Chg 20 20 %Chg Total PDX Flight Operations * 19,211,625 3.1% 233,993 228,949 2.2% Military 9 310-42.3% 3,520 4,144-15.1% General Aviation
Statistical Report Calendar Year 2013
 Statistical Report Year 213 Houston Airports P.O. Box 616 Houston, TX 7725-16 Request for User Input The intent of the monthly and annual statistical reports is to provide data that is both relevant and
FDM vs. FOQA. FAA HQ Perspective. Federal Aviation Administration. By: Dr. Doug Farrow, HQ FAA Date: January 8, 2007
 FDM vs. FOQA FAA HQ Perspective Presented to: By: Dr. Doug Farrow, HQ FAA Date: Overview FDM vs. FOQA Who you gonna call? Why voluntary programs? What s in it for me? 2 2 FDM vs. FOQA Flight Data Monitoring
PORTLAND INTERNATIONAL AIRPORT (PDX) Monthly Traffic Report November, 2006
 Monthly Traffic Report November, 2006") Monthly Traffic Report This Month Calendar Year to Date 2006 2005 %Chg 2006 2005 %Chg Total PDX Flight Operations * 20,714 21,257-2.6% 238,877 241,667-1.2% Military 355 476-25.4% 4,695 6,127-23.4% General
Monthly Traffic Report This Month Calendar Year to Date 2006 2005 %Chg 2006 2005 %Chg Total PDX Flight Operations * 20,714 21,257-2.6% 238,877 241,667-1.2% Military 355 476-25.4% 4,695 6,127-23.4% General
PORTLAND INTERNATIONAL AIRPORT (PDX)
") Monthly Traffic Report This Month Calendar Year to Date 20 20 %Chg 20 20 %Chg Total PDX Flight Operations * 15,731 15,520 1.4% 33,326 32,280 3.2% Military 211 0.2% 478 381 25.5% General Aviation 942 926
Monthly Traffic Report This Month Calendar Year to Date 20 20 %Chg 20 20 %Chg Total PDX Flight Operations * 15,731 15,520 1.4% 33,326 32,280 3.2% Military 211 0.2% 478 381 25.5% General Aviation 942 926
PORTLAND INTERNATIONAL AIRPORT (PDX)
") Monthly Traffic Report e, 20: Fiscal Year Report This Month Fiscal Year to Date 20 20 %Chg 20 20 %Chg Total PDX Flight Operations * 21,213 20,651 2.7% 228,846 222,979 2.6% Military 334 374-10.7% 3,829
Monthly Traffic Report e, 20: Fiscal Year Report This Month Fiscal Year to Date 20 20 %Chg 20 20 %Chg Total PDX Flight Operations * 21,213 20,651 2.7% 228,846 222,979 2.6% Military 334 374-10.7% 3,829
PORTLAND INTERNATIONAL AIRPORT (PDX)
") Monthly Traffic Report ember, 20: Calendar Year Report This Month Calendar Year to Date 20 20 %Chg 20 20 %Chg Total PDX Flight Operations * 18,625 18,586 0.2% 228,949 227,709 0.5% Military 310 254 22.0%
Monthly Traffic Report ember, 20: Calendar Year Report This Month Calendar Year to Date 20 20 %Chg 20 20 %Chg Total PDX Flight Operations * 18,625 18,586 0.2% 228,949 227,709 0.5% Military 310 254 22.0%
DENVER INTERNATIONAL AIRPORT
 DENVER INTERNATIONAL AIRPORT TOTAL OPERATIONS AND TRAFFIC October 2013 October YEAR TO DATE % of % of % Grand % Grand cr./ cr./ Total cr./ cr./ Total 2013 2012 Decr. Decr. 2013 2013 2012 Decr. Decr. 2013
DENVER INTERNATIONAL AIRPORT. TOTAL OPERATIONS AND TRAFFIC December 2013
 DENVER INTERNATIONAL AIRPORT TOTAL OPERATIONS AND TRAFFIC December 2013 December YEAR TO DATE % of % of % Grand % Grand cr./ cr./ cr./ cr./ 2013 2012 Decr. Decr. 2013 2013 2012 Decr. Decr. 2013 OPERATIONS
Monthly Airport Passenger Activity Summary. Aug 2017
 T F Green Airport Monthly Airport Passenger Activity Summary Aug 2017 Calendar Year Basis Year Year Aug Aug Percent to Date to Date Percent 2017 2016 Change 2017 2016 Change Total Enplaned 190,676 169,667
DENVER INTERNATIONAL AIRPORT. TOTAL OPERATIONS AND TRAFFIC February 2014
 DENVER INTERNATIONAL AIRPORT TOTAL OPERATIONS AND TRAFFIC February 2014 February YEAR TO DATE % of % of % Grand % Grand cr./ cr./ cr./ cr./ 2014 2013 Decr. Decr. 2014 2014 2013 Decr. Decr. 2014 OPERATIONS
Airport Noise Management Report 1st Quarter 2018
 AIRPORT NOISE MANAGEMENT REPORT 1 ST QUARTER 2018 The Airport Noise Management Report provides the summary of St. Louis Lambert International Airport s operations and noise complaints. The data in this
DENVER INTERNATIONAL AIRPORT. TOTAL OPERATIONS AND TRAFFIC November 2013
 DENVER INTERNATIONAL AIRPORT TOTAL OPERATIONS AND TRAFFIC November 2013 November YEAR TO DATE % of % of % Grand % Grand cr./ cr./ cr./ cr./ 2013 2012 Decr. Decr. 2013 2013 2012 Decr. Decr. 2013 OPERATIONS
Quieter Skies Report. Partnership for. Fort Lauderdale-Hollywood International Airport. Prepared by: Broward County Aviation Department
 Fort Lauderdale-Hollywood International Airport Prepared by: Broward County Aviation Department May 2017 Partnership for Quieter Skies Report 1 The Partnership for Quieter Skies Report provides an overview
Airport Noise Management Report 1st Quarter 2018
 AIRPORT NOISE MANAGEMENT REPORT 2 nd QUARTER 2018 Airport Noise Management Report 1st Quarter 2018 The Airport Noise Management Report provides the 2nd Quarter 2018 summary of St. Louis Lambert International
PORTLAND INTERNATIONAL AIRPORT (PDX)
") Monthly Traffic Report uary, 20 This Month Calendar Year to Date 20 20 %Chg 20 20 %Chg Total PDX Flight Operations * 17,502 17,957-2.5% 17,502 17,957-2.5% Military 373 298 25.2% 373 298 25.2% General Aviation
Monthly Traffic Report uary, 20 This Month Calendar Year to Date 20 20 %Chg 20 20 %Chg Total PDX Flight Operations * 17,502 17,957-2.5% 17,502 17,957-2.5% Military 373 298 25.2% 373 298 25.2% General Aviation
PORTLAND INTERNATIONAL AIRPORT (PDX)
") Monthly Traffic Report This Month Calendar Year to Date 2006 2005 %Chg 2006 2005 %Chg Total PDX Flight Operations * 21,304 22,342-4.6% 61,057 63,232-3.4% Military 564 564 0.0% 1,503 1,443 4.2% General
Monthly Traffic Report This Month Calendar Year to Date 2006 2005 %Chg 2006 2005 %Chg Total PDX Flight Operations * 21,304 22,342-4.6% 61,057 63,232-3.4% Military 564 564 0.0% 1,503 1,443 4.2% General
Monthly Airport Passenger Activity Summary. March2017
 T F Green Airport 04/17/17 Monthly Airport Passenger Activity Summary March2017 Calendar Year Basis Year Year March March Percent to Date to Date Percent 2017 2016 Change 2017 2016 Change Enplaned 152,513
Monthly Airport Passenger Activity Summary. May 2017
 T F Green Airport Monthly Airport Passenger Activity Summary May 2017 Calendar Year Basis Year Year May May Percent to Date to Date Percent 2017 2016 Change 2017 2016 Change Enplaned 158,331 158,270 0.04%
TAWS Implementation. CAST Status. TCAS Action Plan. Runway Safety Initiative. JIMDAT Status. Data Mining. Kyle L. Olsen Aviation Safety Advisor, FAA
 CAST Status TCAS Action Plan TAWS Implementation Runway Safety Initiative JIMDAT Status Data Mining Seoul, 27-28 April 2009 Kyle L. Olsen Aviation Safety Advisor, FAA COMMERCIAL AVIATION SAFETY TEAM (CAST)
Airport Noise Management Report 1st Quarter 2017
 Airport Noise Management Report The Airport Noise Management Report is a publication of the Airport Noise Management Office. This report provides a 1st quarter summary of St. Louis Lambert International
Preventing Runway Excursions. Technical solutions From the Design and Manufacturing Sector
 Preventing Runway Excursions Technical solutions From the Design and Manufacturing Sector By Claude Lelaie ICAO Global Runway Safety Summit 1 Today, main cause of accidents is Runway Excursion Main factors
Airport Noise Management 2017 Annual Report
 Airport Noise Management 2017 Annual Report The Airport Noise Management Report provides a yearly summary of St. Louis Lambert International Airport s operations and noise complaints. The NAS (National
Number of Complaints by Community 2015
 Airport Noise Management Annual Report 2015 The Airport Noise Management Report is a publication of the Airport Noise Management Office. This report provides an annual summary of Lambert St. Louis International
Monthly Airport Passenger Activity Summary. December 2011
 T F Green Airport 01/17/12 Monthly Airport Passenger Activity Summary December 2011 Calendar Year Basis Year Year December December Percent to Date to Date Percent 2011 2010 Change 2011 2010 Change Enplaned
DENVER INTERNATIONAL AIRPORT. TOTAL OPERATIONS AND TRAFFIC June 2015 Revised 11/23/15
 DENVER INTERNATIONAL AIRPORT TOTAL OPERATIONS AND TRAFFIC June 2015 Revised 11/23/15 June YEAR TO DATE % of % of % Grand % Grand cr./ cr./ cr./ cr./ 2015 (9) 2014 Decr. Decr. 2015 2015 (9) 2014 Decr. Decr.
Airport Noise Management Report 3rd Quarter 2017
 Airport Noise Management Report 3rd Quarter 2017 The Airport Noise Management Report provides the 3rd quarter 2017 summary of St. Louis Lambert International Airport s operations and noise complaints.
Safety Enhancement SE ASA Training - Policy and Training for Non-Normal Situations
 Safety Enhancement Action: Implementers: (Select all that apply) Statement of Work: Total Financial Resources: Total: $1.2M Output 1: $0.6M Output 2: $0.6M Relation to Current Aviation Community Initiatives:
DENVER INTERNATIONAL AIRPORT. TOTAL OPERATIONS AND TRAFFIC September 2017
 September YEAR TO DATE % of % of % Grand % Grand cr./ cr./ cr./ cr./ 2017 2016 Decr. Decr. 2017 2017 2016 Decr. Decr. 2017 OPERATIONS (1) Air Carrier 37,972 38,529 (557) -1.4% 79.5% 349,858 332,457 17,401
Takeoff and Landing Performance Assessment (TALPA)
") Takeoff and Landing Performance Assessment (TALPA) Status Briefing Presented to: By: Date: ACI-NA Austin, TX Michael J. O Donnell, A.A.E. April 18, 2016 TALPA History The Beginning Background Concepts
Takeoff and Landing Performance Assessment (TALPA) Status Briefing Presented to: By: Date: ACI-NA Austin, TX Michael J. O Donnell, A.A.E. April 18, 2016 TALPA History The Beginning Background Concepts
June 9th, 2011 Runway Excursions at Landing The n 1 Global Air Safety Issue Can We Reduce this Risk Through Innovative Avionics?
 Runway Excursions at Landing The n 1 Global Air Safety Issue Can We Reduce this Risk Through Innovative Avionics? Presented by Bill Bozin VP, Safety and Technical Affairs, Airbus Americas Agenda Safety
PORTLAND INTERNATIONAL AIRPORT (PDX)
") Monthly Traffic Report il, 20 This Month Calendar Year to Date 20 20 %Chg 20 20 %Chg Total PDX Flight Operations * 21,262 20,818 2.1% 84,051 81,875 2.7% Military 354 419-15.5% 1,481 1,922-22.9% General
Monthly Traffic Report il, 20 This Month Calendar Year to Date 20 20 %Chg 20 20 %Chg Total PDX Flight Operations * 21,262 20,818 2.1% 84,051 81,875 2.7% Military 354 419-15.5% 1,481 1,922-22.9% General
DENVER INTERNATIONAL AIRPORT. TOTAL OPERATIONS AND TRAFFIC October 2017
 October YEAR TO DATE % of % of % Grand % Grand cr./ cr./ cr./ cr./ 2017 2016 Decr. Decr. 2017 2017 2016 Decr. Decr. 2017 OPERATIONS (1) Air Carrier 38,762 38,970 (208) -0.5% 79.6% 388,620 371,427 17,193
DENVER INTERNATIONAL AIRPORT
 DENVER INTERNATIONAL AIRPORT TOTAL OPERATIONS AND TRAFFIC December YEAR TO DATE % of % of % Grand % Grand cr./ cr./ Total cr./ cr./ Total 2011 2010 Decr. Decr. 2011 2011 (9) 2010 (10) Decr. Decr. 2011
DENVER INTERNATIONAL AIRPORT. TOTAL OPERATIONS AND TRAFFIC January 2012
 DENVER INTERNATIONAL AIRPORT TOTAL OPERATIONS AND TRAFFIC January 2012 January YEAR TO DATE % of % of % Grand % Grand Incr./ Incr./ Total Incr./ Incr./ Total 2012 2011 (9) Decr. Decr. 2012 2012 2011 (9)
Available Technologies. Asia / Pacific Regional Runway Safety Seminar Session 4
 Available Technologies Asia / Pacific Regional Runway Safety Seminar Session 4 Runway Incursions, Confusion and Excursions are a leading cause of Aviation Accidents Runway Incursion & Confusion Runway
DENVER INTERNATIONAL AIRPORT. TOTAL OPERATIONS AND TRAFFIC January 2017
 January YEAR TO DATE % of % of % Grand % Grand Incr./ Incr./ Total Incr./ Incr./ Total 2017 2016 Decr. Decr. 2017 2017 2016 Decr. Decr. 2017 OPERATIONS (1) Air Carrier 35,779 35,235 544 1.5% 78.0% 35,779
Monthly Airport Passenger Activity Summary. Jun 2017
 T F Green Airport Monthly Airport Passenger Activity Summary Jun 2017 Calendar Year Basis Year Year Jun Jun Percent to Date to Date Percent 2017 2016 Change 2017 2016 Change Enplaned 161,324 156,458 3.11%
Monthly Airport Passenger Activity Summary. February 2017
 T F Green Airport 03/24/17 Monthly Airport Passenger Activity Summary February 2017 Calendar Year Basis Year Year Febuary Febuary Percent to Date to Date Percent 2017 2016 Change 2017 2016 Change Enplaned
Available Technologies. Session 4 Presentation 1
 Available Technologies Session 4 Presentation 1 Runway Incursions, Confusion and Excursions are a leading cause of Aviation Accidents Runway Incursion & Confusion Runway Incursion & Confusion Eliminating
Quieter Skies Report. Partnership for. Fort Lauderdale-Hollywood International Airport. Prepared by: Broward County Aviation Department
 Fort Lauderdale-Hollywood International Airport Prepared by: Broward County Aviation Department March 2015 Partnership for Quieter Skies Report The Report provides an overview of progress of efforts to
Hillsboro Airport Operations 20,453 18, % 148, , % Troutdale Airport Operations 6,349 7, % 52,433 59,
 PORTLAND INTERNATIONAL AIRPORT (PDX) Monthly Traffic Report This Month Calendar Year to Date 2004 2003 % Chg 2004 2003 % Chg Total PDX Flight Operations * 21,944 22,594-2.9% 199,422 201,759-1.2% Military
Hillsboro Airport Operations 12,874 10, % 180, , % Troutdale Airport Operations 3,944 4, % 62,945 69,370-9.
 Monthly Traffic Report ember, 2004 This Month Calendar Year to Date 2004 2003 % Chg 2004 2003 % Chg Total PDX Flight Operations * 20,633 20,732-0.5% 241,236 245,333-1.7% Military 462 771-40.1% 6,974 7,884-11.5%
PORTLAND INTERNATIONAL AIRPORT (PDX)
") Monthly Traffic Report ch, 20 This Month Calendar Year to Date 20 20 %Chg 20 20 %Chg Total PDX Flight Operations * 22,218 21,304 4.3% 62,789 61,057 2.8% Military 474 564-16.0% 1,127 1,503-25.0% General
Monthly Traffic Report ch, 20 This Month Calendar Year to Date 20 20 %Chg 20 20 %Chg Total PDX Flight Operations * 22,218 21,304 4.3% 62,789 61,057 2.8% Military 474 564-16.0% 1,127 1,503-25.0% General
Quieter Skies Report. Partnership for. Fort Lauderdale-Hollywood International Airport. Prepared by: Broward County Aviation Department
 Fort Lauderdale-Hollywood International Airport Prepared by: Broward County Aviation Department June 2016 Partnership for Quieter Skies Report The Report provides an overview of progress of efforts to
Airport Noise Management Annual Report 2016
 Airport Noise Management Annual Report 2016 The Airport Noise Management Annual Report is a publication of the Airport Noise Management Office. This report provides an annual summary of Lambert- Louis
Quieter Skies Report. Partnership for. Fort Lauderdale-Hollywood International Airport. Prepared by: Broward County Aviation Department
 Fort Lauderdale-Hollywood International Airport Prepared by: May 2018 Partnership for Quieter Skies Report 1 The Partnership for Quieter Skies Report provides an overview of progress of efforts to reduce
r:\traffic\aviation Activity.xls CHARLOTTE DOUGLAS INTERNATIONAL AIRPORT AVIATION ACTIVITY FOR FEBRUARY 2005
 CHARLOTTE DOUGLAS INTERNATIONAL AIRPORT AVIATION ACTIVITY FOR FEBRUARY 2005 FEBRUARY FEBRUARY MTD % 2005 2004 YTD % 2005 2004 CHANGE TO DATE TO DATE CHANGE AIRCRAFT OPERATIONS Air Carrier 19,014 16,796