Large herbivore population estimates for Thanda Private Game Reserve and Mduna Royal Reserve. September
|
|
|
- Eleanor Hancock
- 5 years ago
- Views:
Transcription


1 Large herbivore population estimates for Thanda Private Game Reserve and Mduna Royal Reserve September
2 Large herbivore population estimates for Thanda Private Game Reserve and Mduna Royal Reserve September 2012 W. S. Matthews (Space for Elephants) November 2012 Contents I. INTRODUCTION... 2 II. III. IV. METHODS... 2 Total Aerial Count...2 Distance Sampling...3 RESULTS... 4 Known Group Estimates...5 BEST ESTIMATE OF NUMBERS...6 DRIVE COUNTS V. HABITAT ASSOCIATION VI. VII. COMPARISON WITH PREVIOUS COUNTS CONTRACEPTION PROGRAM VIII. CONCLUSIONS IX. RECOMMENDATIONS REFERENCES APPENDIX 1. DISTRIBUTION MAPS OF SIGHTINGS OF THE MOST PROMINENT LARGE HERBIVORES SEEN DURING THE THANDA PRIVATE GAME RESERVE AND MDUNA ROYAL RESERVE, SEPTEMBER 2012 CENSUS
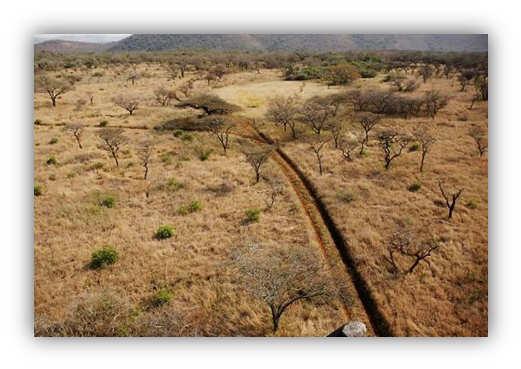
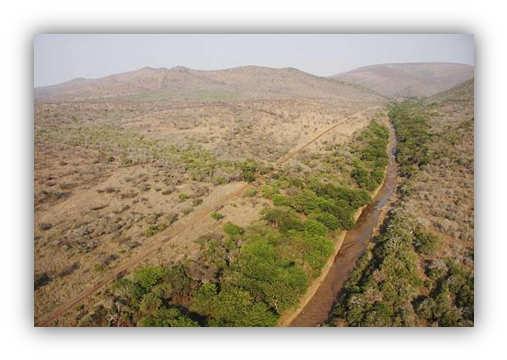
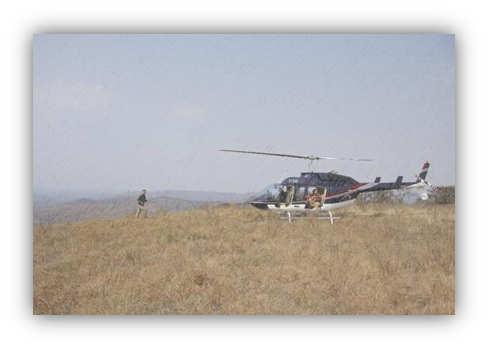
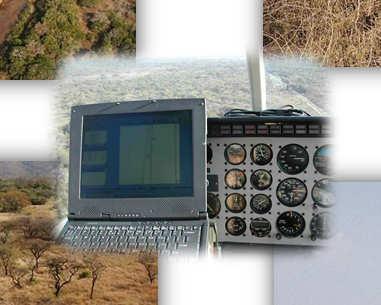
3 I. INTRODUCTION This is the first Distance sampling based census undertaken for the most common large herbivores occurring in Thanda Private Game Reserve and Mduna Royal Reserve. The aerial census was undertaken during the beginning of September 2012, early in the season but substantial rain had fallen the preceding days before count. The overall aim of the census was to derive trends and estimates of the most common large herbivore populations in Thanda Private Game Reserve and Mduna Royal Reserve, which would be useful for management decisions and would stand as a record of abundance for future trend analyses. In addition, the survey undertaken aims to record the spatial distribution of the most important herbivores so as to gain a better sense of their habitat associations, but also to gain an understanding of the relative abundance of these herbivores related to the landscape in the Thanda Private Game Reserve and Mduna Royal Reserve. This census is based on the work undertaken in Tembe Elephant Park and Munyawana Game Reserve (Matthews 1994; Matthews 2000; Matthews 2011). The methods used; were the similar as those used in 2000, which were a refined and improved version of those used in Three methods were used to estimate numbers for each of the large herbivore populations. These were (i) total area aerial counts; (ii) transect distance sampling counts; (iii) population estimates based on the numbers of known groups such as black and white rhino. The known group estimates were derived from information gathered and reported on by reserve staff as well as other proficient people. The transect aerial census was undertaken by Tristan Parsons (pilot), Wayne Matthews (co-ordinator and recorder) with Alwyn Wentzel and Mariana Venter (observers). Thanks also go to Trish Parson of Parson s Aviation for the co-ordination of the helicopter, Digs Pascoe - Space for Elephants, staff of Thanda Private Game Reserve and specifically Alwyn Wentzel for logistical support. Thanks also to Bruce Page, Horace Olivier, Mike Toft and Mariana Venter for data ratification and general info checking. II. METHODS Aerial l Counts Total Aerial Count 1. A helicopter containing a set crew four people, pilot and recorder (front) and observers (back) was flown on pre-determined, parallel east west orientated transects arranged systematically to cover the whole census area. This resulted in 19 transects, totalling 172 km s. 2. The helicopter was flown at approximately 80 m (260 ft) above the ground and at an air speed of approximately kts. Transects were flown, for periods of up to a maximum of 2.5 hrs. at a time, this resulted in two survey sessions as depicted in Figure 1. The hottest part of the day was avoided as far as possible, as animals tended to rest under shade in the heat of the day and as a consequence are more difficult to spot. 3. Devices were fitted to both sides of the helicopter which, when flying at a height of 80m, demarcated a predetermined distance on each side of the helicopter. All individuals sighted of all large herbivore species were recorded in this belt (transect). 4. Where large groups of eg. rhino, giraffe were spotted, the helicopter deviated from the traverse line, a total count of the group was undertaken, captured and then returned to continue the count from the point of departure, this took place 28 times. 5. All data was captured on a notebook computer using Cartalinx v 1.1 (Clark Labs, Clark University, 1999) which, when connected to the on-board GPS allowed the simultaneous collection of flight path information, animal numbers (as way points) and the number of the transect being traversed. 6. Plotting of distributions by species was done by importing the Cartalinx data into Quantum GIS 1.7.4, these in cases where the number of sightings and their distribution allowed visualisation

4 Figure 1.Census flight path for the transects for the game census. (*insert gives profile of longest transect altitude change of ~ 500m[highest point 670m and lowest 145m Distance Sampling 1. Data were collected for the distance sampling analysis at the same time as for the total count. 2. Devices were fitted to both sides of the helicopter which, when flying at a height of 80m, demarcated distance classes on each side of the traverse (transect) line. Whenever an individual or group of individuals were observed they were recorded as occurring in one of the distance sectors. 3. Animal observations recorded during the aerial census were edited and then exported directly to Distance 6 from the Microsoft Access database constructed whilst entering the data using Cartalinx. Where the number of observations allowed, density along each transect, and from this population size, was estimated using the statistical routines in Distance 6 release 2 (Thomas et al. 2009). 4. A statistically robust estimate can only be derived for species within the region of 60 sightings. Although species having less than 60 observations were analysed with Distance, these estimates should not be considered reliable (in all instances, the confidence intervals indicate this), but rather as best estimates of population size in species that have been under sampled
5 Figure 2. Weather conditions for the game census (Temperature; relative humidity; Wind speed). III. RESULTS Aerial Counts A complete aerial survey of the entire reserve took up one day to complete, taking approximately six hours. This was done in two sessions so as to allow for refuelling and breaks periods. The complete survey was not repeated. Conditions during the census were fair (figure 2). The weather was dominated by partly cloudy to cloudy, generally calm to windy (up to 15 k/h winds) conditions. The woody plant leaf flush was only partially developed, and game visibility conditions were good to very good. The count took place on the onset of a week of heavy rains in region. The altitudinal aspects of the reserve added complications to distance judgments and retaining height by the helicopter. Total Aerial Count and Distance Analysis The large herbivore population estimates from distance sampling is shown in Table 1. The distribution of sightings for the larger abundant and more important species is presented in Appendix 1. With respect to distance sampling impala, nyala, warthog and in some way giraffe, kudu, wildebeest, zebra had useable sightings or close to 60 or more sightings, and could therefore be analysed with distance (Table 1). The number of groups and the total number of animals physically counted in Thanda Private Game Reserve and Mduna Royal Reserve for 2012 are summarised in Table 7 and the introductions; predator management / removals / mortalities for the years 2011 & 2012 are summarised in Table 5 &
6 Table 1. 1 Large herbivore population estimates from distance sampling for Thanda Private Game Reserve and Mduna Royal Reserve Species Known Group Estimates Aerial Distance sampling estimates for 2012 Probability of detection index Rep1 95% C # (Cv) * Unreliable. # Probability of detection; the probability of recording an object (individual or cluster) in the surveyed area. (Cv - coefficient of variation of estimate [higher values more variation]). The known group estimates for black rhino is N/A, this based on the Thanda s rhino monitoring system. The number of black rhino seen from the air during the game census totalled N/A groups. The known group estimates for white rhino is N/A, this based on the Thanda s rhino monitoring system. The number of white rhino seen from the air during the game census totalled N/A groups. The known group estimates for lion is 17, this based on the Thanda s intensive monitoring system. The number of lion seen from the air during the game census totalled 9 in 2 groups. The population of buffalo was estimated at 110; based on total count refined by photographic counts and Thanda s ground monitoring system. A total of one herd was recorded, totalling 101 animals of which 6 could be classified as sub-adults and juveniles [6% of breeding population]; see Table 2. There was no lone bull groups recorded. Comparing the past count, the population seems to very similar although on the increase (Figure 5). Table 2. Summary of 2012 buffalo data, from aerial sightings, matched with photograph counts. (*- count based on best reliable photograph examined; # photo used but not totally reliable; shaded record refers to double count) Final Total Bulls Family Sub-adults & Usable Total Count group Unclassified incl Photo juv y % of fam. TOTAL % of fam. TOTAL Effective transect width (m) 1 Bushbuck * Bushpig n/a Giraffe 128* / 35% 1 (0.14) 288 Grey Duiker n/a Impala / 29% 1 (0.09) 288 Kudu 163 * / 35% 0.92 (0.17) 265 Nyala / 31% 0.60 (0.1) 119 Red Duiker n/a Reedbuck n/a Mt. Reedbuck n/a Rhino/Black n/a Rhino/White n/a Steenbok n/a Warthog / 27% 1 (0.12) 288 Waterbuck * Wildebeest 254* / 32% 1 (0.12) 288 Zebra 260* / 25% 1 (0.11) Effective transect width as determined by the Distance analysis - 5 -
7 Elephant The known group estimates for elephant is 36, this based on Thanda s ground monitoring and 2012 aerial survey. The number of elephant seen from the air during the game census totalled 33 in 3 groups. The highest number of different family units (groups) observed this year during count was 2; during contraception program 2 family units were encountered. The Maximum number of animals recorded in family groups, was 33 compared to 1 free roaming bull. Based on contraception info there would be adult females. Summary of elephant data can be seen in table 3. The distribution of the elephant sightings is shown in Appendix Figure 20. Table 3. Summary of elephant data from contraception program and elephant sightings from October 2007 survey (Max* - refers to max number from all estimates); [% - refers to percentage of the total population composition; - refers to number of adult female contracepted; *Ayahamba Nathi Environmental Technologies report, Thanda section only]. Count Free Family Sub-adults Young Family Total roaming group & (<1-2 yrs) units Bulls Total Unclassified Count Contraception (13/15 ) Photos - ID Kits Local knowledge Max % 5% 91% 13% 77% Past counts 2011* Best Estimate of o f Numbers Acceptable estimates (Table 4) for 8 species namely; wildebeest, zebra, giraffe, impala, kudu, nyala, warthog and rhino. The counts for most species, taking removals and introductions into consideration. For Distance sampling; some species, the numbers of sightings for a single repetition were marginal for a confident result, but some were analysed so as to get some indication of possible population sizes. Sample based estimates were made for six species namely, impala, nyala, kudu, warthog and zebra, wildebeest in some way. The final estimate used was based on the number of observations, best confidence levels, also taking into consideration Probability of detection, observer fatigue for the different repetitions sessions and transect data sets sighting levels. The population estimate of impala was 1057 ( ) based on 54 observations (has an acceptable confidence interval; Table 1). The distribution of impala is shown in Appendix Figure 11; they are spread throughout most of reserve except for the high lying areas. With a definite trend for smaller groups in Thanda section (Table 9). The population estimated of nyala was 300 ( ) from 49 observations, but when compared to past estimates, it possibly lower than what could be expected. Considering removals/culling figures (Tables 4 & 5), the overall trends could very well be an indication of a decline, supported by the trend of predator management / baits used trends on decline for this species. The distribution (Appendix Figure 12) of nyala is spread throughout, although the bulk of sightings coming from Thanda main (table 9). The population estimate for kudu was 160 (82 327) and was based on a sample size of 21 observations, below what is required for reliable statistical estimation and as also reflected by confidence value. The distribution of kudu is shown in Appendix Figure 13; sightings seem to be spread though out reserve with a definite trend for bigger groups in Mduna section (Table 9). The giraffe population was estimated at 84 from 26 observations; it was considered that the total count was relatively reliable. The distribution of giraffe is shown in Appendix Figure 14, and with - 6 -
8 bulk of sightings coming from Thanda main, although number wise an even split (table 9), as again a trend of smaller groups on Thanda main. The warthog population is estimated at 110 (63 191), this was determined from 35 observations, (has relatively good Distance confidence intervals - though below min sightings needed for a reliable distance estimate). This can be considered a reasonable estimate. The distribution (Appendix Figure 15) of warthog was widely spread throughout most of reserve except for the high lying areas, and a distinct prevalence in the link area between Thanda main and Mduna. The wildebeest population is estimated at 254 ( ), which was determined from 32 observations, below what is required for reliable statistical estimation and as also reflected by confidence value. As with giraffe, wildebeest are also found in the more open areas [probability of detection=1], and thus the possibility exists that the statistical result could be bias, because of this, it was felt to lean on the side of caution with the estimate and not possibly overestimate the population size. The distribution of wildebeest is shown in Appendix Figure 16, was widely spread, with concentrations in central areas of the Reserve and, locally absent from the high lying areas Northern Zululand Sourveld. Again, a distinct trend of smaller groups on Thanda main (Table 9). Table 4. 4 Final estimates for Thanda Private Game Reserve and Mduna Royal Reserve Estimation Method: 1 Known Group, 2 Total Area Count, 3 Distance Sample, 4 Informed Guess, 5 Field encounter rates, 6-Informed guess based on past estimates, 7-based on photograph count. (* unreliable; ~ approximate) Total Count Distance Sample Known Final Estimate Group Bushbuck 8 8 Buffalo 99 /101 7 ~110 ~110 Giraffe / 35% 84 2 Elephant Grey Duiker D 7 7 Red Duiker 3 3 Impala / 29% 1057 Kudu / 35% 160 Nyala / 31% 300 Reedbuck Mt. Reedbuck 1 1 Warthog / 27% 110 Waterbuck Wildebeest / 32% 254 Zebra / 25% 260 Rhino/Black Rhino/White Hyena 1 1 B B jackal 1 1 Leopard - 1 Lion Cheetah Wilddog The zebra population is estimated at 260( ), which was from 39 observations, (has a relatively good Distance confidence interval - the best of all species analysed even though below min sightings needed for a reliable distance estimate). Also, similar to wildebeest, found associated with the more open areas [probability of detection=1]. The distribution of zebra is reasonably wide spread throughout the Reserve (Appendix Figure 18), similar patterns to wildebeest, again locally absent from the high lying areas Northern Zululand Sourveld. Again, a distinct trend of smaller groups on Thanda main (Table 9)
, with only one sighting of mountain reedbuck, as could be expected coming from the tops of the hills of the Mduna section.")
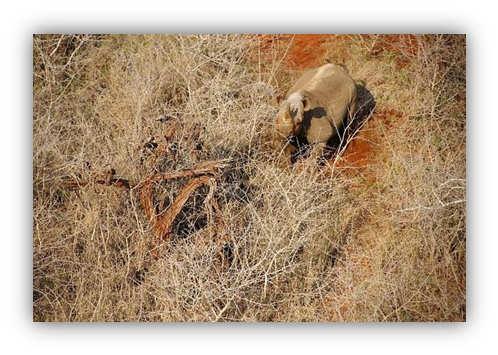
9 The population size of reedbuck was estimated at 13 from a sample of 8 sightings, below what is required for reliable statistical estimation. All of the reedbuck was found in the Mduna section(figure 17), with only one sighting of mountain reedbuck, as could be expected coming from the tops of the hills of the Mduna section. The sightings of red duiker and other of the smaller antelope species (eg. grey duiker, bushbuck) would be low as a result of counting technique, this was expected, a result of higher flying levels and broader transects. The true population size of these smaller discreet species could be much larger. The distribution the few sightings of these species can be seen in Appendix Figure 9. Predator management and predator related mortalities were a major component of the recorded mortalities for the reserve (Figure3; table 6). Based on the reserves mortality/carcass monitoring; predator related mortalities were in fact responsible for more than 80% of all recorded mortalities over a three year period. Table 5. Introductions records for Thanda Private Game Reserve and Mduna Royal Reserve Species Total Giraffe Kudu Nyala 13 Impala Wildebeest 26 Black rhino * White rhino * Zebra 19 # White rhino introduced into Mduna Royal * - Best info at time of completion of report Pred. Baits Culling Mort. Removal # Figure 3. Summary of Removals, mortalities and predator management trends for Thanda Private Game Reserve and Mduna Royal Reserve, for 2010 to
10 Table 6. Removals, mortalities and predator management records for Thanda Private Game Reserve and Mduna Royal Reserve. (- No mortality records; # denotes live capture; * - poached.) Total for past Species Removal Mort. Culling Baits Pred. Total Removal Mort. Culling Baits Pred Total Removal Mort. Culling Baits Pred Total 3 years # etc # etc # etc Bushbuck - Buffalo Bushpig - Porcupine Giraffe Grey Duiker Red Duiker 1* Kudu Steenbok Impala 2* * Nyala 1* * Reedbuck Mt Reedbuck - Warthog * Waterbuck - Wildebeest Zebra Rhino/Black 1 1 1* 1 2 Rhino/White * lion 1* 1 1* 1 2 Wildog 2 2 2* 2 4 Leopard - Hyena 2* Total
11 Table 7. Summary of large herbivore total counts (minimum number), for Thanda Private Game Reserve and Mduna Royal Reserve (2012 count based on a new systematic flight grid made up of 18 transects). {red lower; green higher than preceding year s count}; * Correction based on photo analysis. # Refers Max of No counted / sightings. Species Black rhino Road Census Thanda main No. No. Groups Counted Road Census Thanda main No. No. Groups Counted Road Census Thanda main No. No. Groups Counted Road Census Thanda main No. No. Groups Counted Road Census 2011 Thanda main #No. #No. Groups Counted Aerial Census 2012 Thanda main Aerial Census 2012 Thanda - Mduna No. No. % 2 No. No. Groups Counted Groups Counted Buffalo Bushbuck Bushpig C Reedbuck M Reedbuck Elephant Giraffe Grey Duiker Impala Kudu Nyala Red Duiker Steenbuck Warthog Waterbuck White rhino Wildebeest Zebra Cheetah Lion jackal Wild dog Hyena Leopard % that Thanda main plays to overall Total
12 Table 8. Summary of large herbivore estimates, for Thanda Private Game Reserve and Mduna Royal Reserve (2012 count based on a new systematic flight grid made up of 18 transects). (* unreliable; ~ approximate) Road Census Road Census Road Census Road Census Road Census estimate estimate estimate estimate estimate 2011 Thanda main Thanda main Thanda main Thanda main Thanda main Aerial Census estimate 2012 Thanda main 3 Aerial Census estimate 2012 Thanda / Mduna Black rhino Buffalo Bushbuck >1* >4 Bushpig C Reedbuck >1* >13 M Reedbuck >1 Elephant Giraffe Grey Duiker >2* >7 Impala Kudu Nyala * 300* Red Duiker >1* >3 Steenbuck >1* >1 Warthog Waterbuck >21 White rhino Wildebeest Zebra Cheetah Lion jackal Wild dog Hyena Leopard Based on percentage ration between the 2 sections see Table


13 Table 9. Summary of 2012 survey data, from aerial sightings, showing break down of the two sections IV. Drive counts Figure 4. Map showing road drive routes used in a portion of Thanda Game Reserve (Full layout of road drives not available presently)

14 In May 2012, a rotation of five drive routes where initiated to collect game sighting data which could be used to assess game abundances, structures and trends over the seasons. To-date each drive has been repeated between 4 6 times. Only one drive route is currently present on Mduna section, which has resulted in a low effort in this area. The summery of the results of this data collection, which took place from May to September 2012, is presented in Tables 10 & 11. In undertaking this drive count, a total distance covered was km; and the total time spent on the drivers was approximately 28.7 hours. Species overall encounter rates (indication of abundance levels), show similar patterns to the overall aerial survey results and even though the effort was less on the Mduna section, the encounter rate of animals is very similar to Thanda section (table 10). With continued repeats of drive counts more rigorous interrogation of data can be undertaken. Table 10. Summary of 2012 drive count survey data, presenting break down of the two sections. [Sighting index (#/km) gives an indication of sightings per unit effort] Table 11. Summary of sex ratios of species based on 2012 drive count data. Adult males % Adult female % Unidentified Adults % Yearling % Bushbuck 1 25% 3 75% 1 25% Buffalo 3 Giraffe 42 66% 17 27% 5 7.8% 3 5% Impala 80 13% % % 14 2% Kudu 14 22% 51 78% 3 5% Nyala 63 41% 89 59% 8 5% Waterbuck 3 43% 3 43% % Warthog 6 12% 15 29% % 4 8% Wildebeest 60 31% 75 39% % 9 5% Zebra 23 16% 48 33% % 1 1%

15 V. Habitat Association The habitat association trends for the survey results of 2012, was not undertaken at present, as there is only one year s data. Only, possibly, one broad association to a veldtype can be made; and that was that many species were found locally absent in the high lying areas Northern Zululand Sourveld. More reliable selection association / indices will emerge with continued surveys, collecting this type of information. VI. Comparison With Previous Counts Total Numbers Trends The species estimate trend / total count trends for most species from 2003 to 2012 are graphically represented in Figures 5, 6 & 7. As this is the first year of collated data, confident interpretations of long-term trends at this stage are of partial value. Taking the introductions, predator management and removals/mortalities into consideration, most species showing a decrease or stable trend; reedbuck reaching low levels after a long continued downward trend; while only buffalo and elephant showing an expected increase on the estimates. Wildebeest and Zebra showed a significant higher than expected estimate for 2011, but this may not be a real in numbers increase but a result of an artefact of the 2011 counting conditions; this will only become clear when repeat surveys are undertaken. This decrease can partly be ascribed to a combination of factors namely (i) a real decrease in numbers and (ii) counting technique and (iii) visibility/vegetation cover. This year s decrease may be a real change in numbers; a result of management interventions (eg predators/ management) and the precision of past estimates /data and in part an artefact of the 2012 counting technique. Follow up surveys results should make this clear GIRAFFE C. REEDBUCK WILDEBEEST ZEBRA BUFFALO Number Year * Figure 5. Summary of selected large herbivore, of more visible species (where probability of detection ~1), estimates trends for 2001 to

16 70 60 ELEPHANT KUDU WATERBUCK 50 Number Year * Figure 6. Summary of selected, relative lower abundance, herbivores estimates trends for 2001 to Number * IMPALA NYALA WARTHOG Figure 7. Summary of nyala, impala and warthog estimate trends for 2001 to VII. Contraception program The total number of family units found, number of young and adult females darted during the two contraception operations is shown in Table 2. No information on adult bulls or group sizes were gained from this operation. During the operation no count of animals was attempted. Table 12. Summary of September and November 2012 operation, breeding groups found and darted. Total animals Females Juvenile Young Sub-adults Group Date in group Darted (<1-2 2 yrs) (2<4 yrs) & Time [contracepted] Unclassified Notes 1 14 Sep Mduna 2 14 Sep Thanda Total 13 1hr 9 16 Nov Mduna Nov Thanda Total hr

17 Figure 8. The inception elephant contraception program of 2012; Vet Dr Mike Toft Field loading of marker darts with vaccine. VIII. Conclusions Census conditions were on the whole acceptable. The two methods employed namely, total area counts and distance based sample estimates, produced defendable population estimates. Most species count results did not show the expected increasing trends, when comparing introductions and mortalities numbers. Predator management and predator related mortalities were a major component of recorded mortalities. Predator related mortalities were >80% of all recorded mortalities over a three year period. Many species, like impala, wildebeest showed a strong tendency on Thanda main, to be found in smallish groups, below what would be the expected average clustering size. This was not the case for the Thanda linkage area or Mduna. Wildebeest and Zebra showed a significant lower than expected estimate, based on 2011 result, but this may a result of an artefact of the 2011 counting conditions, this will only become clear when repeat surveys are undertaken. The sightings of the smaller antelope species will be low as a result of counting technique. More confident estimates will be produced if distance sampling counts continue. Drive counts have potential to generate an effective database from which overall monitoring over time can be used for management decision, but effort needs to be increased, overall and specifically in the Mduna section. IX. Recommendations It was felt that the 2012 census effort was a success, although some recommendations can be made and should be incorporated into the follow-up census programs. 1. It would be meaningful for Thanda Private Game Reserve and Mduna Royal Reserve, that followup census are undertaken using the methods described and reported on here. 2. Try to complete census at a flight speed of around 30kts, taking topography and wind into consideration. 3. Comparative analyses of the trends of the more important species should continue to be undertaken so as to have long-term defendable trends, especially in the case of impala, nyala, warthog, wildebeest, zebra and reedbuck

18 4. Predator impact / management needs to be evaluated, in terms of effect it may be having on prey base. Carcass monitoring and categorization needs to be treated as key information. 5. Drive counts effort needs to be increased so that a more rigorous interrogation of data can be undertaken. 6. Other counts to supplement count for smaller herbivores, such as bushbuck and grey duiker. 7. Reserve data; an overall increased in thoroughness of data consistency of collection and recording is required. Reserve data evaluation and archival needs to be more rigorous and consistent. References Matthews, W.S Aerial surveys for Tembe elephant Park. Winter KwaZulu Department of nature conservation unpublished report. Matthews, W.S Large herbivore population estimates for Tembe Elephant Park: October KwaZulu- Natal Nature Conservation Services unpublished report Matthews, W.S Large herbivore population estimates for Munyawana Game Reserve. September WSM Eco Services, Nelspruit; unpublished report Thomas L., Laake, J.L., Rexstad, E., Strindberg, S., Marques, F.F.C., Buckland, S.T., Borchers, D.L., Anderson, D.R., Burnham, K.P., Burt, M.L., Hedley, S.L., Pollard, J.H., Bishop, J.R.B. and Marques, T.A Distance 6.0. Release 2. Research Unit for Wildlife Population Assessment, University of St. Andrews, UK. Van Rooyen, N Habitat evaluation, vegetation and wildlife management of THANDA and MDUNA. Part 1: Vegetation. Unpublished Report. Ekotrust CC
19 Appendix 1. Distribution Maps of sightings of the most prominent large herbivores seen during the Thanda Private Game Reserve and Mduna Royal Reserve,, September 2012 census. 4 (The symbol size is an indication of group size). Figure 9. Distribution and group sizes of the low frequency species such bushbuck (Black) red duiker (red arrows with green) and grey duiker(red arrows with grey). 4 Map background represents vegetation types as distinguished by Van Rooyen
20 Figure 10. Distribution of. Figure 11. Distribution and herd sizes of impala
21 Figure 12. Distribution and group sizes of nyala Figure 13. Distribution and group sizes of kudu

22 Figure 14. Distribution and group sizes of Giraffe. Figure 15. Distribution and group sizes of warthog
23 Figure 16. Distribution and group sizes of wildebeest. Figure 17. Distribution and group sizes of reedbuck
24 Figure Distribution and group sizes of zebra. Figure Distribution of predator sightings
25 Figure. 20. Distribution of elephant sightings
REPORT ON THE AERIAL GAME CENSUS OF THE NORTHERN TULI GAME RESERVE, BOTSWANA. Compiled by J. Selier Mashatu Game Reserve August 2008.
 REPORT ON THE AERIAL GAME CENSUS OF THE NORTHERN TULI GAME RESERVE, BOTSWANA Compiled by J. Selier Mashatu Game Reserve August 2008 Introduction No form of wildlife management whether it is the establishment
Aerial wildlife count of the Parque Nacional da Gorongosa, Mozambique, October 2016 Approach, results and discussion
 Aerial wildlife count of the Parque Nacional da Gorongosa, Mozambique, October 2016 Approach, results and discussion Dr Marc Stalmans & Dr Mike Peel November 2016 Table of contents Summary 3 1. Survey
BOTSWANA ENVIRONMENT STATISTICS: WILDLIFE DIGEST 2014
 Published by Statistics Botswana Private Bag 0024, Gaborone Phone: 3671300 Email: info@statsbots.org.bw BOTSWANA ENVIRONMENT STATISTICS: WILDLIFE DIGEST 2014 Contact Unit: Environment Statistics Unit Phone:
Aerial wildlife count of the Parque Nacional da Gorongosa, Mozambique, October 2018
 Aerial wildlife count of the Parque Nacional da Gorongosa, Mozambique, October 2018 Dr Marc Stalmans, Dr Mike Peel & Dominique Gonçalves November 2018 Our milestones For the first time ever, more than
HOTFIRE WILDLIFE MANAGEMENT MODEL A CASE STUDY
 1 HOTFIRE WILDLIFE MANAGEMENT MODEL A CASE STUDY Sub-theme: Economics / business venture, livelihood strategies Format: Poster Bruce Fletcher Hotfire Hunting and Fishing Safaris P O Box 11 Cathcart 5310
Parque Nacional do Limpopo AERIAL WILDLIFE CENSUS
 2013 Parque Nacional do Limpopo AERIAL WILDLIFE CENSUS Alan Stephenson Wildlife Management Services Index Introduction.2 Methodology. 2 Results 5 Maps 6 Discussion & Comments.. 38 Acknowledgements 50 References
Six Day Program Serengeti, NgoroNgoro, Lake Manyara
 Six Day Program Serengeti, NgoroNgoro, Lake Manyara When it comes to picking your next family holiday destination, Africa is the best destination. Nothing more incredible than heading out on safari together
AURORA WILDLIFE RESEARCH
 AURORA WILDLIFE RESEARCH Kim Poole 2305 Annable Rd. Nelson, BC, V1L 6K4 Canada Tel: (250) 825-4063; Fax: (250) 825-4073 e-mail: klpoole@shaw.ca 27 April 2005 Mike Gall Conservation Specialist and Glenn
Comparative Densities of Tigers (Panthera tigris tigris) between Tourism and Non Tourism Zone of Pench Tiger Reserve, Madhya Pradesh- A brief report
 between Tourism and Non Tourism Zone of Pench Tiger Reserve, Madhya Pradesh- A brief report") Comparative Densities of Tigers (Panthera tigris tigris) between Tourism and Non Tourism Zone of Pench Tiger Reserve, Madhya Pradesh- A brief report Submitted by Principal investigators Prof. (Dr.) K.
Comparative Densities of Tigers (Panthera tigris tigris) between Tourism and Non Tourism Zone of Pench Tiger Reserve, Madhya Pradesh- A brief report Submitted by Principal investigators Prof. (Dr.) K.
Aerial Classified Mountain Goat and Bighorn Sheep Count, Penticton Creek to Vaseux Creek, South Okanagan, March 2009.
 Aerial Classified Mountain Goat and Bighorn Sheep Count, Penticton Creek to Vaseux Creek, South Okanagan, March 2009. Prepared by: Les W. Gyug, R.P. Bio., Okanagan Wildlife Consulting, 3130 Ensign Way,
Appendix 15.2: Pasha Dere Beach Usage Survey
 Appendix 15.2: Pasha Dere Beach Usage Survey URS-EIA-REP-22375 Table of Contents 15.2 Pasha Dere Beach Usage Survey... 1 15.2.1 Introduction... 1 15.2.2 Beach Surveys... 1 15.2.2.1 Survey Dates, Times
WILDLIFE REPORT SINGITA LAMAI, TANZANIA For the month of October, Two Thousand and Fifteen
 WILDLIFE REPORT SINGITA LAMAI, TANZANIA For the month of October, Two Thousand and Fifteen Lions: October provided some great lion viewing. The guides accumulated 29 sightings over the month. With the
Preliminary report on the apex predators of Banhine National Park and the potential Limpopo-Banhine corridor
 Preliminary report on the apex predators of Banhine National Park and the potential Limpopo-Banhine corridor Leah Andresen, Kristoffer Everatt & Graham Kerley Centre for African Conservation Ecology Nelson
Snapshot Safari: A standardized
 Snapshot Safari: A standardized program for assessing population and behavioral dynamics of large mammals Craig Packer, Meredith Palmer & Sarah Huebner Department EEB, University of Minnesota & School
HEATHROW COMMUNITY NOISE FORUM
 HEATHROW COMMUNITY NOISE FORUM 3Villages flight path analysis report January 216 1 Contents 1. Executive summary 2. Introduction 3. Evolution of traffic from 25 to 215 4. Easterly departures 5. Westerly
Day 1: NAIROBI / AMBOSELI
 Day 1: NAIROBI / AMBOSELI This morning, you are met by a CATS Africa representative for meet and greet. After a short briefing on your safari depart with the professional driver/guide for the drive south
UPDATE ON CENTRAL KALAHARI GAME RESERVE BLUE WILDEBEEST STUDY
 UPDATE ON CENTRAL KALAHARI GAME RESERVE BLUE WILDEBEEST STUDY Moses Selebatso 2 Brief Introduction The CKGR wildebeest study is part of the CKGR Predator Prey Project which aims at developing an understanding
Economic Impact of Tourism. Cambridgeshire 2010 Results
 Economic Impact of Tourism Cambridgeshire 2010 Results Produced by: Tourism South East Research Department 40 Chamberlayne Road, Eastleigh, Hampshire, SO50 5JH sjarques@tourismse.com http://www.tourismsoutheast.com
The Economic Impact of Tourism Brighton & Hove Prepared by: Tourism South East Research Unit 40 Chamberlayne Road Eastleigh Hampshire SO50 5JH
 The Economic Impact of Tourism Brighton & Hove 2013 Prepared by: Tourism South East Research Unit 40 Chamberlayne Road Eastleigh Hampshire SO50 5JH CONTENTS 1. Summary of Results 1 1.1 Introduction 1 1.2
2000 SOUTHERN EAST KOOTENAY GOAT AERIAL SURVEY
 COLUMBIA BASIN FISH & WILDLIFE COMPENSATION PROGRAM 2000 SOUTHERN EAST KOOTENAY GOAT AERIAL SURVEY PREPARED BY Robert Halko, P.Ag., Keith Hebert FOR Columbia Basin Fish & Wildlife Compensation Program
Aboriginal and Torres Strait Islander Life Expectancy and Mortality Trend Reporting
 Aboriginal and Torres Strait Islander Life Expectancy and Mortality Trend Reporting Technical Report December 2015 Amended May 2016 Authors: Clare Coleman, Nicola Fortune, Vanessa Lee, Kalinda Griffiths,
Baseline results of the 5 th Wild Dog & 3 rd Cheetah Photographic Census of Greater Kruger National Park
 Baseline results of the 5 th Wild Dog & 3 rd Cheetah Photographic Census of Greater Kruger National Park H. T. Davies-Mostert 1, M. Burger 1, M.G.L. Mills 2, M. Somers 3, M. Hofmeyr 4 & S. Ferreira 5 1
AERIAL SURVEY OF WILDLIFE IN THE NIASSA RESERVE AND ADJACENT AREAS Mozambique, October 2009
 AERIAL SURVEY OF WILDLIFE IN THE NIASSA RESERVE AND ADJACENT AREAS Mozambique, October 2009 Prepared for Sociedade para a Gestão e Desenvolvimento da Reserva do Niassa Moçambique By G C Craig DG Ecological
MEMEL MAY - AUGUST 2017 MEMEL MAXIMUM HUNTERS TYPE HUNT PACKAGE RULES LOT NO: PACKAGE PLACE DATE 1 X SPRINGBUCK
 ERS 1 X SPRINGBUCK 1 1 X BLACK WILDEBEEST 2 NIGHT ACCOMMODATION, PH MEMEL 4 AND SKINNER 2 NIGHTS ACCOMMODATION PH & SKINNER 2 1 X COMMON BLESBUCK 2 X SPRINGBUCK 2 NIGHT ACCOMMODATION, PH, VEHICLE AND SKINNER.
2009 Clearwater Area Sheep
 2009 Clearwater Area Sheep Section Authors: Chiarastella Feder and Shevenell Webb Suggested Citation: Feder, C. and S. Webb. 2009. Clearwater Area Sheep. Pages 22 25. In: N. Webb and R. Anderson. Delegated
12 NIGHT/13 DAY FAMILY SAFARI NORTHERN TANZANIA
 12 NIGHT/13 DAY FAMILY SAFARI NORTHERN TANZANIA Day One - Lake Manyara On arrival into Kilimanjaro you are met and transferred directly to Lake Manyara National Park. Located 125 km west of Arusha town,
Giraffe abundance and demography in relation to food supply, predation and poaching
 Giraffe abundance and demography in relation to food supply, predation and poaching Megan Strauss PhD Candidate, Ecology, Evolution & Behavior Graduate Program University of Minnesota www.serengetigiraffeproject.org
CONGESTION MONITORING THE NEW ZEALAND EXPERIENCE. By Mike Curran, Manager Strategic Policy, Transit New Zealand
 CONGESTION MONITORING THE NEW ZEALAND EXPERIENCE 26 th Australasian Transport Research Forum Wellington New Zealand 1-3 October 2003 By, Manager Strategic Policy, Transit New Zealand Abstract New Zealand
Access 2 Africa Safaris
 Access 2 Africa Safaris P.O. Box 159 Hluhluwe 3960 Kwa-Zulu Natal Tel: (+27) 842642104 Email: info@access2africasafaris.co.za www.access2africasafaris.coza 7 DAY SAFARI AND TOUR DAY 1 A warm welcome awaits
Accounting for the water use by wildlife in Botswana
 Accounting for the water use by wildlife in Botswana Paper for the 22 nd Meeting of the London Group on Environmental Accounting Oslo, Norway 2830 September 2016 Michael Vardon 1, Ogopotse Batlokwa Pule
Aboriginal and Torres Strait Islander Life Expectancy and Mortality Trend Reporting to 2014
 Aboriginal and Torres Strait Islander Life Expectancy and Mortality Trend Reporting to 2014 Technical Report June 2016 Authors: Clare Coleman, Nicola Fortune, Vanessa Lee, Kalinda Griffiths, Richard Madden
Biol (Fig 6.13 Begon et al) Logistic growth in wildebeest population
 Logistic growth in wildebeest population") Biol 303 1 Interspecific Competition Outline Intraspecific competition = density dependence Intraspecific and interspecific competition Limiting resources Interference vs exploitation Effects on population
Biol 303 1 Interspecific Competition Outline Intraspecific competition = density dependence Intraspecific and interspecific competition Limiting resources Interference vs exploitation Effects on population
Sizing up Australia s eastern Grey Nurse Shark population
 Image: David Harasti A new estimate of adult population size for Australia s eastern Grey Nurse Shark drew on widespread genetic sampling and forensic exploration of family trees. Grey Nurse Sharks are
CITY OF LYNDEN STORMWATER MANAGEMENT PROGRAM REPORT MARCH 1, 2016
 CITY OF LYNDEN STORMWATER MANAGEMENT PROGRAM 2015 WATER QUALITY MONITORING REPORT CITY OF LYNDEN 300 4 TH STREET LYNDEN, WASHINGTON 98264 PHONE (360) 354-3446 MARCH 1, 2016 This document serves as an attachment
KwaZulu Natal Surf Adventure
 KwaZulu Natal Surf Adventure Umhlanga - Maputaland Marine Protected Area - andbeyond Phinda Private Game Reserve 10 Days / 9 Nights Home to spectacular world heritage sites where you have the opportunity
Madikwe 3 Day Luxury Safari Highlights
 3 Day Madikwe Luxury Safari Tour Itinerary Madikwe 3 Day Luxury Safari Highlights Extensive guided game drives: Adventurous wild game viewing experience: Underground Hide / Waterhole: Private trail: Good
W H O W E A R E. W H A t t o e x p e c t.
 W H O W E A R E North Wild Veterinary and Wildlife offers an incredibly unique experience in the heart of the South African bush. Through the combination of conservation and wildlife veterinary practice
Produced by: Destination Research Sergi Jarques, Director
 Produced by: Destination Research Sergi Jarques, Director Economic Impact of Tourism Epping Forest - 2014 Economic Impact of Tourism Headline Figures Epping Forest - 2014 Total number of trips (day & staying)
MIGRATION. 09 August THEGREAT WILDLIFE PHOTOGRAPHY TOUR TO MAASAI MARA AND LAKE NAKURU. 5 Nights at Mara Triangle 2 Nights at Lake Nakuru
 P R E S E N T S 09 August THEGREAT MIGRATION WILDLIFE PHOTOGRAPHY TOUR TO MAASAI MARA AND LAKE NAKURU 2018 5 Nights at Mara Triangle 2 Nights at Lake Nakuru TM INTRODUCTION THE GREAT MIGRATION Each year
Wildlife Report. For the month of July, Two Thousand and Fourteen
 Singita Grumeti Sasakwa & Faru Faru Lodges Serengeti House & Sabora Tented Camp Explore Mobile Tented Camp Tanzania (Photo by Ryan Schmitt) Temperature and Wind Wildlife Report For the month of July, Two
Produced by: Destination Research Sergi Jarques, Director
 Produced by: Destination Research Sergi Jarques, Director Economic Impact of Tourism Oxfordshire - 2015 Economic Impact of Tourism Headline Figures Oxfordshire - 2015 Total number of trips (day & staying)
Recommendations for Northbound Aircraft Departure Concerns over South Minneapolis
 Recommendations for Northbound Aircraft Departure Concerns over South Minneapolis March 21, 2012 Noise Oversight Committee Agenda Item #4 Minneapolis Council Member John Quincy Background Summer of 2011
Cairns Airport Aircraft Noise Information Report
 Cairns Airport Aircraft Noise Information Report Quarter 4 2013 (October to December) 1 Version Control Version Number Detail Prepared by Date 1 - Environment February 2014 Airservices Australia. All rights
TARANGIRE NGORONGRO SERENGETI LAKE MANYARA
 Wildlife Safari Trip To Tanzania (8D / 7N, 16 23 APRIL 2015, Northern Circuit ) TARANGIRE NGORONGRO SERENGETI LAKE MANYARA AFRICA Join Pugmarks - The Nature Club for a Rendezvous with Wild life @ the Ultimate
TANZANIAN SECRETS. 8 nights Tarangire Ngorongoro Crater Serengeti. Price from: $6885 per person sharing
 TANZANIAN SECRETS 8 nights Tarangire Ngorongoro Crater Serengeti Price from: $6885 per person sharing A World of Wonders How else could we possibly describe this safari? A safari for the truest of safari
REVIEW OF GOLD COAST AIRPORT Noise Abatement Procedures
 REVIEW OF GOLD COAST AIRPORT Noise Abatement Procedures Introduction The purpose of this document is to present an overview of the findings of the review of the Noise Abatement Procedures (NAPs) in place
The Economic Impact of Tourism Eastbourne Prepared by: Tourism South East Research Unit 40 Chamberlayne Road Eastleigh Hampshire SO50 5JH
 The Economic Impact of Tourism Eastbourne 2016 Prepared by: Tourism South East Research Unit 40 Chamberlayne Road Eastleigh Hampshire SO50 5JH CONTENTS Page 1. Summary of Results 1 1.1 Introduction 1 1.2
Produced by: Destination Research Sergi Jarques, Director
 Produced by: Destination Research Sergi Jarques, Director Economic Impact of Tourism Norfolk - 2017 Contents Page Summary Results 2 Contextual analysis 4 Volume of Tourism 7 Staying Visitors - Accommodation
BOTSWANA CLASSIC SAFARI - WS 10 DAYS DRY SEASON (SAVUTI & OKAVANGO DELTA) JUNE TO OCTOBER 2018
 JUNE TO OCTOBER 2018") BOTSWANA CLASSIC SAFARI - WS 10 DAYS DRY SEASON (SAVUTI & OKAVANGO DELTA) JUNE TO OCTOBER 2018 Botswana, the southern African country where the remarkable inland haven of water - the Okavango Delta, flows
BOTSWANA CLASSIC SAFARI - WS 10 DAYS DRY SEASON (SAVUTI & OKAVANGO DELTA) JUNE TO OCTOBER 2018 Botswana, the southern African country where the remarkable inland haven of water - the Okavango Delta, flows
TABLE OF CONTENTS. TOURIST EXPENDITURE 31 Average Spend per Person per Night ( ) 31 Tourist Expenditure per Annum ( ) 32
 31 Tourist Expenditure per Annum ( ) 32") FALKLAND ISLANDS International Tourism Statistics Report 2013 2 3 4 TABLE OF CONTENTS PAGE INTRODUCTION 6 KEY FACTS AND FIGURES 7 INBOUND TOURISM (OVERNIGHT VISITORS) 8 TOURIST ARRIVALS 8 Tourist Arrivals
FALKLAND ISLANDS International Tourism Statistics Report 2013 2 3 4 TABLE OF CONTENTS PAGE INTRODUCTION 6 KEY FACTS AND FIGURES 7 INBOUND TOURISM (OVERNIGHT VISITORS) 8 TOURIST ARRIVALS 8 Tourist Arrivals
MAPPING UNSHELTERED HOMELESSNESS IN INDIANAPOLIS ISSUE C17-20 NOVEMBER 2017
 MAPPING UNSHELTERED HOMELESSNESS IN INDIANAPOLIS ISSUE C17-20 NOVEMBER 2017 AUTHOR Chris Holcomb, Graduate Student, School of Public and Environmental Affairs, IUPUI 334 N. Senate Avenue, Suite 300 Indianapolis,
Produced by: Destination Research Sergi Jarques, Director
 Produced by: Destination Research Sergi Jarques, Director Economic Impact of Tourism Oxfordshire - 2016 Economic Impact of Tourism Headline Figures Oxfordshire - 2016 number of trips (day & staying) 27,592,106
South Africa - Just Cats!
 Naturetrek Tour itinerary Outline itinerary Day 1 Day 2 Day 3/6 Day 7/10 Day 11 Day 12 Depart London. Blyde River Canyon. Kruger National Park. Sabi Sand Game Reserve. Depart Johannesburg. Arrive London.
Commissioned by: Economic Impact of Tourism. Stevenage Results. Produced by: Destination Research
 Commissioned by: Produced by: Destination Research www.destinationresearch.co.uk December 2016 Contents Page Introduction and Contextual Analysis 3 Headline Figures 5 Volume of Tourism 7 Staying Visitors
Produced by: Destination Research Sergi Jarques, Director
 Produced by: Destination Research Sergi Jarques, Director Economic Impact of Tourism North Norfolk District - 2016 Contents Page Summary Results 2 Contextual analysis 4 Volume of Tourism 7 Staying Visitors
Produced by: Destination Research Sergi Jarques, Director
 Produced by: Destination Research Sergi Jarques, Director Economic Impact of Tourism Norfolk - 2016 Contents Page Summary Results 2 Contextual analysis 4 Volume of Tourism 7 Staying Visitors - Accommodation
Economic Impact of Tourism. Hertfordshire Results. Commissioned by: Visit Herts. Produced by:
 Commissioned by: Visit Herts Produced by: Destination Research www.destinationresearch.co.uk December 2016 Contents Page Introduction and Contextual Analysis 3 Headline Figures 5 Volume of Tourism 7 Staying
Visit: Mt Kenya 1N Samburu 2N Sweetwaters 1N Lake Nakuru 1N Masai Mara 2N
 Kenyan safari 7N/8D Visit: Mt Kenya 1N Samburu 2N Sweetwaters 1N Lake Nakuru 1N Masai Mara 2N Sightseeing: Samburu National Reserve, Sweetwaters sanctuary, Lake Nakuru National Park, Masai Mara Game drive
HEATHROW COMMUNITY NOISE FORUM. Sunninghill flight path analysis report February 2016
 HEATHROW COMMUNITY NOISE FORUM Sunninghill flight path analysis report February 2016 1 Contents 1. Executive summary 2. Introduction 3. Evolution of traffic from 2005 to 2015 4. Easterly departures 5.
CONTACT DETAILS. Lodge Owners/Managers: Herman and Celeste Smit
 FACTSHEET CONTACT DETAILS Reservations: Nadine Ebrahim & Zeena Ponto Telephone: +27 (0) 21 4218433 E-mail: reservations@sundestinations.co.za Website: www.umkumbe.co.za Lodge Owners/Managers: Herman and
Building adaptation in the Melbourne CBD: The relationship between adaptation and building characteristics.
 Building adaptation in the Melbourne CBD: The relationship between adaptation and building characteristics. Sara J Wilkinson, Dr Kimberley James and Prof Richard Reed Deakin University - Melbourne Overview
The Economic Impact of Tourism Brighton & Hove Prepared by: Tourism South East Research Unit 40 Chamberlayne Road Eastleigh Hampshire SO50 5JH
 The Economic Impact of Tourism Brighton & Hove 2014 Prepared by: Tourism South East Research Unit 40 Chamberlayne Road Eastleigh Hampshire SO50 5JH CONTENTS 1. Summary of Results 1 1.1 Introduction 1 1.2
SAFETY HIGHLIGHTS CESSNA CITATION AOPA AIR SAFETY INSTITUTE 1 SAFETY HIGHLIGHTS CESSNA CITATION
 SAFETY HIGHLIGHTS CESSNA CITATION AOPA AIR SAFETY INSTITUTE 1 SAFETY HIGHLIGHTS CESSNA CITATION Introduction: Cessna s Citation jet series was initially created as a light jet for the business market.
SAMPLE. South Africa Photographic Safari. Only 3 Photographers per vehicle
 SAMPLE South Africa Photographic Safari Only 3 Photographers per vehicle Itinerary Day 1 Fly to Johannesburg from USA Day2 Overnight at Southern Sun Airport Southern Sun O.R. Tambo International Airport
Elephant. Buffalo. Kudu. Warthog
 ELEPHANT: Loxodonta africana 7000 kg HABITAT: Grasslands, savanna, and woodlands DIET: Herbivore (browser) Leaves and fruits from trees and shrubs. Elephants will knock down trees if they cannot reach
FULL DAY: SANDBOARDING AND ZIPLINE ADVENTURE TOUR
 FULL DAY: SANDBOARDING AND ZIPLINE ADVENTURE TOUR This morning you will be collected at your hotel in Port Elizabeth and taken on a leisurely drive to the Alexandria Coastal Dunes. Experience the high
You can learn more about the trail camera project and help identify animals at WildCam Gorongosa (
 INTRODUCTION Gorongosa National Park is a 1,570-square-mile protected area in Mozambique. After several decades of war devastated Gorongosa s wildlife populations, park scientists and conservation managers
2014/09/26 THREE WILDLIFE VALUE PROPOSITIONS
 THREE WILDLIFE VALUE PROPOSITIONS 1. American wildlife culture which is based on the belief that making money out of wildlife is immoral; South African wildlife culture is based upon sustainable use. 2.
ZANDSPRUIT NEWSLETTER
 October 2010 ZANDSPRUIT NEWSLETTER In this issue: Project Status Sales & Marketing Farm Management Construction Focus on Zandspruit Next issue January 2011 Current Project Status It s all happening! Since
SOUTH AFRICA AND NAMIBIA 1999
 SOUTH AFRICA & NAMIBIA 527 DECEMBER 1999 Richard Webb 5 th Arrive Johannesburg, drive to Phalaborwa via Pietersburg. Later afternoon & night drive Croc Ranch 6 th Early morning game drive Croc Ranch, drive
Exclusive Cultural & Safari Experience with the Maasai
 Your travel with us will be the most rewarding experience of any holiday in East Africa! 1 Experience the Maasai country and learn about local traditions and culture. Go on a traditional Safari learn about
5 Demography and Economy
 5 Demography and Economy Demography People have probably lived on Great Barrier Island (Aotea) since the 13 th century. There are few written observations about the number of Maori settled here but these
FACTSHEET CONTACT DETAILS
 FACTSHEET CONTACT DETAILS Reservations: Nadine Ebrahim & Zeena Ponto Telephone: +27 (0) 21 4218433 E-mail: reservations@sundestinations.co.za Website: www.nthambo.com Lodge Managers: Gawie and Yolandi
Okavango Direct (PTY) LTD t/a Royale Wilderness
 LTD t/a Royale Wilderness") Pioneer (8 Nights, 9 days camping) 6 Nights Comfort Camping Safari in Botswana, 2 nights Lodge in Vic Falls 2017 Highlights: Royale Wilderness mobile tented camping Private and Exclusive camp grounds Khwai
Pioneer (8 Nights, 9 days camping) 6 Nights Comfort Camping Safari in Botswana, 2 nights Lodge in Vic Falls 2017 Highlights: Royale Wilderness mobile tented camping Private and Exclusive camp grounds Khwai
Deeper Botswana. Safari in style
 info@deeperafrica.com www.deeperafrica.com Deeper Botswana DAY-BY-DAY ITINERARY Safari in style Beverly Joubert/Duba Plains Camp/Great Plains Conservation With its winding channels, azure lagoons, papyrus
2013 Travel Survey. for the States of Guernsey Commerce & Employment Department RESEARCH REPORT ON Q1 2013
 213 Travel Survey for the States of Guernsey Commerce & Employment Department RESEARCH REPORT ON Q1 213 May 21st 213 Table of Contents Page No. Summary of Results 1 Survey Results 2 Breakdown of departing
POPULATION ESTIMATES FOR PEARY CARIBOU (MINTO INLET HERD), DOLPHIN AND UNION CARIBOU, AND MUSKOX ON NORTHWEST VICTORIA ISLAND, NT, JULY 1998
, DOLPHIN AND UNION CARIBOU, AND MUSKOX ON NORTHWEST VICTORIA ISLAND, NT, JULY 1998") POPULATION ESTIMATES FOR PEARY CARIBOU (MINTO INLET HERD), DOLPHIN AND UNION CARIBOU, AND MUSKOX ON NORTHWEST VICTORIA ISLAND, NT, JULY 1998 John A. Nagy 1, Nic Larter 2, and Wendy H. Wright 1 1 Department
POPULATION ESTIMATES FOR PEARY CARIBOU (MINTO INLET HERD), DOLPHIN AND UNION CARIBOU, AND MUSKOX ON NORTHWEST VICTORIA ISLAND, NT, JULY 1998 John A. Nagy 1, Nic Larter 2, and Wendy H. Wright 1 1 Department
Okavango Direct (PTY) LTD t/a Royale Wilderness
 LTD t/a Royale Wilderness") Explorer (10 Nights, 11 Days Camping) 8 Nights Comfort Camping Safari in Botswana, 2 Nights Lodge in Victoria Falls 2019 Highlights: Royale Wilderness mobile tented camping Private and Exclusive camp grounds
Explorer (10 Nights, 11 Days Camping) 8 Nights Comfort Camping Safari in Botswana, 2 Nights Lodge in Victoria Falls 2019 Highlights: Royale Wilderness mobile tented camping Private and Exclusive camp grounds
NOISE AND FLIGHT PATH MONITORING SYSTEM MELBOURNE QUARTERLY REPORT JULY - SEPTEMBER 2011
 NOISE AND FLIGHT PATH MONITORING SYSTEM MELBOURNE QUARTERLY REPORT JULY - SEPTEMBER 211 Date Version Comments Page 2 Foreword Airservices Australia has established a Noise and Flight Path Monitoring System
Commissioned by: Visit Kent. Economic Impact of Tourism. Canterbury Results. Produced by: Destination Research
 Commissioned by: Visit Kent Produced by: Destination Research www.destinationresearch.co.uk November 2016 Contents Page Introduction and Contextual Analysis 3 Headline Figures 6 Volume of Tourism 8 Staying
Canberra Airport Aircraft Noise Information Report
 Canberra Airport Aircraft Noise Information Report Quarter 4 2015 (October to December) 1 Version Control Version Number Detail Prepared by Date 1 - Environment March 2016 Airservices Australia. All rights
Canberra Airport Aircraft Noise Information Report
 Canberra Airport Aircraft Noise Information Report Quarter 1 2016 (January to March) 1 Version Control Version Number Detail Prepared by Date 1 - Environment June 2016 Airservices Australia. All rights
Rotorua District Council. Economic Impacts of City Focus. Technical Annexures. by McDermott Miller Strategies
 Rotorua District Council Economic Impacts of City Focus Technical Annexures by McDermott Miller Strategies 19 December 2014 Copyright McDermott Miller Limited is the author of this report and holds all
Short Term Monitoring Program NSW, Carlingford Report. February 2013
 NSW, Carlingford Report February 2013 Version Control Version Number Date Detail 1.0 February 2013 Initial Release. 2.0 May 2013 Updated formatting for table 2. 3.0 January 2014 Figure 5 and L90 values
14 DAY/13 NIGHT TANZANIA SAFARI WITH ZANZIBAR
 14 DAY/13 NIGHT TANZANIA SAFARI WITH ZANZIBAR Day One Arrive Kilimanjaro Airport and transfer directly to Lake Manyara. Lunch at Lake Kirurumu Tented Lodge. Located 125 km west of Arusha town, under the
NOISE AND FLIGHT PATH MONITORING SYSTEM MELBOURNE QUARTERLY REPORT JULY - SEPTEMBER 2013
 NOISE AND FLIGHT PATH MONITORING SYSTEM MELBOURNE QUARTERLY REPORT JULY - SEPTEMBER 213 Date Version Comments Page 2 Foreword Airservices Australia has established a Noise and Flight Path Monitoring System
NOISE AND FLIGHT PATH MONITORING SYSTEM MELBOURNE QUARTERLY REPORT OCTOBER - DECEMBER 2012
 NOISE AND FLIGHT PATH MONITORING SYSTEM MELBOURNE QUARTERLY REPORT OCTOBER - DECEMBER 212 Date Version Comments Page 2 Foreword Airservices Australia has established a Noise and Flight Path Monitoring
Gold Coast Airport Aircraft Noise Information Report
 Gold Coast Airport Aircraft Noise Information Report Quarter 2 2014 (April to June) 1 Version Control Version Number Detail Prepared by Date 1 - Environment September 2014 Airservices Australia. All rights
The Economic Impact of Tourism on Calderdale Prepared by: Tourism South East Research Unit 40 Chamberlayne Road Eastleigh Hampshire SO50 5JH
 The Economic Impact of Tourism on Calderdale 2015 Prepared by: Tourism South East Research Unit 40 Chamberlayne Road Eastleigh Hampshire SO50 5JH CONTENTS 1. Summary of Results 1 2. Table of Results Table
Botswana & Victoria Falls
 Botswana & Victoria Falls DAY BY DAY ITINERARY safaris in style info@deeperafrica.com www.deeperafrica.com Explore the wilderness of Botswana as you journey through its iconic and diverse national parks
Workshop on Co-Management Models of Conservation Areas in Mozambique, 25 July 2017, Maputo
 Workshop on Co-Management Models of Conservation Areas in Mozambique, 25 July 2017, Maputo Gorongosa declared National Park in 1960 An aerial census of the rift valley floor of the Gorongosa National
Half-Day Excursions in Nairobi
 Half-Day Excursions in Nairobi For Reservations, Please Contact Carol Linnet: Email carol@classicsafaris.co.ke or Phone number. +254 722722764 Classic Safaris Limited P.O Box 66229 00800 Nairobi, Kenya.
2015 RESEARCH AND ANALYSIS: GREEK FLEET STATISTICS 2ND PART OF 2015 PETROFIN RESEARCH CONTENTS OF PETROFIN RESEARCH PART 2
 based on data as of September RESEARCH AND ANALYSIS: GREEK FLEET STATISTICS 2ND PART OF CONTENTS OF PART 2 RESULTS AT A GLANCE (P. 2) SECTION A: VITAL STATISTICS OF THE ENTIRE GREEK FLEET (P. 3) SECTION
1.0 OUTLINE OF NOISE ANALYSIS...3
 Table of Contents 1.0 OUTLINE OF NOISE ANALYSIS...3 2.0 METHODOLOGY...3 2.1 BACKGROUND...3 2.2 COMPUTER MODELING...3 3.0 EXISTING NOISE ENVIRONMENT...4 3.1 EXISTING SANTA MONICA MUNICIPAL AIRPORT NOISE...4
MEASURING ACCESSIBILITY TO PASSENGER FLIGHTS IN EUROPE: TOWARDS HARMONISED INDICATORS AT THE REGIONAL LEVEL. Regional Focus.
 Regional Focus A series of short papers on regional research and indicators produced by the Directorate-General for Regional and Urban Policy 01/2013 SEPTEMBER 2013 MEASURING ACCESSIBILITY TO PASSENGER
HOW TO IMPROVE HIGH-FREQUENCY BUS SERVICE RELIABILITY THROUGH SCHEDULING
 HOW TO IMPROVE HIGH-FREQUENCY BUS SERVICE RELIABILITY THROUGH SCHEDULING Ms. Grace Fattouche Abstract This paper outlines a scheduling process for improving high-frequency bus service reliability based
Gold Coast Airport Aircraft Noise Information Report
 Gold Coast Airport Aircraft Noise Information Report Quarter 3 2012 (July to September) 1 Version Control Version Number Detail Prepared by Date 1 - Environment 2 November 2012 2 Updated Figure 10 Environment
The Economic Impact of Tourism on Scarborough District 2014
 The Economic Impact of Tourism on Scarborough District 2014 Prepared by: Tourism South East Research Unit 40 Chamberlayne Road Eastleigh Hampshire SO50 5JH CONTENTS 1. Summary of Results 1 2. Table of
AIRSERVICES AUSTRALI A
 AIRSERVICES AUSTRALI A NOISE AND FLIGHT PATH MONITORING SYSTEM BRISBANE QUARTERLY REPORT JANUARY - MARCH 211 Page 2 Foreword Airservices Australia has established a Noise and Flight Path Monitoring System
Aircraft Noise. Why Aircraft Noise Calculations? Aircraft Noise. SoundPLAN s Aircraft Noise Module
 Aircraft Noise Why Aircraft Noise Calculations? Aircraft Noise Aircraft noise can be measured and simulated with specialized software like SoundPLAN. Noise monitoring and measurement can only measure the