Gaza Urban Profile Gaza Crisis
|
|
|
- Grace Holland
- 6 years ago
- Views:
Transcription

1 Gaza Urban Profile Gaza Crisis December 2014
2
3 Table of Contents INTRODUCTION PRE-CRISIS SITUATION Gaza Pre-crisis Context a General Description b History and Politics c Urban and Socio Economic Conditions: Administrative Map of Gaza a Refugee Camps Demographic Statistics a Population Characteristics b Population Density c Poverty d Educational Attendance, Literacy Rate Housing Statistics a Overcrowding, Tenure b Connection to Water and Sewage Land Ownership and Topography Land Cover and Vegetation POST CRISIS SITUATION Damaged Assessment a Damaged Structures b Heat map Municipalities Assesment of Urgent Needs Damaged Infrastructure Displacement Situation Summary of Key Findings MUNICIPAL LEVEL ANALYSIS Gaza Municipality a Governorate Context, Demography kk b Pre-Conflict Situation c Land Use d Damage Assessment e Photos 32 32
4 4
.")
5 5 Introduction The Israeli military operation that lasted from July 8 to August 26, 2014 in the Gaza Strip has led to massive displacement and destruction of buildings and urban systems (ex. water, electricity, sanitation). This has greatly exacerbated an already precarious situation as the long blockade of the Gaza Strip had resulted in acute vulnerabilities, including a serious housing shortfall. On one hand, neighborhoods have been partially or completely abandoned and return will depend on restoring of basic functionalities and emergency housing support. In some cases quick return will not be possible in view of the scale of destruction. On the other hand, neighborhoods that have received displaced families are overstretched. Some neighborhoods witnessed both concentrated destruction and inward migration. An overall picture of the urban conditions of neighborhood, such as shelter, infrastructure, commercial and social services conditions, can help to prioritize, localize and streamline immediate and longer term interventions. and unleash opportunities that must be capitalized on. Of particular importance, is the need to understand the crisis impacts on vulnerable groups; especially women and children and the poorest communities throughout the Strip. impact of the crisis accompanied by narrative description and analysis. Gaza City profiles are being developed in close coordination with the active institutions that are currently involved in the work on Gaza crisis. These include a wide range of local and international actors such central and local governments institutions, humanitarians aid agencies,other relevant UN agencies, and the international donor community. Of particular significance is the collaboration and coordination with all the institutions who are working on damage assessments at various stages and levels, as the urban profiles intend to consolidate existing damages data, analyze and update them. For the completion of priority areas profiles, support is needed to accommodate further data collection and updating. UN Habitat seeks to provide up to date urban analysis of the impact of the crisis in key cities of Gaza, with focus on most affected neighborhoods, through City Profiles, synthesizing information and insight from existing sources and priority sectors, supplemented by direct field research by UN Habitat teams. Worth mentioning that UN Habitat expertise in urban analysis, community approaches and crisis contexts have informed the development of the City Profiling process in Syria. In operational terms, urban or city profiles use GIS based mapping to analyze and present the impact of crisis in each affected city or urban neighborhood, taking into consideration damage and displacement, and how they impact a range of sectors including basic infrastructure, shelter, education, health, local economy. It considers the interrelationships between each sector and assesses local capacity within each. The structure of the City Profile provides baseline and current situation data to measure the Damage Assessments and Data Sources The data on damages included in this profile are based on multiple references. However, most of the geo-referenced data and maps on structures damages are extracted from the UNOSAT (OCHA) assessment of 27, August, 2014 that was based on Satellite images. Many background data were obtained through the shelter Cluster initial damage assessment documents. OCHA GIS database was a valuable resource for many produced maps. The Detailed Infrastructure Assessment (DNA) that was conducted by UNDP in October, 2014 provided a good source that helped in updating some of the data and helped in providing an overall picture on the damages across many categories. Profiles produced for water and wastewater damages were based on maps and assessments produced by the Coastal Municipalities Water Utility of Gaza (CMWU), and were cross referenced with the DNA assessment and OCHA data sources. The PCBS census data of 2007 are the key source for the pre-crisis profile. Some data were obtained from UNRWA and ECHO. For the full achievement of the objectives of urban profiles, it is key to continue updating data related to the impacts of the war as they become available. Of particular importance is to geo-reference the damage assessment data of the DNA, since it is the most recent and accurate assessment of the damages that can provide a strong background for informing interventions and prioritizing them. Equally important is to get more detailed data of urban development aspects on the municipal and neighborhoods level from the relevant municipalities and from the field.


6 6 1. GAZA STRIP, PRE-CRISIS SITUATION 1.1 Gaza Pre-crisis Context: A. General Description Gaza is a region of Palestine on the eastern coast of the Mediterranean Sea with a total area of 360 km 21. It has borders with Egypt on the south west for 13 km and with Israel across the east and north for 59 km and it has a 40 km long coastline 2. The total population of Gaza is 1.8 million and it has one of the highest population growth rates in the World standing at 3.48%. The Palestinian Central Bureau of Statistics projects the population of Gaza to reach 2.13m by Gaza s geography consists of three longitudinal zones of sands, alluvial soil and sandstone ridges. The central agricultural zone attracted inhabitants in the past and became the focus for the main mobility routes and it forms the urban backbone of the strip. Gaza has five governorates comprising twenty five municipalities, four joint councils, and eight refugee camps. Gaza is a highly urbanized region with 74% urban population and with an urbanization rate of 3.1% per annum 4. Gaza city is the biggest and most condensed urban center with 400,000 inhabitants and a density exceeding 10,000 inh/sqkm while Jabalya Camp and Ash Shati Camp are considered the largest and the mostly dense camps with densities exceeding 50,000 inh/sqkm. B. History and Politics: Gaza was inhabited since the 15th century B.C, and has been dominated by many peoples and empires throughout its history. It was incorporated into the Ottoman Empire in the early 16th Century. Following World War II, Gaza became part of the British Mandate in Palestine and following the 1948 Israeli- Arab war, the newly formed Gaza strip became under the Egyptian administration until 1967 when it was occupied by Israel. Chronicle history of the recent political development in Gaza Strip In 1994, Israel granted the Palestinian authority the right of selfgovernance in Gaza but not a sovereign state or territory. In 2000, the Palestinian second intifada broke with waves of protests and unrest. Between 2000 and 2004, the construction of the separation barriers between Gaza and Israel and Gaza and Egypt were completed. In 2005, Israel withdrew from Gaza under their unilateral disengagement plan but continued to control its borders. In 2006, Hamas won the Palestinian legislative council election and became the elected government. In 2007, following Hamas win of the legislative council election, fighting erupted between Hamas and Fatah for a period of 6 months, during which both parties attacked vehicles, personal and buildings of the other side. Hamas expelled Fatah from Gaza and formed a separate government breaking the unity government between Gaza and the West Bank. The blockade on Gaza by Israel 1 Gaza Factsheet 2014, the World Bank. 2 The Palestinian Environmental Authority. 3 PCBS. 4 UN-Habitat. started after Hamas came to power sealing by that its land, air and sea and severely restricting the move of people and goods from and into Gaza. In Dec 2008, Israeli army launched series of air strikes on targets in Gaza destroying schools, hospitals, mosques, government buildings, and other buildings. In Jan 2009, Israel began the ground invasion in Gaza and the war lasted 22 days. More than 1,200 Palestinian were killed in this war and tens of thousands of homes and other buildings and infrastructure were destroyed leaving over 50,000 persons without an appropriate shelter. In 2012, Israel launched an 8 day operation in Gaza (Pillar of Defense) targeting Hamas infrastructure. During this offensive, Israel killed more than 158 people and destroyed more than 124 houses and more than 238 public institutions (mosques, schools, health, governmental, etc.). ln 2014 Hamas and Fatah, after the reconciliation talks, formed a Palestinian unity government.

7 7 C. Urban and Socio Economic Conditions: During the past 20 years, Gaza has gone through considerable urban transformation shaped by the Palestinian Authority establishment and the subsequent institution building and boom in construction. However, Hamas ascent to power, years of blockade, and the offensives between 2008 and 2014 prior to the latest assault have resulted in a deteriorating situation in Gaza. According to 2011 PCBS statistics poverty in Gaza stands at 38%. However, recent reports by UNDP and OCHA have indicated that between 70-80% 1 of Gazans live below poverty line given the recent offensives and the continuation of the blockade. In addition, 30% of the newborns in Gaza are living with anemia 2, 72% of Gazans are food insecure 3, 45% of the agricultural land in Gaza is out of production, and by the second half of 2014, unemployment affected 45% 4 of the Gazans. The Gaza Strip is characterized by a housing crisis at multiple levels, as a result of high population growth, Israeli restrictions on movement and access of people and building materials, and war damages. It was estimated that before the latest offensive, there was a shortage of 71,000 housing units 5. Prior to the crisis, 97% of the people in Gaza had access to water networks 6, with the ground water from the coastal aquifer as the primary source. However, in spite of high coverage, the service is intermittent and ground water is highly contaminated. This has resulted in the growth of private enterprises using desalination plants and water tankers to distribute drinking water to customers. As for wastewater, it was also estimated that almost 66% 7 of the people had access to sewage collection systems. In terms of access to energy and electricity, Gaza is suffering a huge deficit in power supply; most of the population is experiencing blackouts for more than 15 hours a day. In terms of mobility infrastructure, movement is highly dependent on roads transport. In addition, Gaza does not have an airport, port, or railway system. Although in 1998, an airport was opened in Gaza for the movement of people and goods but it was destroyed in 2000 at the beginning of the second intifada. The main crossing points between Gaza and Israel are Erez Crossing to the north and the commercial Karni crossing (opens and closes intermittently since 2011). The main crossing point between Gaza and Egypt is Rafah Crossing to the south. For connection with the outside world, Palestinians from Gaza rely on Egypt as a transit stop. Education and health services in Gaza prior to the crisis were suffering overcrowding and lack of financial resources. In terms of economy, Gaza is considered an urban economy depending on internal trade, external aid, communication and movement of people. However, Gaza s economy is highly unsustainable due to the restrictions imposed on the movement of people and goods. Moreover, Gaza is facing a number of environmental challenges including; desertification; salination of fresh water; lack of sewage treatment in many parts of the strip; water-borne disease; soil degradation; depletion and contamination of underground water resources. The Gaza crisis in 2014, has impacted an already deteriorating humanitarian situation, a struggling governance sector, an overloaded infrastructure as a result of 8 years of blockade and continuous cycles of violence and political fragmentation. In July 2014, the Israeli army launched a military operation in Gaza which lasted for seven weeks of air strikes and ground operations. The war has killed more than 2,100 Palestinians and displaced more than 500,000 persons at the hight of conflict. It had also destructed more than 13,000 homes and affected another 100,000, in addition to damaging 261 schools and 77 health facilities. Moreover, the war has severely affected an already deteriorated infrastructure, water, electricity and sanitary systems. The war has also targeted and destroyed more than 220 industrial facilities and caused more than $200,000 Million losses in the agricultural sector. 8 1 Gaza Crisis Appeal - OCHA, 2014 and Detailed Infrastructure and Damage Assessment - UNDP, Ibid. 3 Ibid. 4 Ibid. 5 Ministry of Public Works and Housing. 6 Detailed Infrastructure and Damage Assessment - UNDP, Ibid. 8 Detailed Infrastructure and Damage Assessment - UNDP, 2014.
8 8 1.2 Administrative Map of Gaza Based on PCBS data from the 2007 census JSC for Solid Waste North Gaza Beit Hanun Beit Lahiya Jabalya Umm an Naser inh inh inh inh Gaza inh. 5 Gaza Al Mughraqa Al Zahra inh inh. 8 9 Wadi Gaza Deir al Balah inh inh N JSC for Development JSC for Middle Area and JSC for Solid Waste Deir al-balah 65 Khan Yunis An Nuseirat Az Zawayda Al Bureij Al Maghazi Al Musaddar Wadi as Salqa Khan Yunis Al Qarara Bani Suheila Abasan al Kabira Abasan al Jadida inh inh inh inh inh inh inh inh inh inh inh Refugee camps GazaMunicipalities Urbanised area Salah ad Din street Khuza a Al Fukhari inh inh Rafah inh. 25 Rafah An Naser Ash Shoka inh inh.
9 9 1.2a Refugee Camps There are 8 refugee camps in Gaza (PCBS code) 3 a Jabalya Camp inh. Jabalya 5 b Ash Shati ( Beach ) Camp inh. 10 c An Nuseirat Camp 3065 Ash Shati inh. 12 d Al Bureij Camp inh. N 9 e Deir al Balah Camp inh. 13 f Al Maghazi Camp inh. 16 g Khan Yunis Camp inh. Deir al Balah An Nuseirat Al Bureij Al Maghazi 23 h Rafah Camp inh. There are 8 refugee camps in Gaza strip with a population of 278,641 residents (PCBS census 2007). Ash Shati and Jabalya Camps are considered the largest and the most dense with densities exceeding 50,000 inh/km 2. Gaza camps are characterized with high levels of poverty, poor infrastructure and lack of services. Khan Yunis Joint Service Councils (JSC) As shown on the table to the left, in Gaza, there are two multipurpose councils, and two single-purpose councils for solid waste management. The single-purpose councils are more operational, and the JSC for Solid Waste in the middle area (D) serves all 13 municipalities in the governorates of Deir al-balah and Khan Yunis. Rafah


10 1.3 Demographic Statistics Based on PCBS data from the 2007 census 1.3a Population Characteristics Population aged < % 40-45% 45-50% 50-55% >55% 10 Gaza has a young population, and the median age is 18 (compared to a world average of 28). At the time of the 2007 census, around 45% of the population was below 15 years of age. This underlines the importance of including children and their needs in planning and recovery efforst.
11 1.3b Population Density 1.3c Poverty (Based on 2009 PCBS Statistics) 4 North Gaza Gaza N Built up area 7 8 Deir Al-Balah Population Density (Per esons/km2) (in thousands) < > Poverty rate (%) < > 50 Khan Younis Rafah The map shows that the most dense areas in Gaza are Refugee Camps with densities that exceed 40,000 persons /km2, followed by the main cities of Gaza, Jabalya, Deir Al Balah, Khan Younis and Rafah Governorates with densities that range between 20,000 to 40,000 persons /Km2 The map shows that poverty is more prevailing in the middle and southern governorates (i.e Deir Al Balah, Khan Younis and Rafah, in addition to Southern Gaza (Johr Al Diek) and Umm an Naser in North Gaza. Poverty in these areas is extreme with rates that exceed 40% of families living below Gaza poverty line.
12 1.3d Educational Attendance, Literacy Rate Educational attendance <40% 40-45% 45-50% 50-55% 55-60% Illiteracy rate (age 10+) <5% 5-10% 10-15% 15-20% 20-25% 12 The map above shows the percentage of children above 5 years of age attending school at the time of the 2007 census. The percentage is marginally higher for boys (47%) compared to girls (46%). The regional average is low (46.5%), and school attendance is higher in urban areas than in rural. Female illiteracy is more than twice as high as male illiteracy in Gaza. According to data from the 2007 census, 4.8% of the population above 10 years is illiterate, and the percentage is higher in rural than in urban areas. The illiteracy rate is highest in the two southernmost governorates.
13 1.4 Housing Statistics Based on PCBS data from the 2007 census 1.4a Overcrowding and Tenure Average number of persons per housing unit. < >7 Percentage of owner-occupied housing units. <75% 75-80% 80-85% 85-90% 90-95% % 13 The number of persons per housing unit can be an indicator of overcrowding. Parts of Beit Hanun and Beit Lahiya average more than 7 persons per unit. Eastern parts of Gaza city are all above the regional average of Refugee camps also have high numbers of persons per housing unit. Around 80% of the housing units in Gaza were owneroccupied at the time of the 2007 census. Families who lost rented shelter can be more vulnerable and difficult to target for shelter support. Gaza city has a higher concentration of rented units than the rest of the Gaza Strip.
14 1.4b Connection to Water/Sewage Networks Percentage living in units connected to water network. <50% 50-60% 60-70% 70-80% 80-90% 90-95% % Percentage living in units connected to sewage network. <25% 25-50% 50-60% 60-70% 70-80% 80-90% % 14 In 2007, 96% of the inhabitants in Gaza were living in housing units connected to public water networks. The households without connections are mainly in rural areas, while urban centres (Beit Lahiya, Beit Hanun, Gaza, Deir al-balah, Khan Yunis and Rafah) were close to full coverage. Connections to sewage networks were less established, and included 78% of inhabitants. The percentage is lowest in Khan Yunis governorate, both in urban and rural areas (average of 27%), but also eastern parts of Deir al-balah and Rafah governorates were lacking sewage connections.
15 1.5 Land Ownership Percentage owned by public/private/waqf Public Private Waqf 1 Beit Hanun 88% North Gaza 2 3 Beit Lahiya Jabalya 40% 88% 60% 4 Umm an Naser 100% 5 Gaza 86% Gaza 6 7 Al Mughraqa Al Zahra 79% 85% 8 Wadi Gaza 85% 9 Deir al Balah 85% 10 An Nuseirat 99% Deir al-balah Az Zawayda Al Bureij Al Maghazi 100% 87% 90% 14 Al Musaddar 97% 15 Wadi as Salqa 82% 16 Khan Yunis 41% 57% 17 Al Qarara 68% 23% Khan Yunis Bani Suheila Abasan al Kabira Abasan al Jadida 93% 99% 99% 21 Khuza a 26% 74% 22 Al Fukhari 96% Rafah 35% 64% Rafah 24 An Naser 53% 47% 25 Ash Shoka 100%
16 Map of municipalities and land ownership, based on data from the Ministry of Planning (MOPAD). Topographic map N Ownership Public Private Waqf Elevation 0-10 m m m m m m m m m m m According to this map, the majority of land in Gaza is privately owned (63%). Around 2% of the land is classified as Waqf (properties donated for religious or charitable purposes). The remaining 35 % are public lands. The Gaza Strip is relatively flat, with elevations ranging from metres above sea level. The highest areas are found in eastern parts of Khan Yunis Governorate. The lowest areas are in the west, and along the border between Gaza and Deir al-balah governorates (Wadi Gaza).
17 1.6 Land Cover Percentage of urbanised, bare and arable land 45% - Urbanised Bare Arable - 42% 1 Beit Hanun 30% 48% North Gaza 2 3 Beit Lahiya Jabalya 35% 52% 46% 38% 4 Umm an Naser 34% 25% 5 Gaza 56% 34% Gaza 6 7 Al Mughraqa Al Zahra 41% 26% 58% 68% 8 Wadi Gaza 17% 62% 9 Deir al Balah 48% 47% 10 An Nuseirat 41% 44% Deir al-balah Az Zawayda Al Bureij Al Maghazi 39% 19% 38% 57% 56% 49% 14 Al Musaddar 30% 65% 15 Wadi as Salqa 33% 60% 16 Khan Yunis 41% 17 Al Qarara 39% 54% Khan Yunis Bani Suheila Abasan al Kabira Abasan al Jadida 50% 29% 28% 43% 67% 58% 21 Khuza a 28% 60% 22 Al Fukhari 32% 66% Rafah 28% Rafah 24 An Naser 46% 51% 25 Ash Shoka 21% 58%
18 Map showing primary crops and their location. Data obtained from UNRWA. Date unknown. N Map of land cover - urban/agriculture/bare land. Based on ECHO mapping of agricultural damage. Land cover Built up area Primary crop Almonds Citrus Citrus mixed Dates Grapes Greenhouses Horticulture Olives Rainfed crops According to this map, 45% of Gaza Strip is covered by buildings and roads, while 42% is agricultural land. Bare land (12%) is found mainly in the access-restricted area along the border. Data discrepancies occur for the abandoned settlement area in Khan Yunis (16) and Rafah (23). Major agricultural products in Gaza include citrus, dates, olives and flowers. Rainfed crops (e.g. potatoes, cereals, cabbage, peas) are found mainly in the southeast. Shortage of water and export restrictions have had severe negative impacts on the sector s productivity and economy. Arable Land Bare Ground 18 Orchard
19 2. GAZA STRIP, POST CRISIS SITUATION 2.1a Damaged Structures Based on data from UNOSAT assessments. 5 Gaza Sum 3546 Fully Partially Minor 37% Beit Hanun % Al Qarara % Ash Shoka % Wadi Gaza % Rafah % Beit Lahiya % Bani Suheila % Khuza a % Abasan al Kabira % Khan Yunis % Deir al Balah % Jabalya % Abasan al Jadida % Al Musaddar % Wadi as Salqa % Al Fukhari % An Nuseirat % Az Zawayda % Al Bureij % An Naser % Umm an Naser % Al Maghazi 62 29% Al Zahra 60 23% Al Mughraqa 17 47%
20 Intensity of Damaged Structures per municipality Intensity of Damaged Structures per neighborhoods N Number of damaged structures < >2000 Number of damaged structures < > Governorates Salah ad Din street Governorates Salah ad Din street While damages occur in all municipalities, some are more heavily affected than others. Gaza city and Beit Hanun top the list when it comes to the number of structures (identified on satellite imagery), but municipalities in the governorates of Khan Yunis and Rafah also feature prominently. When the mapping of structural damages is broken down into smaller areas (in this case the statistical divisions from PCBS), a pattern emerges showing a higher concentration of damage within a 3 km buffer to the east of Salah ad Din street and along the northern border.

")

21 2.1b Heat Map 3km 45% of Gaza area 21% of Gaza buildings1 165km km2 = 360km2 71% of damaged buildings2 Salah el Deen Street in 3km N 1 Based on building outlines digitised by the Ministry of Planning and Development. 2 Percentage of damaged structures (including destroyed, severely and moderately damaged) mapped by UNOSAT on the basis of Pleiades satellite imagery from August 27-28, Damaged structures per km > km 21 International boundary Salah el Deen in Str eet
22 2.2 Municipalities Assessment of Urgent Needs Based on quick, internal damage assessment, July 2014 $ $ $ Gaza inh. $ Beit Hanun inh. $ Al Qarara inh. $ Ash Shoka inh. $ Wadi Gaza inh. $ Rafah inh. $ Beit Lahiya inh. $ Bani Suheila inh. $ Khuza a inh. $ Abasan al Kabira inh. $ Khan Yunis inh. $ Legend 9 Deir al Balah inh. $ Roads 3 Jabalya inh. $ Water 20 Abasan al Jadida inh. $ Sanitation 14 Al Musaddar inh. $ Electricity 15 Wadi as Salqa inh. $ Solid Waste 22 Al Fukhari inh. $ Buildings 10 An Nuseirat inh. $ Equipment 11 Az Zawayda inh. $ Al Bureij inh. $ An Naser inh. $ Umm an Naser inh. $ Al Maghazi inh. $ Al Zahra inh. $ Al Mughraqa inh. $
23 2.3 Damaged Infrastructure Based on data from CMWU, PS PS WTP PS PS Water and Wastewater Networks The concentration of damaged networks mirrors the concentration of damaged to structures. The main localities that fall to the East of Salah El Dein Street are heavily affected, such as Bait Hanoun, Al Shuja iyeh Neighborhood in Gaza City, Al Qarara and Al Mussadar in Deir Al Balah, Khuza a in Khan younis and Eastern Rafah in Rafah. However, damaged networks extend to the west of Salah el Dein Street affecting the refugee camps of Jabalya in the north, and most of the Deir Al Balah Camps as well as Khan Younis and Rafah Camps. PS PS PS PS PS PS PS PS WTP PS WTP Water resources, WWTP and PS War damages affected key services allover the Strip. Besides the heavy damages of water reservoirs and wells along the Eastern 3 Km buffer zone, many water wells and wastewater pumping stations (PS) were damaged in the western parts of the buffer zone in North Gaza, parallel to the damages of water and wastewater networks in the same areas. In addition, waste water treatment plants (WWTP) of North Gaza, Gaza and Rafah governorates were damaged along with two desalination plants in Deir Al Balah WTP PS 23 Damaged Wwater and Wwastewater Network Governorates Salah ad l Dein Din str Street Refugee Camps PS WTP Damaged Water Wells Damaged Water Tank Damaged Desalination Plant Damaged Wastewater Pumping Pumping Station PStatio Damaged WWTP
24 2.4 Displacement Situation Based on OCHA data 41,371 22,541 Total IDPs before ceasefire (26th of Aug 2014) 11,057 Total IDPs remaining in UNRWA schools after ceasefire (26th of Aug 2014) 90,017 18,085 6,466 78, ,511 9, IDPs movement between places depended on many factors such as; the severity of attacks in the targeted locations during the crisis, the adequacy of the living conditions in temporary shelters or with host families, the potentials to find alternative accommodation, or return to original houses. Therefore, IDPs concentration and distribution across the various localities within the Strip differed significantly between the onset of the assault, the height of the conflict and after the ceasefire. IDP s concentration is also expected to change along the process of reconstruction. It may be difficult also to track all IDPs temporary movement, especially those residing with host families. As of October 18th, 2014, the number of IDPs residing in 18 UNRWA Schools were estimated to be 42,500. In addition, the Ministry of Social Affairs estimated that additional 47,000 IDPs are residing with host families.
 are estimated to be 42,500 IDPs, while 47,000 IDPs 1 are residing with host families.")

.")

25 2.5 Summary of Findings Affected Population and Displacement: At the height of the conflict IDPs reached 500,000 comprising 28% of Gaza population. As of October 18, 2014, the remaining IDPs at temporary collective shelters (18 UNRWA Schools) are estimated to be 42,500 IDPs, while 47,000 IDPs 1 are residing with host families. The majority of IDP s have managed either to return their partially damaged houses or found alternative accommodation (i.e temporary, pre-fabricated, rented) accommodation. Although, the pattern of displacement is not mapped, a general pattern of displacement from the Eastern side towards the Western side of the strip has been witnessed. Number of displaced population to total population in each Governorate - Initial Assessments (Shelter Cluster Documents) 13,529 destroyed units, 8,392 severely damaged and 91,445 partially damaged (as shown in the figures below).the two assessments reveal significant discrepancies in the results, which can be explained by the large number of partially damaged units, that was identified through the detailed assessments of UNDP and UNRWA. 70% 16% 14% Destroyed Severly Destroyed damaged Severely damaged Partially damaged Partially damaged Shelter Damage Displacement Most Affected Areas: The concentration of damages was within the 3 km buffer zone East of Salah El Dein Street that runs the Strip from north to south, and along the northern border. 71% of the damaged buildings are located within this 3km zone. The most affected communities with concentrated damages were A) Beit Hanoun, Beit Lahia, East Jabalya in North Gaza; B) Gaza City (Shijaiya and Al Zaitoon neighbourhoods), Wad Gaza (Joher Al Dick) in addition to multi-storey buildings in different neighbourhoods in Gaza; C) Wadi Gaza (Al-Bureij, AlNusairat Camps) and Deir Al Balah,Al Musaddar,Al Maghazi Camps in Deir Al Balah; D) Khuza a, Al Qarara and Bani Suhaila in Khan Younis, and E) East Rafah ( Ashoka) in Rafah 2. Ranking Al Shijaiya (Gaza City), Beit Hanoun, Al Qarara,Ashoka and Wadi Gaza to be the most affected in terms of the total number of destroyed structures. Structures and Shelter Damages Shelter damages were severe. The total number of damaged structures is not final yet. However, the preliminary assessment of UNOSAT estimated the total number to be 14,798 structures. Damaged shelters were estimated to be 55,855 housing units, divided between 8,800 destroyed units, 7,953 severely damaged, and 39,120 partially damaged units. The following detailed assessment by UNDP and UNRWA preliminary estimates refer to 113,366 damaged housing units divided between 1 Ministry of social affairs 2 UNOSAT Assessment cross referenced with the Detailed Infrastructure Damage Assessment of the 2014 Gaza War - UNDP Partially damaged Damages are in part of the house and some parts are still inhabited and the estimated cost of repair is between USD 5,000 and USD 10, ,445 units/ 548,670 individuals Severely damaged Damages are in essential parts of the house, un-inhabited until major work takes place. Cost between USD 10,000 and USD 20,000. 8,392units/ 50,352 individuals Destroyed Totally destroyed or beyond repair houses, need demolition and reconstruction. Cost over USD 20, ,529 units/ 81,174 individuals Infrastructure and Social Services: The war resulted in severe destruction and damages to the main infrastructure installations, main and local infrastructure networks, and basic social services (i.e education and health), which caused temporary or permanent disruption of the services across the strip. Impacts can be summarized by: Water: All over the strip, a total of 20,000 m of water pipes have been damaged, in addition to 25 wells, 16 reservoirs, and 6 desalination units that have been completely or partially damaged 3. The concentration of the damages was in the Eastern 3km buffer zone, mainly in Bait Hanoun, Al Shuja iya, Khuzaa, Al Musaddar, and Eastern Rafah (Ashoka), in addition to refugee camps, mainly Jabalya, Nusairat, Al-Bureij, Deir Al Balah, Al Maghazi and Rafah Camps 4. In particular, the war have resulted in almost complete destruction of the networks of Al Shuja iya, Khuzaa and Rafah eastern areas 5 3 Detailed Infrastructure Damage Assessment of the 2014 Gaza War - UNDP 4 Detailed Infrastructure Damage Assessment of the 2014 Gaza War - UNDP cross referenced with CMWU Assessment 5 Detailed Infrastructure Damage Assessment of the 2014 Gaza War - UNDP 25
26 Wastewater: A total of 15,000m of sewerage pipelines have been damaged throughout the strip, along with 12 pumping stations that were partially damaged. Gaza, Rafah and Bait Lahia wastewater treatment plans were also damaged 1. The concentration of the damages is similar to that of water networks 2. Roads 3 : In total, 39, 56 Km of asphalted municipal and regional roads have been damaged, in addition to 11.1km of interlock-tiled roads that were destroyed by the war and the war aftermath throughout the Gaza Strip. The concentration of damages was to the Eastern side of Salah El Dein Road, mainly in Al Shuja iya neighbourhood, Khuzaa, Bani Suhaila,Qarara and Beit Hanoun. Despite that most damaged roads have been opened for traffic by removing debris, they are still not asphalted. Movement of people and goods remain difficult in the Eastern parts. Internal roads in Beit Hanoun, Al Shuja iya and Khuzaa remain closed due to the massive destruction inside these areas. Electricity 4 : During the war, the damages of Gaza power station fuel tanks and feeder lines resulted in a complete electricity outage throughout the strip. This was partially fixed by Gaza Electricity Distribution Company (GEDCO) by October However, Gaza is left with a deficit of 65% of the current peak demand of 350MW. As of October 18th, due to the damages, and lack of spare parts and materials, Gaza power plant is out of service, depending only on supply from Egypt and Israel with outages exceed 18 hours /day. In addition, 20-25% of Gaza population have no electricity. functionality. The capacity of these areas to provide basic level of services and adequate living environment to their residents is severely reduced, if not completely ceased to exist in parts of these areas. Based on the available data, past and ongoing needs assessment, the following municipalities/neighbourhoods or parts of them can be rendered as localities with severely difficult living conditions that need immediate interventions to bring them back to an acceptable level of urban functionality. These areas lack adequate level of mobility due to closed internal roads, and lack functioning water and wastewater services. They also suffer from severe electricity outage, in addition to massive destruction of structures that cripple housing and other urban and commercial functions: North Gaza Governorate: 1 Bait Hanoun Gaza Governorate: 2 Gaza City (Al Shuja iya neighbourhood) 3 Wadi Gaza Deir Al Balah Governorate : 4 Al Musaddar Khan Younis Governorate: 5 Khuzaa Rafah Governorate: 6 Ash Shoka Education 5 Out of the existing 520 education facilities in Gaza, 261 were damaged. Damages were widespread across the government and UNRWA preliminary and secondary schools. In total, over 559,000 students were affected by the war impacts. Damages were concentrated in the eastern parts of Gaza Governorate, where 3 schools were totally destroyed, 4 were severely damaged and 83 were partially damaged. The war also impacted schools operation in general. The school year started on September 14th three weeks later than planned, as 113 schools were used as shelters for IDPs. As of October 18th, 18 UNRWA schools are still used as collective shelters for IDPs. Health 6 The Ministry of Health and the World Health Organization identified 87 health facilities (hospitals and clinics) to be assessed. 77 of these were damaged, while 25 were either totally destroyed or suffered from severe and major damages. The most affected facilities were in Gaza Governorate, where 10 hospitals and 17clinics were damaged. Urban Functionality In addition to the impacts of infrastructure and social services damages that caused temporary or permanent disruption of the services across the Strip, the war resulted in severe combined impacts on particular areas and neighbourhoods that hindered/are hindering their 1 Detailed Infrastructure Damage Assessment of the 2014 Gaza War - UNDP cross referenced with CMWU Assessment 2 Damages Assessment Report Water and Wastewater Infrastructure/CMWU 3 To date, no detailed geo referenced data available. The included data are taken from the UNDP Detailed Infrastructure Damage Assessment of the 2014 Gaza War 4 As 3 above 5 As 3 above 6 As 3 above More detailed urban profiling of these areas is needed to have better understanding of the damages impacts and identifying of priority interventions, in addition to capturing any potential development opportunities and neighborhood re-planning options to build back better Gaza. Identifying Priority Areas and Interventions Although the most dysfunctional areas represent prioritiy for interventions, other factors need to be considered. Aspects of population size and density, as well as poverty rates in localities are important factors. For example, considering that poverty rates in As Shoka and Khuzaa exceed 40 % gives these two areas priorities for support and it also impacts the nature of immediate and long terms interventions and their components The following sections of this document aim at using the available pre- crisis and damages data available so far to set the background for further analysis of these priority areas upon more data and resources availability. 6 5
27 27
28 3. MUNICIPAL LEVEL ANALYSIS 3.1 Gaza Municipality N 3.1a Governorate Context Scale 1:50000 Governorate boundary Municipal boundary Statistical divisions Historical site Crossing point Administrative boundaries, strategic land use The population of Gaza governorate is (PCBS projection for 2014, with an estimated annual growth rate of around 3.2%). 90% of the inhabitants live in Gaza municipality, which is the largest municipality in the Gaza strip. Gaza N Al Mughraqa Az Zahra Wadi Gaza (Juhor ad Dik) 28 The map indicates current and future land use according to the National Spatial Plan from the Ministry of Planning. Built-up area Urban development Recreation Agricultural land Wadi Gaza (reserve) Fisheries site Existing industial area Proposed industrial area Proposed harbour site Proposed treatment site Topography 1:
29 The map indicates land ownership classification in Gaza governorate. Vast majority of the land is privately owned. Public Private Waqf Land ownership 1: Population < > b Pre-conflict Situation Based on data from the 2007 census (PCBS) Population The population of Gaza municipality in 2007 was According to PCBS projections, there are inhabitants in 2014 (with an average growth rate of 3.1% per year). The population is distibuted quite evenly between different geographical areas. The interest area for detailed analysis statistical division 12 & 13 had a combined population of (21.2% of the total) statistical division 12 & 13, population density is not the best indicator of overcrowding or levels of urbanisation. The most densely populated areas in Shuja iyya are located between the Old City/Salah ad Dein street on one side, and Al Karame street on the other side Household size There were housing units in Gaza municipality at the time of the census (2007), resulting in an average household size of 6.6. Of these units, (18.1%) were located in statistical division 12 & 13, resulting in an average household size of 7.4 (the highest in the municipality). Density Because of the amount of agricultural lands included in Tenure Gaza municipality has the lowest percentage of owneroccupied units in the region (76%). This could be due to multi-storey developments and economic migration into the city. 9% of housing units in the municipalities are identified as rent-paying. In statistical division 12 & 13, only 1 out of every 5 non-owner-occupied units were identified as paying rent in the 2007 census. 29
30 3.1c Land Use Built-up areas and agricultural land with parcels buildings were registered in Gaza municipality during the 2007 census. Around 10% of these (7 966 buildings) were located in statistical division 12 and 13 (but containing 17% of the total number of housing units) Number of buildings (2007) Per statistical division Agriculture - 34% Built-up - 56% Bare - 10% Legend Agriculture Arable land Grassland/scrub Statistical divisions Plot boundaries Access-restricted area


31 3.1d Damage Assessment Based on UNOSAT data from 28/29 August 2014 PCBS has divided Gaza municipality into 14 statistical divisions. Satellite-based damage assessment data from UNOSAT shows that these areas have been affected very differently by the conflict, with high concentrations of structural damages to the south-east. Statistical division 12 and 13, covering the area known as Shuja iyya, require particular attention and support due to the amount and concentration of damages (see detailed map below). Damaged structures < > Area 12 Sum N Scale 1:20000 Damage level Total Severe Moderate 31


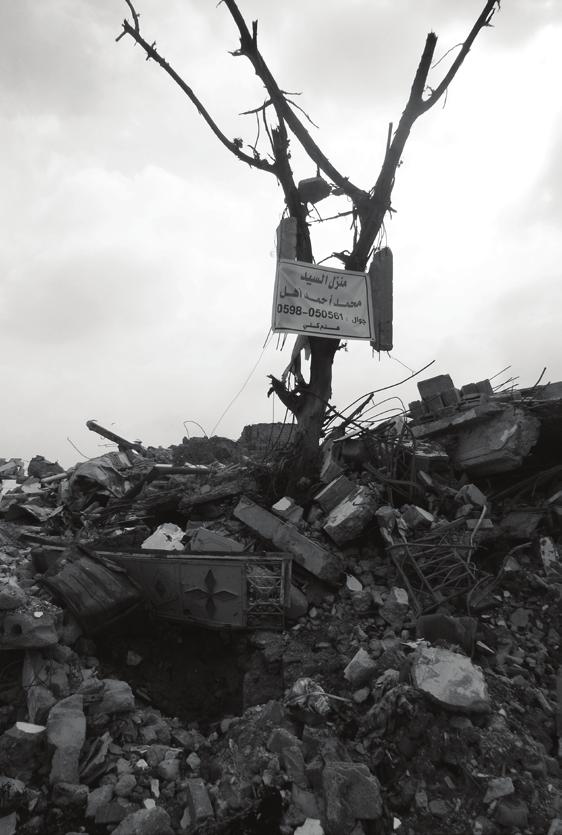
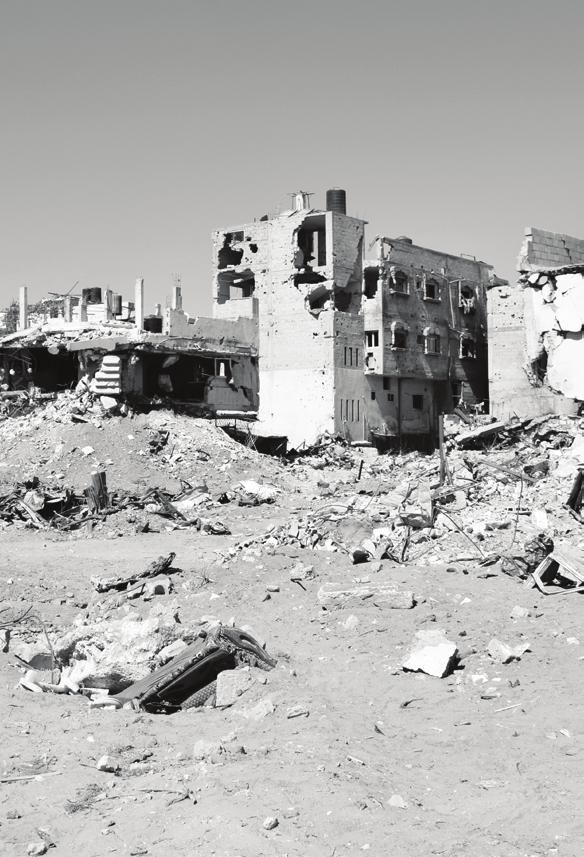
32 3.1e Photos Taken during field visit on September 30, 2014 Some photos illustrate the difficulties of mapping damages from satellite images 1 2 The building to the left is mapped as severly damaged, while the 2 floor building to the right is moderately damaged. damaged. Burned out houses is an example of difficult damages to map from aerial imagery. A severely damaged mosque is seen in the background. On the right: a building calssified as severely damaged but not destroyed by UNOSAT. A partially destroyed gvt. school in the back. Another example of the difficulties of mapping damages from satellite imagery. The building in front can look intact from above. 32


33 Al Morabteen Al Reyadh Street 180 panorama panoramic view
Fields of Projects Implementation Misc. 11% Roads 6%
 Israel is working with the international community and the Palestinian Authority to advance and to streamline the approval processes for internationally funded projects. To this end a coordination and
Brief Description of Northern the West Bank, Palestine Prepared by: Dr. Ahmed Ghodieh Department of Geography An-Najah National University Nablus,
 Brief Description of Northern the West Bank, Palestine Prepared by: Dr. Ahmed Ghodieh Department of Geography An-Najah National University Nablus, Palestine Brief Description of Northern the West Bank
Gaza Terminals Overview
 Gaza Terminals Overview There are six trade terminals at the Gaza strip borderlines, these terminals are utilized for the crossing in and out of imported commodities and exported goods. Four of the terminals
Bardala village profile
 Bardala village profile Produced by The Applied Research Institute - Jerusalem In cooperation with Funded by February, 2006 This document has been produced with the financial assistance of the European
Aqqaba Village Profile
 Aqqaba Village Profile Produced by The Applied Research Institute - Jerusalem In cooperation with Funded by February, 2006 This document has been produced with the financial assistance of the European
The Gaza Strip: Access Report January 2006
 The Gaza Strip: Access Report January 26 This report monitors access in and out of the Gaza Strip. Movement in and out of the Gaza Strip is controlled through: Erez crossing for Palestinian workers and
Chapter 16 ~ Eastern Mediterranean
 Chapter 16 ~ Eastern Mediterranean Physical Geography of the Eastern Mediterranean Landforms This area is known as the Levant and includes Syria, Jordan, Lebanon, Israel, and the Palestinian territories.
Chapter 16 ~ Eastern Mediterranean
 Chapter 16 ~ Eastern Mediterranean Physical Geography of the Eastern Mediterranean Landforms This area is known as the Levant and includes Syria, Jordan, Lebanon, Israel, and the Palestinian territories.
Deir Hajla Locality Profile
 Deir Hajla Locality Profile Prepared by The Applied Research Institute Jerusalem Funded by Spanish Cooperation 2012 Acknowledgments ARIJ hereby expresses its deep gratitude to the Spanish agency for International
Deir al Qilt Locality Profile
 Deir al Qilt Locality Profile Prepared by The Applied Research Institute Jerusalem Funded by Spanish Cooperation 2012 Acknowledgments ARIJ hereby expresses its deep gratitude to the Spanish agency for
Key Indicators for South Sudan
 Key Indicators for South Sudan National Bureau of Statistics Fast Facts Total Population of South Sudan is 8.26 million Total Area of South Sudan is 644,329 sq. km More than half (51%) of the population
HELLENIC REPUBLIC Voluntary National Review on the Implementation of the 2030 Agenda for Sustainable Development. 16 July 2018
 HELLENIC REPUBLIC Voluntary National Review on the Implementation of the 2030 Agenda for Sustainable Development 16 July 2018 1 HELLENIC REPUBLIC Voluntary National Review on the Implementation of the
Eastern Caribbean Humanitarian Situation Report No. 13
 @UNICEF/Andrew Ward/2017 Eastern Caribbean Humanitarian Situation Report No. 13 30 November 2017 Highlights As of 27 November, the majority of schools in Anguilla, Antigua, British Virgin Islands (BVI),
INTRODUCTION GEOGRAPHY
 COUNTRY DATA: Cyprus : Information from the CIA World INTRODUCTION A former British colony, Cyprus became independent in 1960 following years of resistance to British rule. Tensions between the Greek Cypriot
City Introduction & Context
 City Introduction & Context Give an overview of the city and a general background to the application, including examples of social and economic sustainability in the city. Discuss positive and negative
UGANDA S URBAN DEVELOPMENT; A SCRUTINY OF TRANSPORT PLANNING AND MOBILITY IN TOWNS AND CITIES
 UGANDA S URBAN DEVELOPMENT; A SCRUTINY OF TRANSPORT PLANNING AND MOBILITY IN TOWNS AND CITIES BY Mutabazi Sam Stewart Executive Director Uganda Road Sector Support Initiative (URSSI) P.O Box 11110 Kampala,
Annex III: Statistics
 Annex III: Statistics Table A.3.1 Physical characteristics of Arab countries Country Area, 2011 (thousand square kilometres) Length of coast, 2005 (kilometres) Rainfall, 2002 (millimetres per year) Total
Eastern Caribbean Humanitarian Situation Report No. 12
 @UNICEF/Romaro Richardon/Anguilla2017 Eastern Caribbean Humanitarian Situation Report No. 12 14 November 2017 Highlights As of mid-november, the majority of schools in Anguilla, Antigua, British Virgin
Silvia Giulietti ETIS Conference Brussels An EEA reporting mechanism on tourism and environment and ETIS
 Silvia Giulietti ETIS Conference Brussels 28.01.2016 An EEA reporting mechanism on tourism and environment and ETIS Main content Why tourism and environment? Why a reporting mechanism on tourism and environment
Poll no. 132 Date: February 15, 2005
 Poll no. 132 Date: February 15, 2005 Dear Madam, Dear Sir, We are very pleased to forward to you the summary of our latest poll No. (132), which has probed the resonance of Sharm el-sheikh summit results
Contribution from UNCTAD dated: 29 June 2010
 Report of the UN Secretary-General: Necessity of ending the economic, commercial and financial embargo imposed by the United States of America against Cuba (A/65/83) Contribution from UNCTAD dated: 29
PPCR/SC.4/5 October 9, Meeting of the PPCR Sub-Committee Washington, D.C. October 28, REVIEW OF ON-GOING WORK OF THE MDBs IN DJIBOUTI
 PPCR/SC.4/5 October 9, 2009 Meeting of the PPCR Sub-Committee Washington, D.C. October 28, 2009 REVIEW OF ON-GOING WORK OF THE MDBs IN DJIBOUTI Proposed Sub-Committee Decision The Sub-Committee reviewed
Provincial Review 2016: Limpopo
 Provincial Review 2016: Limpopo Limpopo s growth since 2003 has been dominated by the mining sector, especially platinum, and by national construction projects. As a result, the provincial economy grew
Slum Situation Analysis
 Slum Situation Analysis Components of a slum upgrading programme 1. SLUM SITUATION ANALYSIS 2. REVIEW OF POLICIES AFFECTING SLUM AREAS 3. SLUM UPGRADING AND PREVENTION STRATEGY 4. RESOURCE MOBILISATION
QCOSS Regional Homelessness Profile Mackay Statistical Division
 QCOSS Regional Homelessness Profile Mackay Statistical Division March 2011 Council of Social Service Inc (QCOSS) March 2011 QCOSS would like to thank the Department of Communities for providing data from
WFP Chad SPECIAL OPERATION SO
 WFP Chad SPECIAL OPERATION SO 200058 Country: Chad Type of project: Special Operation Title: Provision of Air Services to Humanitarian Community in Chad Total cost (US$): US$ 11,362,014 Duration: 12 months
CHAPTER 3. CONTEXT. 3.1 The State of Morelos. 3.2 Waste issues in Morelos. 3.3 Criteria for selecting the municipality of Jiutepec as a case study
 CHAPTER 3. CONTEXT 3.1 The State of Morelos 3.2 Waste issues in Morelos The Tetlama Waste Dump case Waste production in Morelos Ecological consequences in the region 3.3 Criteria for selecting the municipality
Concept Document towards the Dead Sea Basin Biosphere Reserve and World Heritage Listing. This report has been presented to the public and to
 Concept Document towards the Dead Sea Basin Biosphere Reserve and World Heritage Listing. This report has been presented to the public and to political decision makers both regionally and internationally
Tourism Industry Council Tasmania Community Survey 2018 Research Report. May 2018
 Tourism Industry Council Tasmania Community Survey 2018 Research Report May 2018 This report has been prepared by Enterprise Marketing and Research Services 60 Main Road, Moonah TAS 7009 All enquiries
Dr. Dimitris P. Drakoulis THE REGIONAL ORGANIZATION OF THE EASTERN ROMAN EMPIRE IN THE EARLY BYZANTINE PERIOD (4TH-6TH CENTURY A.D.
 Dr. Dimitris P. Drakoulis THE REGIONAL ORGANIZATION OF THE EASTERN ROMAN EMPIRE IN THE EARLY BYZANTINE PERIOD (4TH-6TH CENTURY A.D.) ENGLISH SUMMARY The purpose of this doctoral dissertation is to contribute
Land Figures & Spatial Data Infrastructure in KOSOVO
 Land Figures & Spatial Data Infrastructure in KOSOVO Idriz SHALA idriz.shala@gmail.com GIS -expert Afrim SHARKU afrim.sharku@gmail.com Land Management - Expert Kick-off meeting of the Regional Expert Advisory
ISRAEL- COUNTRY FACTS
 ISRAEL- COUNTRY FACTS ISRAEL-NEIGHBOURING COUNTRIES AND POLITICAL MAP Area: 22,072 sq. km Land area: 21,643 sq. km. Fast Facts Area of lakes: 429 sq. km. (Sea of Galilee 164 sq. km., the Dead Sea - 265
ZIONIST PLAN FOR PALESTINE 1919 MAP 1
 ZIONIST PLAN FOR PALESTINE 1919 MAP 1 THE PEEL COMMISSION PARTITION PLAN, JULY 1937 MAP 2 Proposed Arab State Proposed Jewish State To Remain under British Mandate Aka Haifa Sur LEBANON Safad Proposed
5 Demography and Economy
 5 Demography and Economy Demography People have probably lived on Great Barrier Island (Aotea) since the 13 th century. There are few written observations about the number of Maori settled here but these
Summary table of disaster occurrences, by hazards types, scale, and geographic region
 ANNEX BASIC RANGE OF DISASTER-RELATED STATISTICS TABLES Statistical tables are organised into worksheets according to basic components in the DSRF. The variables represent queries from a disaster-related
"ST. KLIMENT OHRIDSKI FACULTY OF GEOLOGY AND GEOGRAPHY
 SOFIA UNIVERSITY "ST. KLIMENT OHRIDSKI FACULTY OF GEOLOGY AND GEOGRAPHY APPLICATION OF THE MODEL "DRIVING FORCES PRESSURE STATE - RESPONSE FOR ASSESSMENT OF FLOOD RISK RADOSTINA BORISOVA DOCHEVA Bachelor
MAPPING UNSHELTERED HOMELESSNESS IN INDIANAPOLIS ISSUE C17-20 NOVEMBER 2017
 MAPPING UNSHELTERED HOMELESSNESS IN INDIANAPOLIS ISSUE C17-20 NOVEMBER 2017 AUTHOR Chris Holcomb, Graduate Student, School of Public and Environmental Affairs, IUPUI 334 N. Senate Avenue, Suite 300 Indianapolis,
AGENDA. MENA Region Economic Context/Challenges. Importance of Cultural Heritage. Responding to Countries Needs and Demands
 Leveraging Cultural Heritage for Sustainable Development MIDDLE EAST & NORTH AFRICA Hedi Larbi Sector Manager April 16, 2007 AGENDA MENA Region Economic Context/Challenges Importance of Cultural Heritage
COMMUNITY PROFILES: TURKISH COMMUNITY
 COMMUNITY PROFILES: TURKISH COMMUNITY 1. POPULATION SIZE AND LOCATION Based on the 2011 Kosovo census results, supplemented with OSCE data for northern Kosovo, ECMI Kosovo estimates that there are around
HOUSEHOLD TRAVEL SURVEY
 HOUSEHOLD TRAVEL SURVEY Household Travel Survey i TABLE OF CONTENTS Page 1.0 INTRODUCTION... 1 2.0 SUMMARY OF TRAVEL... 2 2.1 All-Day Travel Patterns... 2 2.1.1 Automobile Availability... 2 2.1.2 Trip
Case Study 3 - Nancholi Chiimire
 Case Study 3 - Nancholi Chiimire From plans to action Mobilizing funds and credit for slum upgrading JUNE 2014 1 MOBILIZING FUNDS AND CREDIT FOR SLUM UPGRADING This case study is the third in a series
Module 1 Educator s Guide: Representative Discussion Points Investigation 3
 Module 1 Educator s Guide: Representative Discussion Points Investigation 3 Ethiopia and Eritrea Our combined population is 59,578,171 people. We have just emerged from a long period of civil war and famine.
COORDINATES OF RURAL DEVELOPMENT WITH LEADER PROGRAM IN COVASNA COUNTY, UNTIL 2014
 LUCRĂRI ŞTIINŢIFICE, SERIA I, VOL.XVII (2) COORDINATES OF RURAL DEVELOPMENT WITH LEADER PROGRAM IN COVASNA COUNTY, UNTIL 2014 KLÁRA - DALMA POLGÁR (DESZKE) 1, LILIANA DUGULEANĂ 2 1 Doctoral student, TRANSILVANIA
PRIMA Open Online Public Consultation
 PRIMA Open Online Public Consultation Short Summary Report Published on 1 June 2016 Research and Introduction Objective of the consultation: to collect views and opinions on the scope, objectives, and
Unit 9 The Middle East SG 1 - Physical Geography, Population & Demographics
 Unit 9 The Middle East SG 1 - Physical Geography, Population & Demographics I. Physical Geography A. The Middle East includes southwestern Asia and North Africa. 1. The name is Eurocentric. Middle East
KNOWLEDGE NOTE 1-3. Hydro-meteorological Disasters Associated with Tsunamis and Earthquakes. CLUSTER 1: Structural Measures
 Public Disclosure Authorized Public Disclosure Authorized Public Disclosure Authorized Public Disclosure Authorized KNOWLEDGE NOTE 1-3 CLUSTER 1: Structural Measures Hydro-meteorological Disasters Associated
IOM KOSOVO NEWSLETTER QUARTERLY EDITION JANUARY MARCH 2018
 IOM KOSOVO NEWSLETTER QUARTERLY EDITION JANUARY MARCH 2018 EU RRK V STARTS CONSTRUCTION OF HOUSES UNDER THE PHASE V OF PROJECT The end of March marked initiation of the EU Return and Reintegration in Kosovo
Al Shura sub-district, 4 November
 Al Shura sub-district, 4 November In the Al Shura sub-district, between Al Qayyarah and Hamam Al Alil, ISIS has been engaged in a large-scale relocation of civilians north to Hamam Al Alil, and then on
North Africa. Chapter 25. Chapter 25, Section
 Chapter 25, Section World Geography Chapter 25 North Africa Copyright 2003 by Pearson Education, Inc., publishing as Prentice Hall, Upper Saddle River, NJ. All rights reserved. Chapter 25, Section World
Kafr Malik Village Profile
 Kafr Malik Village Profile Prepared by The Applied Research Institute Jerusalem Funded by Spanish Cooperation 2012 Acknowledgments ARIJ hereby expresses its deep gratitude to the Spanish agency for International
Overview. On July 14, 2018, the central committee of Hamas' summer camps in the Gaza Strip held a
 Hamas announced the opening of summer camps for children and adolescents in the Gaza Strip. This year summer camps are inspired by the "return marches," and include military training as they do every year
The road by the sea, Environment of Tamariu, Llafranc i Calella. Urbanística 4 Course Fatima Khamar i Gina Pocurull
 The road by the sea, Environment of Tamariu, Llafranc i Calella Escola Politècnica Superior. UdG Nadia Fava i Manel Bosch Urbanística 4 Course 2013-14 Fatima Khamar i Gina Pocurull One of the greatest
ANNUAL REPORT OF THE HUMANITARIAN/RESIDENT COORDINATOR ON THE USE OF CERF GRANTS. Peru. Jorge Chediek
 ANNUAL REPORT OF THE HUMANITARIAN/RESIDENT COORDINATOR ON THE USE OF CERF GRANTS Country Resident Coordinator Reporting Period Peru Jorge Chediek 2008 I. Executive Summary 1 The earthquake that struck
Kafr 'Aqab Village Profile
 Kafr 'Aqab Village Profile Prepared by The Applied Research Institute Jerusalem Funded by Spanish Cooperation 2012 Acknowledgments ARIJ hereby expresses its deep gratitude to the Spanish agency for International
EMERGENCY INTERVENTION AFTER ECUADOR EARTHQUAKE
 ECUADOR EARTHQUAKE EMERGENCY INTERVENTION AFTER ECUADOR EARTHQUAKE April 16, 2016 Emergency Type: Emergency Overview April 19, 2016 Earthquake Emergency Date: April 16, 2016 Location: Emergency effects:
Global Sustainable Tourism Destinations Criteria
 Global Sustainable Tourism Destinations Criteria Draft destination level Global Sustainable Tourism Criteria as proposed after Destinations and International Standards joint working group meeting and follow-up
Statistics of Air, Water, and Land Transport Statistics of Air, Water, and Land. Transport Released Date: August 2015
 Statistics of Air, Water, and Land Transport 2014 2013 1 Released Date: August 2015 Table of Contents Introduction... 4 Key Points... 5 1. Air Transport... 6 1.1 Aircraft movements... 6 1.2 Number of passengers...
COUNTRY OVERVIEW SUPPORTING DATA DONOR REPORT CONTACT
 COUNTRY OVERVIEW SUPPORTING DATA According to the 2008 UNDP report, Uganda is ranked 157th out of 182 countries in the United Nations Human Development Index, with more than 9 million people living on
REGIONAL BOARD REPORT
 REGIONAL BOARD REPORT Administrator s Office For the Board August 21, 2008 DATE: August 14, 2008 FILE NOS.: A-07-06377/8/9.000 FROM: RE: Chief Administrative Officer OCP and Zoning Amendment Application
Population Movement in the Tohoku Region after the Great East Japan Earthquake Disaster
 83 Population Movement in the Tohoku Region after the Great East Japan Earthquake Disaster Takashi ABE Abstract This paper clarifies the demographic change in the Tohoku Region after the Great East Japan
!!!!!!!!!!Mali s Geographic Makeup
 DANU Strategic Forecasting Group May 27th 2016!!!!!!!!!!Mali s Geographic Makeup By Liliana Pirlea Location: Mali is a landlocked country located in West Africa. Mali is the 8th largest country in Africa
UNSD Environment Statistics Self Assessment Tool (ESSAT) and COMESA Environmental Statistics Assessment 2014
 and COMESA Environmental Statistics Assessment 2014") UNITED NATIONS STATISTICS DIVISION (UNSD) Workshop on Environment Statistics in support of the implementation of the Framework for the Development of Environment Statistics (FDES 2013) Balaclava, Mauritius
UNITED NATIONS STATISTICS DIVISION (UNSD) Workshop on Environment Statistics in support of the implementation of the Framework for the Development of Environment Statistics (FDES 2013) Balaclava, Mauritius
PROFILE OF THE PUERTO RICAN POPULATION IN UNITED STATES AND PUERTO RICO: 2008
 PROFILE OF THE PUERTO RICAN POPULATION IN UNITED STATES AND PUERTO RICO: 2008 Sonia G. Collazo, Camille L. Ryan, Kurt J. Bauman U.S. Census Bureau Housing and Household Economic Statistics Division This
Egypt: Bomb Blasts. The situation. DREF operation n 05ME044 2 January 2008
 Egypt: Bomb Blasts DREF operation n 05ME044 2 January 2008 The International Federation s Relief Emergency Fund (DREF) is a source of un-earmarked money created by the Federation in 1985 to ensure that
Sustainable development: 'Lanzarote and the Biosphere strategy'. LIFE97 ENV/E/000286
 Sustainable development: 'Lanzarote and the Biosphere strategy'. LIFE97 ENV/E/000286 Project description Environmental issues Beneficiaries Administrative data Read more Contact details: Project Manager:
Tbilisi Crane Index Q4, KPMG Deal Advisory
 Tbilisi Crane Index Q4, 2017 KPMG Deal Advisory Overview of the Crane Index (1/3) The Crane Index is a tool utilized across the world in order to monitor the activity in the construction sector. By physically
Ethnic Minorities in Alexandria, Egypt: Findings from the 1947and 1960 Population Censuses *
 Ethnic Minorities in Alexandria, Egypt: Findings from the 1947and 1960 Population Censuses * Ayman Zohry, Ph.D. Abstract Historically, Egypt was a land of immigrants not emigrants; a receiving rather than
WFP Chad SPECIAL OPERATION SO
 WFP Chad SPECIAL OPERATION SO 200377. Country: Type of project: Title: Chad Special Operation Provision of Humanitarian Air Services in Chad Total cost (US$): US$17,616,692 Duration: Twelve months (01
SLUM UPGRADATION. Sangay Wangdi Tshewang Giacho Krishna Kafley
 SLUM UPGRADATION Sangay Wangdi Tshewang Giacho Krishna Kafley INTRODUCTION Only about 27.78 % of the total Indian population resides in urban areas. But according to the most recent Census, growth of the
Mediterranean Europe
 Chapter 17, Section World Geography Chapter 17 Mediterranean Europe Copyright 2003 by Pearson Education, Inc., publishing as Prentice Hall, Upper Saddle River, NJ. All rights reserved. Chapter 17, Section
Jaba' Village Profile
 Jaba' Village Profile Prepared by The Applied Research Institute Jerusalem Funded by Spanish Cooperation 2012 Acknowledgments ARIJ hereby expresses its deep gratitude to the Spanish agency for International
2. Introduction to Kurunegala Area : 2.1 Location and History : 2.2 Regional Aspects :
 2. Introduction to Kurunegala Area : 2.1 Location and History : Kurunegala town is the capital of Kurunegala district as well as the capital of North Western Province (Fig 2.1). It has been administered
MEETING CONCLUSIONS. Andean South America Regional Meeting Lima, Peru 5-7 March ECOTOURISM PLANNING
 MEETING CONCLUSIONS Andean South America Regional Meeting Lima, Peru 5-7 March 2002 1.0 ECOTOURISM PLANNING 1.1 Protected Areas Ecotourism in Protected Areas is part of an integrated vision of tourism
MOZAMBIQUE. Drought Humanitarian Situation Report
 UNICEF Mozambique/March 2016 MOZAMBIQUE Drought Humanitarian Situation Report Failed maize crops: UNICEF Mozambique/March, 2016/Bonde SITUATION IN NUMBERS Highlights The Technical Secretariat for Food
SECTOR ASSESSMENT (SUMMARY): Transport, and Information and Communication Technology - Air Transport 1
: Transport, and Information and Communication Technology - Air Transport 1") Air Transport Connectivity Enhancement Project (RRP BHU 44239-013) SECTOR ASSESSMENT (SUMMARY): Transport, and Information and Communication Technology - Air Transport 1 Sector Road Map 1. Sector Performance,
Air Transport Connectivity Enhancement Project (RRP BHU 44239-013) SECTOR ASSESSMENT (SUMMARY): Transport, and Information and Communication Technology - Air Transport 1 Sector Road Map 1. Sector Performance,
Israeli-Egyptian Trade: In-Depth Analysis
 Israeli-Egyptian Trade: In-Depth Analysis YITZHAK GAL BADER ROCK MIDDLE EAST Contents Israeli-Egyptian Economic Relations 3 Israel s Trade With Egypt 6 Egypt s Trade With Israel in Context 10 The Israeli-Egyptian
HEATHROW COMMUNITY NOISE FORUM
 HEATHROW COMMUNITY NOISE FORUM 3Villages flight path analysis report January 216 1 Contents 1. Executive summary 2. Introduction 3. Evolution of traffic from 25 to 215 4. Easterly departures 5. Westerly
PERMANENT MISSION OF BELIZE TO THE UNITED NATIONS
 PERMANENT MISSION OF BELIZE TO THE UNITED NATIONS 675 Third Ave. Suite 1911 New York, New York 10017 Tel: (212) 986-1240/(212) 593-0999 Fax: (212) 593-0932 E-mail: blzun@belizemission.com STATEMENT DELIVERED
D2. Islands and tourism
 5 th European Conference on Sustainable Urban Mobility Plans 14-15 MAY 2018 NICOSIA, CYPRUS D2. Islands and tourism S I M P Year-round Sustainable Island Mobility Planning Alexia Spyridonidou Kosmas Anagnostopoulos
Southern Africa Growing Season : Heading for a Record Drought?
 Southern Africa Growing Season 2015-2016: Heading for a Record Drought? HIGHLIGHTS The current growing season (October 2015 April 2016) in Southern Africa is developing under the peak phase of El Nino
ACRP 01-32, Update Report 16: Guidebook for Managing Small Airports Industry Survey
 ACRP 01-32, Update Report 16: Guidebook for Managing Small Airports Industry Survey Goal of Industry Survey While there are common challenges among small airports, each airport is unique, as are their
Tourism Impacts and Second Home Development in Coastal Counties: A Sustainable Approach
 Tourism Impacts and Second Home Development in Coastal Counties: A Sustainable Approach Brunswick, Currituck and Pender Counties, North Carolina (Funded by North Carolina Sea Grant) Center for Sustainable
HIGH-END ECOTOURISM AS A SUSTAINABLE LAND USE OPTION IN RURAL AFRICA:
 HIGH-END ECOTOURISM AS A SUSTAINABLE LAND USE OPTION IN RURAL AFRICA: THE ROLE OF EMPLOYMENT IN POVERTY REDUCTION & SOCIAL WELFARE Sue Snyman, March 2011 sues@wilderness.co.za INTRODUCTION Rural Communities
DAMASCUS PROVIDING SAFE AND EASY ACCESS TO THE MEDINA. Key words: Planning; Public-transport projects; City-centre regeneration
 DAMASCUS PROVIDING SAFE AND EASY ACCESS TO THE MEDINA Key words: Planning; Public-transport projects; City-centre regeneration Monograph written by Charles SIMON and Julien ALLAIRE, based on the presentation
Water resource situation of the Republic of Djibouti
 Water resource situation of the Republic of Djibouti Omar ASSOWE DABAR Integrating Groundwater Management within River Basins 15-17 January 2019 Nairobi, Kenya Regional Training Workshop on Introduction
Hypsometric demography of Kosovo: the distribution of Kosovo population by altitude
 DOI 10.1186/s40410-016-0047-8 RESEARCH ARTICLE Open Access Hypsometric demography of Kosovo: the distribution of Kosovo population by altitude Rizah Murseli * and Hazer Dana The original version of this
Hurricane Keith Assessment of Damages and Needs Analysis
 Page 1 of 7 The Pan American Health Organization Promoting Health in the Americas National Emergency Management Organization of Belize Damage Assessment and Evaluation Committee Hurricane Keith Assessment
Submission to. Queenstown Lakes District Council. on the
 Submission to Queenstown Lakes District Council on the Queenstown Lakes District Proposed District Plan, Section 32 Evaluation, Stage 2 Components October 2017, for Visitor Accommodation Date: 23 Feb 2018
COUNTRY CASE STUDIES: OVERVIEW
 APPENDIX C: COUNTRY CASE STUDIES: OVERVIEW The countries selected as cases for this evaluation include some of the Bank Group s oldest (Brazil and India) and largest clients in terms of both territory
Dolakha Valley Assessment, Nepal
 Dolakha Valley Assessment, Nepal Dolakha District, June 2015 SITUATION OVERVIEW INTRODUCTION Dolakha District was severely affected by the two major earthquakes that struck Nepal on 25 April and 12 May
Intermediate report. Letter of agreement FAO - GCB/RAB/013/ITA
 Treated waste water for sustainable production of valuable biomass, soil and water quality improvement and combating desertification in Algeria and Tunisia Letter of agreement FAO - GCB/RAB/013/ITA Intermediate
Catchment and Lake Research
 LARS 2007 Catchment and Lake Research Multilateral versus bilateral agreements for the establishment of river based organizations: comparison of legal, economic and social benefits in the Zambian experience.
Tourism diversification of the Malta destination
 Presentation to University of Westminster Tourism Studies students 26 October 2017 Tourism diversification of the Malta destination Dr. John Ebejer Institute for Tourism, Travel and Culture University
FOREIGN TRADE OF KOSOVO AND IMPACT OF FISCAL POLICY
 FOREIGN TRADE OF KOSOVO AND IMPACT OF FISCAL POLICY Agim Berisha, PHD candidate College of Business, Pristine, Kosovo Abstract Negative trading balance is only one of the economical problems by which Kosovo
ECOTOURISM. Hill & Mountain Ecosystems
 ECOTOURISM Hill & Mountain Ecosystems Importance of Hill & Mountain Areas Home to most indigenous populations Provider of essential resources Major source of water supply Centres of culture and indigenous
5 Rail demand in Western Sydney
 5 Rail demand in Western Sydney About this chapter To better understand where new or enhanced rail services are needed, this chapter presents an overview of the existing and future demand on the rail network
Hurricane Irma and Hurricane Maria Disaster Responses
 Hurricane Irma and Hurricane Maria Disaster Responses Helping families displaced by Hurricane Irma and Hurricane Maria Final Report: June 2018 Last year you provided ShelterBox USA with funding to help
SIAVONGA DISTRICT
 SIAVONGA DISTRICT --------------------------------------------------------------------------------------------------------- 1.0 Physical Environment Siavonga District is characterized by an escarpment
Section 61 Recreational Vehicle Park / Campground (Bylaw No. 2012/10)
") Part 7 General Regulations Section 61 Recreational Vehicle Park / Campground (Bylaw No. 2012/10) 61.1 A comprehensive site plan shall be provided to the satisfaction of the Development Authority that shows
Part 7 General Regulations Section 61 Recreational Vehicle Park / Campground (Bylaw No. 2012/10) 61.1 A comprehensive site plan shall be provided to the satisfaction of the Development Authority that shows
Provincial Review 2016: KwaZulu-Natal KwaZulu-Natal
 Provincial Review 2016: KwaZulu-Natal KwaZulu-Natal KwaZulu-Natal has a strong role in South Africa s manufacturing and agriculture, and has its largest port and main North-South freight corridor. Its