FY2016 RESULTS PRESENTATION
|
|
|
- Kristopher Bates
- 5 years ago
- Views:
Transcription


1 FY2016 RESULTS PRESENTATION

2 DISCLAIMER This presentation may contain forward-looking statements which can be identified by the context of the statement and generally arise when the Company is discussing its beliefs, estimates or expectations. Such statements may include comments on industry, business or market trends, projections, forecasts, and plans and objectives of management for future operations and operating and financial performance, as well as any related assumptions. Readers of this presentation should understand that these statements are not historical facts or guarantees of future performance but instead represent only the Company s belief at the time the statements were made regarding future events, which are subject to significant risks, uncertainties and other factors, many of which are outside of the Company s control. Actual results and outcomes may differ materially from what is expressed or implied in such forward-looking statements. The Company cautions readers not to place undue reliance on any forward-looking statements included in this presentation, which speak only as of the date made; and should any of the events anticipated by the forward-looking statements transpire or occur, the Company makes no assurances on what benefits, if any, the Company will derive therefrom. For further information, contact: Mr Lim Kai Ching Tel: (65)


3 TABLE OF CONTENT

4 CORPORATE OVERVIEW 4


5 CORPORATE PROFILE Founded on 17 March 1997 Listed on Singapore Exchange on 17 August 2007 Seoul Bloomberg Code: UNIAF:SP SGX Stock Code: AYF Tokyo Shanghai Guangzhou Taipei Hong Kong Singapore 5

6 BUSINESS MODEL 6
7 BUSINESS SEGMENTS 7
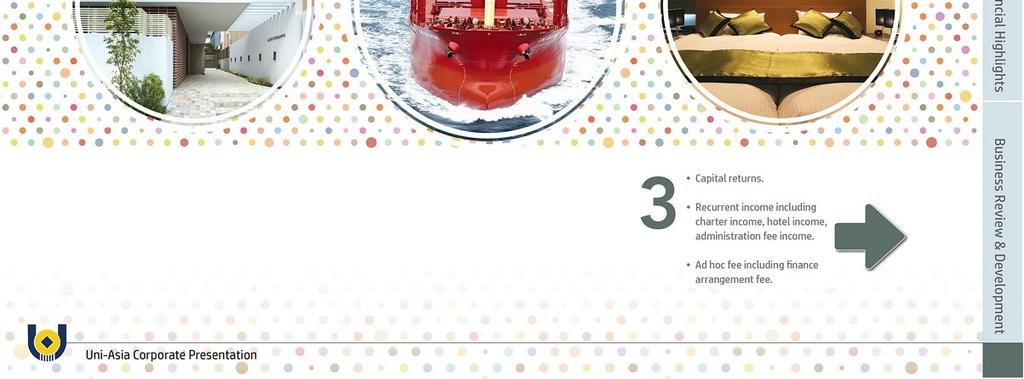
8 INCOME CATEGORIES Five main categories of income: 1. Charter Income 2. Fee Income 3. Hotel Income 4. Investment Returns 5. Interest Income Non-Consolidated Uni-Asia Uni-Asia Shipping Charter Income* Arrangement & Agency Fee Brokerage Commission Incentive Fee Asset Management & Admin Fee (including commercial management fees)* Fee Income Income Type UACJ & UAI Hotel Income* Investment Returns Uni-Asia Hotels Realised Gain / (Loss) Fair Value Adjustment Property Rental* Interest Income* * Recurrent Income 8

9 FINANCIAL HIGHLIGHTS 9
10 PROFIT AND LOSS SUMMARY Due to the continued weak shipping market in FY2016, Under Uni-Asia Shipping, the Group 1. took an impairment loss of $8.6 m for ships held under fixed assets; and 2. provided $3.5m for onerous ship contract. Under Non-consolidated Uni-Asia, the Group booked $7.1m fair valuation losses. As a result, the Group recorded a loss of $12.2m for FY2016. th Financial Year Ended 31 Dec 4 Quarter (US$'000) Total Income 21,817 21,048 4% 86,298 77,052 12% Total Expenses (33,126) (19,079) 74% (92,588) (68,145) 36% Operating Profit (11,309) 1,969 N/M (6,290) 8,907 (171%) Profit/ (Loss) for the Period (12,721) 479 N/M (12,228) 3,520 N/M Profit/ (Loss) attributable to owners of parent (13,624) 5 N/M (14,166) 2,696 N/M (29.00) 0.01 N/M (30.15) 5.74 N/M Earnings/ (Loss) per Share (US Cents) % Change % Change 10
11 PROFIT AND LOSS SUMMARY On the other hand, the Group s investments in property and its hotel operating business mitigated the negative impact of the above losses on the Group s bottomline. th Financial Year Ended 31 Dec 4 Quarter (US$'000) Non-consolidated Uni-Asia Investment & Asset Management of Ships and Properties in Hong Kong/Japan/China Revenue Net Profit / (Loss) (279) Uni-Asia Shipping Ltd. Ship Owning/ Leasing & Chartering Revenue Net Profit / (Loss) 7,925 (11,364) 7,458 (825) UACJ & UAI Investment & Asset Management of Properties in Japan Revenue 1, Net Profit / (Loss) 241 (351) Uni-Asia Hotels Ltd. Hotel Operation in Japan Revenue Net Profit / (Loss) 11, Revenue 21,817 Net Profit / (Loss) (12,721) Group Total 3,440 % Change ,362 % Change 5,048 (32%) 12,486 1,334 (121%) (2,711) 6% N/M 27,974 (13,289) 27, % N/M 166% 8,418 5,470 54% 169% 4,713 3,004 57% 8, % 74% 42, , % 14% 21,048 4% 86,298 77,052 12% 479 N/M (12,228) 3,520 N/M (757) (13%) 258% 11
12 CASH FLOW SUMMARY Notwithstanding the losses, the Group generated a net cash inflow before effect of exchange rates changes of $7.0 million for FY2016, with $12.3 million cash from operating activity. (US$'000) Cash and cash equivalents at beginning of the year Financial Year Ended 31 Dec ,334 36,321 Operating Activity 12,331 10,302 Investing Activity (10,486) (83,623) Financing Activity 5,152 67,533 Net Cash Inflow/(Outflow) for the year 6,997 (5,788) Effect of exchange rate changes (1,779) (199) Cash and cash equivalents at the end of the year 35,552 30,334 Cash Inflow / (Outflow) 12

13 OPERATING CASH FLOW TREND As the Group builds up recurrent charter income with Uni-Asia Shipping portfolio, operating cash flow improves. 13
14 DIVIDEND PROPOSED First and final dividend of 3 Singapore cents per share is proposed for FY
15 BALANCE SHEET SUMMARY Total assets increased with delivery of 9th vessel under Uni-Asia Shipping and acquisition of one ship subsidiary end of March (US$'mil) As at 31-Dec-16 As at 31-Dec-15 Inc / (Dec) Total Assets Total Liabilities Total Equity (14.3) Total Debt *(A) *(A) 21.0 Total Cash 39.9 *(B) 36.3 *(B) 3.6 Net (Debt) / Cash (145.5) (128.1) (17.4) Total Debt / Total Equity (Gearing) NAV per share (US$) (0.30) *(A): Total Debt includes US$3.9 mil borrowing secured by the pledged deposits (31 Dec 2015: US$5.2 mil). *(B): Total Cash includes US$4.3 mil deposits pledged as collateral (31 Dec 2015: US$6.0 mil). 15
16 TOTAL ASSETS ALLOCATION As at 31 December 2016 As at 31 December % 4.3% 12.2% Maritime Investment Property Investment 13.9% 11.6% 12.6% 71.5% 69.4% Cash and Cash Equivalents Others Total Assets: US$327.7m Total Assets: US$314.2m 16

17 GROUP NET ASSETS BY BUSINESS SEGMENTS 17

18 BUSINESS REVIEW & DEVELOPMENT 18


19 UNI-ASIA SHIPPING THE YEAR IN REVIEW The 9th ship under the fleet of Uni-Asia Shipping, M/V Uni Bulker was delivered in January 2016 and time chartered out. 19
20 UNI-ASIA SHIPPING PORTFOLIO Uni-Asia Holdings Limited 100% Uni-Asia Shipping Limited Name of Subsidiary DWT Shipyard Built Charter Status 100% Luna Bulkship S.A. 28,300 Kanda May-2001 Time/Voyage charter 100% Karat Bulkship S.A. * 28,709 Shin-Kurushima Jun-2007 Time/Voyage charter 83% Hope Bulkship S.A. 29,000 Y-Nakanishi May-2011 Time/Voyage charter 100% Imperial Bulkship S.A. 29,100 Y-Nakanishi Jun-2012 Time/Voyage charter 100% Jade Bulkship S.A. 37,000 Onomichi Jun-2013 Time charter 100% Jubilee Bulkship S.A. 37,000 Imabari Jul-2014 Time charter 51% Regina Bulkship S.A. 37,000 Imabari Feb-2015 Time charter 100% Mable Bulkship S.A. 37,000 Imabari Mar-2015 Time charter 100% Nora Bulkship S.A. 37,000 Imabari Jan-2016 Time charter * Bareboat Vessel 20
21 UNI-ASIA SHIPPING FY2016 RESULTS Impairment loss and provision for onerous contracts under Uni-Asia Shipping resulted in a loss of $13.3m. Impairment provided in FY2016 would reduce depreciation expenses for FY2017 for the affected assets. th (US$'000) Quarter 2015 % Change 7,925 7,458 6% 7, , Expenses (18,282) (7,377) Profit from Operation (10,357) Finance costs Financial Year Ended 31 Dec % Change 27,974 27,197 9% (82%) 73% N/M (32%) 28, (1,095) , (397) % (69%) 176% N/M (5%) 148% (37,281) (23,157) 61% 81 N/M (9,307) 4,040 N/M (1,012) (894) 13% (3,987) (3,418) 17% Profit before Tax (11,369) (813) N/M (13,294) 622 N/M Profit after Tax (11,364) (825) N/M (13,289) 613 N/M Turnover Charter Income Fee Income Investment Returns Interest Income Other Income 3% The numbers above are before consolidation adjustment. 21
 Limited ( Joule ) from the Group s co-investor, thereby increasing the Group s shareholding in Joule to 100%. Joule owns a 29,000 DWT dry bulk carrier built in 2012.")
22 NON-CONSOLIDATED UNI-ASIA THE YEAR IN REVIEW Ship Investment On 31 March 2016, the Group completed acquisition of remaining 50% of Joule Asset Management (Pte.) Limited ( Joule ) from the Group s co-investor, thereby increasing the Group s shareholding in Joule to 100%. Joule owns a 29,000 DWT dry bulk carrier built in The Singapore flagged ship is currently being time chartered out. 22

23 NON-CONSOLIDATED UNI-ASIA THE YEAR IN REVIEW Ship Investment On 21 July 2016, the third of the three 18% owned vessel ordered in 2013, named Uni Harmony, was delivered and is currently being time-chartered out. This vessel is commercially managed by Uni-Asia Shipping. 23


24 NON-CONSOLIDATED UNI-ASIA THE YEAR IN REVIEW Hong Kong Property Business 2nd HK Property Project Investment: HKD80.0 million or around USD10.4 million. Location: 650 Cheung Sha Wan Road in Hong Kong Project: A commercial office building to be completed by Original building on the land before demolition Site currently under construction Designer s impression of the completed project (front and back view) 24


25 NON-CONSOLIDATED UNI-ASIA THE YEAR IN REVIEW Hong Kong Property Business 3rd HK Property Project On 13 July 2016, the Group won a bid to develop a commercial site in Hong Kong, as part of a consortium led by First Group Holdings Limited. Location: Kwai Chung Town Lot No. 517 at Tai Lin Pai Road, Kwai Chung, New Territories, Hong Kong 25


26 NON-CONSOLIDATED UNI-ASIA THE YEAR IN REVIEW Hong Kong Property Business 3rd HK Property Project Investment: HKD50.0 million or around USD6.4 million. Project: A commercial office building to be completed by

27 NON-CONSOLIDATED UNI-ASIA THE YEAR IN REVIEW China Property Business The Group invested in 14 office units in China Shine Plaza in Guangzhou China with the total gross area of 1,320 sqm in 2007, and had sold 5 office units with profit before FY2016. In FY2016, 5 office units were sold with realised gain. The Group currently has 4 office units remaining. China Shine Plaza in Guangzhou, China 27
28 NON-CONSOLIDATED UNI-ASIA FY2016 RESULTS Fair valuation losses of ship investments totaling $7.1m affected the performance of Non-Consolidated Uni-Asia th (US$'000) Turnover Charter Income Fee Income Investment Returns Interest Income Other Income Expenses Profit/ (Loss) from Operation Finance costs 4 Quarter 2015 % Change 2016 Financial Year Ended 31 Dec % Change 3,440 5,048 (32%) 12,486 14,362 (13%) 1, , (505) 1,122 2,214 1, % (61%) 5% (66%) N/M 5,606 4, ,257 3,785 7,006 2, % (34%) (64%) (63%) 70% (3,428) (3,268) 5% (14,244) (13,418) (99%) (1,758) (17%) (1,063) (1,623) (35%) 12 (312) 1,780 (374) 944 6% (286%) Profit/ (Loss) before Tax (300) 1,406 (121%) (2,821) (679) N/M Profit/ (Loss) after Tax (279) 1,334 (121%) (2,711) (757) 258% The numbers above are before consolidation adjustment. 28
.")
29 UACJ & UAI THE YEAR IN REVIEW Small Residential Property Business in Japan The Group invests and develops small residential property projects in Tokyo, named ALERO Series. Such investments are now undertaken primarily by our subsidiary, Uni-Asia Investment Ltd ( UAI ). These projects are typically 4-5 storey buildings with units of studio or maisonette type flats, and are popular with working singles/couple. ALERO promotion video on our website: 29


30 UACJ & UAI THE YEAR IN REVIEW Small Residential Property Business in Japan The manager of these small residential property projects is our subsidiary in Japan, Uni-Asia Capital (Japan) ( UACJ ). 30


 23")
 24 HAKUSAN III PROJECT completed")
 ITABASHI-KU 25 SANGENJAYA PROJECT NERIMA-KU completed in Mar")
 SUGINAMI-KU completed in Nov 2014 10 OOKAYAMA3 PROJECT (SOLD)")
 completed in Apr 2016 17 NAKANO")

 completed in Jun 2016 14 TAKADANOBABA PROJECT (LEASING) 19 20 5")
 9 15 12 NAKANO-KU 2 Shinjuku SETAGAYA-KU")

 Completed in Nov 2014 9 MEJIRO PROJECT")

31 SMALL RESIDENTIAL PROJECTS IN TOKYO, JAPAN 1 SHIMOMEGURO PROJECT (SOLD) 20 NAKANO 3-CHOME PROJECT completed in Sep 2012 scheduled for completion in Aug AKEBONOBASHI PROJECT (SOLD) 21 OKUSAWA PROJECT completed in Mar 2013 scheduled for completion in Sep HATAGAYA PROJECT (SOLD) 22 NISHI KAMATA PROJECT completed in Jun 2013 scheduled for completion in Sep SAKURA-SHIMMACHI PROJECT (SOLD) 23 KOMAZAWA DAIGAKU PROJECT completed in Oct 2013 scheduled for completion in Nov HONANCHO PROJECT (SOLD) 24 HAKUSAN III PROJECT completed in Jan 2014 scheduled for completion in Dec SENGOKU PROJECT (SOLD) ITABASHI-KU 25 SANGENJAYA PROJECT NERIMA-KU completed in Mar 2014 scheduled for completion in Mar 2018TOSHIMA-KU 7 OOKAYAMA PROJECT (SOLD) SUGINAMI-KU completed in Nov OOKAYAMA3 PROJECT (SOLD) completion in Jun OTOWA PROJECT (LEASING) completion in Jun HIGASHI SHINJUKU PROJECT (SOLD) completed in Apr NAKANO SAKAUE PROJECT (SOLD) 18 SASAZUKA PROJECT scheduled for completion in Feb HIGASHI KOENJI PROJECT scheduled for completion in Feb SHINJUKU-KU completed in Feb EDOGAWABASHI PROJECT (SOLD) completed in Jun TAKADANOBABA PROJECT (LEASING) completed in Sep HAKUSAN2 PROJECT (SOLD) completed in Sep NISHI WASEDA PROJECT (SOLD) NAKANO-KU 2 Shinjuku SETAGAYA-KU TAITO-KU SUMIDA-KU BUNKYO-KU CHIYODA-KU Akihabara EDOGAWA-KU Marunouchi Tokyo Ginza Akasaka Shibuya SHIBUYA-KU KATSUSHIKA-KU ARAKAWA-KU Ikebukuro completed in Jul CHITOSEFUNABASHI PROJECT (SOLD) Completed in Nov MEJIRO PROJECT (SOLD) ADACHI-KU KITA-KU KOTO-KU CHUO-KU Roppongi MINATO-KU MEGURO-KU Narita International Airport 60 km SHINAGAWAKU-KU OTA-KU PORT OF TOKYO 22 Tokyo International Airport (Haneda)


32 UACJ & UAI THE YEAR IN REVIEW Construction Management Utilising our Small Residential Property project expertise, UACJ helps external clients with construction management of similar projects. 32

33 UACJ & UAI THE YEAR IN REVIEW New Business UACJ/UAI set up a fund investing in a hostel business project where a building was rented in Nihonbashi-Yokoyamacho, converted into a hostel and sub-leased to a hostel operator. This is a new business area which will widen the Group s property expertise. Artist s impression of the completed hostel. 33
34 UACJ & UAI FY2016 RESULTS UACJ/UAI continue to lead the Group s profit with outstanding fee income (including incentive fee) and investment returns th (US$'000) Turnover Fee Income Investment Returns Interest Income Other Income Expenses Quarter 2015 % Change Financial Year Ended 31 Dec % Change 1, % 8,418 5,470 54% (11)% N/M 18% (67)% 2,937 4, ,561 2, % 85% 129% (20)% (733) 42% (2,795) (2,126) 31% (1,040) Profit from Operation 268 (242) 211% 5,623 3,344 68% Finance costs Profit before Tax (39) 229 (74) (316) (47)% 172% (254) 5,369 (219) 3,125 16% 72% Profit after Tax 241 (351) 169% 4,713 3,004 57% The numbers above are before consolidation adjustment. 34


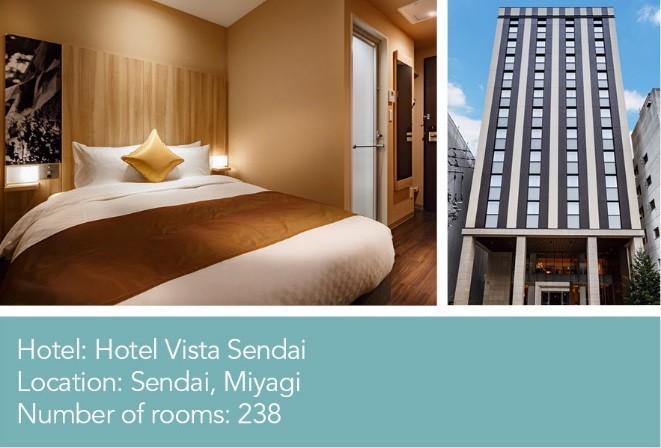
35 UNI-ASIA HOTELS THE YEAR IN REVIEW New Hotels Under Operations Hotel Vista Sendai opened on 27 April rooms Hotel Vista Sendai, the 10th hotel operated by the Group, opened on 27 April This is the first time VHM operates Hotel Vista in Tohoku area. The hotel is approximately 4 minutes walk from Sendai station and next to subway station, Miyagino-dori station. 35


36 UNI-ASIA HOTELS THE YEAR IN REVIEW New Hotels to be Operated by the Group Hotel Vista Premio Yokohama Minato-Mirai - scheduled for grand opening on 30 June 2017 This hotel has 232 rooms and is located in Minato Mirai 21 in Yokohama Bay area. This hotel features a lobby on the top floor of the hotel with a magnificent view of Yokohama Bay (see below). 36


37 UNI-ASIA HOTELS THE YEAR IN REVIEW New Hotels to be Operated by the Group Hotel Vista Nagoya Nishiki - scheduled for grand opening in September 2017 Current construction progress Artist s impression The hotel, which will have 143 rooms, is currently under construction. This is the first time the Group shall operate a Vista hotel in Nagoya. Nagoya ranks amongst Tokyo and Osaka as one of the biggest city in Japan. The location of the hotel is in the downtown area of Nagoya. UACJ is the asset manager of this project. 37


38 UNI-ASIA HOTELS THE YEAR IN REVIEW New Hotels to be Operated by the Group Hotel Vista Premio Tokyo Akasaka - scheduled for opening in 2018 spring The hotel is currently in construction planning phase and 140 rooms are currently being planned. The location of the hotel is in the downtown area of Tokyo. Akasaka is one of the famous commercial area in Tokyo located west of the government centre in Nagatachō and north of the Roppongi district. Original building at the site before demolition Existing site after demolition of original building 38


39 UNI-ASIA HOTELS THE YEAR IN REVIEW New Hotels to be Operated by the Group Hotel Vista Hiroshima - scheduled for opening in 2018 summer The hotel is currently under construction and 228 rooms are currently being planned. The location of the hotel is in the most famous commercial area of Hiroshima. Hiroshima is home to two World Heritage sites: Atomic Bomb Dome and Itsukushima Shinto Shrine. Original building at the site before demolition Existing site after demolition of original building 39
 - scheduled for opening in 2018 summer The")

40 UNI-ASIA HOTELS THE YEAR IN REVIEW New Hotels to be Operated by the Group Hotel Vista Premio Kyoto Shinmachi Takoyakushi (tentative name) - scheduled for opening in 2018 summer The hotel is currently under planning phase and 84 rooms are currently being planned. The location of the hotel is in the centre of Kyoto. Existing site after demolition of original building 40


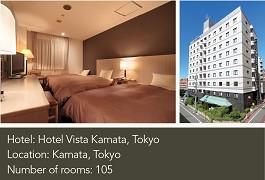
41 UNI-ASIA HOTELS Current Portfolio of Hotels Under Operations New 41


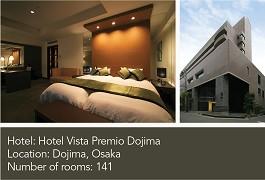

42 UNI-ASIA HOTELS Current Portfolio of Hotels Under Operations 42


43 UNI-ASIA HOTELS Our new Hotel Vista Sendai was featured in a leisure magazine in Japan 43
44 UNI-ASIA HOTELS FY2016 RESULTS The Group s hotel operations continue to make stable contribution to the Group s bottomline th (US$'000) 4 Quarter 2015 % Change 2016 Turnover Hotel Income Interest Income Other Income 11,635 8,764 33% 42,246 33,630 26% 11,542 8,647-33% (21)% 41, , % 0% (5)% (8,400) 32% (41,184) (32,707) 26% 57% 1, (11,064) Expenses Profit / (Loss) from Operation 571 (11) Finance costs Financial Year Ended 31 Dec % Change (7) 57% (37) % (33) 12% Profit/ (Loss) before Tax % 1, % Profit / (Loss) after Tax % % 82.6% % 9 (1)% 81.3% % 9 (3)% Occupancy Rate No. of hotels operated (1) The numbers abov e are before consolidation adjustment. 44

, Chairman of SGX Listings Advisory Committee and Mr. Christopher Cheong, Chairman of SIAS Award Selection Committee.")
45 INVESTOR RELATIONS 17th SIAS INVESTORS' CHOICE AWARDS MOST TRANSPARENT COMPANY AWARD 2016 The Group clinched Runner Up in the SIAS Investors Choice Awards Most Transparent Company Award 2016, Mainboard Small Caps Category in the 17th Investors Choice Awards organized by the Securities Investors Association of Singapore ( SIAS ). This is the second year the Group was awarded Most Transparent Company Award. Uni-Asia Group CFO Mr. Lim Kai Ching (center) receiving the award from Mr. Gautam Banerjee (left), Chairman of SGX Listings Advisory Committee and Mr. Christopher Cheong, Chairman of SIAS Award Selection Committee. (Photo courtesy of SIAS) 45
46 INVESTOR RELATIONS Governance and Transparency Index 2016 The Group was ranked 82nd amongst all listed companies in Singapore in the Governance and Transparency Index 2016 prepared by Centre for Governance, Institution and Organisations (CGIO), NUS Business School. The Group has ranked within the top 100 since Year Overall GTI Score Rank
47 THANK YOU
3Q2017 RESULTS PRESENTATION
 3Q2017 RESULTS PRESENTATION DISCLAIMER This presentation may contain forward-looking statements which can be identified by the context of the statement and generally arise when the Company is discussing
FY2017 RESULTS PRESENTATION
 FY2017 RESULTS PRESENTATION DISCLAIMER This presentation may contain forward-looking statements which can be identified by the context of the statement and generally arise when the Company is discussing
1Q2018 RESULTS PRESENTATION
 1Q2018 RESULTS PRESENTATION DISCLAIMER This presentation may contain forward-looking statements which can be identified by the context of the statement and generally arise when the Company is discussing
Supplementary Material
 Supplementary Material Fiscal 2017 (April 1, 2017 - March 31, 2018) Sumitomo Realty & Development Co., Ltd. Results for Fiscal 2017 (Apr 1, 2017 Mar 31, 2018) Financial Results / Forecasts (Billions of
GLOBAL PROMINENCE 2019 Aiming for Global Growth and Advancement
 This document is an English summary translation of a statement written initially in Japanese. The original Japanese should be considered the primary version. GLOBAL PROMINENCE 2019 Aiming for Global Growth
Golden Ocean Group Limited Q results March 1, 2007
 Golden Ocean Group Limited Q4 2006 results March 1, 2007 PROFIT & LOSS 2005 2006 (in thousands of $) 2006 2005 Oct-Dec Oct-Dec Jan - Dec Jan - Dec Operating Revenues 37 292 91 253 Time charter revenues
COSCO CORPORATION. (SINGAPORE) LTD FY2003 Full Year Results. Presentation
 LTD FY2003 Full Year Results. Presentation") COSCO CORPORATION (SINGAPORE) LTD FY2003 Full Year Results Presentation 11 February 2004 1 Outline of Presentation 1. Background & Corporate Restructuring Exercise 2. Operations Review 3. Financial Review
COSCO CORPORATION (SINGAPORE) LTD FY2003 Full Year Results Presentation 11 February 2004 1 Outline of Presentation 1. Background & Corporate Restructuring Exercise 2. Operations Review 3. Financial Review
Air China Limited Annual Results. March Under IFRS
 Air China Limited 21 Annual Results Under IFRS March 211 Agenda Part 1 Highlights Part 2 Business Overview Part 3 Financial Overview Part 4 Outlook 2 Part 1 Highlights Steady Economic Growth; Asia Pacific
Cebu Air, Inc. 4 th Quarter and Full Year 2017 Results of Operations. cebupacificair.com
 Cebu Air, Inc. 4 th Quarter and Full Year 2017 Results of Operations cebupacificair.com Disclaimer The information provided in this presentation is provided only for your reference. Such information has
Presentation on Results for the 2nd Quarter FY Idemitsu Kosan Co.,Ltd. November 14, 2018
 Presentation on Results for the 2nd Quarter FY 2018 Idemitsu Kosan Co.,Ltd. November 14, 2018 Table of Contents 1. FY 2018 2nd Quarter Financials (1) Overview (2) Segment Information 2. Reference Materials
Summary of Results for the First Three Quarters FY2015/3
 Summary of Results for the First Three Quarters FY2015/3 February 10, 2015 Tokyu Corporation (9005) http://www.tokyu.co.jp/ Contents Ⅰ.Executive Summary 2 Ⅱ.Conditions in Each Business 5 Ⅲ.Details of Financial
November 8, 2018 Hoosiers Holdings (3284) Second Quarter Fiscal Year Ending March 2019 Explanatory Materials on Financial Results
 Second Quarter Fiscal Year Ending March 2019 Explanatory Materials on Financial Results") November 8, 2018 Hoosiers Holdings (3284) Second Quarter Fiscal Year Ending March 2019 Explanatory Materials on Financial Results Agenda 1. Company information Company overview Group structure History
November 8, 2018 Hoosiers Holdings (3284) Second Quarter Fiscal Year Ending March 2019 Explanatory Materials on Financial Results Agenda 1. Company information Company overview Group structure History
Presentation on Results for the 2nd Quarter FY Idemitsu Kosan Co.,Ltd. November 1, 2016
 Presentation on Results for the 2nd Quarter FY 2016 Idemitsu Kosan Co.,Ltd. November 1, 2016 Table of Contents 1. 2nd Quarter FY 2016 Financials (1) Overview (2) Segment Information 2. Reference Materials
Management Presentation. March 2016
 Management Presentation March 2016 Forward looking statements This presentation as well as oral statements made by officers or directors of Allegiant Travel Company, its advisors and affiliates (collectively
Notice Concerning Increase in Ownership of the Shin-Kojimachi Building. Details
 For Immediate Release November 11, 2004 Japan Prime Realty Investment Corporation Hirohito Kaneko Executive r (Securities Code: 8955) Inquiries: Tokyo Realty Investment Management, Inc. Takeshi Maki Director
Cathay Pacific Airways Interim Results for the six months ended 30 June 2012
 Cathay Pacific Airways Interim Results for the six months ended 30 June 2012 8 August 2012 1 Interim Result 1H2012 1H2011 Change Group attributable (loss) / profit HK$ million (935) 2,808-133.3% Group
Cebu Air, Inc. 2Q2014 Results of Operation
 Cebu Air, Inc. 2Q2014 Results of Operation 1 Disclaimer This information provided in this presentation is provided only for your reference. Such information has not been independently verified and, as
1Q FY2014/15. Financial Results Presentation. 13 August 2014 S Y D N E Y M E L B O U R N E B R I S B A N E C A I R N S
 1Q FY2014/15 Financial Results Presentation 13 August 2014 S Y D N E Y M E L B O U R N E B R I S B A N E C A I R N S B E I J I N G T O K Y O O S A K A S I N G A P O R E Disclaimer This presentation on
Presentation on Results for the 1st Quarter FY Idemitsu Kosan Co.,Ltd. August 14, 2017
 Presentation on Results for the 1st Quarter FY 2017 Idemitsu Kosan Co.,Ltd. August 14, 2017 Table of Contents 1. FY 2017 1st Quarter Financials (1) Overview (2) Segment Information 2. Reference Materials
Financial Position (consolidated)
") May 14 th, 2015 Disclaimer This presentation is for informational purposes only, contains preliminary financial and other information about Korean Air Lines Co., Ltd. and is subject to updating, revision,
May 14 th, 2015 Disclaimer This presentation is for informational purposes only, contains preliminary financial and other information about Korean Air Lines Co., Ltd. and is subject to updating, revision,
Notice Concerning the Change of Company Regulations (Management Guidelines of Office REIT Department) of the Asset Management Company
 of the Asset Management Company") Translation of Japanese Original To All Concerned Parties December 1, 2017 REIT Issuer: Kenedix Office Investment Corporation Naokatsu Uchida, Executive Director (Securities Code: 8972) Asset Management
Translation of Japanese Original To All Concerned Parties December 1, 2017 REIT Issuer: Kenedix Office Investment Corporation Naokatsu Uchida, Executive Director (Securities Code: 8972) Asset Management
FULL YEAR FINANCIAL REPORT
 FULL YEAR FINANCIAL REPORT 1 Jan 31 Dec 2013 27 February 2014 ANALYST / MEDIA BRIEFING Artist s Impression of Lush Acres FINANCIAL HIGHLIGHTS Artist s Impression of D Nest KEY FINANCIAL HIGHLIGHTS Delivered
Interim Report 6m 2014
 August 11, 2014 Interim Report 6m 2014 Investors and Analysts Conference Call on August 11, 2014 Joachim Müller, CFO Latest ad-hoc release (August 4, 2014) Reduction of forecast, primarily due to a further
HK GAAP RESULTS RELEASE 18 November 2005
 HK GAAP RESULTS RELEASE 18 November 2005 FOR IMMEDIATE RELEASE INTERNATIONAL STAR CRUISES GROUP ANNOUNCES THIRD QUARTER AND FIRST NINE MONTHS RESULTS FOR 2005 Key points for the quarter in comparison with
Financial Results 3 rd Quarter MAR/2016 (FY2015)
") Financial Results MAR/2016 (FY2015) January 29 th, 2016 CONTENTS P.1 P.2 P.3 P.4~ Overview of FY MAR/16 Results Operating Revenue Operating Profit 1,030 1,020 1,010 +1.0Bn 1,022.3 1,023.4 (+0.1%) 180 160
Financial Results MAR/2016 (FY2015) January 29 th, 2016 CONTENTS P.1 P.2 P.3 P.4~ Overview of FY MAR/16 Results Operating Revenue Operating Profit 1,030 1,020 1,010 +1.0Bn 1,022.3 1,023.4 (+0.1%) 180 160
Management Presentation. November 2011
 Management Presentation November 2011 Forward looking statements This presentation as well as oral statements made by officers or directors of Allegiant Travel Company, its advisors and affiliates (collectively
Q2 FY2011 Results Presentation
 A Structured Ship Finance Provider Q2 FY2011 Results Presentation g l o b a l p a r t n e r f o r p r e m i u m o p e r a t o r s 1 Important Notice This presentation has been prepared by PST Management
Air China Limited Interim Results. August Under IFRS
 Air China Limited 21 Interim Results Under IFRS August 21 1 Agenda 21 Interim Results Overview Business Overview Financial Overview Outlook 2 2 2 21 Interim Results 3 21 Interim Results Overview 4 4 4
First Half of Fiscal Year Ending March 31, 2009
 HEIWA REAL ESTATE CO., LTD. First Half of 31, 2009 HEIWA REAL ESTATE CO., LTD. Nov. 12, 2008 Security Code: 8803 CONTENTS Page Page Consolidated Financial Results for First Half of 31, 2009 3 Housing -
Positive rental reversions in Hong Kong portfolio. Rising contribution from Singapore office portfolio. Strong performance from Residential business
 2012 Review The Group performed well in 2012 Positive rental reversions in Hong Kong portfolio Rising contribution from Singapore office portfolio Strong performance from Residential business 2 Highlights
KSH HOLDINGS LIMITED. Corporate Presentation May 27, 2014
 KSH HOLDINGS LIMITED Corporate Presentation May 27, 2014 KSH Corporate Presentation OVERVIEW KSH Holdings Limited RESULTS FY2014 UPDATES Corporate Developments OUTLOOK Strategies Moving Forward CONCLUSION
Oxley Delivers Stellar Growth of 58% in PATMI to. S$130.9 million for HY2017
 For immediate release Oxley Delivers Stellar Growth of 58% in PATMI to S$130.9 million for HY2017 - Half-year revenue increased by 19% year-on-year to S$732.2 million - Gross profit margin increased from
CapitaLand Limited. Proposed Acquisition Of A Portfolio Of Office And Retail Assets In Greater Tokyo, Japan
 CapitaLand Limited Proposed Acquisition Of A Portfolio Of Office And Retail Assets In Greater Tokyo, Japan 17 February 2017 Disclaimer This presentation may contain forward-looking statements that involve
Investor Meeting Presentation. 4 June 2014
 Investor Meeting Presentation 4 June 2014 COMPANY OVERVIEW 1Q2014 RESULTS OVERVIEW OPERATION HIGHLIGHTS Q&A 2 Founded in 1963, listed on the Singapore Exchange in 1964 Three core businesses: - Property
Year ended December 31, 2012
 Consolidated Earnings Report - Supplementary Information Consolidated Results ( ) 1. Consolidated Financial Highlights 2. Major Sales Sales Volume Data 3. Condensed Consolidated Statements of Income Condensed
PAN PACIFIC HOTELS GROUP LIMITED 2010 FULL YEAR RESULTS BRIEFING 22 FEB 2011
 PAN PACIFIC HOTELS GROUP LIMITED 2010 FULL YEAR RESULTS BRIEFING 22 FEB 2011 2010 RESULTS OVERVIEW STRATEGIC & OPERATIONS HIGHLIGHTS NEO SOON HUP CHIEF FINANCIAL OFFICER 2 CONTENTS Focus and Highlights
Presentation on Results for the 3rd Quarter FY Idemitsu Kosan Co.,Ltd. February 14, 2019
 Presentation on Results for the 3rd Quarter FY 2018 Idemitsu Kosan Co.,Ltd. February 14, 2019 Table of Contents 1. FY 2018 3rd Quarter Results (1) Overview (2) Segment Information 2. Forecast for FY 2018
SAS AB Analyst meeting
 SAS AB Analyst meeting London, August 9, 2001 2 2nd Quarter a tough Quarter The Marketplace Continued weak world economy Weaker Swedish economy SAS Weaker traffic growth and reduced passenger load factors
Management Presentation. November 2018
 Management Presentation November 2018 Forward looking statements This presentation as well as oral statements made by officers or directors of Allegiant Travel Company, its advisors and affiliates (collectively
CORPORATE STEVE BOOKING SMITH CHANNELS
 JAPAN AIRLINES: NAVIGATING THE FUTURE Steve Myer, Tokyo September 30, 2016 CORPORATE STEVE BOOKING SMITH CHANNELS VICE PRESIDENT, GLOBAL & STRATEGIC SALES, THE AMERICAS SEPTEMBER 20, 2016 RENO, NEVADA
Tat Hong Reports 13% Decline in FY2017 Revenue
 FOR IMMEDIATE RELEASE Registration No: 199105392H Tat Hong Reports 13 Decline in FY2017 Revenue - Cash and cash equivalents of S$114.3 million - Cash flow from operations of S$85.2 million - Net gearing
Final Results 31 December 2013
 Final Results 31 December 2013 Clarkson PLC 10 March 2014 www.clarksons.com Agenda Headline results Divisional performance Business Model & Strategy The market Outlook 10 March 2014 Final Results www.clarksons.com
2017 Half-Yearly Results
 2017 Half-Yearly Results Presentation 4th August 2017 Agenda Speakers: Robert Wong, Chief Executive & Simon Dixon, Chief Financial Officer 1. 2017 Half-Yearly Highlights 2. Investment Properties 3. Development
HK GAAP RESULTS RELEASE 12 August 2008 STAR CRUISES GROUP ANNOUNCES FIRST HALF RESULTS FOR 2008
 HK GAAP RESULTS RELEASE 12 August 2008 FOR IMMEDIATE RELEASE INTERNATIONAL STAR CRUISES GROUP ANNOUNCES FIRST HALF RESULTS FOR 2008 The below commentary is prepared based on the comparison of the results
Cathay Pacific Airways 2010 Annual Results 9 March 2011
 Cathay Pacific Airways 2010 Annual Results 9 March 2011 1 Annual Result 2010 2009 Change Group Profit/(Loss) HK$14,048m HK$4,694m +199.3% Group Turnover HK$89,524m HK$66,978m +33.7% Profit Margin 15.7%
Executive Directors Review
 Financial Summary Turnover for the year ended 31 December 2011 amounted to HK$571.4 million ( 47.6 million) (2010: HK$706.8 million ( 58.7 million)). The turnover was principally attributable to the recognition
Investor update presentation. November 2016
 Investor update presentation November 2016 Content Update on Q3 2016 financial performance 3-8 Recap on ATG Evolution 9-10 Update on hospitality strategic business unit 11-14 Update on online travel and
Notice Concerning Amendment to Memorandum of Understanding on Preferential Negotiation Rights
 To All Concerned Parties [For Information Purpose Only] December 22, 2016 Name of REIT Issuer: Invincible Investment Corporation Name of representative: Naoki Fukuda, Executive Director Roppongi Hills
Summary of Results for the First Quarter of FY2015/3
 Summary of for the First Quarter of FY2015/3 August 8, 2014 Tokyu Corporation (9005) http://www.tokyu.co.jp/ Contents Ⅰ.Executive Summary 2 Ⅱ.Conditions in Each Business 4 Ⅲ.Details of Financial for the
Management Presentation. September 2011
 Management Presentation September 2011 Forward looking statements This presentation as well as oral statements made by officers or directors of Allegiant Travel Company, its advisors and affiliates (collectively
Tiger Airways Holdings Limited FY11 Results
 Tiger Airways Holdings Limited FY11 Results May 2011 Financial Year Ended 31 March 2011 Disclaimer The information contained in this presentation (the "Information") is provided by Tiger Airways Holdings
VERY GOOD RESULTS IN OUR MOST IMPORTANT QUARTER
 VERY GOOD RESULTS IN OUR MOST IMPORTANT QUARTER Q3 EBITDA USD 161.8 million, as compared to USD 155.6 million in the corresponding quarter last year 19% increase in passenger numbers on international flights
Cathay Pacific Airways Limited Abridged Financial Statements
 To provide shareholders with information on the results and financial position of the Group s significant listed associated company, Cathay Pacific Airways Limited, the following is a summary of its audited
2016 Half-Yearly Results
 Presentation 29th July 2016 2016 Half-Yearly Review Underlying profit down 6% Commercial portfolio benefited from higher occupancy Steady contribution from mainland China residential business Profit attributable
Presentation on Results for the 3rd Quarter FY Idemitsu Kosan Co.,Ltd. February 14, 2018
 Presentation on Results for the 3rd Quarter FY 2017 Idemitsu Kosan Co.,Ltd. February 14, 2018 Table of Contents 1. FY 2017 3rd Quarter Results (1) Overview (2) Segment Information 2. Forecast for FY2017
INVESTOR PRESENTATION. Imperial Capital Global Opportunities Conference September 2015
 INVESTOR PRESENTATION Imperial Capital Global Opportunities Conference September 2015 Forward-looking Statements This presentation contains forward-looking statements within the meaning of the Private
HK GAAP RESULTS RELEASE 25 February 2008 STAR CRUISES GROUP ANNOUNCES FOURTH QUARTER AND FULL YEAR RESULTS FOR 2007
 HK GAAP RESULTS RELEASE 25 February 2008 FOR IMMEDIATE RELEASE INTERNATIONAL STAR CRUISES GROUP ANNOUNCES FOURTH QUARTER AND FULL YEAR RESULTS FOR 2007 Key points for the quarter in comparison with 4Q
Management Presentation. May 2013
 Management Presentation May 2013 Forward looking statements This presentation as well as oral statements made by officers or directors of Allegiant Travel Company, its advisors and affiliates (collectively
Credit Suisse. 19 th Annual AIC 8 th April Cathay Pacific Airways Limited
 Credit Suisse 19 th Annual AIC 8 th April 2016 Cathay Pacific Airways Limited Annual Results - 2015 Group Financial Statistics 2015 2014 % Var Group Revenue HK$m 102,342 105,991-3.4% Group attributable
Presentation Results. 4th March 2016
 Presentation 4th March 2016 2015 Review Sound result in 2015 Continued strong performance from commercial portfolio Entry into Shanghai with prime mixed-use site Stable asset values 1 Highlights 2014 2015
Analyst and Investor Conference Call Q Ulrik Svensson, CFO and Member of the Executive Board
 Analyst and Investor Conference Call Q2 2017 Ulrik Svensson, CFO and Member of the Executive Board Frankfurt, 2 August 2017 Disclaimer The information herein is based on publicly available information.
Cathay Pacific Airways
 Cathay Pacific Airways Annual Results for the year ended 31 st December 2011 14 March 2012 1 Annual Result 2011 2010 Change Group attributable profit HK$5,501m HK$14,048m -60.8% Group Turnover HK$98,406m
INVESTOR PRESENTATION. May 2015
 INVESTOR PRESENTATION May 2015 Forward-looking Statements This presentation contains forward-looking statements within the meaning of the Private Securities Litigation Reform Act of 1995 that reflect the
Korean Air Q Financial Results. Jul 28, 2011
 Korean Air 2011 2Q Financial Results Jul 28, 2011 Disclaimer This presentation is for informational purposes only, contains preliminary financial and other information about Korean Air Lines Co., Ltd.
Centurion Corporation Limited
 Centurion Corporation Limited Corporate Presentation 6 January 2014 Disclaimer This presentation and the accompanying presentation materials (if any) ("Presentation") are made for informational purposes,
Indiabulls Real Estate Limited (CIN : L45101DL2006PLC148314)
") Indiabulls Real Estate Limited (CIN : L45101DL2006PLC148314) Earnings Update Audited Financial Results FY 2013-14 April 23, 2014 Safe Harbor Statement This document contains certain forward looking statements
Indiabulls Real Estate Limited (CIN : L45101DL2006PLC148314) Earnings Update Audited Financial Results FY 2013-14 April 23, 2014 Safe Harbor Statement This document contains certain forward looking statements
Presentation on Results for the 3rd Quarter FY Idemitsu Kosan Co.,Ltd. February 2, 2016
 Presentation on Results for the 3rd Quarter FY 2015 Idemitsu Kosan Co.,Ltd. February 2, 2016 Table of Contents 1. 3 rd Quarter FY 2015 Financials (1) Overview (2) Segment Information 2. Forecast for FY
Megawide Construction Corporation FY 2016 Analysts Briefing 06 April 2017
 Megawide Construction Corporation FY 2016 Analysts Briefing 06 April 2017 FY 2016 CONSOLIDATED HIGHLIGHTS +14% P17.7B Revenue +19% P3.6B EBITDA +30% P1.9B Net Income 1 1 CONSOLIDATED INCOME STATEMENT 2
Cathay Pacific Airways
 Cathay Pacific Airways Interim Results for the six months ended 30 th June 2014 13th August 2014 1 Interim Results 1H2014 1H2013 Change Profit attributable to the shareholders of Cathay Pacific HK$ million
Cathay Pacific Airways Limited Abridged Financial Statements
 To provide shareholders with information on the results and financial position of the Group s significant listed associated company, Cathay Pacific Airways Limited, the following is a summary of its audited
PRESS ANNOUNCEMENT JULY 28, 1999 For Immediate Release STAR CRUISES REPORTS RECORD SECOND QUARTER EARNINGS
 PRESS ANNOUNCEMENT JULY 28, 1999 For Immediate Release STAR CRUISES REPORTS RECORD SECOND QUARTER EARNINGS STAR CRUISES PLC announced record net income of US$20.7 million (US 3.3 cents earnings per share)
Cathay Pacific Airways 2011 Interim Results 10 August 2011
 Cathay Pacific Airways 2011 Interim Results 10 August 2011 1 Interim Result 1H 2011 1H 2010 Group profit HK$2,808m HK$6,840m Group turnover HK$46,791 HK$41,337m Profit margin 6.0% 16.5% Return on capital
Analysts Briefing. 18 March Cathay Pacific Airways Limited
 Analysts Briefing 18 March 2015 Cathay Pacific Airways Limited Annual Results 2014 2013 Change Group attributable profit HK$m 3,150 2,620 +20.2% Group turnover HK$m 105,991 100,484 +5.5% Profit margin
JET AIRWAYS (I) LTD. Presentation on Financial Results Q3 2012
 LTD. Presentation on Financial Results Q3 2012") JET AIRWAYS (I) LTD Presentation on Financial Results Q3 2012 20.01.2012 1 1 1 Domestic operating environment 2 2 2 Domestic industry. 8.00 7.00 6.00 5.00 4.00 3.00 Q3 12 vs Q3 11 Industry capacity 17%
JET AIRWAYS (I) LTD Presentation on Financial Results Q3 2012 20.01.2012 1 1 1 Domestic operating environment 2 2 2 Domestic industry. 8.00 7.00 6.00 5.00 4.00 3.00 Q3 12 vs Q3 11 Industry capacity 17%
RESULTS RELEASE 20 August GENTING HONG KONG GROUP ANNOUNCES FIRST HALF RESULTS FOR 2015 Highlights
 RESULTS RELEASE 20 August 2015 FOR IMMEDIATE RELEASE INTERNATIONAL GENTING HONG KONG GROUP ANNOUNCES FIRST HALF RESULTS FOR 2015 Highlights The commentary below is prepared based on a comparison of the
Fourth Quarter and Full Year 2009
 Investor and analyst meeting: Fourth Quarter and Full Year 29 25 th February 21 2 The views expressed here contain some information derived from publicly available sources that have not been independently
Financial results Presentation For the nine months ended Dec. 31, 2014 Resorttrust, Inc. Securities code 4681
 Financial results Presentation For the nine months ended Dec. 31, 2014 Resorttrust, Inc. Securities code 4681 Upper:Exterior view Lower: -type living room Upper:Open-air Bath Lower:Entrance lobby XIV Yugawara
INVESTOR RELATIONS Earnings Release
 INVESTOR RELATIONS 2017 2017 Earnings Release 1 Disclaimer This document contains parent results for 2017 based on K-IFRS. These statements involve risks and uncertainties, and actual results may differ.
Copa Holdings Reports Record Earnings of US$41.8 Million for 4Q06 and US$134.2 Million for Full Year 2006
 Copa Holdings Reports Record Earnings of US$41.8 Million for 4Q06 and US$134.2 Million for Full Year 2006 Panama City, Panama --- March 7, 2007. Copa Holdings, S.A. (NYSE: CPA), parent company of Copa
Q3 FY18 Business Highlights
 Q3 FY18 RESULTS Q3 FY18 Business Highlights 1 2 3 4 5 6 7 Record passengers 7.1m, record revenues 423m Investing in growth 24% passenger growth in Q3 Disciplined cost management flat ex-fuel CASK Largest
Melco International Development Limited (Incorporated in Hong Kong with limited liability) Website : (Stock Code : 200)
 Website : (Stock Code : 200)") Hong Kong Exchanges and Clearing Limited and The Stock Exchange of Hong Kong Limited take no responsibility for the contents of this announcement, make no representation as to its accuracy or completeness
Hong Kong Exchanges and Clearing Limited and The Stock Exchange of Hong Kong Limited take no responsibility for the contents of this announcement, make no representation as to its accuracy or completeness
JET AIRWAYS (I) LTD. Presentation on Financial Results Q July 24, 2009
 LTD. Presentation on Financial Results Q July 24, 2009") JET AIRWAYS (I) LTD Presentation on Financial Results Q1 2010 July 24, 2009 1 1 1 Agenda Domestic operating environment Jet Airways performance highlights JetLite performance highlights Outlook 2 2 2 Domestic
JET AIRWAYS (I) LTD Presentation on Financial Results Q1 2010 July 24, 2009 1 1 1 Agenda Domestic operating environment Jet Airways performance highlights JetLite performance highlights Outlook 2 2 2 Domestic
 FINANCIAL STATEMENT AND RELATED ANNOUNCEMENT https://www1.sgxnet.sgx.com/sgxnet/lcanncsubmission.nsf/vwprint/f844e4b372cc79d4482578e900280e08?open... Page 1 of 1 12/8/2011 Print this page Presentation
MGM Resorts International Reports Second Quarter Financial Results
 NEWS RELEASE MGM Resorts International Reports Second Quarter Financial Results 8/5/2014 Consolidated Adjusted EBITDA Increased 8%, Led By 10% Growth In Wholly Owned Domestic Resorts MGM China Declares
Summary o f Results for the First Half of FY2018
 Summary o f Results for the First Half of FY2018 November 9, 2018 (9005) https://www.tokyu.co.jp/ Contents Ⅰ.Executive Summary 2 Ⅱ.Conditions in Each Business 6 Ⅲ.Details of Financial Results for the 13
Results of Operations
 For the First Half of the Fiscal Year Ending September 30, 2018 Results of Operations Evolable Asia Corp. TSE Mothers: 6191 May 15, 2018 Highlights DeNA Travel, the largest Japanese OTA in overseas air
2012 Full Year Results Briefing. 28 February 2013
 2012 Full Year Results Briefing 28 February 2013 1 KEY FINANCIALS & STRATEGY BUSINESS REVIEW OUTLOOK Q&A 2 UOL GROUP LIMITED KEY FINANCIALS & STRATEGY GWEE LIAN KHENG GROUP CHIEF EXECUTIVE 3 S$m FY 2012
JET AIRWAYS (I) LTD. Presentation on Financial Results Q2 FY10
 LTD. Presentation on Financial Results Q2 FY10") JET AIRWAYS (I) LTD Presentation on Financial Results Q2 FY10 October 27, 2009 1 1 1 Agenda Domestic operating environment Jet Airways performance highlights JetLite performance highlights Outlook 2 2
JET AIRWAYS (I) LTD Presentation on Financial Results Q2 FY10 October 27, 2009 1 1 1 Agenda Domestic operating environment Jet Airways performance highlights JetLite performance highlights Outlook 2 2
Management Presentation. August 2012
 Management Presentation August 2012 Forward looking statements This presentation as well as oral statements made by officers or directors of Allegiant Travel Company, its advisors and affiliates (collectively
JAPAN AIRLINES Co., Ltd. Financial Results 1 st Quarter Mar/2017(FY2016) July 29, 2016
 July 29, 2016") JAPAN AIRLINES Co., Ltd. Financial Results Mar/2017(FY2016) July 29, 2016 Today s Topics P.1 P.2 P.13 From the first quarter of this fiscal year, figures for Revenue Passengers Carried, ASK, RPK and Load
JAPAN AIRLINES Co., Ltd. Financial Results Mar/2017(FY2016) July 29, 2016 Today s Topics P.1 P.2 P.13 From the first quarter of this fiscal year, figures for Revenue Passengers Carried, ASK, RPK and Load
Forward-Looking Statements Statements in this presentation that are not historical facts are "forward-looking" statements and "safe harbor
 2017 Annual Meeting of Shareholders Presentation May 2017 Forward-Looking Statements Statements in this presentation that are not historical facts are "forward-looking" statements and "safe harbor statements"
Montie Brewer, President and CEO Joshua Koshy, Executive VP and CFO UBS Transport Conference
 Montie Brewer, President and CEO Joshua Koshy, Executive VP and CFO UBS Transport Conference 1 London, England September 17, 2007 Agenda Strongly positioned international airline Investment proposition
Main Points in the Results for FY2015
 0 1 2 Main Points in the Results for FY2015 Operating profit increased to 75.4 billion yen, exceeding the goal of 75.0 billion yen for the final year of the medium-term management plan in the first year
Jet Airways (India) Ltd. Presentation on Annual Results FY06. May 2006
 Ltd. Presentation on Annual Results FY06. May 2006") Jet Airways (India) Ltd. Presentation on Annual Results FY06 May 2006 1 Agenda 1. Performance Highlights 2. Sahara Acquisition Update 3. Outlook 2 Performance Highlights 3 Domestic landscape capacity growth
Jet Airways (India) Ltd. Presentation on Annual Results FY06 May 2006 1 Agenda 1. Performance Highlights 2. Sahara Acquisition Update 3. Outlook 2 Performance Highlights 3 Domestic landscape capacity growth
Spirit Airlines Reports First Quarter 2017 Results
 Spirit Airlines Reports First Quarter 2017 Results MIRAMAR, Fla., April 28, 2017 - Spirit Airlines, Inc. (NASDAQ: SAVE) today reported first quarter 2017 financial results. GAAP net income for the first
PRIMED FOR GROWTH ROXY-PACIFIC HOLDINGS LIMITED. Results Announcement Half Year Ended 30 June st July 2018
 PRIMED FOR GROWTH ROXY-PACIFIC HOLDINGS LIMITED Results Announcement Half Year Ended 30 June 2018 31 st July 2018 Agenda 1 Financial Performance 2 Business Review 3 Group Borrowings 4 Outlook Financial
A-HTRUST to deepen presence in Japan with the acquisition of a portfolio of hotels
 Press Release For Immediate Release A-HTRUST to deepen presence in Japan with the acquisition of a portfolio of hotels Deepens presence in Osaka, a gateway city with a strong hospitality market, which
Cathay Pacific Airways 2012 Analyst Briefing 28 June 2012
 Cathay Pacific Airways 2012 Analyst Briefing 28 June 2012 1 Airline Strategy Grow our international network, expand frequencies and further develop Hong Kong as one of the world s leading aviation hubs
Results 2Q17. August 9, 2017
 Results 2Q17 August 9, 2017 2Q17 Highlights Indicators 2Q17 Var. x 2Q16 ASK (BN) 10.4-3.0% Traffic (000) 7,261-1.3% RPK (BN) 8.1 +0.5% Load Factor 77.9% +2.7 p.p. Yield (R$ cents) 23.2 +4.8% Pax Revenue
The SAS Group five business areas as from Q SAS Group statement of income
 Weak full year result but according to plan Teleconference Fiscal year st Quarter weak according to plan nd Quarter passenger load factors and yields better than expected 3 rd and 4 th Quarter pressure