Economic & Real Estate Outlook
|
|
|
- Oliver Page
- 5 years ago
- Views:
Transcription
1 Economic & Real Estate Outlook By Lawrence Yun, Ph.D. Chief Economist, National Association of REALTORS Presentations at NAR Legislative Meetings Washington, DC May 17, 2018
2 Very Long Economic Expansion
3 Q Q Q Q Q Q Q Q Q Q Q Q Q Q Q Q Q Q Q Q Q Q Q Q Q Q Q Q Q Q Q Q Q Q Q Q Q Q Q Q Q1 6 GDP Growth Rate 3% in Q2 and Q3 (and Q4)
4 Stock Market: S&P
5 Q Q Q Q Q Q Q Q Q Q Q Q Q Q Q Q Q Q Q Q Q Q Q Q Q Q Q Q Q Q Q Q Q Q Q Q3 Record High Wealth In $billion
6 Animal Spirit Revival of Consumers? Consumer Confidence Index Jan Mar May Jul Sep Nov Jan Mar May Jul Sep Nov Jan
7 150, ,000 Job Gains for 90 straight months (18 million gained from 2010) In thousands 140, , , , ,
8 Low Unemployment Rate

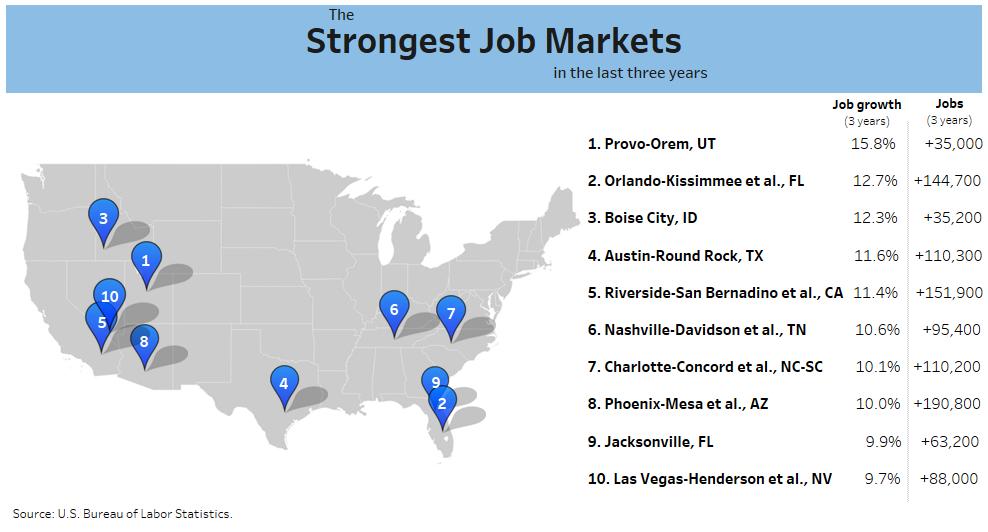
9 Recent Employment Growth (March 2017 to March 2018)
10
11 Apr Jul Oct Apr Jul Oct Apr Jul Oct Apr Jul Oct Apr Jul Oct Apr Jul Oct Apr Jul Oct Apr Jul Oct Apr Oil Price Bouncing Off Lows 120 West Texas Intermediate
12 Total Job Openings In thousands
13 Job Openings = Job Seekers In thousands
14 700 In thousands Weekly Initial Unemployment Insurance Filings
15 Apr Jul Oct Apr Jul Oct Apr Jul Oct Apr Jul Oct Apr Jul Oct Apr Jul Oct Apr Jul Oct Apr Jul Oct Apr Backlog of Orders: Breaking Higher Source: ISM Institute
16 Q Q Q Q Q Q Q Q Q Q Q Q Q Q Q Q Q Q Q Q Q Q Q Q Q Q Q Q Q Q Q Q Q Q Q Q Q Q Q Q Q1 Consumer Spending Growth (year over year % growth after inflation)
17 Q Q Q Q Q Q Q Q Q Q Q Q Q Q Q Q Q Q Q Q Q Q Q Q Q Q Q Q Q Q Q Q Q Q Q Q Q Q Q Q Q1 15 Business Spending Growth (Non-Residential Fixed Investment, year over year % growth after inflation)
18 Q Q Q Q Q Q Q Q Q Q Q Q Q Q Q Q Q Q Q Q Q Q Q Q Q Q Q Q Q Q Q Q Q Q Q Q Q Q Q Q Q1 Commercial Construction Spending Growth (year over year % growth after inflation)
19 Q Q Q Q Q Q Q Q Q Q Q Q Q Q Q Q Q Q Q Q Q Q Q Q Q Export and Import Growth Rates (year over year % growth after inflation) Exports (Red) Imports (Blue)
20 Q Q Q Q Q Q Q Q Q Q Q Q Q Q Q Q Q Q Q Q Q Q Q Q Q Exports and Imports (in $ billion 2009 Prices) 2500 Imports Exports 1000
21 Q Q Q Q Q Q Q Q Q Q Q Q Q Q Q Q Q Q Q Q Q Q Q Q Q Q Q Q Q Q Q Q Q Q Q Q Q Q Q Q Q1 National Defense Spending Growth (year over year % growth after inflation)
22 May Sep May Sep May Sep May Sep May Sep May Sep May Sep May Sep 2018 Producer Prices on Materials for Construction (year over year % growth)
23 Jul Jul Jul Jul Jul Jul Jul Jul Jul Jul Jul Jul Jul Jul Jul Jul Jul Jul 2018 Construction Workers In thousands
24 Jul Jul Jul Jul Jul Jul Jul Jul Jul Jul Jul Jul Jul Jul Jul Jul 2018 Construction Job Openings (12-month moving average) In thousands
25 May Sep May Sep May Sep May Sep May Sep May Sep May Sep May Sep 2018 Construction Job Wage Increase (year over year % growth) Construction All


26 US CRE fundamentals on upswing OFFICE INDUSTRIAL Office demand strong, due to rising employment Mobile workforce; increased telecommuting Flexible space layouts Moderate supply leads to 13% vacancy RETAIL Department stores lose ground Malls close/redevelop Small/discount grocery stores heat up: Aldi Amazon moves into grocery space with Whole Foods Completions remain low Rents experience solid growth Increased trade & rising e-commerce place industrial sector on hot streak Last mile distribution + Intermodal logistics Panama Canal; East coast ports Net absorption remains strong Net rent growth reaches record APARTMENT Mixed-use urban development; live/work/play Class A supply; small floorplans; amenities Demand remains robust; 12-mo net absorption: 230,000 units 12-mo Completions: 260,000 units Vacancy moves up to 5%; moderates rent growth (2.0% YoY in Q1.18)
27 Retail Sales 15 % change from one year ago
28 E-commerce Retail Sales (Growing 4 times as fast as traditional retail sales) % change from one year ago Q Q Q Q Q Q1
29 Q Q Q Q Q Q Q Q Q Q Q Q Q Q Q Q Q Q Q Q Q Q Q Q Q Q Q Q Q Q Q Q Q Q Q Q3 300 Commercial Property Price New Highs (85% gain in 7 years) Source: Federal Reserve
30 Jul Jul Jul Jul Jul Jul Jul Jul Jul Jul Jul Jul Jul Jul Jul Jul Jul Jul Commercial Appraisal Price Topping Off (More Than Doubled in 7 years) Source: Federal Reserve
31 % NCREIF Cap Rates Likely Already Hit Cyclical Low
32 Fed Rate Hikes and 10-Year Treasury Yield Federal Open Market Committee: Fed Funds Target Rate (EOP, %) Treasury 10-Year Note: Interest Rate (%) Sources: Federal Reserve Board, Bureau of Public Debt
33 Low Cap Rates Except in Hotel 9.0% Cap Rates Off Ret Ind Apt Htl 8.0% 7.0% 6.0% 5.0% '13 '14 '15 '16 '17 '18 Source: Real Capital Analytics
34 130 Commercial Investment Sales of Large Properties (Properties valued at $2.5 million and over)
35 REALTORS CRE sales advance in 2017 Q Percentage of REALTORS Who Closed a Sale Transaction 8% 6% 4% 2% 0% -2% -4% -6% -8% -10% -12% 75% Direction of Business Opportunity (QoQ) Q Investment Volume +9.1% Q Investment Prices +6.9% Source: National Association of Realtors 100% 90% 80% 70% 60% 50% 40% 30% 20% 10% 0% REALTORS Most Pressing Challenges 46% 42% 21% 23% 9% 13% 12% 8% 10% 10% 1% 3% 2017.Q Q3 Inventory Shortage Pricing Gap: Buyers vs Sellers Local Economy
36 Multifamily Housing Starts In thousand units
37 Apr Jul Oct Apr Jul Oct Apr Jul Oct Apr Jul Oct Apr Jul Oct Apr Jul Oct Apr Jul Oct Apr Jul Oct 2018 Rent Growth Topping Off? % change from one year ago
38 Apartment Vacancy To Rise 10 % Rent Change Vacancy Source: CBRE via ULI
39 Office Vacancy To Fall % Rent Change Vacancy Source: CBRE via ULI
40 Industrial-Warehouse to Fall % Rent Change Vacancy Source: CBRE via ULI
41 Retail to Hold Steady % Rent Change Vacancy Source: CBRE via ULI
42 Forecast
43 OLD Economic Forecast Forecast 2018 Forecast GDP Growth 2.6% 1.5% 2.1% 2.5% Job Growth +2.6 million +2.0 million +2.1 million +2.4 million CPI Inflation 0.3% 1.2% 2.5% 2.5%
44 OLD Commercial Real Estate Forecast for 2017 Vacancy Rent Apartment Rising 50 to 80 basis points Rising Slowly 3% per year Office Stable 2.5% per year Industrial Stable 4% per year Retail Stable 2% per year
45 New Economic Forecast U.S. ECONOMIC OUTLOOK May Annual Growth Rate, % Real GDP Nonfarm Payroll Employment Consumer Prices Level Consumer Confidence Percent Unemployment Fed Funds Rate Month T-bill Rate Prime Rate Year Gov t Bond Year Gov t Bond Source: National Association of REALTORS
46 May Sep May Sep May Sep May Sep May Sep May Sep May Sep May Sep May Sep May Sep May Sep Probability of Recession (NY Fed: based on interest rate spread)
47 Thank You!
The Housing Market and the Macroeconomy
 The Housing Market and the Macroeconomy New England Mortgage Bankers Association October 2, 2009 1 The World is in a Deep Recession In the U.S. EMPLOYMENT: Job losses in August, 2009: -216,000 Job losses
Industry Update. ACI-NA Winter Board of Directors Meeting February 3, 2016 Orlando, FL
 Industry Update ACI-NA Winter Board of Directors Meeting February 3, 2016 Orlando, FL U.S. & Canadian GDP 8% 6% 4% U.S.* Canada** Estimate by BEA as of 02/11/16 2% 0% -2% -4% -6% -8% -10% The U.S. economy
3.2% 1.2% 12.2% Inflation, December 2017 y-o-y. Retail Sales, November 2017 y-o-y, Croatia
 City Report H2 2017 3.2% 1.2% 12.2% GDP Growth, Q3 2017 y-o-y Inflation, December 2017 y-o-y Unemployment rate, December 2017, Croatia 935 5.7% -2.5% Net Salary September 2017, Zagreb Retail Sales, November
market-view Australian housing markets report Residential construction on the rise - higher and higher?
 Australian housing markets report Residential construction on the rise - higher and higher? Dr Andrew Wilson Chief Economist Domain Group October 2016 Copyright 2016 Dr Andrew Wilson all rights reserved
A4A Spring 2016 Air Travel Forecast and Operational and Financial Review of 2015
 A4A Spring 2016 Air Travel Forecast and Operational and Financial Review of 2015 John P. Heimlich, Vice President & Chief Economist A4A Media Briefing March 9, 2016 2000 2001 2002 2003 2004 2005 2006 2007
Data Digest: Florida. August 2013
 Data Digest: Florida August 2013 The economic performance for Florida and the United States has been improving since the end of 2010. However, the nation has been improving at a faster rate than Florida.
2016 Commercial Real Estate. Review and Forecast
 2016 Commercial Real Estate Review and Forecast February 4, 2016 Colliers International Saskatchewan Economic Overview Real GDP Growth 6.0% 2014 2015 2016f 5.0% 4.0% 3.0% 2.0% 1.0% 0.0% -1.0% Vancouver
1.0% 3.6% 15.9% Inflation March 2017 y-o-y. Retail Sales,
 City Report Q1 2017 1.0% 3.6% 15.9% GDP Growth Q1 2017 Inflation March 2017 y-o-y Unemployment rate 2016, Belgrade 495 11.4% 0.9% Salary March 2017, Belgrade Retail Sales, March 2017 y-o-y, Serbia Industrial
22 nd Annual Sioux Falls Market Outlook February 21, 2019
 22 nd Annual Sioux Falls Market Outlook 2019 February 21, 2019 Economic Overview Michael Bender, CCIM, SIOR Top 6 Trends Commercial Real Estate Trends to Dominate into 2020 and Beyond Opportunity Zone
Oct-17 Nov-17. Sep-17. Travel is expected to grow over the coming 6 months; at a slightly faster rate
 Analysis provided by TRAVEL TRENDS INDEX SEPTEMBER 2018 CTI reading of.8 in September 2018 indicates that travel to or within the U.S. grew 1.6% in September 2018 compared to September 2017. LTI predicts
Latin America: Outlook and Challenges Alejandro Werner Director Western Hemisphere Department
 International Monetary Fund Washington, DC. May, 3 Latin America: Outlook and Challenges Alejandro Werner Director Western Hemisphere Department Developments and Outlook Policy Challenges and Priorities
Oct-17 Nov-17. Travel is expected to grow over the coming 6 months; at a slower rate
 Analysis provided by TRAVEL TRENDS INDEX OCTOBER 2018 CTI reading of 51.6 in October 2018 indicates that travel to or within the U.S. grew 3.2% in October 2018 compared to October 2017. LTI predicts travel
September 2010 Brian Pearce To represent, lead and serve the airline industry
 Cycle turns up but risks and structural challenges remain September 2010 Brian Pearce www.iata.org/economics To represent, lead and serve the airline industry Confidence was still high in July survey Airline
Airline industry outlook remains fragile
 Airline industry outlook remains fragile June 2009 www.iata.org/economics To represent, lead and serve the airline industry Airline industry outlook remains fragile Green shoots starting to appear Recovery
AirportInfo. Economic Indicators & Traffic
 AirportInfo Economic Indicators & Traffic March 2012 U.S. & Canadian GDP Economic Focus 6% 4% US Canada 2% 0% -2% -4% -6% -8% -10% GDP growth improved slightly for both the U.S. and Canada in the third
MARKETBEAT RETAIL SNAPSHOT
 Bil US$ MARKETBEAT RETAIL SNAPSHOT LAS VEGAS, NV A Cushman & Wakefield Research Publication Q4 2014 NATIONAL ECONOMIC OVERVIEW Like Floyd Mayweather in the final round of a championship match, the U.S
AIR PASSENGER MARKET ANALYSIS
 AIR PASSENGER MARKET ANALYSIS OCTOBER 2014 KEY POINTS Air travel volumes were up 5.7% in October year-on-year, slightly stronger than the September rise of 5.2%, and a continuation of the positive growth
Jan-18. Dec-17. Travel is expected to grow over the coming 6 months; at a slower rate
 Analysis provided by TRAVEL TRENDS INDEX DECEMBER 2018 CTI reading of 51.8 in December 2018 indicates that travel to or within the U.S. grew 3.6% in December 2018 compared to December 2017. LTI predicts
Edmonton Real Estate Forum
 Edmonton Real Estate Forum On Solid Footing Shaw Conference Centre May 10, 2012 Mario Lefebvre Director, Centre for Municipal Studies lefebvre@conferenceboard.ca Uneven Growth in Global Economy (per cent
Belgrade City Report Q City Reports
 Belgrade City Report City Reports GDP Growth Q4 (y-o-y) Net Salary February Economy / Investment Economics 1.2% Inflation February (y-o-y) 1.5% 450 Unemployment Rate Q4 18.5% Retail Sales Index February
Halifax Economic Report
 Halifax Economic Report JANUARY 2017 J.K. MacAdam Economist and Project Development Specialist Highlights 2016 was another positive year for the Halifax economy, with growth in shipbuilding, the health
November Christchurch and Canterbury Quarterly. Economic Report CHRISTCHURCH AND CANTERBURY QUARTERLY ECONOMIC REPORT
 November 218 Christchurch and Canterbury Quarterly Economic Report CHRISTCHURCH AND CANTERBURY QUARTERLY ECONOMIC REPORT November 218 Christchurch Economy robust in September 218 Quarter Overview In the
San Antonio Market Overview. 1 st 2 nd Quarter 2015
 San Antonio Market Overview 1 st 2 nd Quarter 2015 San Antonio, Texas Attributes of San Antonio Why San Antonio? The seventh most populated city in the United States of America and the second most populated
4.5% 2.5% 2.3% Inflation. Purchasing power per capita 2016 Prague
 City Report Q4 2017 4.5% 2.5% 2.3% GDP Growth F2017 Inflation December 2017 Unemployment rate December 2017 Prague 1,444 10,526 2.7% Average Monthly Salary Q3 2017 Prague Purchasing power per capita 2016
International economic context and regional impact
 Contents I. GDP growth trends in Latin America and the Caribbean in 2012 II. Regional performance in 2012: Inflation, employment and wages External sector Policies: Fiscal and Monetary III. Conclusions
Note: These Louisiana indicators show the percentage difference from Second Quarter 2004 to Second Quarter 2005.
 Second Quarter 2005 The Louisiana Travel Pulse is a quarterly industry travel barometer designed to present recent trends in travel industry performance. This issue s emphasis is on the Second Quarter
49 May-17. Jun-17. Travel is expected to grow over the coming 6 months; at a slower rate
 Analysis provided by TRAVEL TRENDS INDEX MAY 2018 CTI reading of 51.7 in May 2018 shows that travel to or within the U.S. grew 3.4% in May 2018 compared to May 2017. LTI predicts moderating travel growth
Results of Tourism Activity Mexico, April 2017
 Results of Tourism Activity Mexico, April Undersecretariat of Planning and Tourism Policy Available in http://www.datatur.sectur.gob.mx/sitepages/versionesrat.aspx DIRECTORy ENRIQUE DE LA MADRID CORDERO
National Housing Trends
 National Housing Trends America s Choice of Best Long Term Investment Gallup 2017 The Cost of RENTING vs. BUYING HISTORICALLY: NOW: Percentage of Income Needed to Afford Median Rent 25.8% 29.2% Percentage
Subject Property Schuster St Las Vegas, NV SW Las Vegas Ind. LOCATION Distance to Seaport:
 Subject Property 6615 Schuster St Las Vegas, NV 89118 - SW Las Vegas Ind LOCATION Distance to Airport: 6.2 mi Distance to Seaport: 232.5 mi Distance to Rail Terminal: 6.7 mi Population 500 Mile Radius:
Index of business confidence. Monthly FTK (Billions) May 2014 vs. May 2013 YTD 2014 vs. YTD 2013 May 2014 vs. Apr 2014
 May 2014 vs. May 2013 YTD 2014 vs. YTD 2013 May 2014 vs. Apr 2014") AIR PASSENGER MARKET ANALYSIS MAY 2014 KEY POINTS Air travel markets rose by a strong 6.2% in May compared to a year ago. Although this is slightly down on April growth of 7.6%, April was positively biased
AIR PASSENGER MARKET ANALYSIS MAY 2014 KEY POINTS Air travel markets rose by a strong 6.2% in May compared to a year ago. Although this is slightly down on April growth of 7.6%, April was positively biased
Sofia City Report H City Reports
 Sofia City Report H1 2016 City Reports Gross Salary Q1 Economy & Investment GDP growth Q1 y-o-y 2.9% 650 Inflation May y-o-y - 2.0% Unemployment Rate Q1 8.6% Source: National Statistical Institute of Republic
Housing market report
 Australian capital cities and Gold Coast residential property market Prepared May Dr Andrew Wilson, Senior Economist Australian Property Monitors Housing markets strengthen as rates fall again. National
A Conversation With Folkestone. November 2017
 A Conversation With Folkestone November 2017 1 POPULATION GROWTH BY STATE Australian Population Growth by State: March 2017 Population (m) Growth in Year ( 000) % Change in Year VIC 6.3 149.4 2.4 ACT 0.4
Housing Outlook. Mr Sam White, Ray White Group Mr Harley Dale, Housing Industry Association. 29 October 2007
 Housing Outlook Mr Sam White, Ray White Group Mr Harley Dale, Housing Industry Association 29 October 2007 Australian Business Economists October 2007 Presented by Sam White Average Prices 700,000 600,000
Chattanooga & Hamilton Co. Tourism Trends & Economic Outlook
 Chattanooga & Hamilton Co. Tourism Trends & Economic Outlook How Tourism Works for Chattanooga, TN January 21, 2010 Presentation by: Steve Morse, Ph.D. Director & Economist, Tourism Institute University
Herron Todd White. South East Queensland Property Overview. Thursday, 17 November 2011 Sofitel, Brisbane.
 Herron Todd White South East Queensland Property Overview Thursday, 17 November 2011 Sofitel, Brisbane 1300 880 489 1 Alan Key Environmental Offsets Thursday, 17 November 2011 1300 880 489 Identity Earthtrade
Brisbane. Executive Summary. Economic Overview. Q Industrial Market Commentary
 Q3 2017 Industrial Market Commentary Brisbane Executive Summary The Brisbane industrial market is showing tangible signs of improvement, after relatively soft leasing conditions in 2016. Gross take-up
4.5% 1.4% 14.3% Inflation March 2018 y-o-y. Retail Sales, March 2018 y-o-y
 City Report Q1 2018 4.5% 1.4% 14.3% GDP Growth Q1 2018 y-o-y Inflation March 2018 y-o-y Unemployment rate Q4 2017, Belgrade 494 2.2% 4.1% Net Salary February 2018, Belgrade Retail Sales, March 2018 y-o-y
The Outlook for the Residential Construction Industry Hunter and the Central Coast
 The Outlook for the Residential Construction Industry Hunter and the Central Coast Graham Wolfe HIA Chief Executive Industry Policy and Media HIA Industry Outlook Breakfast Newcastle February 2013 Backdrop:
Glenn R. Mueller, Ph.D. Professor University of Denver. Franklin L. Burns School of Real Estate & Construction Management &
 Real Estate Cycles Glenn R. Mueller, Ph.D. Professor University of Denver Franklin L. Burns School of Real Estate & Construction Management & Real Estate Investment Strategist Dividend Capital Research
BRAZIL INTERNATIONAL INBOUND TRAVEL MARKET PROFILE (2011) Copyright 2012 by the U.S. Travel Association. All Rights Reserved.
 Copyright 2012 by the U.S. Travel Association. All Rights Reserved.") BRAZIL INTERNATIONAL INBOUND TRAVEL MARKET PROFILE (211) Copyright 212 by the U.S. Travel Association. All Rights Reserved. EXECUTIVE SUMMARY With a population of nearly 2 million and a GDP exceeding $2
BRAZIL INTERNATIONAL INBOUND TRAVEL MARKET PROFILE (211) Copyright 212 by the U.S. Travel Association. All Rights Reserved. EXECUTIVE SUMMARY With a population of nearly 2 million and a GDP exceeding $2
Queensland Economic Update
 Queensland Economic Update Chamber of Commerce & Industry January 218 cciq.com.au Queensland Economic Update: Summary Economy State Final Demand (SFD) expanded by.2% in the September 217 quarter Household
Glenn R. Mueller, Ph.D. Professor University of Denver. Franklin L. Burns School of Real Estate & Construction Management & Dividend Capital Research
 Real Estate Cycles Glenn R. Mueller, Ph.D. Professor University of Denver Franklin L. Burns School of Real Estate & Construction Management & Real Estate Investment Strategist Dividend Capital Research
Sunshine Coast Residential Market
 Sunshine Coast Residential Market Warwick Temby HIA Executive Director, QLD HOUSING INDUSTRY ASSOCIATION April 2010 Overview Look at international, national and local events that are shaping the outlook
Economic Dashboard March 30, 2015
 Attachment 2 Economic Dashboard March 30, 2015 toronto.ca/business toronto.ca/culture Note: Top symbol compares how Toronto s position has changed; bottom symbol compares Toronto s performance to Canada
University of Denver. Dividend Capital Research
 Glenn R. Mueller, Ph.D. Professor University of Denver Franklin L. Burns School of Real Estate & Construction Management & Real Estate Investment Strategist Dividend Capital Research glenn.mueller@du.edu
1.2% 3.5% 13.2% Inflation May 2017 y-o-y. Retail Sales, May 2017 y-o-y
 City Report Q2 2017 1.2% 3.5% 13.2% GDP Growth Q1 2017 y-o-y Inflation May 2017 y-o-y Unemployment rate Q1 2017, Belgrade 489 11.1% 6.2% Net Salary May 2017, Belgrade Retail Sales, May 2017 y-o-y Industrial
Third Quarter Marketing Report B R A N SON/LAKES A R EA C VB N OVEMBER, 2013
 Third Quarter Marketing Report B R A N SON/LAKES A R EA C VB N OVEMBER, 2013 Economic Outlook +5.1% from July 2011 Consumer Confidence is Up 7% This Year Increasing from 66.7 in Dec to 71.2 Today +6.7%
Economic Outlook U.S., Southeast Florida. ULI Southeast Florida/Caribbean January 25, 2007
 Economic Outlook 2007-09 09 U.S., Southeast Florida ULI Southeast Florida/Caribbean January 25, 2007 Stan Geberer, Associate Fishkind & Associates, Inc. 12051 Corporate Boulevard Orlando, Florida 32817
3.5% 2.3% 2.2% Inflation March Purchasing power per capita 2016 Prague
 City Report Q1 2018 3.5% 2.3% 2.2% GDP Growth F2018 Inflation March 2018 Unemployment rate March 2018 Prague 1,539 10,526 3.8% Average Monthly Salary Q4 2017 Prague Purchasing power per capita 2016 Prague
Global Airline Trends and Impacts International Aviation Issues Seminar
 Global Airline Trends and Impacts International Aviation Issues Seminar December 2017, Washington D.C. Oliver Lamb Managing Director 1 Around the world in 45 minutes Financial Performance Canada Mexico
Commercial Exchange Rate
 Commercial Exchange Rate Real (R$) / US dollar (US$), daily report R$ / US$ 4.5 4 3.5 3 2.5 2 1.5 1 25 26 27 28 29 2 211 212 213 214 215 216 Source: Central Bank of Brazil (Banco Central do Brasil, Sistema
marketview Australian housing markets report Sunshine Coast solid again and rising Dr Andrew Wilson Domain Group senior economist March 2015
 Australian housing markets report Sunshine Coast solid again and rising Dr Andrew Wilson Domain Group senior economist March 2015 Copyright 2015 Dr Andrew Wilson all rights reserved Housing market model
2.1% 3.0% 12.9% Inflation December 2017 y-o-y. Retail Sales, November 2017 y-o-y
 City Report Q4 2017 2.1% 3.0% 12.9% GDP Growth Q3 2017 y-o-y Inflation December 2017 y-o-y Unemployment rate Q3 2017, Belgrade 495 6.6% 5.5% Net Salary November 2017, Belgrade Retail Sales, November 2017
AIR PASSENGER MARKET ANALYSIS
 Monthly RPK (Billions) Monthly FTK (Billions) Index of business confidence % change over year AIR PASSENGER MARKET ANALYSIS JANUARY 2014 KEY POINTS Air travel markets commenced 2014 with a strong increase
Finding Rationality in an Irrational World: The Economics of Successful Hotel Negotiations
 Finding Rationality in an Irrational World: The Economics of Successful Hotel Negotiations Isaac Collazo, Vice President, Performance Strategy & Planning, InterContinental Hotels Group (IHG) Maria Lowry,
2nd Quarter. AEDC is pleased to present the Anchorage Quarterly Economic Indicators Report for the second quarter of 2010.
 2010 AEDC is pleased to present the Anchorage Quarterly Economic Indicators Report for the second quarter of 2010. This report summarizes recently updated data from the Anchorage Economic Indicators Database,
National & Regional Economic Outlook
 National & Regional Economic Outlook The Alliance Bank Business Outreach Center 2014 Economic Outlook Conference November 6, 2014 Ronald J. Gunderson Professor of Economics Northern Arizona University
Second Quarter 2012 Marketing Report To The City of Branson
 Second Quarter 2012 Marketing Report To The City of Branson Branson/Lakes Area Chamber & CVB August 28, 2012 Presentation Overview 2012 Economic Overview 2012 Travel Industry Overview 2012 Q2 Branson Update
Asheville Metro Economic Report 2014 Second Quarter
 Asheville Metro Economic Report Johnson Price Sprinkle PA HIGHLIGHTS: ASHEVILLE METRO The Asheville metro area gained 2,400 more jobs than one year earlier, averaging a growth rate of 1.4 percent, continuing
IATA ECONOMICS BRIEFING AIRLINE BUSINESS CONFIDENCE INDEX OCTOBER 2010 SURVEY
 IATA ECONOMICS BRIEFING AIRLINE BUSINESS CONFIDENCE INDEX OCTOBER SURVEY KEY POINTS Results from IATA s quarterly survey conducted in October show business conditions continued to improve during the third
Airline Current Business Environment Alex Heiter
 Airline Current Business Environment Alex Heiter Istanbul Technical University Air Transportation Management M.Sc. Program Network, Fleet and Schedule Strategic Planning Module 2: 28 March 2016 The underlying
Ottawa-Gatineau s Economic Outlook
 Ottawa-Gatineau s Economic Outlook Slow Growth, but Growth Nonetheless Mario Lefebvre Director, Centre for Municipal Studies The Ottawa Real Estate Forum October 11, 2012 Canadian Outlook The Canadian
The Airline Crisis. 25 th IFATCA ASP Regional Meeting. Shixin CHENG Manager, Safety, Operations & Infrastructure IATA North Asia Region
 The Airline Crisis 25 th IFATCA ASP Regional Meeting Shixin CHENG Manager, Safety, Operations & Infrastructure IATA North Asia Region To represent, lead and serve the airline industry Outlook for the airline
1
 213 Economic Outlook December 1, 212 Dr. Stephen P. A. Brown, Director Prepared by The Lee Lee Business School University of Nevada, Las Vegas University of Nevada, Las Vegas May 3, 212 December 1, 212
January 2018 Air Traffic Activity Summary
 January 2018 Air Traffic Activity Summary Jan-2018 Jan-2017 CY-2018 CY-2017 Passengers 528,947 505,421 4.7% 528,947 505,421 4.7% Passengers 537,332 515,787 4.2% 537,332 515,787 4.2% Passengers 1,066,279
BRANSON 2 nd QUARTER 2014 MARKETING REPORT
 BRANSON 2 nd QUARTER 2014 MARKETING REPORT October 14, 2014 Branson Convention & Visitors Bureau PRESENTATION OVERVIEW Economic Overview Travel Industry Update Branson 2Q 2014 Update ECONOMIC OUTLOOK Consumer
Index of business confidence. Monthly FTK (Billions) Apr 2014 vs. Apr 2013 YTD 2014 vs. YTD 2013 Apr 2014 vs. Mar 2014
 Apr 2014 vs. Apr 2013 YTD 2014 vs. YTD 2013 Apr 2014 vs. Mar 2014") AIR PASSENGER MARKET ANALYSIS APRIL 2014 KEY POINTS Growth in air travel picked-up in April, rising 7.5% compared to a year ago. This is an acceleration on March, when revenue passenger kilometers increased
AIR PASSENGER MARKET ANALYSIS APRIL 2014 KEY POINTS Growth in air travel picked-up in April, rising 7.5% compared to a year ago. This is an acceleration on March, when revenue passenger kilometers increased
Investor Briefings First-Half FY2016 Financial Results
 Cedar Woods Properties Limited Investor Briefings First-Half FY2016 Financial Results 26 February 2016 Cedar Woods Presentation 2 Snapshot of Achievements in FY2016 Extensive portfolio of residential estates
Buffalo and New York City Since the Great Recession
 Buffalo and New York City Since the Great Recession for the Workshop on Economic Restructuring in the Rust Belt, Buffalo New York Cornell University Worker Institute James A. Parrott, Dir., Economic &
Cris Tarrant CEO (BVA State of the Nation. Joe Stather Associate Director #2018HIF
 Cris Tarrant CEO (BVA BDRC) @cristarrant State of the Nation Joe Stather Associate Director (CBRE) @joestather #2018HIF Cris Tarrant CEO (BVA BDRC) @cristarrant Trends & Spends Joe Stather Associate Director
Results of Tourism Activity Mexico, May 2017
 Results of Tourism Activity Mexico, May Undersecretariat of Planning and Tourism Policy Available in http://www.datatur.sectur.gob.mx/sitepages/versionesrat.aspx DIRECTORy ENRIQUE DE LA MADRID CORDERO
Houston Economic Update. Presented by Patrick Jankowski Vice President, Research Greater Houston Partnership
 Houston Economic Update Presented by Patrick Jankowski Vice President, Research Greater Houston Partnership Houston Astros - Percent Regular Season Games Won Help from the bullpen this year Help from the
OUR VISION TO MAKE LONDON S WEST END THE WORLD S FIRST CHOICE FOR VISITORS, BUSINESSES AND INVESTORS
 11 JANUARY 2018 OUR VISION TO MAKE LONDON S WEST END THE WORLD S FIRST CHOICE FOR VISITORS, BUSINESSES AND INVESTORS 5 Globally competitive Visas and Tax Free Shopping PLACEMAKING & IMPROVED PUBLIC
HOTEL INDUSTRY OVERVIEW. Texas
 HOTEL INDUSTRY OVERVIEW Texas DEMAND GROWTH STRONG BALANCED OCC & ADR GROWTH % Change Room Supply* 149M 1.3% Room Demand* 92M 5.6% Occupancy 61.6% 4.3% A.D.R. $90 4.4% RevPAR $55 8.9% Room Revenue* $8.3B
Industry Update. ACI-NA Winter Board of Directors Meeting February 7, 2018 Palm Beach Gardens, FL
 Industry Update ACI-NA Winter Board of Directors Meeting February 7, 2018 Palm Beach Gardens, FL 1Q2007 2Q2007 3Q2007 4Q2007 1Q2008 2Q2008 3Q2008 4Q2008 1Q2009 2Q2009 3Q2009 4Q2009 1Q2010 2Q2010 3Q2010
marketview Australian housing markets report Sydney s south west booming too Dr Andrew Wilson Domain Group senior economist March 2015
 Australian housing markets report Sydney s south west booming too Dr Andrew Wilson Domain Group senior economist March 2015 Copyright 2015 Dr Andrew Wilson all rights reserved Housing market model Wilson
Economic Impact of Tourism in Hillsborough County September 2016
 Economic Impact of Tourism in Hillsborough County - 2015 September 2016 Key findings for 2015 Almost 22 million people visited Hillsborough County in 2015. Visits to Hillsborough County increased 4.5%
The Economic Impact of Travel in Kansas. Tourism Satellite Account Calendar Year 2013
 The Economic Impact of Travel in Kansas Tourism Satellite Account Calendar Year 2013 Who we are Tourism Economics Union of industry expertise and economic disciplines Real world insights based on quantitative
Corporate presentation CIBC Whistler Institutional Investor Conference January 21, 2010
 Corporate presentation CIBC Whistler Institutional Investor Conference January 21, 2010 Forwardlooking statement Certain information in this presentation and statements made during this presentation, including
Results of Tourism Activity
 Results of Tourism Activity Mexico, July 2016 Lago de San Miguel Regla, Hidalgo. Jardín en Hacienda San Gabriel, Morelos. Parras, Coahuila. Paseo Santa Lucía, Monterrey. Undersecretariat of Planning and
The Canadian Retail Real Estate Market Real Estate Forum. Presented to:
 The Canadian Retail Real Estate Market Presented to: 2012 Real Estate Forum Presented by John G. Crombie National Retail Director Cushman & Wakefield Ltd. 416-756-5448 Retail Real Estate Canadian Retail
The San Diego County Rental Market Boom
 The San Diego County Rental Market Boom Peter Dennehy, Senior Vice President Meyers Research, LLC San Diego Employment Growth Employment History & Forecasts San Diego County, CA - Ten Year History 25 26
m3commentary MELBOURNE CBD OFFICE
 m3commentary MELBOURNE CBD OFFICE Spring 2016 Key Research Contacts: Jennifer Williams National Director NSW (02) 8234 8116 Erin Obliubek Research Manager VIC (03) 9605 1075 Casey Robinson Research Manager
U.S. Hotel Industry Performance. Brad Garner Chief Operating Officer
 U.S. Hotel Industry Performance Brad Garner Chief Operating Officer 1 Agenda Total US Review Scale Review Segmentation Markets Supply Pipeline 2013 / 2014 Forecast 2 www.hotelnewsnow.com Click on Hotel
Zagreb City Report H City Reports
 Zagreb City Report City Reports GDP Growth Q1 y-o-y Inflation May y-o-y Net Salary April Economy & Investment Economics 0.2% 870 Unemployment Rate Q1 2.7% Retail Sales Index May y-o-y 3.9% Tourist Arrivals
Thessaloniki Chamber of Commerce & Industry TCCI BAROMETER. March Palmos Analysis. March 11
 Thessaloniki Chamber of Commerce & Industry TCCI BAROMETER March 2011 Palmos Analysis March 11 TCCI BAROMETER (Executive Summary) Thessaloniki Chamber of Commerce and Industry (TCCI), consistent to its
The Residential Outlook for South Australia
 The Residential Outlook for South Australia Matthew King Economist HOUSING INDUSTRY ASSOCIATION February 2011 Overview Economic backdrop Other important matters Interest rates & bank lending Renovations
Mar-16. Apr-16. Travel is expected to grow over the coming 6 months; at a slower rate
 Analysis provided by TRAVEL TRENDS INDE MARCH 2017 CTI reading of.8 in March 2017 shows that travel to and within the U.S. grew by 3.6% from March 2016 to March 2017. LTI predicts overall positive travel
North Atlantic Performance Trends
 North Atlantic Performance Trends Presented To: ICAO NAT EFFG 32 Paris, France Presented By: David Chin, Thea Graham Prepared By: Tony Choi, Carlos Garcia FAA - Air Traffic Organization Date: April 26,
South Australian Centre for Economic Studies June 2016 Economic Briefing Report 28 June, 2016
 Steve Whetton, Executive Director, SA Centre for Economic Studies South Australian Centre for Economic Studies June 216 Economic Briefing Report 28 June, 216 Per cent Global GDP Growth 1 8 Developing Countries
Air transport creates large returns for national economies but returns for airlines are unsustainably weak
 Air transport creates large returns for national economies but returns for airlines are unsustainably weak Thomas S. Windmuller SVP and Corporate Secretary Theme air transport brings large economic benefits
Australia & New Zealand
 Strategy Management Consultancy Australia & New Zealand Regional Analysis 2016 k n o w l e d g e c e n t e r Linesight Knowledge Center linesight.com Contents Australia Market Review 3 Australia Key Statistics
Mitchel Allen, VP, Business Development March 16, 2017
 Mitchel Allen, VP, Business Development March 16, 2017 1 2 THE GREATER PHOENIX ECONOMIC COUNCIL GREATER PHOENIX About the Greater Phoenix Economic Council (GPEC) 3 Our mission is to attract and grow quality
Yukon Tourism Indicators Year-End Report Yukon Tourism Indicators Year-End Report 2015
 Yukon Tourism Indicators Overview The Yukon Tourism Indicators is published by the Department of Tourism and Culture as a companion to the monthly Yukon Tourism Visitation Report. This document is intended
Air China Limited Annual Results. March Under IFRS
 Air China Limited 21 Annual Results Under IFRS March 211 Agenda Part 1 Highlights Part 2 Business Overview Part 3 Financial Overview Part 4 Outlook 2 Part 1 Highlights Steady Economic Growth; Asia Pacific
48 Oct-15. Nov-15. Travel is expected to grow over the coming 6 months; at a slower rate
 Analysis provided by TRAVEL TRENDS INDE OCTOBER 2016 CTI shows travel grew in October 2016. LTI predicts easing travel growth through the first four months of 2017, with some momentum sustained by domestic
Economic Dashboard September 4, toronto.ca/business toronto.ca/culture
 Economic Dashboard September 4, 2015 toronto.ca/business toronto.ca/culture Note: Top symbol compares how Toronto s position has changed; bottom symbol compares Toronto s performance to Canada Indicator
The Property Franchise Group
 The Property Franchise Group Capital Markets Event 22 October 2015 This afternoon s agenda 2 15:15 Welcome Richard Martin, Chairman 15:20 Introduction to MartinCo PLC Ian Wilson, Chief Executive Officer