Communicating the Importance of Seaports. Bringin It Home. Presented to AAPA Annual Convention Galveston, TX October 27, 2009
|
|
|
- Esther Ball
- 6 years ago
- Views:
Transcription

1 Communicating the Importance of Seaports Bringin It Home Presented to AAPA Annual Convention Galveston, TX October 27, 2009 Jim Kruse Director, Center for Ports & Waterways Texas Transportation Institute
2 A Little Insight into Who We Are Established in 1950 A member of The Texas A&M University System Work on all modes of transportation Annually work with nearly 200 sponsors at all levels of government and the private sector At any one time, TTI has research projects in about 30 U.S. states and 20 foreign countries

3 Recent Research Topics Container on Barge Economic impacts Economic effects of lack of dredging Externalities Short Sea Shipping (Marine Highways) Current impacts Potential policies and incentives Protecting waterways from encroachment Transportation Rate Analyses Port Operations Harbor Masters
")
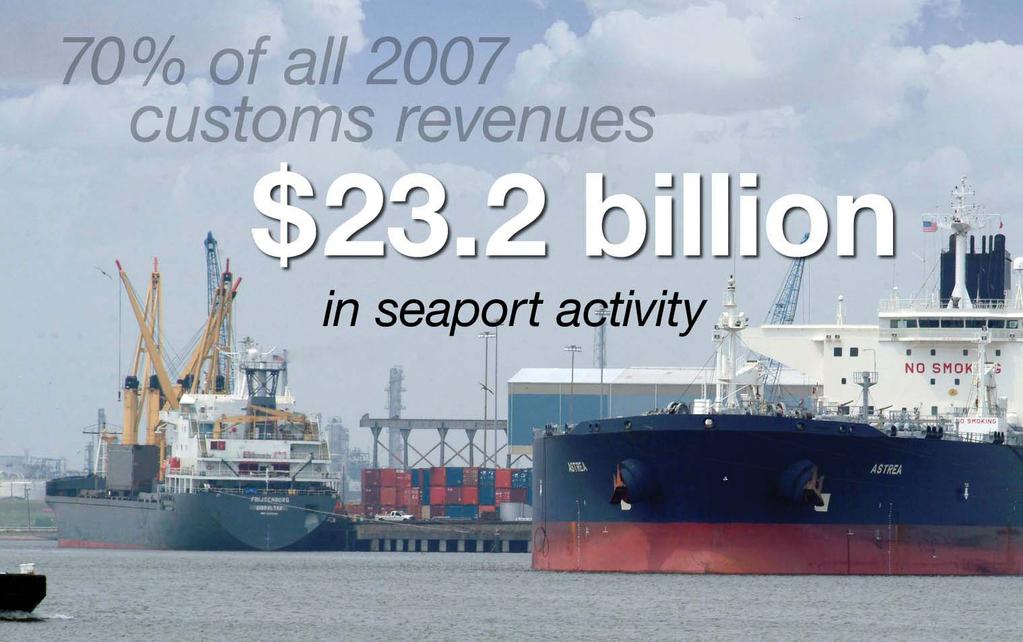
4 (2007 data)
5 Direct Effect on GDP The top 13 port metropolitan areas accounted for 32% of US GDP in (Source: BEA) In 2007, international trade (representing imports and exports of all goods and services) was 29.7 percent of GDP, or about $4.78 trillion of the total $ trillion GDP. (Source: Office of U.S. Trade Representative) Between 2005 and 2008, exports rose by 43%, accounting for 47% of overall GDP expansion. (USTR) One in six American manufacturing jobs is already supported by trade. (USTR)
6 The value of all international trade (goods and services by land, air and sea) accounts for more than 32 percent of the U.S. GDP. That value, which was 13 percent in 1990, is forecast to increase to the equivalent of 37 percent by 2015 and 60 percent by 2030.

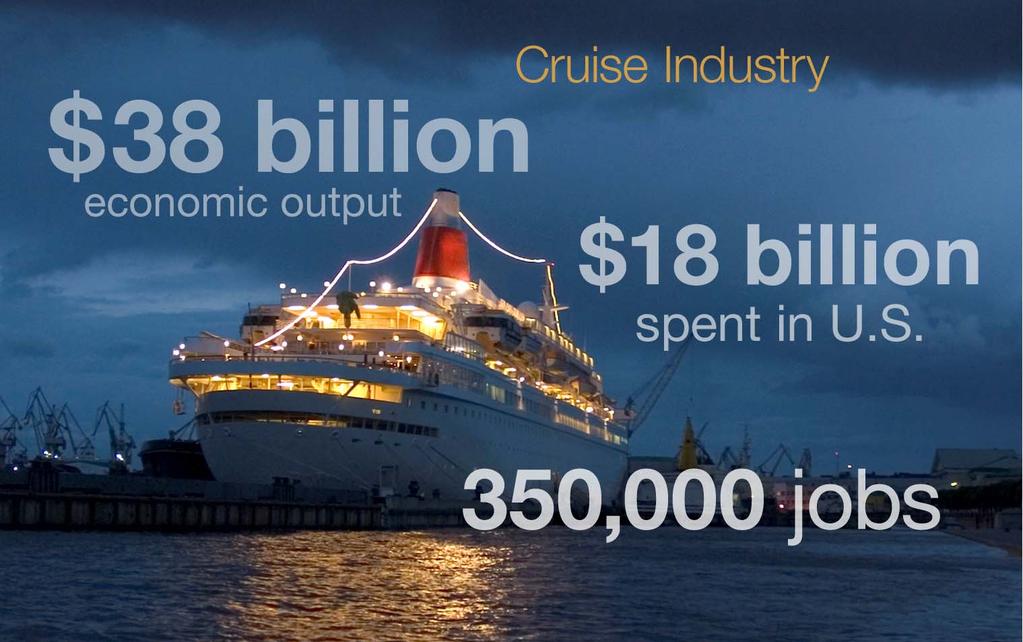
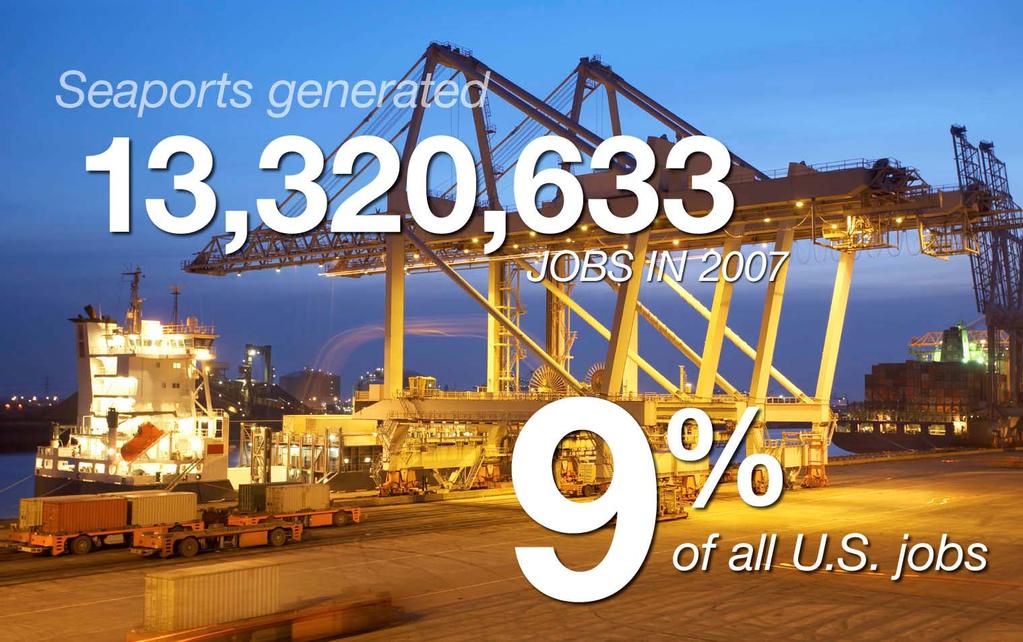
7 Creating Jobs Seaport-related jobs account for $649 billion in personal income. For every $1 billion in exports shipped though seaports, 15,000 U.S. jobs are created. Top 17 Employers


8 America s seaports are investing more than $2.5 billion a year to maintain and improve their infrastructure.

9


10
11 Top 20 cities by population every 30 years. YEAR New York New York New York New York New York New York New York 2 Philadelphia Baltimore Philadelphia Chicago Chicago Chicago Los Angeles 3 Baltimore New Orleans Brooklyn Philadelphia Philadelphia Los Angeles Chicago 4 Boston Philadelphia St. Louis St. Louis Detroit Philadelphia Houston 5 Charleston Boston Chicago Boston Los Angeles Detroit Philadelphia 6 Northern Liberties* Cincinnati Baltimore Baltimore Cleveland Baltimore San Diego 7 New Orleans Brooklyn Boston Cleveland St. Louis Houston Detroit 8 Southwark* Northern Liberties* Cincinnati Buffalo Baltimore Cleveland Dallas 9 Salem Albany New Orleans San Francisco Boston Washington Phoenix 10 Albany Charleston San Francisco Cincinnati Pittsburgh St Louis San Antonio 11 Providence Spring Garden* Buffalo Pittsburgh San Francisco Milwaukee San Jose 12 Richmond Southwark* Washington New Orleans Milwaukee San Francisco Baltimore 13 Norfolk Washington Newark Detroit Buffalo Boston Indianapolis 14 Washington Providence Louisville Milwaukee Washington Dallas San Francisco 15 Newport Kensington* Cleveland Washington Minneapolis New Orleans Jacksonville 16 Newburyport Louisville Pittsburgh Newark New Orleans Pittsburgh Columbus 17 Alexandria Pittsburgh Jersey City Jersey City Cincinnati San Antonio Milwaukee 18 Portland Lowell Detroit Louisville Newark San Diego Memphis 19 Portsmouth Rochester Milwaukee Minneapolis Kansas City Seattle Washington 20 Sherburne/Nantucket Richmond Albany Providence Seattle Buffalo Boston Asterisks were later annexed by Philadelphia


12 2010 Proposed Budget $5.1 billion $60 billion* US Coast Guard *The range of e


13


14 Source: Journal of Commerce Top 10 Importers of Containers: 2008

15 Shoes Car Guitar Cell Phone DVD Player Dish Network Receiver Camera Camcorder LCD TV T-Mobile PDA House Phone Laptop Printer Game System Keyboard/Mouse Wristwatch Shirts Pants Towels Toothbrush Wallet Silverware Razor Toaster Dolls American Flags Birthday Cake Candles

16
17
18
19

20


21
22

23
 686-2971 j-kruse@ttimail.")
24 Jim Kruse Director, Center for Ports & Waterways Texas Transportation Institute (713)
Lower Income Journey to Work Market Share From American Community Survey
 Lower Income Journey to Work Market Share From American Community Survey 2006-2010 Table 1: Overall National Data Table 2: Car, Truck or Van Table 3: Transit Table 4: Metrics Table 1 Work Trip Market Share:
MANGO MARKET DEVELOPMENT INDEX REPORT
 MANGO MARKET DEVELOPMENT INDEX REPORT 2015-2016 UNDERSTANDING THE MARKET INDEX The Mango Market Development Index is designed to measure and compare mango sales volume relative to population by region
University of Denver
 Glenn R. Mueller, Ph.D. Professor University of Denver Franklin L. Burns School of Real Estate & Construction Management & Real Estate Investment Strategist glenn.mueller@du.edu Supply The new supply of
Monthly Employment Watch: Milwaukee and the Nation's Largest Cities
 Monthly Employment Watch: Milwaukee and the Nation's Largest Cities A monthly report on employment trends in the nation s largest cities Prepared by: The University of Wisconsin-Milwaukee Center for Economic
Mango Market Development Index
 Mango Market Development Index 2016-2017 Understanding the Market Index The Mango Market Development Index is designed to measure and compare mango volume sold at retail relative to population by region
Monthly Employment Watch: Milwaukee and the Nation's Largest Cities
 Monthly Employment Watch: Milwaukee and the Nation's Largest Cities A monthly report on employment trends in the nation s largest cities Prepared by: The University of Wisconsin-Milwaukee Center for Economic
Monthly Employment Watch: Milwaukee and the Nation's Largest Cities
 Monthly Employment Watch: Milwaukee and the Nation's Largest Cities A monthly report on employment trends in the nation s largest cities Prepared by: The University of Wisconsin-Milwaukee Center for Economic
REGIONALLY FOCUSED. GLOBALLY COMPETITIVE.
 ABOUT EDC WHO WE ARE Mission: San Diego Regional Economic Development Corporation s mission is to maximize the region s economic prosperity and global competitiveness. Vision: The San Diego Region will
Appendix D: Aggregation Error for New England Metro Areas and for Places
 Appendix D: for New England Metro Areas and for Places D-1 Appendix D: s Figure D-1: New England Metro Areas - Summary of Tract s (2000) Metro ID (msapma99) Metro Area Name Census NCDB 1120 Boston, MA-NH
Hotel Valuation and Transaction Trends for the U.S. Lodging Industry
 Hotel Valuation and Transaction Trends for the U.S. Lodging Industry June 2010 Presented by Steve Rushmore, MAI, FRICS, CHA srushmore@hvs.com - 1 - Value Trend for a Typical U.S. Hotel 1987 1988 1989 1990
Park-Related Total* Expenditure per Resident, by City
 Park-Related Total* per Resident, by City FY 2008 City Population Total Park per Resident Washington, D.C. 591,833 $153,324,830 $259 Seattle 598,541 $150,672,543 $252 Scottsdale 235,371 $50,429,049 $214
RANKING OF THE 100 MOST POPULOUS U.S. CITIES 12/7/ /31/2016
 OVERVIEW OF THE DATA The following information is based on incoming communication to the National Human Trafficking Hotline via phone, email, and online tip report from December 7, 2007 December 31, 2016
Rank Place State Native Hawaiian and Pacific Islander population (alone or in combination
 TABLE 2a: 100 Largest Places Ranked by Number of s (race alone or in *) Living in Hard-to- Census Rank Place State (alone or in 1 Honolulu (CDP) HI 64,196 11,130 17.3 2 New York City NY 14,981 8,211 54.8
Monthly Employment Watch: Milwaukee and the Nation's Largest Cities
 Monthly Employment Watch: Milwaukee and the Nation's Largest Cities A monthly report on employment trends in the nation s largest cities Prepared by: The University of Wisconsin-Milwaukee Center for Economic
A COMPARISON OF THE MILWAUKEE METROPOLITAN AREA TO ITS PEERS
 KRY/WJS/EDL #222377 (PDF: #223479) 1/30/15 PRELIMINARY DRAFT Memorandum Report A COMPARISON OF THE MILWAUKEE METROPOLITAN AREA TO ITS PEERS EXECUTIVE SUMMARY This memorandum report provides a statistical
PUBLIC TRANSPORTATION INTRODUCTION
 PUBLIC TRANSPORTATION INTRODUCTION 1 OUTLINE Current Status and Recent Trends Significant Influences A Critical Assessment Arguments Supporting Public Transport Future Influences Ingredients for Future
Monthly Employment Watch: Milwaukee and the Nation's Largest Cities
 Monthly Employment Watch: Milwaukee and the Nation's Largest Cities A monthly report on employment trends in the nation s largest cities Prepared by: The University of Wisconsin-Milwaukee Center for Economic
Higher Education in America s Metropolitan Areas A Statistical Profile
 Higher Education in America s Metropolitan Areas A Statistical Profile MSA Study No.2 Higher Education in America s Metropolitan Areas A Statistical Profile CONTENTS Why Metro Areas? 1 Executive Summary
FBI Drug Demand Reduction Coordinators
 FBI Drug Demand Reduction Coordinators Alabama 2121 Building, Room 1400 Birmingham, AL 35203 (205) 252 7705 One St. Louis Centre One St. Louis Street Mobile, AL 36602 (334) 438 3674 Alaska 222 West Seventh
High-Speed Rail: Realizing the Potential of Megaregion Economies
 High-Speed Rail: Realizing the Potential of Megaregion Economies Petra Todorovich Director, America 2050 Regional Plan Association May 4, 2010 Rayburn House Office Building 1 2 1 Where High-Speed Rail
Access Across America: Transit 2014
 Access Across America: Transit 2014 Final Report CTS 14-11 Prepared by: Andrew Owen David Levinson Accessibility Observatory Department of Civil, Environmental, and Geo- Engineering University of Minnesota
Westshore Development Forum April 11, Hillsborough County Aviation Authority
 Westshore Development Forum April 11, 2017 Aviation in Florida Only state with four large hub airports $144 billion in annual economic activity or output Approximately 43.1 million visitors come to Florida
Parking Property Advisors and Parkopedia present: TOP 40 US CITIES PARKING INDEX
 Parking Property Advisors and Parkopedia present: TOP 40 US CITIES PARKING INDEX 2018 Parking Property Advisors and Parkopedia proudly present this 2018 Top 40 US Cities Parking Index. Whether you are
Emerging Trends in Real Estate Sustaining Momentum but Taking Nothing for Granted
 Emerging Trends in Real Estate 2015 Sustaining Momentum but Taking Nothing for Granted PwC-ULI Outlook on trends 36th edition 368 interviews 1,055 survey responses 1,400+ participants, a record Who? District
Census Affects Children in Poverty by Professors Donald Hernandez and Nancy Denton State University of New York, Albany
 Phone: (301) 457-9900 4700 Silver Hill Road, Suite 1250-3, Suitland, MD 20746 Fax: (301) 457-9901 Census Affects in Poverty by Professors Donald Hernandez and Nancy Denton State University of New York,
Location, Location, Location. 19 th Annual NIC Conference NIC MAP Data & Analysis Service
 Location, Location, Location 19 th Annual NIC Conference NIC MAP Data & Analysis Service The Great Occupancy Decline 94% Occupancy Trends Majority Nursing Seniors Housing 93% 92% 91% 92.8% 91.0% 90% 89%
Monthly Employment Watch: Milwaukee and the Nation's Largest Cities
 Monthly Employment Watch: Milwaukee and the Nation's Largest Cities A monthly report on employment trends in the nation s largest cities Prepared by: The University of Wisconsin-Milwaukee Center for Economic
U.S. Lodging Industry Update
 U.S. Lodging Industry Update First Watch on a Long Voyage R. MARK WOODWORTH AMERICAS RESEARCH AGENDA THE ECONOMY WHAT COULD END THE CURRENT CYCLE? LABOR COSTS OUR FORECASTS SHARING ECONOMY UPDATE First
Interest Bearing. Availability Schedule. April For Encoded Cash Letter Deposits received in Miami. Instructions. Schedule
 Instructions Schedule Bank of America OnUs Supplemental Interest Bearing Availability Schedule For Encoded Cash Letter Deposits received in Miami April 2011 Schedule 01 Availability Schedule for Corporate
Major Metropolitan Area Sales Tax Rates
 August 19, 2010 No. 239 FISCAL FACT Major Metropolitan Area Sales Tax Rates By Lawrence Summers Introduction General sales taxes levied by state, county and city governments in the United States vary greatly,
TOP 100. Transit Bus Fleets Agency 35 ft. Over Artic and 35 ft. Total +/- under 0 3, ,426 82
 L.A. Metro-No. 3 1 1 MTA New York City Transit New York City 2 2 New Jersey Transit Corp. Newark, N.J. 3 3 Metro Los Angeles 4 5 Toronto Transit Commission Toronto 5 10 Chicago Transit Authority Chicago
Agency 35 ft. Over Artic. Trolley 2012 Total and 35 ft. under. 1 1 MTA New York City Transit 0 3, ,344 New York City
 Capital Metro-No. 40 Courtesy Capital Metro 1 1 MTA New York City Transit 0 3,704 640 0 4,344 New York City 2 3 New Jersey Transit Corp. 47 2,263 85 0 2,395 Newark, N.J. 3 2 Metro 50 1,956 378 0 2,384
Population Estimates for U.S. Cities Report 1: Fastest Growing Cities Based on Numeric Increase,
 ulation s for U.S. Cities Report 1: Fastest Growing Cities Based on Numeric Increase, 2015-2015 1 Phoenix AZ 32,113 2.0 1,582,904 1,615,017 167,393 11.6 2 Los Angeles CA 27,173 0.7 3,949,149 3,976,322
INDIANA INTERSTATE AND INTRASTATE LOCAL REDUCED CITY-PAIR FARES
 The following section contains city-pair fares that are lower than walkup mileage-based fares. Although shown in only one direction, the fares in this section apply in both directions, unless otherwise
TOP 100 Bus Fleets Agency 35 ft. and Over Artic under 35 ft. Total. 18 < metro magazine SEPTEMBER/OCTOBER 2018 metro-magazine.
 1 1 MTA New York City Transit/MTA Bus Co. 0 4,860 951 5,811 New York City 2 3 New Jersey Transit Corp. 418 2,879 85 3,382 Newark, N.J. 3 2 Los Angeles County Metropolitan Transportation Authority 50 1,882
Aviation Insights No. 5
 Aviation Insights Explaining the modern airline industry from an independent, objective perspective No. 5 November 16, 2017 Question: How has air travel in specific metropolitan areas changed in recent
Metropolitan Votes and the 2012 U.S. Election: Population, GDP, Patents and Creative Class
 politan Votes and the 2012 U.S. Election: Population, GDP, Patents and Creative Class Author: Shawn Gilligan, Shawn.Gilligan@rotman.utoronto.ca Zara Matheson, Zara.Matheson@rotman.utoronto.ca Kevin Stolarick,
Largest cities in the United States by population by decade
 1 of 17 11/15/2008 7:30 AM Largest cities in the United States by population by decade From Wikipedia, the free encyclopedia This entry tracks and ranks the population of the largest cities in the United
ILLINOIS INTERSTATE AND INTRASTATE LOCAL REDUCED CITY-PAIR FARES
 The following section contains city-pair fares that are lower than walkup mileage-based fares. Although shown in only one direction, the fares in this section apply in both directions, unless otherwise
Social Media In Your New & Improved Phoenix Sky Harbor
 Social Media In Your New & Improved Phoenix Sky Harbor AZ Chapter of HSMAI September 19, 2013 It always begins & ends with: skyharbor.com Began Facebook page in October 2010 More than 27,000 people Like
San Francisco Travel Association Selling in a Seller s Market DMO Perspective. May 21, 2014
 San Francisco Travel Association Selling in a Seller s Market DMO Perspective May 21, 2014 Agenda Discussion Themes 1. Meetings Are Important 2. Market Meetings Pace 3. Occupancy & Rate 4. Booking Windows
WILL TOMORROW BE BETTER THAN YESTERDAY?
 CBRE HOTELS The World s Leading Hotel Experts. WILL TOMORROW BE BETTER THAN YESTERDAY? HOTEL SECTOR UPDATE OCTOBER 31, 2017 THE AGENDA 1. U.S. Lodging Market The Macro-Economy and Hotels The Changing Traveler
Hector International Airport Fargo, North Dakota
 Hector International Airport Fargo, North Dakota Volume 073 Twelve Months Ended September 2007 January 2008 Airlines Serving Fargo Carried 831 Onboard Passengers Per Day for the Twelve Months Ended September
 Snakes & Lattes is currently composed of three corporate owned and operated board game cafes in Toronto, ON. Over the last 7 years these have become renowned as Toronto's premiere board game cafe destinations.
16,000 50,000 WALKATHON CITIES WALKERS MILES
 WALKATHON 54 USA ARIZONA Phoenix ARKANSAS Little Rock CALIFORNIA Fresno Los Angeles Sacramento San Diego San Francisco San Jose CONNECTICUT Hartford DELAWARE New Castle FLORIDA Miami Orlando Tampa GEORGIA
Hector International Airport Fargo, North Dakota
 Hector International Airport Fargo, North Dakota Volume 072 Twelve Months Ended June 2007 November 2007 Airlines Serving Fargo Carried 830 Onboard Passengers Per Day for the Twelve Months Ended June 2007,
MARKETBEAT U.S. Office
 MARKETBEAT U.S. Office Q4 2018 U.S. OFFICE Employment Indicators Market Indicators (Overall) Office: Net Absorption/Asking Rent 4Q TRAILING AVERAGE Office: Overall Vacancy Q4 17 Q4 18 Total Nonfarm Employment
333 W. Campbell Road, Suite 440 Richardson, Texas Cruising for Charity with Randy Limbacher in Tahiti July 28, 2007
 333 W. Campbell Road, Suite 440 Richardson, Texas 75080 972.238.1998 800.952.1998 Cruising for Charity with Randy Limbacher in Tahiti July 28, 2007 Join me for this special annual event to raise money
TOTAL DOMESTIC TRADE RANK TOTAL FOREIGN TRADE
 U.S. PORT RANKING BY CARGO VOLUME 2016 Short Tons FOREIGN TRADE TOTAL TRADE TOTAL DOMESTIC TRADE RANK IMPORTS EXPORTS TOTAL FOREIGN TRADE RANK RANK RANK RANK PORT/STATE TONS PORT/STATE TONS PORT/STATE
Fort Lauderdale August 8, 2017
 Fort Lauderdale August 8, 2017 8/10/2017 TAP Software Analytics Division Brian Finucane TAP Reports Jeff Eastman TAP Hotel Reports Jeanne Eastman TAP Data Source Jeff Eastman Cloud Database Numerous Data
Norwegian's Free Airfare Promotion
 Norwegian's Free Airfare Promotion Start planning your next vacation with 200+ cruises to incredible destinations, including Alaska, Bahamas & Florida, Bermuda, Canada & New England, Caribbean, Mexican
Passengers Boarded At The Top 50 U. S. Airports ( Updated April 2
 (Ranked By Passenger Enplanements in 2006) Airport Table 1-41: Passengers Boarded at the Top 50 U.S. Airportsa Atlanta, GA (Hartsfield-Jackson Atlanta International) Chicago, IL (Chicago O'Hare International)
MARKETBEAT U.S. Office
 MARKETBEAT U.S. Office Q2 2017 U.S. OFFICE Employment Indicators Q2 16 Q2 17 Total Nonfarm Employment 143.9M 146.2M Office-using Employment 30.1M 31.8M Unemployment 4.9% 4.4% Source: BLS Market Indicators
Hector International Airport Fargo, North Dakota
 Hector International Airport Fargo, North Dakota Volume 081 Twelve Months Ended March 2008 July 2008 Airlines Serving Fargo Carried 838 Onboard Passengers Per Day for the Twelve Months Ended March 2008,
OB-GYN Workload & Potential Shortages: The Coming U.S. Women s Health Crisis
 OB-GYN Workload & Potential Shortages: The Coming U.S. Women s Health Crisis JULY 2017 Introduction Obstetricians and Gynecologists (OB-GYNs) are a critical part of the health care provider community.
A COMPARISON OF THE MILWAUKEE METROPOLITAN AREA TO ITS PEERS
 KRY/WJS/EDL #222377 v4 (PDF: #223479v2) 4/1/15 APPENDIX D REVISED DRAFT Memorandum Report A COMPARISON OF THE MILWAUKEE METROPOLITAN AREA TO ITS PEERS EXECUTIVE SUMMARY This report provides a statistical
District Match Data Availability
 District Match Data Availability National & State Data Location Available National Data Australia Parliament, Provincial and Territory Assemblies Canada Parliament, Provincial Legislative Assemblies New
Glenn R. Mueller, Ph.D. Professor University of Denver. Franklin L. Burns School of Real Estate & Construction Management & Dividend Capital Research
 Real Estate Cycles Glenn R. Mueller, Ph.D. Professor University of Denver Franklin L. Burns School of Real Estate & Construction Management & Real Estate Investment Strategist Dividend Capital Research
Girl Friends, Inc. ca
 Sc MG 415 Girl Friends, Inc. ca. 1939-2002 NEW YORK PUBLIC LIBRARY Schomburg Center for Research in Black Culture 515 Malcolm X Boulevard New York, New York 10037-1801 Bulk Dates: 1939-2002 Extent: Linear
University of Denver. Dividend Capital Research
 Glenn R. Mueller, Ph.D. Professor University of Denver Franklin L. Burns School of Real Estate & Construction Management & Real Estate Investment Strategist Dividend Capital Research glenn.mueller@du.edu
FILED: NEW YORK COUNTY CLERK 10/14/ :25 PM INDEX NO / /4/2016 Office locations in US states: PwC
 FILED: NEW YORK COUNTY CLERK 10/14/2016 02:25 PM INDEX NO. 451962/2016 10/4/2016 Office locations in US states: PwC NYSCEF DOC. NO. 9 RECEIVED NYSCEF: 10/14/2016 PwC office locations in (by state) Below
Glenn R. Mueller, Ph.D. Professor University of Denver. Franklin L. Burns School of Real Estate & Construction Management &
 Real Estate Cycles Glenn R. Mueller, Ph.D. Professor University of Denver Franklin L. Burns School of Real Estate & Construction Management & Real Estate Investment Strategist Dividend Capital Research
MARKETBEAT U.S. Office
 MARKETBEAT U.S. Office Q3 2018 U.S. OFFICE Employment Indicators Market Indicators (Overall) Office: Net Absorption/Asking Rent 4Q TRAILING AVERAGE Office: Overall Vacancy Q3 17 Q3 18 Total Nonfarm Employment
Factors Influencing Visitor's Choices of Urban Destinations in North America
 Factors Influencing Visitor's Choices of Urban Destinations in North America Ontario Ministry of Tourism and Recreation May 21, 2004 Study conducted by Global Insight Inc. Executive Summary A. Introduction:
Union Pacific Update September 22, 2016 North East Association of Rail Shippers Conference
 Union Pacific Update September 22, 2016 North East Association of Rail Shippers Conference I Sam Calabro Assistant Vice President Domestic Intermodal Sales 1 Seattle Eastport Portland Twin Cities Duluth
OBSERVERS. We shall not be moved NAACP. national Convention. advance registration form. 104 th ANNUAL CONVENTION
 OBSERVERS We shall not be moved 104 NAACP th national Convention advance registration form orlando, florida July 13-17, 2013 1 AT-LARGE OBSERVERS advanced registration Section I CONTACT INFORMATION (Please
2012 Airport Ground Transportation
 212 Airport Ground Transportation Fees and Fares Survey Summary March 212 AGTA 212 Airport Fees and Fares Survey Summary Survey Respondents Atlantic City International Airport Gulfport-Biloxi International
MARKETBEAT U.S. Office
 MARKETBEAT U.S. Office Q4 2017 U.S. OFFICE Employment Indicators Q4 16 Q4 17 Total Nonfarm Employment 145.2M 147.2M Office-using Employment 31.5M 32.1M Unemployment 4.7% 4.1% Source: BLS Market Indicators
U.S. Metropolitan Area Exports, 2015
 U.S. Metropolitan Area Exports, 2015 Jeffrey Hall Office of Trade and Economic Analysis Industry and Analysis Department of Commerce International Trade Administration September 2016 U.S. Metro Exports:
At the end of the bill (before the short title), insert the following:
, insert the following:") AMENDMENT TO H. R. (CONTINUING APPROPRIATIONS, 0) OFFERED BY MR. PENCE OF INDIANA At the end of the bill (before the short title), insert the following: 0 SEC. ll. None of the funds made available by this
AMENDMENT TO H. R. (CONTINUING APPROPRIATIONS, 0) OFFERED BY MR. PENCE OF INDIANA At the end of the bill (before the short title), insert the following: 0 SEC. ll. None of the funds made available by this
MINNEAPOLIS TOURISM MASTER PLAN STEERING COMMITTEE MEETING AUGUST 24, 2016
 MINNEAPOLIS TOURISM MASTER PLAN STEERING COMMITTEE MEETING AUGUST 24, 2016 TODAY S AGENDA Welcome & Introductions: Bill Background & Today s Objectives: Bill Co-Chairs Comments Mayor Hodges David Berg
Rent Monitor. First Quarter Vol. 83 % GROWTH IN NATIONAL RENTS BY SECTOR NATIONAL EFFECTIVE RENTS BY SECTOR TOP 5 MARKETS GAINING MOMENTUM**
 Rent Monitor TM Asking Rents Vol. 83... Effective Rents... Concessions NATIONAL EFFECTIVE RENTS BY SECTOR 5 YEARS % GROWTH IN NATIONAL RENTS BY SECTOR 12 MONTHS 110 105 100 95 INDEX 1Q 2001 = 100 +4. +4.
Per capita carbon emissions from transportation and residential energy use, 2005
 Per capita carbon emissions from transportation and residential energy use, 2005 Metropolitan Area Carbon Footprint Honolulu, HI 1 1.356 Los Angeles-Long Beach-Santa Ana, CA 2 1.413 Portland-Vancouver-Beaverton,
Pre-Response Meeting RLI # AV-01 Food & Beverage Service Terminals 1 & 2
 Pre-Response Meeting RLI #20120821-AV-01 Food & Beverage Service Terminals 1 & 2 January 17, 2013 FLL in Perspective 2011- FLL ranked as the 21 st busiest airport in the U.S. with 23,349,835 total passengers
MARKETBEAT U.S. Office
 MARKETBEAT U.S. Office Q1 2017 U.S. OFFICE Employment Indicators Q1 16 Q1 17 Total Nonfarm Employment 143.4M 145.7M Offi ce-using Employment 30.9M 31.7M Unemployment 4.9% 4.6% Source: BLS Market Indicators
3 Aviation Demand Forecast
 3 Aviation Demand 17 s of aviation demand were prepared in support of the Master Plan for Harrisburg International Airport (the Airport or HIA), including forecasts of enplaned passengers, air cargo, based
Impact of Hurricane Irma on US Metropolitan Areas
 Impact of Hurricane Irma on US Metropolitan Areas Puerto Ricans in mainland Prepared for: Jorge Restrepo, CEO 2017 EurekaFacts LLC September 29, 2017 Climate refugees from Puerto Rico in US metropolitan
MARKETBEAT U.S. Office
 MARKETBEAT U.S. Office Q3 2017 U.S. OFFICE Employment Indicators Net Absorption/Rent 4-QTR TRAILING AVERAGE Q3 16 Q3 17 Total Nonfarm Employment 144.7M 146.6M Office-using Employment 31.3M 31.9M Unemployment
Regional Outlook STEVEN G. COCHRANE, MANAGING DIRECTOR
 Regional Outlook STEVEN G. COCHRANE, MANAGING DIRECTOR Differences Narrow; Southeast Vies for Lead Employment, % change yr ago 3.5 3.0 Southwest 2.5 2.0 1.5 East South Central South Atlantic Northeast
DIRECT FASTENING. 20V MAX * Cordless Concrete Nailer
 DIRECT FASTENING 20V MAX * Cordless INTERCHANGEABLE CONTACT TRIPS Drywall and Mechanical contact trips for application versatility Removable; tool-free ADJUSTABLE POWER 3 settings for pin depth adjustment
Hotel Valuation and Transaction Trends For the U.S. Lodging Industry
 Hotel Valuation and Transaction Trends For the U.S. Lodging Industry Steve Rushmore, MAI, FRICS, CHA President and Founder HVS 372 Willis Avenue Mineola, NY 11501 516-248-8828 ext. 204 srushmore@hvs.com
MARKETBEAT U.S. Industrial Snapshot Q4 2015
 MARKETBEAT U.S. Industrial Snapshot Q4 2015 U.S. INDUSTRIAL Employment Indicators Q4 14 Q4 15 Total Nonfarm Employment 140.2M 143.0M Industrial Employment 23.4M 23.6M Unemployment 5.7% 5.0% Market Indicators
International migration. Total net migration. Domestic migration
 Indicator Direction Comparables a. Net population migration b. Crime rate (city) c. Housing costs d. Cost-of-living index N.A. e. State & local tax intensity f. Performing arts groups g. Air quality index
National Football League
 1 Enciclopedia del football italiano Football League ) Albo d Oro 1920 Akron PROS 1921 Chicago STALEYS 1922 Canton BULLDOGS 1923 1924 1925 Canton BULLDOGS Cleveland BULLDOGS Chicago CARDINALS 1926 Frankford
March Raymond James Institutional Investors Conference
 March 2009 Raymond James Institutional Investors Conference Safe Harbor Certain of the statements contained herein should be considered forward-looking statements, including within the meaning of the Private
MARKETBEAT U.S. Office
 MARKETBEAT U.S. Office Q4 2016 U.S. OFFICE Employment Indicators Market Indicators (Overall) Q4 15 Q4 16 Vacancy Rate 13.5% 13.2% Net Absorption 20.5M 6.9M Under Construction 94.5M 100.2M Weighted Asking
Hotel Valuation and Transaction Trends For the U.S. Lodging Industry
 Hotel Valuation and Transaction Trends For the U.S. Lodging Industry Stephen Rushmore, CHA, MAI President and Founder HVS International 372 Willis Avenue Mineola, NY 11501 516-248-8828 ext. 204 srushmore@hvsinternational.com
Florida's Scheduled Commercial Service Airports
 Florida's Scheduled Commercial Service Airports Volume 154 May 2016 - Domestic Airlines Serving Florida Carried 170,726 Onboard Passengers Per Day for, up 7.7% over the previous 12 months. Highlights in
International Convention Badges
 Images may not be the actual size. (Reduced the image sizes to save white space in the catalog) Images provided by Lion Verle Malik Created 07/24/2015. 1923 1924 1925 7th Annual Convention June 26-29,
Trends l%etropolitan America, 1
 AN INFORMATION REPORT Trends 0 l%etropolitan America, ADVISORY COMMISSION ON INTERGOVERNMENTAL RELATIONS Washington, D.C. 20575 February 977 M 08 PREFACE ACIR has maintained a continuing interest in metropolitan
MARKETBEAT U.S. Shopping Center Q4 2018
 MARKETBEAT U.S. Shopping Center Q4 2018 U.S. SHOPPING CENTER Economic Indicators Market Indicators Rent Rate vs. Overall Vacancy Availability by Type Q4 17 Q4 18 Vacancy Rates 6.7% 6.3% Net Absorption
United States Office 2Q 2016
 MARKETBEAT United States Office 2Q 2016 U.S. OFFICE Employment Indicators Market Indicators Net Absorption/Rent 4Q TRAILING AVERAGE Overall Vacancy 2Q 15 2Q 16 Total Nonfarm Employment 141.5M 143.9M Offi
MARKETBEAT U.S. Industrial
 MARKETBEAT U.S. Industrial Q4 2017 U.S. INDUSTRIAL Employment Indicators Q4 16 Q4 17 Total Nonfarm Employment 145.2M 147.2M Industrial Employment 25.4M 25.9M Unemployment 4.7% 4.1% Source: BLS Market Indicators
ustravel.org/travelpromotion
 Agenda 1. Power of Travel Promotion Resources 2. New Tool: Travel Economic Impact Calculator 3. Accessing data through Interactive Travel Analytics 4. Unused Vacation Time Opportunity 5. Highlights from
CONNECTICUT INTERSTATE AND INTRASTATE LOCAL REDUCED CITY-PAIR FARES
 PASSENGER TARIFF AND SALES MANUAL CONNECTICUT INTERSTATE AND INTRASTATE LOCAL REDUCED CITY-PAIR S The following section contains city-pair fares that are lower than walkup mileage-based fares. Although
Get Smart Market Insights from Our Research Team Customer Conference
 Get Smart Market Insights from Our Research Team 217 Customer Conference Presenters Amanda Nunnink Amanda Nunnink Steve Steve Guggenmos Guggenmos Sara Steve Hoffman Griffin Steve Sara Griffin Hoffmann
Where We Stand: 8th Edition Chapter 1: Demographics November 2018
 Where We Stand: 8th Edition Chapter 1: Demographics November 2018 The Where We Stand series produced by East-West Gateway (EWG) has provided comparisons of the St. Louis region with other large metropolitan
U.S. Office Snapshot Q1 2016
 MARKETBEAT U.S. Office Snapshot Q1 2016 U.S. OFFICE Employment Indicators Q1 15 Q1 16 Total Nonfarm Employment 140.8M 143.5M Offi ce-using Employment 30.2M 31.0M Unemployment 5.6% 4.9% Source: BLS Market
Houston Economic Update. Presented by Patrick Jankowski Vice President, Research Greater Houston Partnership
 Houston Economic Update Presented by Patrick Jankowski Vice President, Research Greater Houston Partnership Houston Astros - Percent Regular Season Games Won Help from the bullpen this year Help from the
Trial Locations ADAPT: AGS 003. United States, Arizona. United States, Arkansas. United States, California. United States, Colorado
 Trial Locations ADAPT: AGS 003 United States, Arizona Scottsdale, Arizona, United States, 85259 United States, Arkansas Little Rock, Arkansas, United States, 72205 United States, California La Jolla, California,