Metropolitan Detroit s Diverse Population
|
|
|
- Sheryl Ellen Russell
- 6 years ago
- Views:
Transcription

1 Metropolitan Detroit s Diverse Population presentation to The Detroit Orientation Institute Kurt Metzger???????????? October 16, 2008
2 Changing Face of America 1 in 3 Americans is minority 0.7 million in 2006 Latinos are the largest group 44.3 million (14.8%) African Americans surpassed 40 million (13.4%) Between , 06, Latinos grew 3.4%; Asians grew 3.2%; African Americans grew 1.3% Four states California, Hawaii, New Mexico and Texas, as well as D.C. have people of color in majority People of color are younger on average than whites Latinos 27.4 years; Af-Am. Am. 30.1; Asians 33.5; whites 36.4
3 Changing Face of America 48% of America s largest cities are minority majority today / 303 counties (Wayne) are minority majority It is estimated that Immigration accounts for more than 40 percent of U.S. population growth since 2000 Baby boomers ( 46-64) 64) start retiring Generation X & Y are smaller in numbers Gay & Lesbian population % (28.1 mil) Women fastest growing entrepreneurial segment Religious practice and diversity increasing
4 Projected 50 Years Population Growth Race Whites Blacks Asians Hispanics
5 US: Population by Race: 2000 and % 90.0% 80.0% 70.0% 60.0% 50.0% 40.0% 30.0% 20.0%.0% 0.0% 69.4% 12.7% 50.1% 14.6% 8.0% 3.8% 24.4% 12.6% 1.5% 2.9% White Black Asian Hispanic Other
6 New Sunbelt, Melting Pot, and Heartland States Source: William H. Frey New Sunbelt Melting Pot Heartland States
7 Share of U.S. in Melting Pot States Foreign Born 70% Asian Language at Home 68% Spanish at Home 76% Mixed Marriages 51% Native Born 37% English at Home 34%
8 Race Composition of Regions 2% 7% Melting Pot 25% 55% 14% New Sunbelt 2% 3% 9% 12% Heartland 2% 2% 4% 11% 72% White Black Asian Other Hispanic 80%
9 MICHIGAN: : Population by Race/Ethnicity: % 90% 80% 70% 60% 50% 40% 30% 20% % 0% 2.2% 0.1% 3.3% 1.8% 3.9% 1.4% 4.0% 0.6% 1.4% 1.1% 0.5% 1.8% 0.5% 2.3% 0.5% 2.4% 13.8% 14.1% 14.1% 14.1% 82.3% 78.6% 77.7% 77.6% Hispanic / Latino Other / Multi- Race Asian/Pacific Islander Native American Black /African American White Source: Census Bureau 1

10 The Transformation of Detroit No one social program or policy, no single force, whether housing segregation, social welfare programs or deindustrialization, could have driven Detroit and other cities like it from their position of economic and political dominance; there is no simple explanation for the inequality and marginality that beset the urban poor. It is only through the complex and interwoven histories of race, residence and work in the postwar era that the state of today s cities and their impoverished residents can be fully understood and confronted. Thomas J. Sugrue, The Origins of the Urban Crisis: Race and Inequality in Postwar Detroit. Page 5 A number of historical and contemporary policies and structural factors created today s conditions in Detroit
11 Detroit s Population Losses Post-World War II Marked the True Beginning of the Suburbs Population 3,500,000 3,000,000 Detroit Suburbs 2,500,000 2,000,000 1,500,000 1,000, ,
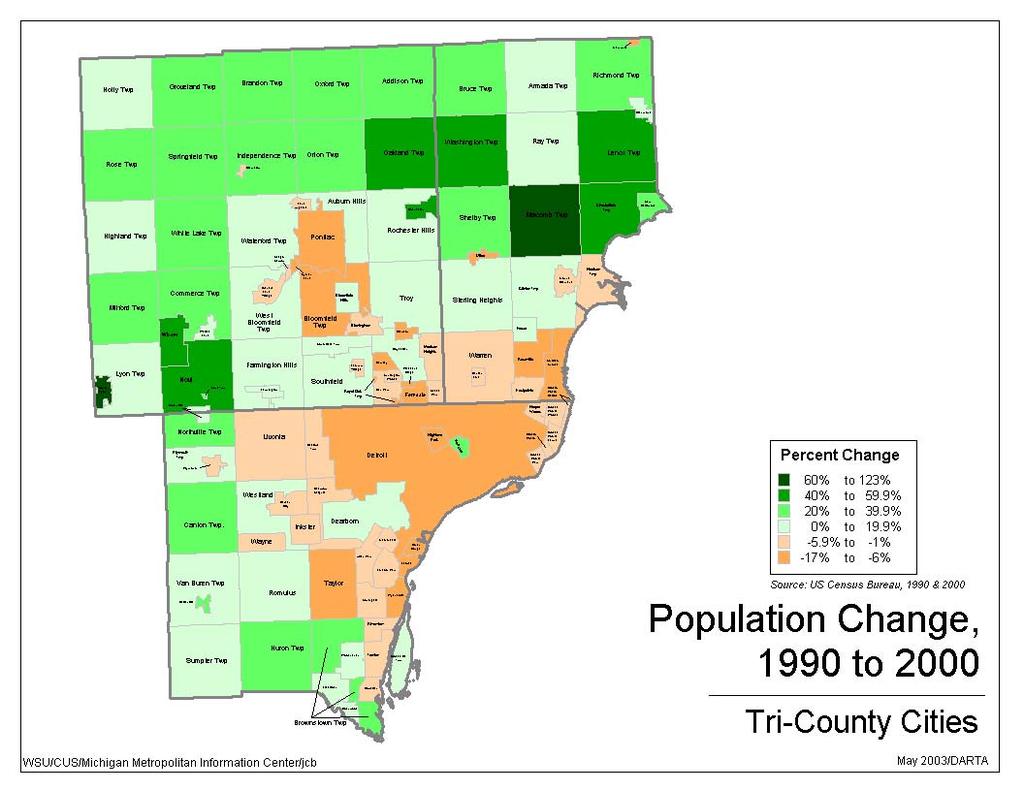
12 While the Tri-County Has Lost Population Since 1970, Outlying Suburbs Have Grown At the Expense of the Core Tri County Suburbs Detroit 4,500,000 4,000,000 3,762,360 4,204,443 4,044,236 3,912,679 4,043,467 4,049,813 4,022,267 3,500,000 3,000,000 3,016,197 2,692,961 2,840,897 2,884,705 3,092,197 3,130,964 3,5,315 2,500,000 2,000,000 1,500,000 1,000,000 1,849,568 1,166,629 2,092,216 1,670,144 1,511,482 1,203,339 1,027, , , , , Source: U.S. Census Bureau
13 Telegraph Telegraph Telegraph Telegraph Telegraph Telegraph Telegraph Telegraph Telegraph Van Van Van Van Van Van Van Van Van Dyke Dyke Dyke Dyke Dyke Dyke Dyke Dyke Dyke Grand River Highland Park Hamtramck Woodward Woodward Woodward Woodward Woodward Woodward Woodward Woodward Woodward Gratiot Gratiot Gratiot Gratiot Gratiot Gratiot Gratiot Gratiot Gratiot Belle Isle Michigan 3 Detroit River Persons Per Square Mile 40,000 to 67,068 (16) 30,000 to 39,999 (35) 20,000 to 29,999 (2),000 to 19,999 (137) 5,000 to 9,999 (58) 8 to 4,999 (21) Source: US Census Bureau, 1950 Population Density, 1950 Census Tracts Detroit, Michigan 2001 Wayne State University CULMA/Center for Urban Studies/jcb
14 Telegraph Telegraph Telegraph Telegraph Telegraph Telegraph Telegraph Telegraph Telegraph Van Van Van Van Van Van Van Van Van Dyke Dyke Dyke Dyke Dyke Dyke Dyke Dyke Dyke Grand River Highland Park Hamtramck Woodward Woodward Woodward Woodward Woodward Woodward Woodward Woodward Woodward Gratiot Gratiot Gratiot Gratiot Gratiot Gratiot Gratiot Gratiot Gratiot Belle Isle Michigan 3 Detroit River Persons Per Square Mile 40,000 to 56,363 (3) 30,000 to 39,999 (11) 20,000 to 29,999 (88),000 to 19,999 (2) 5,000 to 9,999 (93) 8 to 4,999 (30) Source: US Census Bureau, 1960 Population Density 1960 Census Tracts Detroit, Michigan 2001 Wayne State University CULMA/Center for Urban Studies/jcb
15 Telegraph Telegraph Telegraph Telegraph Telegraph Telegraph Telegraph Telegraph Telegraph Van Van Van Van Van Van Van Van Van Dyke Dyke Dyke Dyke Dyke Dyke Dyke Dyke Dyke Grand River Highland Park Hamtramck Woodward Woodward Woodward Woodward Woodward Woodward Woodward Woodward Woodward Gratiot Gratiot Gratiot Gratiot Gratiot Gratiot Gratiot Gratiot Gratiot Belle Isle Michigan 3 Detroit River Persons Per Square Mile 30,000 to 39,641 (7) 20,000 to 29,999 (52),000 to 19,999 (212) 5,000 to 9,999 (8) 402 to 4,999 (42) Population Density 1970 Census Tracts Source: US Census Bureau, 1970 Detroit, Michigan 2001 Wayne State University CULMA/Center for Urban Studies/jcb
16 Telegraph Telegraph Telegraph Telegraph Telegraph Telegraph Telegraph Telegraph Telegraph Van Van Van Van Van Van Van Van Van Dyke Dyke Dyke Dyke Dyke Dyke Dyke Dyke Dyke Grand River Highland Park Hamtramck Woodward Woodward Woodward Woodward Woodward Woodward Woodward Woodward Woodward Gratiot Gratiot Gratiot Gratiot Gratiot Gratiot Gratiot Gratiot Gratiot Belle Isle Michigan 3 Detroit River Persons Per Square Mile,000 to 17,115 (73) 5,000 to 9,999 (176) 7 to 4,999 (64) No Population (1) Source: US Census Bureau, 2000 Population Density 2000 Census Tracts Detroit, Michigan 2001 Wayne State University CULMA/Center for Urban Studies/jcb
17
18 Figure 6 Net Flow of Domestic Migration Southeast Michigan, ,000 35,000 15,000 St. Clair 4,000 2,000 7,000 7,000 Livingston 6,000 Oakland,000 16,000 Macomb 5,000 15,000 1,000 4,000 Washtenaw 7,000 Balance of Wayne 18,000 Detroit 18,000 1,500 0 Monroe 3,000 32,000 Arrows extending beyond the Southeast Michigan boundary represent the net flow of domestic migration between the specific county/area and U.S. counties outside the region. In net terms, 32,000 more persons moved from the Balance of Wayne County to U.S. counties outside the region, from Note: Numbers shown represent the net flow of persons age five and older. Net flows between non-adjacent counties areas in Southeast Michigan are less than 2,000. For purposes of map clarity, these net flows are not shown. Source: U.S. Census Bureau.?? - Migration and its Impact on Southeast Michigan,

19 Population Change in Detroit Suburbanization has stripped Detroit of much of its population Housing discrimination blocked access out of the city for African Americans Leaving the city extremely segregated The six foot high concrete wailing wall built to segregate African Americans from a White housing development.
20 Michigan Michigan Michigan Michigan Michigan Michigan Michigan Michigan Michigan Van Dyke Highland Park Gratiot Telegraph Hamtramck Grand Grand Grand Grand Grand Grand Grand Grand Grand River River River River River River River River River Woodward 39 Belle Isle Detroit River Predominant Race by Census Tract White Black Predominant Race by Source: US Census Bureau, CensusTract Detroit, Michigan 2001 Wayne State University CULMA/Center for Urban Studies/jcb
21 Michigan Michigan Michigan Michigan Michigan Michigan Michigan Michigan Michigan Van Dyke Highland Park Gratiot Telegraph Hamtramck Grand Grand Grand Grand Grand Grand Grand Grand Grand River River River River River River River River River Woodward 39 Belle Isle Detroit River Predominant Race by Census Tract White Black No Predominant Race Predominant Race by Source: US Census Bureau, CensusTract Detroit, Michigan 2001 Wayne State University CULMA/Center for Urban Studies/jcb
22 Michigan Michigan Michigan Michigan Michigan Michigan Michigan Michigan Michigan Van Dyke Highland Park Gratiot Telegraph Hamtramck Grand Grand Grand Grand Grand Grand Grand Grand Grand River River River River River River River River River Woodward 39 Belle Isle Detroit River Predominant Race by Census Tract White Black Predominant Race by Source: US Census Bureau, CensusTract Detroit, Michigan 2001 Wayne State University CULMA/Center for Urban Studies/jcb
23 Michigan Michigan Michigan Michigan Michigan Michigan Michigan Michigan Michigan Van Dyke Belle Isle Detroit River 3 39 Highland Park Hamtramck Telegraph Grand Grand Grand Grand Grand Grand Grand Grand Grand River River River River River River River River River Woodward Gratiot Predominant Race by Census Tract Hispanic Black White No Population No Predominant Race Source: US Census Bureau Wayne State University Predominant Race by 2000 Census Tract Detroit, Michigan CULMA/Center for Urban Studies/jcb
24 South Predominant Race by 2000 Census Tract* Metropolitan Detroit Area Memphis Holly Groveland Brandon Oxford Addison Bruce Armada Richmond Richmond Washington Ray Rose Springfield Independence Clarkston Orion Oakland Lenox Highland White Lake Oakland Waterford Keego Harbor Lake Angelus Sylvan Lake Pontiac Auburn Hills Rochester Rochester Hills Shelby Macomb Macomb Utica Mount Clemens Chesterfield Harrison New Baltimore Milford Commerce Walled Wixom Lake Orchard Lake Village West Bloomfield Bloomfield Bloomfield Hills Birmingham Troy Clawson Sterling Heights Clinton Fraser Lyon Lyon Novi Novi Farmington Hills Farmington Southfield Lathrup Village Southfield Royal Oak Madison Royal Oak Heights Berkley Pleasant Ridge Huntington Woods Oak Park Hazel Park Ferndale Warren Center Line Roseville Eastpointe St. Clair Shores Grosse Pointe Shores Northville Northville Plymouth Plymouth Livonia Wayne Redford Detroit Highland Park Hamtramck Harper Woods Grosse Pointe Park Grosse Pointe Grosse Pointe Woods Grosse Pointe Farms Lake St. Clair Westland Garden City Dearborn Heights Detroit River Canton. Inkster Dearborn Van Buren Wayne Romulus Taylor Melvindale River Rouge Allen Park Ecorse Lincoln Park Wyandotte Canada Predominant Race by Census Tract C a n a d a Belleville Sumpter Huron Southgate Riverview Woodhaven Trenton Grosse Ile No Population White Black Hispanic No Predominant Race Flat Rock Gibraltar Brownstown Rockwood Source: US Census Bureau Wayne State Univesity/Center for Urban Studies Lake Erie
25 Black White Segregation Ranking of U.S. Metro Areas (out of 318) Rank Metro Rank 1 Gary, IN 14 Cincinnati, OH 2 Detroit, MI 20 Benton Harbor, MI 3 Milwaukee, WI 21 Youngstown-Warren, OH 4 New York, NY 30 Dayton, OH 5 Chicago, IL 36 Toledo, OH 6 Newark, NJ 41 Grand Rapids-Musk., MI 7 Flint, MI 52 Jackson, MI 8 Buffalo, NY 76 Ann Arbor, MI 9 Cleveland-Lorain, OH 143 Lansing-East Lansing, MI Saginaw-Bay Bay-Mid, MI 152 Kalamazoo Battle Crk,, MI Source: 2000 Census
26 Whites have moved throughout the region since 1970, while African Americans have moved primarily to concentrated areas adjacent to the City of Detroit. Prepared by: Kirwan Institute Date: September 30, 2005 Projection: State Plane 83 Michigan South Source: Neighborhood Change Database; Geography Network; U.S. Census Bureau Notes: White Population Change 1970 to 2000 Detroit and Surrounding Counties Prepared by: Kirwan Institute Date: September 30, 2005 Projection: State Plane 83 Michigan South Source: Neighborhood Change Database; Geography Network; U.S. Census Bureau Notes: African American Population Change 1970 to 2000 Detroit and Surrounding Counties Lapeer Lapeer St. Clair St. Clair Oakland Macomb Oakland Macomb Wayne Wayne Monroe County Boundaries Water Bodies Census Tracts Population Loss Above 5000 Persons Monroe County Boundaries Water Bodies Census Tracts Population Loss Above 5000 Persons
27 The Non-White Population Has Been Slow to Grow Outside of Detroit Until the 1990s 90% 80% 70% 60% Percent Non-White Population % 40% 30% 20% % 0% Macomb Oakland Out-Wayne Detroit Source: Census Bureau
28 The Movement of Persons of Color to the Suburbs Marked the Decade of the 1990s White Black Asian Hispanic Multi/Othr Macomb 34,402,838 8,005 4,457 12,841 Oakland 13,452 42,907 24,827 9,369 19,692 Washtenaw 12,095 7,992 8,779 3,8 7,414 Out-Wayne -44,235 21,866 12,970 8,007 26,672 Detroit -112,357-2,563 1,219 18,694 18,664 Source: Census Bureau
29 The 1990s Brought a Large Out-migration of Blacks and Higher Income Households From Detroit 90% 80% 2000 Census Distribution Share of Outmigrants 70% 60% 50% 40% 30% 20% % 0% White Black Asian Other Hispanic/Latino < $25,000 $25,000 - $49,999 $50,000 - $74,999 $,000 or more Source: MIMIC/SEMCOG Analysis of 2000 PUMS
30 The Growth and Movement of Persons of Color Throughout the Region Has Increased Since % 140% Macomb Oakland Wayne 120% 144% 0% 80% 60% 40% 20% 0% -20% 46% 27% 38% 24% 21% 33% 2% 1% -6% 35% 21% % -13% -1% Black Native American Asian Multi-Race Hispanic -40% Source: Census Bureau Estimates
31 South Black Population by 2000 Census Tract Metropolitan Detroit Area Memphis Holly Groveland Brandon Oxford Addison Bruce Armada Richmond Richmond Washington Ray Rose Springfield Independence Clarkston Orion Oakland Lenox Highland White Lake Oakland Waterford Keego Harbor Lake Angelus Sylvan Lake Pontiac Auburn Hills Rochester Rochester Hills Shelby Macomb Macomb Utica Mount Clemens Chesterfield Harrison New Baltimore Milford Commerce Walled Wixom Lake Orchard Lake Village West Bloomfield Bloomfield Bloomfield Hills Birmingham Troy Clawson Sterling Heights Clinton Fraser Lyon Lyon Novi Novi Farmington Hills Farmington Southfield Lathrup Village Southfield Royal Oak Madison Royal Oak Heights Berkley Pleasant Ridge Huntington Woods Oak Park Hazel Park Ferndale Warren Center Line Roseville Eastpointe St. Clair Shores Grosse Pointe Shores Northville Northville Plymouth Plymouth Livonia Wayne Redford Detroit Highland Park Hamtramck Harper Woods Grosse Pointe Park Grosse Pointe Grosse Pointe Woods Grosse Pointe Farms Lake St. Clair Westland Garden City Dearborn Heights Detroit River Canton. Inkster Dearborn Van Buren Wayne Romulus Taylor Melvindale River Rouge Allen Park Ecorse Lincoln Park Wyandotte Canada Percent Black, Non-Hispanic C a n a d a Belleville Sumpter Huron Southgate Riverview Woodhaven Trenton Flat Rock Gibraltar Grosse Ile No Population 80% to 0% 60% to 79.9% 40% to 59.9% 20% to 39.9% 0% to 19.9% Brownstown Rockwood Source: US Census Bureau Wayne State Univesity/Center for Urban Studies Lake Erie
32 South Asian Population by 2000 Census Tract Metropolitan Detroit Area Memphis Holly Groveland Brandon Oxford Addison Bruce Armada Richmond Richmond Washington Ray Rose Springfield Independence Clarkston Orion Oakland Lenox Highland White Lake Oakland Waterford Keego Harbor Lake Angelus Sylvan Lake Pontiac Auburn Hills Rochester Rochester Hills Shelby Macomb Macomb Utica Mount Clemens Chesterfield Harrison New Baltimore Milford Commerce Walled Wixom Lake Orchard Lake Village West Bloomfield Bloomfield Bloomfield Hills Birmingham Troy Clawson Sterling Heights Clinton Fraser Lyon Lyon Novi Novi Farmington Hills Farmington Southfield Lathrup Village Southfield Royal Oak Madison Royal Oak Heights Berkley Pleasant Ridge Huntington Woods Oak Park Hazel Park Ferndale Warren Center Line Roseville Eastpointe St. Clair Shores Grosse Pointe Shores Northville Northville Plymouth Plymouth Livonia Wayne Redford Detroit Highland Park Hamtramck Harper Woods Grosse Pointe Park Grosse Pointe Grosse Pointe Woods Grosse Pointe Farms Lake St. Clair Westland Garden City Dearborn Heights Detroit River Canton. Inkster Dearborn Van Buren Belleville Sumpter Wayne Romulus Huron Taylor Melvindale River Rouge Allen Park Ecorse Lincoln Park Wyandotte Southgate Riverview Woodhaven Trenton Grosse Ile Flat Rock Gibraltar Canada Percent Asian, Non-Hispanic C a n a d a No Population 24% to 31% 18% to 23.9% 12% to 17.9% 6% to 11.9% 0% to 5.9% Brownstown Rockwood Source: US Census Bureau Lake Erie Wayne State Univesity/Center for Urban Studies
33 South Hispanic Population by 2000 Census Tract Metropolitan Detroit Area Memphis Holly Groveland Brandon Oxford Addison Bruce Armada Richmond Richmond Washington Ray Rose Springfield Independence Clarkston Orion Oakland Lenox Highland White Lake Oakland Waterford Keego Harbor Lake Angelus Sylvan Lake Pontiac Auburn Hills Rochester Rochester Hills Shelby Macomb Macomb Utica Mount Clemens Chesterfield Harrison New Baltimore Milford Commerce Walled Wixom Lake Orchard Lake Village West Bloomfield Bloomfield Bloomfield Hills Birmingham Troy Clawson Sterling Heights Clinton Fraser Lyon Lyon Novi Novi Farmington Hills Farmington Southfield Lathrup Village Southfield Royal Oak Madison Royal Oak Heights Berkley Pleasant Ridge Huntington Woods Oak Park Hazel Park Ferndale Warren Center Line Roseville Eastpointe St. Clair Shores Grosse Pointe Shores Northville Northville Plymouth Plymouth Livonia Wayne Redford Detroit Highland Park Hamtramck Harper Woods Grosse Pointe Park Grosse Pointe Grosse Pointe Woods Grosse Pointe Farms Lake St. Clair Westland Garden City Dearborn Heights Detroit River Canton. Inkster Dearborn Van Buren Belleville Sumpter Wayne Romulus Huron Taylor Melvindale River Rouge Allen Park Ecorse Lincoln Park Wyandotte Southgate Riverview Woodhaven Trenton Grosse Ile Canada Percent Hispanic C a n a d a No Population 9% to 77% 6% to 8.9% 3% to 5.9% 0% to 2.9% Flat Rock Gibraltar Source: US Census Bureau Rockwood Brownstown Wayne State Univesity/Center for Urban Studies Lake Erie
34 New Immigrants Had a Large Impact on Southeast Michigan in the 1990s Arrived in 1980s Arrived in 1990s % of Total Foreign Born Livingston 333 1, Macomb 7,119 23, Monroe Oakland 20,364 53, St. Clair 411 1, Washtenaw,1 18, Wayne 27,177 66,5 48
35 Asian Indian Egyptian Filipino Pakistani Chinese Japanese Korean Columbian Palestinian Armenian Syrian Jordanian Ukrainian Cuban Total Arab Lebanese Vietnamese Total Dominican Iraqi Bangladeshi Albanian Chaldean Black Mexican Puerto R. Hmong College Graduation Rates Range Widely Across Racial and Ethnic Groups
36 Immigration Continues to Partially Stem the Tide of Population Losses Due to Domestic Out-Migration Net Domestic Migration International Migration Net Migration Michigan -356, , ,818 Livingston 17,017 1,066 18,083 Macomb 6,703 13,547 20,250 Monroe 3, ,893 Oakland -61,885 33,453-28,432 Washtenaw -3,5 14,262,687 Wayne -227,272 41, ,898 Source: Census Bureau Estimates Division Period covered: 7/1/00 7/1/07
37 Top Countries of Origin for Immigrants Coming to Metropolitan Detroit, ,000 7,430 7,000 6,000 5,000 4,954 4,000 3,000 2,000 1,000 3,144 2,860 2,698 2,250 2,012 1,923 1,812 1,529 1,488 1,068 0 India Iraq Albania Yemen Lebanon China Mexico Canada Bangladesh Romania Philippines Pakistan Source: US Dept. of Homeland Security/Immigration
38 2004 Jewish Federation Membership by Census Tract Southeast Michigan ssee Genesee Lapeer Oakland St. Clair Macomb ingston ashtenaw Wayne Members per Tract 1, to 0 to to 9 No Members Source: Jewish Federation WSU/CUS/Michigan Metropolitan Information Center/ djt November 2004
39 Persons of Arab Ancestry Tri-County Detroit Area Oakland Macomb Wayne Total Persons 2,500 to 4, to 2,499 0 to to 99 1 to 49 0 Source: US Census Bureau, 2000 Wayne State Univesity/Center for Urban Studies
40 Persons of Assyrian, Chaldean or Syriac Ancestry Tri-County Detroit Area Oakland Macomb Wayne Total Persons 500 to to to to 99 1 to 49 0 Source: US Census Bureau, 2000 Wayne State Univesity/Center for Urban Studies

41 What Has Accompanied These Changes? Concentrated poverty in the City Abandonment, disinvestment and vacancy in the City of Detroit Extreme segregation Greater land consumption with declining population Shifting of employment activities to the suburbs The suburbs have about 85% of the region's retail establishments and 87% of the jobs Impacts on the economic health of the entire Detroit region Suburban Job Centers in Detroit
42 Source: Brookings Institution, 2001 Detroit is the Most Decentralized Employment Metro in the U.S. Metro Area 3-mile share -mile share Outside -miles Detroit Los Angeles-Long Beach St. Louis Tampa St. Pete Riverside-San Bern Greensboro-Win Salem Chicago Atlanta Dallas Cleveland
43 The Number of Tri-County Residents Reporting Working in Detroit Has Dropped by 391,000 (57%) Over Last 40 Years 0, , , , , , , , , , , , ,000 0,000 50, Tri-County Macomb Oakland Out-Wayne Detroit Source: Census Bureau
44 Detroit s Daytime Population is Slightly Less than Its Residential Population Oklahoma City city, OK Portland city, OR Fort Worth city, TX Charlotte city, NC Nashville-Davidson (balance), TN Denver city, CO Seattle city, WA El Paso city, TX Washington city, DC Boston city, MA Milw aukee city, WI Memphis city, TN Baltim ore city, MD Austin city, TX Columbus city, OH Jacksonville city, FL San Francisco city, CA Indianapolis city (balance), IN San Jose city, CA Detroit city, MI San Antonio city, TX Dallas city, TX San Diego city, CA Phoenix city, AZ Philadelphia city, PA Houston city, TX Chicago city, IL Los Angeles city, CA Ne w York city, NY
45 Less than Half of Detroit Resident Workers Work Within the City of Detroit Oklahoma City city, OK Portland city, OR Fort Worth city, TX Charlotte city, NC Nashville-Davidson (balance), TN Denver city, CO Seattle city, WA El Paso city, TX Washington city, DC Boston city, MA Milw aukee city, WI Memphis city, TN Baltim ore city, MD Austin city, TX Columbus city, OH Jacksonville city, FL San Francisco city, CA Indianapolis city (balance), IN San Jose city, CA Detroit city, MI San Antonio city, TX Dallas city, TX San Diego city, CA Phoenix city, AZ Philadelphia city, PA Houston city, TX Chicago city, IL Los Angeles city, CA Ne w York city, NY
46 Detroit Has Consistently Been Among the Leaders in Per Capita Income Gap City vs. Suburbs Metro Area Index 2000 Rank 2000 Rank 1990 Rank 1980 Hartford Detroit Milwaukee Cleveland Philadelphia New York Rochester St. Louis Buffalo Providence Chicago Source: Pulling Apart: Economic Segregation Among Suburbs and Central Cities in Major Metropolitan Areas, Brookings Institution
47 2007 Graduation Rates Show Males Trailing Females in All Racial/Ethnic Groups Rates Are Lowest for African American and Hispanic Males 0% 90% 80% 70% 60% 50% 71.1% 80.1% 78.2% 85.1% 48.4% 64.8% 59.9% 72.4% 81.3% 88.3% 52.3% Male 63.5% Female 71.6% 66.2% 40% 30% 20% % 0% All Students White African- American Native American Asian / PI Hispanic Multiracial Source: MI Dept. of Education / CEPI
48 The Role of Housing Affordable housing must be deliberately and intelligently connected to high performing schools, sustainable employment, necessary transportation infrastructure, childcare, and institutions that facilitate civic and political activity. Childcare Health Housing Employment Effective Education Participation Transportation Housing is critical in determining access to opportunity. Housing is a component of a larger set of interrelated structures that are both affected by housing and have impacts on the attainment of safe, stable housing.
49 Understanding Spatial Segregation Impacts on Health School Segregation Impacts on Educational Achievement Exposure to crime; arrest Transportation limitations and other inequitable public services Neighborhood Segregation Job segregation Racial stigma, other psychological impacts Impacts on community power and individual assets
50 Equitable Regionalism Regional equity is more than just reducing disparities In practice: Providing opportunities in Housing Education Workforce development Economic development
51 Metropolitan Detroit s Diverse Population presentation to The Detroit Orientation Institute Kurt Metzger???????????? October 16, 2008
presentation to Director
 2010-1111 Macomb Community Needs Assessment The Demographic and Economic Landscape presentation to Macomb Community Action Advisory Board Meeting Kurt Metzger Director Data Driven Detroit (D3) June 14,
50 Largest U.S. Metropolitan Areas
 America s Racially : Opportunities and Challenges 50 Largest U.S. Metropolitan Areas Community types in the 50 largest metropolitan areas White 39,333,003 26% 14,533,326 16,983,337 9% 10% White 47,406,687
Lower Income Journey to Work Market Share From American Community Survey
 Lower Income Journey to Work Market Share From American Community Survey 2006-2010 Table 1: Overall National Data Table 2: Car, Truck or Van Table 3: Transit Table 4: Metrics Table 1 Work Trip Market Share:
Rank Place State Native Hawaiian and Pacific Islander population (alone or in combination
 TABLE 2a: 100 Largest Places Ranked by Number of s (race alone or in *) Living in Hard-to- Census Rank Place State (alone or in 1 Honolulu (CDP) HI 64,196 11,130 17.3 2 New York City NY 14,981 8,211 54.8
State of Michigan Local Government FY 2011 Financial Data (by Population Category)
") Local Au Gres Brooklyn Village Coleman Crystal Falls Frankfort Harbor Springs Lexington Village Luna Pier Mackinaw City Village Pentwater Village Southfield Township Less than 1,500 Total Less than 1,500
Local Au Gres Brooklyn Village Coleman Crystal Falls Frankfort Harbor Springs Lexington Village Luna Pier Mackinaw City Village Pentwater Village Southfield Township Less than 1,500 Total Less than 1,500
Population Estimates for U.S. Cities Report 1: Fastest Growing Cities Based on Numeric Increase,
 ulation s for U.S. Cities Report 1: Fastest Growing Cities Based on Numeric Increase, 2015-2015 1 Phoenix AZ 32,113 2.0 1,582,904 1,615,017 167,393 11.6 2 Los Angeles CA 27,173 0.7 3,949,149 3,976,322
Location, Location, Location. 19 th Annual NIC Conference NIC MAP Data & Analysis Service
 Location, Location, Location 19 th Annual NIC Conference NIC MAP Data & Analysis Service The Great Occupancy Decline 94% Occupancy Trends Majority Nursing Seniors Housing 93% 92% 91% 92.8% 91.0% 90% 89%
Census Affects Children in Poverty by Professors Donald Hernandez and Nancy Denton State University of New York, Albany
 Phone: (301) 457-9900 4700 Silver Hill Road, Suite 1250-3, Suitland, MD 20746 Fax: (301) 457-9901 Census Affects in Poverty by Professors Donald Hernandez and Nancy Denton State University of New York,
NOVI (METRO DETROIT), MICHIGAN
, MICHIGAN") NOVI (METRO DETROIT), MICHIGAN NOVI THE JEWEL OF DETROIT With its international culture and access to world markets, Novi attracts companies that pride themselves on innovation and people that desire a
NOVI (METRO DETROIT), MICHIGAN NOVI THE JEWEL OF DETROIT With its international culture and access to world markets, Novi attracts companies that pride themselves on innovation and people that desire a
A COMPARISON OF THE MILWAUKEE METROPOLITAN AREA TO ITS PEERS
 KRY/WJS/EDL #222377 (PDF: #223479) 1/30/15 PRELIMINARY DRAFT Memorandum Report A COMPARISON OF THE MILWAUKEE METROPOLITAN AREA TO ITS PEERS EXECUTIVE SUMMARY This memorandum report provides a statistical
Major Metropolitan Area Sales Tax Rates
 August 19, 2010 No. 239 FISCAL FACT Major Metropolitan Area Sales Tax Rates By Lawrence Summers Introduction General sales taxes levied by state, county and city governments in the United States vary greatly,
Appendix D: Aggregation Error for New England Metro Areas and for Places
 Appendix D: for New England Metro Areas and for Places D-1 Appendix D: s Figure D-1: New England Metro Areas - Summary of Tract s (2000) Metro ID (msapma99) Metro Area Name Census NCDB 1120 Boston, MA-NH
PUBLIC TRANSPORTATION INTRODUCTION
 PUBLIC TRANSPORTATION INTRODUCTION 1 OUTLINE Current Status and Recent Trends Significant Influences A Critical Assessment Arguments Supporting Public Transport Future Influences Ingredients for Future
S T A T E O F M I C H I G A N BEFORE THE MICHIGAN PUBLIC SERVICE COMMISSION * * * * *
 S T A T E O F M I C H I G A N BEFORE THE MICHIGAN PUBLIC SERVICE COMMISSION * * * * * In the matter of the application of ) COMCAST TELECOMMUNICATIONS OF ) MICHIGAN, LLC, to expand the geographic ) Case
Higher Education in America s Metropolitan Areas A Statistical Profile
 Higher Education in America s Metropolitan Areas A Statistical Profile MSA Study No.2 Higher Education in America s Metropolitan Areas A Statistical Profile CONTENTS Why Metro Areas? 1 Executive Summary
International migration. Total net migration. Domestic migration
 Indicator Direction Comparables a. Net population migration b. Crime rate (city) c. Housing costs d. Cost-of-living index N.A. e. State & local tax intensity f. Performing arts groups g. Air quality index
INDIANA INTERSTATE AND INTRASTATE LOCAL REDUCED CITY-PAIR FARES
 The following section contains city-pair fares that are lower than walkup mileage-based fares. Although shown in only one direction, the fares in this section apply in both directions, unless otherwise
Who Sprawls the Most?
 SPRAWL AMERICAN STYLE Who Sprawls the Most? Jackie Cutsinger Research Assistant, Center for Urban Studies Wayne State University Measuring Sprawl in Major Metros Regionally stratified, nationally representative
OB-GYN Workload & Potential Shortages: The Coming U.S. Women s Health Crisis
 OB-GYN Workload & Potential Shortages: The Coming U.S. Women s Health Crisis JULY 2017 Introduction Obstetricians and Gynecologists (OB-GYNs) are a critical part of the health care provider community.
FBI Drug Demand Reduction Coordinators
 FBI Drug Demand Reduction Coordinators Alabama 2121 Building, Room 1400 Birmingham, AL 35203 (205) 252 7705 One St. Louis Centre One St. Louis Street Mobile, AL 36602 (334) 438 3674 Alaska 222 West Seventh
7. Thrifty Outlet, MI 4677 Alpine Ave NW, Comstock Park, MI Norton Shores, MI 700 W Norton Ave, Muskegon, MI 49441
 Meijer Stores Michigan 7. Thrifty Outlet, MI 4677 Alpine Ave NW, Comstock Park, MI 49321 19. Norton Shores, MI 700 W Norton Ave, Muskegon, MI 49441 20. Walker, MI 2929 Walker Ave NW, Grand Rapids, MI 49544
ILLINOIS INTERSTATE AND INTRASTATE LOCAL REDUCED CITY-PAIR FARES
 The following section contains city-pair fares that are lower than walkup mileage-based fares. Although shown in only one direction, the fares in this section apply in both directions, unless otherwise
Norwegian's Free Airfare Promotion
 Norwegian's Free Airfare Promotion Start planning your next vacation with 200+ cruises to incredible destinations, including Alaska, Bahamas & Florida, Bermuda, Canada & New England, Caribbean, Mexican
Field Inspection Clients
 FL Lake County FL Mount Dora City 2015 Miami-Dade County FL Medley Town 2016 Palm Beach County FL Tequesta Village 2017 Sarasota County FL Longboat Key Town 2017 GA Douglas County GA Douglasville City
Monthly Employment Watch: Milwaukee and the Nation's Largest Cities
 Monthly Employment Watch: Milwaukee and the Nation's Largest Cities A monthly report on employment trends in the nation s largest cities Prepared by: The University of Wisconsin-Milwaukee Center for Economic
Hector International Airport Fargo, North Dakota
 Hector International Airport Fargo, North Dakota Volume 072 Twelve Months Ended June 2007 November 2007 Airlines Serving Fargo Carried 830 Onboard Passengers Per Day for the Twelve Months Ended June 2007,
Oakland County, Michigan. Ronald Goldstone, Senior Vice President
 PROPOSED Unique 500,000 s.f. Stacked Retail Development Oakland County, Michigan Located in the center of Oakland County Dense population, strong incomes, and high traffic volume 18.7 total acres Zoned
Park-Related Total* Expenditure per Resident, by City
 Park-Related Total* per Resident, by City FY 2008 City Population Total Park per Resident Washington, D.C. 591,833 $153,324,830 $259 Seattle 598,541 $150,672,543 $252 Scottsdale 235,371 $50,429,049 $214
Timesheets Clients. Fayette County GA. Carroll County AR. Gwinnett County GA. Pulaski County AR. Cook County IL. Brevard County FL.
 AR Carroll County AR Eureka Springs City 2013 Fayette County GA Peachtree City 2016 Pulaski County AR Jacksonville City 2012 Gwinnett County GA Suwanee City 2013 FL Brevard County FL West Melbourne City
Monthly Employment Watch: Milwaukee and the Nation's Largest Cities
 Monthly Employment Watch: Milwaukee and the Nation's Largest Cities A monthly report on employment trends in the nation s largest cities Prepared by: The University of Wisconsin-Milwaukee Center for Economic
BLACK KNIGHT HPI REPORT
 CONTENTS 1 OVERVIEW 2 NATIONAL OVERVIEW 3 LARGEST STATES AND METROS 4 FEBRUARY S BIGGEST MOVERS 5 20 LARGEST STATES 6 40 LARGEST METROS 7 ADDITIONAL INFORMATION OVERVIEW Each month, the Data & Analytics
Hector International Airport Fargo, North Dakota
 Hector International Airport Fargo, North Dakota Volume 073 Twelve Months Ended September 2007 January 2008 Airlines Serving Fargo Carried 831 Onboard Passengers Per Day for the Twelve Months Ended September
District Match Data Availability
 District Match Data Availability National & State Data Location Available National Data Australia Parliament, Provincial and Territory Assemblies Canada Parliament, Provincial Legislative Assemblies New
 Snakes & Lattes is currently composed of three corporate owned and operated board game cafes in Toronto, ON. Over the last 7 years these have become renowned as Toronto's premiere board game cafe destinations.
Access Across America: Transit 2014
 Access Across America: Transit 2014 Final Report CTS 14-11 Prepared by: Andrew Owen David Levinson Accessibility Observatory Department of Civil, Environmental, and Geo- Engineering University of Minnesota
Human Resources Clients
 AR Carroll County AR Eureka Springs City 2013 Pulaski County AR Jacksonville City 2012 North Little Rock City 2016 Monroe County FL Key Largo Wastewater Treatment District 2013 Santa Rosa County FL Gulf
U.S. Metropolitan Area Exports, 2015
 U.S. Metropolitan Area Exports, 2015 Jeffrey Hall Office of Trade and Economic Analysis Industry and Analysis Department of Commerce International Trade Administration September 2016 U.S. Metro Exports:
A COMPARISON OF THE MILWAUKEE METROPOLITAN AREA TO ITS PEERS
 KRY/WJS/EDL #222377 v4 (PDF: #223479v2) 4/1/15 APPENDIX D REVISED DRAFT Memorandum Report A COMPARISON OF THE MILWAUKEE METROPOLITAN AREA TO ITS PEERS EXECUTIVE SUMMARY This report provides a statistical
Real Estate Development Law Update h. February 15 th, Jeff Meyers Principal Meyers LLC (949) x200
 x200") Allen Matkins Real Estate Development Law Update h February 15 th, 2012 Jeff Meyers Principal Meyers LLC (949) 640-0050 x200 JOB TRENDS Job Postings per Capita, 4Q11 Rank (Last Qtr Rank) Metropolitan Area
Allen Matkins Real Estate Development Law Update h February 15 th, 2012 Jeff Meyers Principal Meyers LLC (949) 640-0050 x200 JOB TRENDS Job Postings per Capita, 4Q11 Rank (Last Qtr Rank) Metropolitan Area
Per capita carbon emissions from transportation and residential energy use, 2005
 Per capita carbon emissions from transportation and residential energy use, 2005 Metropolitan Area Carbon Footprint Honolulu, HI 1 1.356 Los Angeles-Long Beach-Santa Ana, CA 2 1.413 Portland-Vancouver-Beaverton,
RANKING OF THE 100 MOST POPULOUS U.S. CITIES 12/7/ /31/2016
 OVERVIEW OF THE DATA The following information is based on incoming communication to the National Human Trafficking Hotline via phone, email, and online tip report from December 7, 2007 December 31, 2016
Impact of Hurricane Irma on US Metropolitan Areas
 Impact of Hurricane Irma on US Metropolitan Areas Puerto Ricans in mainland Prepared for: Jorge Restrepo, CEO 2017 EurekaFacts LLC September 29, 2017 Climate refugees from Puerto Rico in US metropolitan
Houston Economic Update. Presented by Patrick Jankowski Vice President, Research Greater Houston Partnership
 Houston Economic Update Presented by Patrick Jankowski Vice President, Research Greater Houston Partnership Houston Astros - Percent Regular Season Games Won Help from the bullpen this year Help from the
Mango Market Development Index
 Mango Market Development Index 2016-2017 Understanding the Market Index The Mango Market Development Index is designed to measure and compare mango volume sold at retail relative to population by region
Hector International Airport Fargo, North Dakota
 Hector International Airport Fargo, North Dakota Volume 081 Twelve Months Ended March 2008 July 2008 Airlines Serving Fargo Carried 838 Onboard Passengers Per Day for the Twelve Months Ended March 2008,
MANGO MARKET DEVELOPMENT INDEX REPORT
 MANGO MARKET DEVELOPMENT INDEX REPORT 2015-2016 UNDERSTANDING THE MARKET INDEX The Mango Market Development Index is designed to measure and compare mango sales volume relative to population by region
Major US City Preparedness For an Oil Crisis Which Cities and Metro Areas are Best Prepared for $4 a Gallon Gas and Beyond?
 Major US City Preparedness For an Oil Crisis Which Cities and Metro Areas are Best Prepared for $4 a Gallon Gas and Beyond? March 4, 2008 By Warren Karlenzig President Common Current www.commoncurrent.com
L. BROOKS PATTERSON OAKLAND COUNTY EXECUTIVE
 L. BROOKS PATTERSON OAKLAND COUNTY EXECUTIVE L. BROOKS PATTERSON OAKLAND COUNTY EXECUTIVE 2016 APPORTIONMENT REPORT OAKLAND COUNTY, MICHIGAN Prepared By DEPARTMENT OF MANAGEMENT AND BUDGET LAURIE VAN PELT,
Metropolitan Votes and the 2012 U.S. Election: Population, GDP, Patents and Creative Class
 politan Votes and the 2012 U.S. Election: Population, GDP, Patents and Creative Class Author: Shawn Gilligan, Shawn.Gilligan@rotman.utoronto.ca Zara Matheson, Zara.Matheson@rotman.utoronto.ca Kevin Stolarick,
Millennials and the City Wherein Metro Areas In Larger Central Cities Outperformed the Suburbs (2010/15) What Happened in 2016?
 What Happened in 2016?") Millennials and the City Wherein Metro Areas In Larger Central Cities Outperformed the Suburbs (2010/15) What Happened in 2016? Robert W. Burchell, Ph.D., Emeritus Prior Director, Center for Urban Policy
Millennials and the City Wherein Metro Areas In Larger Central Cities Outperformed the Suburbs (2010/15) What Happened in 2016? Robert W. Burchell, Ph.D., Emeritus Prior Director, Center for Urban Policy
MARKETBEAT U.S. Office
 MARKETBEAT U.S. Office Q4 2018 U.S. OFFICE Employment Indicators Market Indicators (Overall) Office: Net Absorption/Asking Rent 4Q TRAILING AVERAGE Office: Overall Vacancy Q4 17 Q4 18 Total Nonfarm Employment
2017 M I C H I G A N
 M I C H I G A N 2017 L. BROOKS PATTERSON OAKLAND COUNTY EXECUTIVE 2017 APPORTIONMENT REPORT OAKLAND COUNTY, MICHIGAN Prepared By DEPARTMENT OF MANAGEMENT AND BUDGET LAURIE VAN PELT, Director EQUALIZATION
University of Denver
 Glenn R. Mueller, Ph.D. Professor University of Denver Franklin L. Burns School of Real Estate & Construction Management & Real Estate Investment Strategist glenn.mueller@du.edu Supply The new supply of
Where We Stand: 8th Edition Chapter 1: Demographics November 2018
 Where We Stand: 8th Edition Chapter 1: Demographics November 2018 The Where We Stand series produced by East-West Gateway (EWG) has provided comparisons of the St. Louis region with other large metropolitan
Agency 35 ft. Over Artic. Trolley 2012 Total and 35 ft. under. 1 1 MTA New York City Transit 0 3, ,344 New York City
 Capital Metro-No. 40 Courtesy Capital Metro 1 1 MTA New York City Transit 0 3,704 640 0 4,344 New York City 2 3 New Jersey Transit Corp. 47 2,263 85 0 2,395 Newark, N.J. 3 2 Metro 50 1,956 378 0 2,384
MARKETBEAT U.S. Office
 MARKETBEAT U.S. Office Q3 2018 U.S. OFFICE Employment Indicators Market Indicators (Overall) Office: Net Absorption/Asking Rent 4Q TRAILING AVERAGE Office: Overall Vacancy Q3 17 Q3 18 Total Nonfarm Employment
Monthly Employment Watch: Milwaukee and the Nation's Largest Cities
 Monthly Employment Watch: Milwaukee and the Nation's Largest Cities A monthly report on employment trends in the nation s largest cities Prepared by: The University of Wisconsin-Milwaukee Center for Economic
Passengers Boarded At The Top 50 U. S. Airports ( Updated April 2
 (Ranked By Passenger Enplanements in 2006) Airport Table 1-41: Passengers Boarded at the Top 50 U.S. Airportsa Atlanta, GA (Hartsfield-Jackson Atlanta International) Chicago, IL (Chicago O'Hare International)
Monthly Employment Watch: Milwaukee and the Nation's Largest Cities
 Monthly Employment Watch: Milwaukee and the Nation's Largest Cities A monthly report on employment trends in the nation s largest cities Prepared by: The University of Wisconsin-Milwaukee Center for Economic
Monthly Employment Watch: Milwaukee and the Nation's Largest Cities
 Monthly Employment Watch: Milwaukee and the Nation's Largest Cities A monthly report on employment trends in the nation s largest cities Prepared by: The University of Wisconsin-Milwaukee Center for Economic
Get Smart Market Insights from Our Research Team Customer Conference
 Get Smart Market Insights from Our Research Team 217 Customer Conference Presenters Amanda Nunnink Amanda Nunnink Steve Steve Guggenmos Guggenmos Sara Steve Hoffman Griffin Steve Sara Griffin Hoffmann
TOP 100. Transit Bus Fleets Agency 35 ft. Over Artic and 35 ft. Total +/- under 0 3, ,426 82
 L.A. Metro-No. 3 1 1 MTA New York City Transit New York City 2 2 New Jersey Transit Corp. Newark, N.J. 3 3 Metro Los Angeles 4 5 Toronto Transit Commission Toronto 5 10 Chicago Transit Authority Chicago
Monthly Employment Watch: Milwaukee and the Nation's Largest Cities
 Monthly Employment Watch: Milwaukee and the Nation's Largest Cities A monthly report on employment trends in the nation s largest cities Prepared by: The University of Wisconsin-Milwaukee Center for Economic
MARKETBEAT U.S. Office
 MARKETBEAT U.S. Office Q3 2017 U.S. OFFICE Employment Indicators Net Absorption/Rent 4-QTR TRAILING AVERAGE Q3 16 Q3 17 Total Nonfarm Employment 144.7M 146.6M Office-using Employment 31.3M 31.9M Unemployment
CONNECTICUT INTERSTATE AND INTRASTATE LOCAL REDUCED CITY-PAIR FARES
 PASSENGER TARIFF AND SALES MANUAL CONNECTICUT INTERSTATE AND INTRASTATE LOCAL REDUCED CITY-PAIR S The following section contains city-pair fares that are lower than walkup mileage-based fares. Although
Annual Report for the Alliance of Rouge Communities
 2017 Annual Report for the Alliance of Rouge Communities January 1, 2017 through December 31, 2017 FRIENDS OF THE ROUGE ANNUAL REPORT 2017 (January 1 through December 31, 2017) For the ALLIANCE OF ROUGE
1Q 2014 Greater Atlanta HBA Builder Developer Lender Council meeting Information presented by. Atlanta Job Growth
 1Q 2014 Greater Atlanta HBA Builder Developer Lender Council meeting 5-21-2014 Information presented by Eugene James, Regional Director ejames@metrostudy.com 404-510-1080 connect on LinkedIn Atlanta Job
MARKETBEAT U.S. Office
 MARKETBEAT U.S. Office Q2 2017 U.S. OFFICE Employment Indicators Q2 16 Q2 17 Total Nonfarm Employment 143.9M 146.2M Office-using Employment 30.1M 31.8M Unemployment 4.9% 4.4% Source: BLS Market Indicators
MARKETBEAT U.S. Office
 MARKETBEAT U.S. Office Q4 2017 U.S. OFFICE Employment Indicators Q4 16 Q4 17 Total Nonfarm Employment 145.2M 147.2M Office-using Employment 31.5M 32.1M Unemployment 4.7% 4.1% Source: BLS Market Indicators
MARKETBEAT U.S. Office
 MARKETBEAT U.S. Office Q4 2016 U.S. OFFICE Employment Indicators Market Indicators (Overall) Q4 15 Q4 16 Vacancy Rate 13.5% 13.2% Net Absorption 20.5M 6.9M Under Construction 94.5M 100.2M Weighted Asking
ECON 166 Lecture 2. J. M. Pogodzinski
 ECON 166 Lecture 2 J. M. Pogodzinski Broad Themes in the Course Measurement Theory Policy 8/27/2014 J. M. Pogodzinski 2 Measurement What is urban? What is the record of urban growth? What is distinct about
TOP 100 Bus Fleets Agency 35 ft. and Over Artic under 35 ft. Total. 18 < metro magazine SEPTEMBER/OCTOBER 2018 metro-magazine.
 1 1 MTA New York City Transit/MTA Bus Co. 0 4,860 951 5,811 New York City 2 3 New Jersey Transit Corp. 418 2,879 85 3,382 Newark, N.J. 3 2 Los Angeles County Metropolitan Transportation Authority 50 1,882
ATTACHMENT A TABLE 1: List of sites with location, area estimate, and site coordinates
 ATTACHMENT A TABLE : List of sites with location, area estimate, and site coordinates TABLE : List of Sites with site location, treatment area estimate, and general site coordinates Project ID Location
REGIONALLY FOCUSED. GLOBALLY COMPETITIVE.
 ABOUT EDC WHO WE ARE Mission: San Diego Regional Economic Development Corporation s mission is to maximize the region s economic prosperity and global competitiveness. Vision: The San Diego Region will
MARKETBEAT U.S. Office
 MARKETBEAT U.S. Office Q1 2017 U.S. OFFICE Employment Indicators Q1 16 Q1 17 Total Nonfarm Employment 143.4M 145.7M Offi ce-using Employment 30.9M 31.7M Unemployment 4.9% 4.6% Source: BLS Market Indicators
The FMR history file contains the following fields, all for 2-bedroom FMRs. It is in EXCEL format for easy use with database or spreadsheet programs.
 The FMR history file contains the following fields, all for 2-bedroom FMRs. It is in EXCEL format for easy use with database or spreadsheet programs. GENERAL NOTES 1. There are no Fiscal Year 1984 FMRs
Charleston, WV 18 Juneau, AK Peoria, IL Jefferson City,
 2004 Ranking Diocese Catholics Diocesan Seminarians 2004 Ratio (Catholics / Seminarians) 2003 Ranking 1 Lincoln, NE 89431 35 2555 2 2 Yakima, WA 68561 20 3428 5 3 Savannah, GA 75987 22 3454 13 4 Cheyenne,
Parking Rates & Policies Survey. December 2013
 METER OVERVIEW RATE & POLICY PRESENTATION SURVEY / 1 Parking Rates & Policies Survey December 2013 METER OVERVIEW RATE & POLICY PRESENTATION SURVEY / 2 Parking rates and policies survey The purpose of
The Returns to Single Family Rental Strategies
 The Returns to Single Family Rental Strategies Andrew Demers and Andrea L. Eisfeldt January 2014 Homeownership Rates 70.0% 65.0% 60.0% Home Ownership Rate 55.0% 50.0% 45.0% 40.0% 1890 1895 1900 1905 1910
NICHOLAS BROWN Vice President, Development (516)
") CONSTRUCTION CONTACTS SOUTHERN NORTHERN D-ATLANTIC LEE JOHNSON (704) 362-6149 lbjohnson@kimcorealty.com NICHOLAS BROWN (516) 869-7266 nbrown@kimcorealty.com PAT CHRISTIE (516) 869-7130 pchristie@kimcorealty.com
CONSTRUCTION CONTACTS SOUTHERN NORTHERN D-ATLANTIC LEE JOHNSON (704) 362-6149 lbjohnson@kimcorealty.com NICHOLAS BROWN (516) 869-7266 nbrown@kimcorealty.com PAT CHRISTIE (516) 869-7130 pchristie@kimcorealty.com
Emerging Trends in Real Estate Sustaining Momentum but Taking Nothing for Granted
 Emerging Trends in Real Estate 2015 Sustaining Momentum but Taking Nothing for Granted PwC-ULI Outlook on trends 36th edition 368 interviews 1,055 survey responses 1,400+ participants, a record Who? District
San Antonio Market Overview. 1 st 2 nd Quarter 2015
 San Antonio Market Overview 1 st 2 nd Quarter 2015 San Antonio, Texas Attributes of San Antonio Why San Antonio? The seventh most populated city in the United States of America and the second most populated
U.S. Office Snapshot Q1 2016
 MARKETBEAT U.S. Office Snapshot Q1 2016 U.S. OFFICE Employment Indicators Q1 15 Q1 16 Total Nonfarm Employment 140.8M 143.5M Offi ce-using Employment 30.2M 31.0M Unemployment 5.6% 4.9% Source: BLS Market
333 W. Campbell Road, Suite 440 Richardson, Texas Cruising for Charity with Randy Limbacher in Tahiti July 28, 2007
 333 W. Campbell Road, Suite 440 Richardson, Texas 75080 972.238.1998 800.952.1998 Cruising for Charity with Randy Limbacher in Tahiti July 28, 2007 Join me for this special annual event to raise money
MARKETBEAT U.S. Industrial Snapshot Q4 2015
 MARKETBEAT U.S. Industrial Snapshot Q4 2015 U.S. INDUSTRIAL Employment Indicators Q4 14 Q4 15 Total Nonfarm Employment 140.2M 143.0M Industrial Employment 23.4M 23.6M Unemployment 5.7% 5.0% Market Indicators
2016 Air Service Updates
 Air Service Update May 2016 2016 Air Service Updates February 2016 Pittsburgh new destination, 2x weekly April 2016 Los Angeles new departure, 1x daily Atlanta new departure, 1x daily Jacksonville new
A CORPORATE OR MEDICAL USER OPPORTUNITY WELL-LOCATED OFF THE PA TURNPIKE AM Drive. Quakertown, PA INVESTMENT SUMMARY. Page 1
 A CORPORATE OR MEDICAL USER OPPORTUNITY WELL-LOCATED OFF THE PA TURNPIKE 1900 AM Drive Quakertown, PA INVESTMENT SUMMARY Page 1 EXECUTIVE SUMMARY On behalf of ownership, Avison Young is pleased to offer
Timesheets Clients. Carroll County AR. Bartow County GA. Pulaski County AR. Fayette County GA. Gwinnett County GA. Brevard County FL.
 AR Carroll County AR Eureka Springs City 2013 GA Bartow County GA Adairsville City 2016 Pulaski County AR Jacksonville City 2012 Fayette County GA Peachtree City 2016 FL Brevard County FL Rockledge City
Florida's Scheduled Commercial Service Airports
 Florida's Scheduled Commercial Service Airports Volume 154 May 2016 - Domestic Airlines Serving Florida Carried 170,726 Onboard Passengers Per Day for, up 7.7% over the previous 12 months. Highlights in
ATLANTA HOUSING MARKET Fourth Quarter 2017 Presentation for HBA Builder Developer Lender Council. Expanded. Unemployment Rate (U 6) Official
 Official") Eugene James Senior Regional Director 404-510-1080 ejames@metrostudy.com connect on LinkedIn Mike Overley Business Development Director 770-380-0827 moverley@metrostudy.com To volunteer call 404 408 0716
Eugene James Senior Regional Director 404-510-1080 ejames@metrostudy.com connect on LinkedIn Mike Overley Business Development Director 770-380-0827 moverley@metrostudy.com To volunteer call 404 408 0716
Regional Outlook STEVEN G. COCHRANE, MANAGING DIRECTOR
 Regional Outlook STEVEN G. COCHRANE, MANAGING DIRECTOR Differences Narrow; Southeast Vies for Lead Employment, % change yr ago 3.5 3.0 Southwest 2.5 2.0 1.5 East South Central South Atlantic Northeast
Annual Report for the Alliance of Rouge Communities
 2016 Annual Report for the Alliance of Rouge Communities Friends of the Rouge January 1, 2016 through December 31, 2016 FRIENDS OF THE ROUGE ANNUAL REPORT 2016 (January 1 through December 31, 2016) For
Kern County: Last Redoubt of the California Dream?
 Kern County: Last Redoubt of the California Dream? Speech to Kern County EDC Economic Summit Bakersfield, CA March 15, 2017 By Joel Kotkin, Presidential Fellow in Urban Futures, Chapman University and
Rent Monitor. First Quarter Vol. 83 % GROWTH IN NATIONAL RENTS BY SECTOR NATIONAL EFFECTIVE RENTS BY SECTOR TOP 5 MARKETS GAINING MOMENTUM**
 Rent Monitor TM Asking Rents Vol. 83... Effective Rents... Concessions NATIONAL EFFECTIVE RENTS BY SECTOR 5 YEARS % GROWTH IN NATIONAL RENTS BY SECTOR 12 MONTHS 110 105 100 95 INDEX 1Q 2001 = 100 +4. +4.
United States Office 2Q 2016
 MARKETBEAT United States Office 2Q 2016 U.S. OFFICE Employment Indicators Market Indicators Net Absorption/Rent 4Q TRAILING AVERAGE Overall Vacancy 2Q 15 2Q 16 Total Nonfarm Employment 141.5M 143.9M Offi
Trends l%etropolitan America, 1
 AN INFORMATION REPORT Trends 0 l%etropolitan America, ADVISORY COMMISSION ON INTERGOVERNMENTAL RELATIONS Washington, D.C. 20575 February 977 M 08 PREFACE ACIR has maintained a continuing interest in metropolitan
Friends of the Rouge. Final Report for the Alliance of Rouge Communities
 Final Report for the Alliance of Rouge Communities January 1, 2012 through December 31, 2012 1 FRIENDS OF THE ROUGE ANNUAL REPORT 2012 For the ALLIANCE OF ROUGE COMMUNITIES Task 1: Rouge Education Project
World Class Airport For A World Class City
 World Class Airport For A World Class City Air Service Update October 2017 2017 Air Service Updates February 2017 Cleveland new destination, 2x weekly Raleigh-Durham new destination, 2x weekly March 2017
Snowbelt to Sunbelt The Migration of America s s Voters
 Snowbelt to Sunbelt The Migration of America s s Voters William H. Frey The Brookings Institution & University of Michigan www.frey-demographer.org State Projected Growth, 2000-2030 2030 Projected Growth,
High-Speed Rail: Realizing the Potential of Megaregion Economies
 High-Speed Rail: Realizing the Potential of Megaregion Economies Petra Todorovich Director, America 2050 Regional Plan Association May 4, 2010 Rayburn House Office Building 1 2 1 Where High-Speed Rail