How Is The Economy? What are the factors of a good or bad economy?
|
|
|
- Adele Russell
- 5 years ago
- Views:
Transcription


1 2016


2 How Is The Economy? What are the factors of a good or bad economy?

3 CONTEXT

4 Global Economy Impacts
5 Question 1. Last year ago the U.S. unemployment rate was 5.1%, what is it today?
6 Global Unemployment Rates- 5 Years 14% 12% 10% 9.1% % 10.1% 10.8% 11.8% 8% 6% 4% 5.0% 4.3% 3.1% 7.1% 7.0% 6.1% 4.1% 5.6% 5.2% 5.0% 6.0% 6.1% 5.2% 2% 0% US Japan China Canada Euro Area Austrialia India Brazil Russia Source: The Economist October 22, 2016
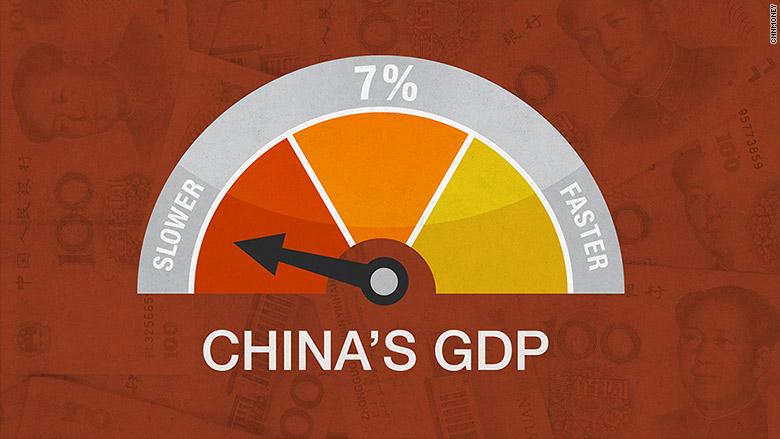
7 Projected GDP 2013,2014,2015, % 8% 6% 7.7% 6.6% 7.6% 4.9% 4% 2% 1.9% 1.5% 1.7% 0.6% 1.7% 2.4% 1.3% 1.5% 2.8% 2.2% 1.5% 0% -2% -0.4% -0.7% -4% -3.2% -6% US Japan China Canada Euro Area Austrialia India Brazil Russia Source: The Economist October 22, 2016
8 GDP Per Capita (2015) $70,000 $65,400 $60,000 $55,800 $50,000 $40,000 $38,100 $45,600 $37,800 $30,000 $25,400 $20,000 $14,100 $15,600 $10,000 $0 US Japan China Canada Euro Area 2015 $6,200 Austrialia India Brazil Russia Source: The World Bank, October, 2016
9 Forecast Summer 2016 Sources: TIP Industries U.S. Bureau of Labor Statistics, Current Employment Statistics (total nonfarm employment, seasonally adjusted); NBER (recession dates); New York Times (format)


10 Decomposition of Real GDP Year Annual Growth Rates GDP Productivity Employment Note: Productivity is calculated as real GDP per employee, from the Household Survey. Source: Bureau of Economic Analysis and Bureau of Labor Statistics via Haver Analytics
11 Value of the U.S. Dollar Source: MacroTrends.net


12 Geopolitics Get More Important Every Year

13
14 USA Nonfarm Payroll Employment Millions of Persons 15.3 million jobs added since February The longest streak of private job growth in history September mil Source: Bureau of Labor Statistics via Haver Analytics

15 Average Hourly Earnings Month % Change Monthly % Change Sep. 0.2% Aug. 0.1% Jul. 0.4% June 0.1% May 0.2% September 2.6% Source: Bureau of Labor Statistics via Haver Analytics
16 Total Job Net Gain July 2015 to July million Utilities Information Mining & Logging Wholesale Trade Financial Professional & Business Services Manufacturing Construction Transportation & Warehousing Education & Health Other Services Retail Trade Leisure & Hospitality
17

18 Dow Jones
19
20 Question 2. Last year NC grew employment by 2.6% (Sept-14-Sept-15). What is the growth rate for the latest 12 months?
21 4.0% 3.5% 3.0% 2.5% 2.0% 1.5% 1.0% 0.5% 0.0% -0.5% -1.0% -1.5% 1.7% 0.8% 1.5% Southern States 1-Year Employment Sept 2015 to Sept % 2.8% 1.4% -1.0% 1.7% 1.1% 0.7% 1.9% -0.7% 2.7% 2.5% 1.7% 2.1% USA AL AR FL GA KY LA MD MO MS NC OK SC TN TX VA WV 0.1% Source: Bureau of Labor Statistics
22 6.0% 4.0% Southern States 1-Year Manufacturing Employment Sept 2015 to Sept % 2.0% 1.7% 1.2% 1.8% 0.9% 1.8% 2.1% 0.0% -2.0% -0.4% -0.2% -0.5% -1.2% -0.3% -1.7% -1.5% -4.0% -3.1% -6.0% -5.1% -8.0% -7.3% USA AL AR FL GA KY LA MD MO MS NC OK SC TN TX VA WV Source: Bureau of Labor Statistics
23 Southern States 1-Year Professional & Business Services Employment Changes Sept 2015 to Sept % 6.0% 4.0% 2.0% 0.0% -2.0% 2.9% 0.7% 2.6% 4.8% 4.2% 2.8% 3.4% 2.3% 4.5% 6.4% 3.3% 1.9% 4.0% 1.1% -4.0% -2.6% -3.1% -6.0% -8.0% -5.6% USA AL AR FL GA KY LA MD MO MS NC OK SC TN TX VA WV Source: Bureau of Labor Statistics
24 4.0% 3.0% 2.0% 1.0% 0.0% -1.0% -2.0% -3.0% -4.0% -0.6% All States 1-Year % Employment Changes Sept 2015 to Sept % 3.5% 3.2% 3.2% 2.9% 2.7% 2.8% 2.9% 2.7% 2.7% 2.5% 2.5%2.5% 2.3% 2.3% 2.2% 1.9% 1.9% 2.0% 2.1% 1.9% 2.0% 2.1% 1.7% 1.7% 1.5% 1.5% 1.4% 1.6% 1.3% 1.4% 1.1% 1.1% 1.0% 0.9% 1.1% 1.2% 0.8% 0.8% 0.7% 0.7% 0.5% 0.2% 0.1% -0.4% -1.0% Oregon- 3.5% Florida 3.4% Idaho 3.2% Washington 3.2% Delaware 2.9% Utah 2.9% Alabama Alaska Arizona Arkansas California Colorado Connecticut Delaware District of Columbia Florida Georgia Hawaii Idaho Illinois Indiana Iowa Kansas Kentucky Louisiana Maine Maryland Massachusetts Michigan Minnesota Mississippi Missouri Montana Nebraska Nevada New Hampshire New Jersey New Mexico New York North Carolina North Dakota Ohio Oklahoma Oregon Pennsylvania Rhode Island South Carolina South Dakota Tennessee Texas Utah Vermont Virginia Washington West Virginia Wisconsin Wyoming -0.4% -1.3% -0.7% -3.2% Source: Bureau of Labor Statistics
25 400, , , , ,000 All States 1-Year Total Employment Changes Sept 2015 to Sept , ,300 Total added jobs 2,447,000 California- 379,700 Florida- 276,300 Texas- 206,800 Georgia- 118,700 New York- 106,600 Washington-100, , , ,000 50, ,000 16,300 61,500-2,000 69,200 12,900 18,60012,80014, ,700 15,900 21,500 43,400 44, ,600 78,300 84, ,500 82,600 81,100 73,400 71,300 61,600 53,400 46,200 46,100 51,50054,400 29,600 31,100 34,300 39,800 36,000 25,800 3,100 7,900 9,60013,900 1,000 5,30010,600 6, ,900-19,800-3,100-5,700-11,300 Alabama Alaska Arizona Arkansas California Colorado Connecticut Delaware District of Columbia Florida Georgia Hawaii Idaho Illinois Indiana Iowa Kansas Kentucky Louisiana Maine Maryland Massachusetts Michigan Minnesota Mississippi Missouri Montana Nebraska Nevada New Hampshire New Jersey New Mexico New York North Carolina North Dakota Ohio Oklahoma Oregon Pennsylvania Rhode Island South Carolina South Dakota Tennessee Texas Utah Vermont Virginia Washington West Virginia Wisconsin Wyoming -9,200 Source: Bureau of Labor Statistics
26 5% Percentage Annual Job Change % 1% -1% -3% -5% -7% United States North Carolina Source: Bureau of Labor Statistics
27 Employment Gains By Sector for the United States and NC September Total Construction 1.9% 1.7% 4.8% 3.4% Manufacturing -0.3% -0.4% Trade, Transport & Utilities 1.6% 2.7% Financial Professional & Technical Services -0.9% 2.0% 2.9% 4.5% NC USA Education & Health Services 1.8% 2.7% Leisure & Hospitality Government 1.1% 0.9% 0.7% 2.4% -2% -1% 0% 1% 2% 3% 4% 5% 6% Source: Bureau of Labor Statistics
28 Employment Gains By Sector for the SC, VA and NC September Total 1.9% 2.1% 2.7% 3.0% Construction 2.2% 4.8% Manufacturing -1.7% -0.3% 1.8% Trade, Transport & Utilities Financial -0.9% 1.5% 1.4% 2.7% 2.8% 3.3% SC NC Professional & Technical Services 4.0% 4.5% 6.4% VA Education & Health Services 1.8% 3.4% 5.7% Leisure & Hospitality 1.1% 1.6% 1.5% Government 0.9% 0.6% 0.9% -3% -2% -1% 0% 1% 2% 3% 4% 5% 6% 7% Source: Bureau of Labor Statistics
29 NC Change in Number of Jobs North Carolina Average 2.6% Graham Cherokee Clay Ashe Alleghany Northampton Surry Stokes Rockingham Gates Caswell Person Warren Watauga Halifax Hertford Wilkes Avery Yadkin Forsyth Guilford Franklin Alexander Edgecombe Bertie Yancey Caldwell Davie Nash Madison Iredell Davidson Burke Randolph Martin Washington Wake Buncombe McDowell Catawba Chatham Wilson Haywood Rowan Pitt Swain Beaufort Rutherford Lincoln Johnston Henderson Cabarrus Lee Greene Jackson Polk Montgomery Transylvania Gaston Stanly Macon Cleveland Moore Harnett Wayne Lenoir Craven Pamlico Richmond Hoke Sampson Jones Union Anson Duplin Scotland Carteret Onslow Robeson Bladen Growth above state average of 2.6% Growing below state average of 2.6% Losing Jobs Columbus Brunswick Pender New Hanover Tyrrell Hyde Dare Source: NC Department of Commerce
30 Question 3. NC has 14 metropolitan areas, how many are growing employment at a faster rate this year than last year? 1) Asheville 2) Burlington 3) Charlotte 4) Durham 5) Fayetteville 6) Goldsboro 7) Greensboro 8) Greenville 9) Hickory 10) Jacksonville 11) Raleigh-Cary 12) Rocky Mount 13) Wilmington 14) Winston-Salem
31 North Carolina Metro Employment Growth- Last 12 months Compared to 12 months ago 4% 3% 2.6% 1.8% 1.9% 2.2% 2.3% 1.7% 2.0% 2.5% 2% 1.6% 1.1% 1% 0.7% 0% -1% -0.4% -0.3% -2% -1.4% -3% Source: BLS, October 2016
32 North Carolina Metro Employment Growth August 2015 August % 3% 2% 2% 1% 1% 0% -1% -1% -2% -2% 2.6% 2.5% 1.8% 1.9% 2.2% 2.3% 2.0% 1.7% 1.6% 1.1% 0.7% -0.4% -0.3% -1.4% Source: Bureau of Labor Statistics
33 Average Statistical 30 Ranking 25 Rankings and Performance Worse Performance Than Rank NC UT TX CO IN TN GA VA FL OH NE AZ SD IA ID SC MN WA ND WY KS DE WI MT OR OK MI AL MO LA NV MA PA NH AR NM MD IL VT NY Better Performance Than Rank CA KY NJ AK CT ME WV Average "Best States" ranking RI MS HA States By Average Ranks by Forbes, CNBC, and Chief Executive Plotted Against Actual Performance for Job Growth, Wage Growth and Growth in GDP

34 Comparisons

35 Cherokee Clay Graham Macon Swain Jackson Haywood Madison Buncombe Henderson Transylvania Yancey Avery McDowell Rutherford Polk Watauga Caldwell Burke Cleveland Ashe Alleghany Wilkes Alexander Catawba Lincoln Gaston Surry Yadkin Iredell Stokes Forsyth Davie Rowan Cabarrus Union Rockingham Guilford Davidson Randolph Stanly Anson Montgomery Moore Richmond Caswell Person Chatham Wake Lee Warren Franklin Harnett Hoke Scotland Robeson Bladen Columbus Brunswick Johnston Northampton Halifax Nash Wilson Edgecombe Wayne Sampson Duplin Pender New Hanover Onslow Jones Lenoir Greene Pitt Hertford Gates Bertie Washington Martin Beaufort Hyde Tyrrell Dare Craven Pamlico Carteret Raleigh- Cary- MSA

36 Projected Annual GDP Growth % 6.0% 5.0% 4.0% 3.0% 2.0% 1.0% 0.0% Raleigh-Cary, NC Atlanta, GA Austin, TX Boston, MA Charleston SC Charlotte, NC Columbia, SC Columbus, OH Dallas, TX Denver, CO Greenville, SC Indianapolis, IN Jacksonville, FL Kansas City, MO Louisville, KY Minneapolis, MN Nashville, TN Oklahoma City, OK Philadelphia,PA Phoenix, AZ Portland, OR Richmond, VA Salt Lake City, UT San Diego, CA San Francisco, CA San Jose, CA Seattle, WA St Louis, MO Tampa, FL Washington DC

37 Projected Population Growth % 90% 80% 70% 60% 50% 40% 30% 20% 10% 0% 74% Raleigh-Cary, NC Atlanta, GA Austin, TX Boston, MA Charleston SC Charlotte, NC Columbia, SC Columbus, OH Dallas, TX Denver, CO Greenville, SC Indianapolis, IN Jacksonville, FL Kansas City, MO Louisville, KY Minneapolis, MN Nashville, TN Oklahoma City, OK Philadelphia,PA Phoenix, AZ Portland, OR Richmond, VA Salt Lake City, UT San Diego, CA San Francisco, CA San Jose, CA Seattle, WA St Louis, MO Tampa, FL Washington DC

38 Average Annual Hours Congestion Delay Raleigh-Cary, NC Atlanta, GA Austin, TX Boston, MA Charleston SC Charlotte, NC Columbia, SC Columbus, OH Dallas TX Denver, CO Greenville, SC Indianapolis, IN Jacksonville, FL Kansas City, MO Louisville, KY Minneapolis, MN Nashville, TN Oklahoma City, OK Philadelphia PA Phoenix, AZ Portland, OR Richmond, VA Salt Lake City, UT San Diego, CA San Francisco, CA San Jose, CA Seattle, WA St Louis, MO Tampa, FL Washington DC

39 Violent Crime per 100,00 Population (2014) Raleigh-Cary, NC Atlanta, GA Austin, TX Boston, MA Charleston SC Charlotte, NC Columbia, SC Columbus, OH Dallas TX Denver, CO Greenville, SC Indianapolis, IN Jacksonville, FL Kansas City, MO Louisville, KY Minneapolis, MN Nashville, TN Oklahoma City, OK Philadelphia PA Phoenix, AZ Portland, OR Richmond, VA Salt Lake City, UT San Diego, CA San Francisco, CA San Jose, CA Seattle, WA St Louis, MO Tampa, FL Washington DC

40 Despite perception, crime rates in major cities have dropped over the past decade. The Statistics Portal
41 % Adults Over 25 with a BA+ 50% 45% 40% 35% 30% 25% 20% 15% 10% 5% 0% Raleigh-Cary, NC Atlanta, GA Austin, TX Boston, MA Charleston SC Charlotte, NC Columbia, SC Columbus, OH Dallas, TX Denver, CO Greenville, SC Indianapolis, IN Jacksonville, FL Kansas City, MO Louisville, KY Minneapolis, MN Nashville, TN Oklahoma City, OK Philadelphia, PA Phoenix, AZ Portland, OR Richmond, VA Salt Lake City, UT San Diego, CA San Francisco, CA San Jose, CA Seattle, WA St Louis, MO Tampa, FL Washington DC
42
43 7% Unemployment Rates August 2013, 2014, 2015, % 5.7% 5.8% 6.0% 5.3% 5% 4% 3% 4.6% 3.6% 4.2% 4.2% % % 0% Cary Raleigh Durham Chapel Hill Source: NC Commerce LAUS, October 2015
44 Cary Employment 90,000 80,000 70,000 73,904 77,065 78,991 81,007 84, % Growth 60,000 50,000 40,000 30,000 20,000 10, Source: NC Commerce LAUS, October 2015
45 Wake County Permit Value Jan-Sept 2012, & 2016 $1,600,000,000 $1,400,000,000 $1,200,000,000 $1,404,552,030 $1,253,480,319 $1,000,000,000 $800,000,000 $600,000,000 $400,000,000 $200,000,000 $0 Residential Commercial Source: Wake County Government
46 Cary Permit Value Jan-Sept 2012, 2013, 2014, 2015, 2016 $300,000,000 $271,191,341 $250,000,000 $200,000,000 $150,000,000 $100,000,000 $50,000,000 $156,182,519 $202,128,756 $191,300,966 $95,099,862 $45,972, $0 Residential Commercial Source: Wake County Government
47 $500,000,000 $450,000,000 $400,000,000 Cary Total Permit Value Jan-September Each year $473,320,097 $350,000,000 $300,000,000 $250,000,000 $200,000,000 $150,000,000 $100,000,000 $50,000,000 $329,410,453 $251,282,381 $230,298,296 $178,358,262 $170,260,941 $150,218,243 $314,315,921 $237,273,333 $ Source: Wake County Government
48 Question 4. In 2015, for the first 9 months of the year are Cary residential permits up or down?
49 Wake County New Residential Permits Jan-Sept ,800 1, ,400 1,200 1, Cary Raleigh Source: Wake County Government
50 $400,000 $350,000 Single Family Residential Values $339,800 $300,000 $250,000 $200,000 $150,000 $100,000 $50,000 $0 $282,750 $178,140 $282,960 $297,950 $251,400 $262,760 $269, Source: NCESC.Com
51 Wake County New Residential Permits Jan-Sept ,800 1,600 1,400 1,200 1, Apex Cary Fuquay-Varina Garner Raleigh Wake Forest Wake County Holly Springs Morrisville Source: Wake County Government
52 Cary Residential Properties Sold 4,500 4,000 3,823 3,500 3,000 2,500 2,000 1,500 1, ,305 2,980 2,624 2,800 2,698 2,8763,003 2,348 2,994 2,985 2,792 2,507 2,247 2,155 2,100 1, Source: Wake County Government
53 Cary Residential Properties Sold- Value 400, , , , ,000 $217,905 $229,324 $252,435 $238,693 $327,395 $330,151 $267,441 $312,279 $297,598 $261,822 $241,804 $311,367 $312,116 $306,076 $346,061 $312,772 $337, , ,000 50,000 0 Source: Wake County Government
54 Wake Cary & Raleigh Multi-family Units 120,000 ten years 32% Increase 100,000 80,000 79,440 80,805 82,034 82,694 91,695 86,903 94,490 93,753 94, ,397 95, , ,638 72,780 60,000 55,870 56,876 57,649 57,428 59,837 63,024 64,561 63,619 64,232 64,683 68,542 69,193 40,000 20, ,779 10,043 10,299 10,799 12,310 13,659 13,011 13,927 14,051 16,481 13,739 14,639 15,449 Cary Raleigh Total-Wake Source: Wake County Government


55
56 Now think all the way back to 2003 LinkedIn (2003) Facebook (2004) YouTube (2005) Twitter (2006) IPhone (2007) Mobile apps Mobile maps Fitbit (2007) Spotify (2007) Dropbox (2007) Airbnb (2008) Hulu (2008) Kickstarter (2009) Facetime (2010) Uber (2009) Pinterest (2010) Tumblr (2010) Snapchat (2011) Udacity (2012)


57 The Next Big Things-Demographic


58 Fewer childrenin 1960, 3.7 children, today 1.9 Demographic and Societal Trends
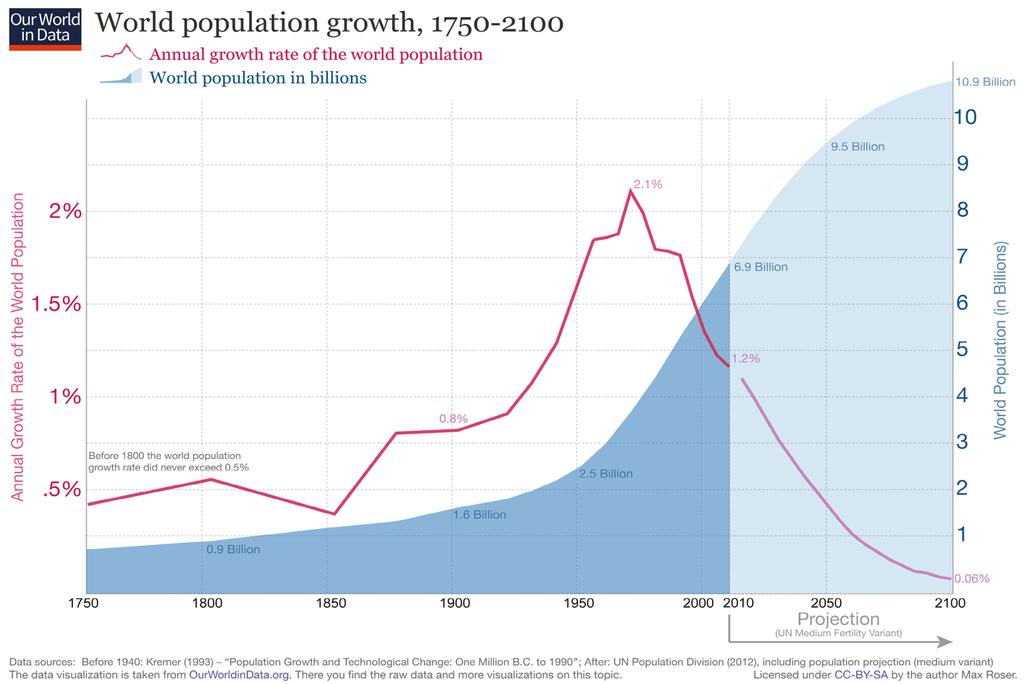
59 The Slowing Global Population Growth Source: The United Nations Data
60

61
62 1,000, , , , , , , , , , ,346 2, ,115 Domestic Migration for All States -104, , ,954 The Winners Texas Florida Colorado North Carolina Arizona South Carolina -191,130 The Losers New York Illinois New Jersey California Michigan Ohio -269, , , , , , , ,326 Alabama Alaska Arizona Arkansas California Colorado Connecticut Delaware District of Columbia Florida Georgia Hawaii Idaho Illinois Indiana Iowa Kansas Kentucky Louisiana Maine Maryland Massachusetts Michigan Minnesota Mississippi Missouri Montana Nebraska Nevada New Hampshire New Jersey New Mexico New York North Carolina North Dakota Ohio Oklahoma Oregon Pennsylvania Rhode Island South Carolina South Dakota Tennessee Texas Utah Vermont Virginia Washington West Virginia Wisconsin Wyoming Source: US Census
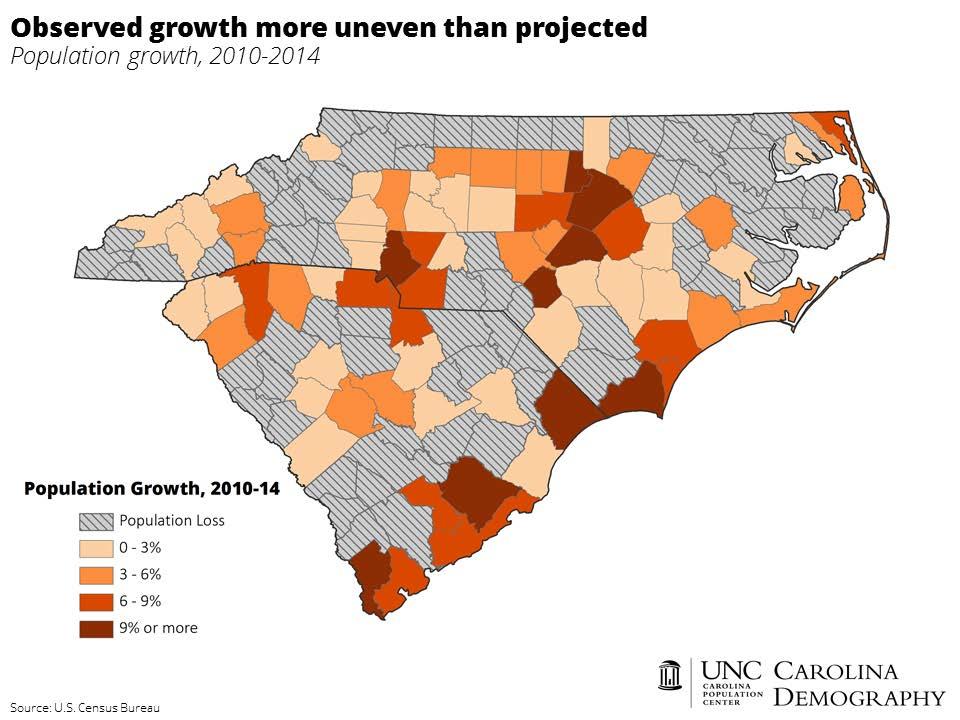
63 North Carolina Change in Population 2010 to 2015 North Carolina Average 5.3% Graham Cherokee Clay Swain Macon Burke Buncombe McDowell Haywood Jackson Madison Yancey Henderson Polk Avery Rutherford Ashe Watauga Caldwell Alleghany Wilkes Catawba Lincoln Cleveland Gaston Iredell Surry Yadkin Davie Rowan Cabarrus Stokes Forsyth Rockingham Caswell Person Guilford Davidson Randolph Stanly Transylvania Alexander Montgomery Moore Chatham Lee Harnett Wake Franklin Johnston Warren Northampton Gates Halifax Hertford Nash Edgecombe Wilson Greene Wayne Lenoir Pitt Bertie Martin Craven Beaufort Washington Pamlico Tyrrell Hyde Dare Union Anson Richmond Hoke Scotland Robeson Bladen Sampson Duplin Jones Onslow Carteret Pender Columbus Brunswick New Hanover 10.6% and over increase 5.3% to 10.5% increase 0.1% to 5.2% increase population decrease Source: US Census
64
65 North Carolina s 15 Most Populous Cities 900, , ,097 Population , , , , , , , , , , , , , , ,268 90,957 88,512 87,696 74,543 67,357 59,568
66 20% North Carolina s 15 Most Populous Cities % Growth Population % 15% 13.08% 11.68% 12.83% 10.91% 10% 8.88% 7.57% 5% 5.81% 5.05% 5.65% 3.27% 3.91% 4.08% 0% 0.70% -5% -3.97%

67 Branding


68 The Next Big Things-Technological


69 The Time To Technology Acceptance is Shortening Follow on or LinkedIn Ted Abernathy
70 Advanced Industry Job and Wage Growth % Advanced Industry Wage Growth % ND 12.0% AK CA DE 10.0% NY 8.0% WY WA IA MA IL ID 6.0% ME VT OK NJ MN LA NH KY U.S OR UT PA RI WI FL 4.0% CT AR HA SC KS NC WV NV MO CO NM TX VA AZ SD GA 2.0% NE MD AL IN MI 0.0% MT OH MS -2.0% TN -4.0% -10.0% -5.0% 0.0% 5.0% 10.0% 15.0% 20.0% Advanced Industry Job Growth Source: Bureau of Labor Statistics
71 Technology Sector Employment Growth ( ) North Dakota Michigan North Carolina Texas Utah Delaware Arizona California New York Missouri Colorado Oregon Georgia Massachusetts Illinois Oklahoma Washington United States District of Columbia Wisconsin Nevada Montana Tennessee South Carolina Nebraska Minnesota Pennsylvania New Hampshire Alaska Florida Iowa South Dakota Idaho Ohio Hawaii New Mexico Maine Indiana Connecticut Mississippi Rhode Island Maryland Louisiana New Jersey Alabama Kansas Virginia Wyoming Arkansas Vermont Kentucky West Virginia -0.8% 10.9% 20.6% Change Over Time NC Ranks: 3 rd -20% -10% 0% 10% 20% 30% 40% 50% 60% 70% Source: EL estimates based on EMSI
72


73 The Next Big Things-Business
74 Predictions For 2016 The housing market will start to cool slightly in 2016 or Grade C Job growth will stay about current levels for the region- Grade B Cary will begin to feel the impacts of limited commercial space- Grade A- Redevelopment pressures will build for the next decade- Grade A Wage growth will continue to improve- Grade A Election year business nervousness- Grade well Cary remains great- Grade A


75 Economic Development 2,965 New Jobs $100,500,000 New Investment


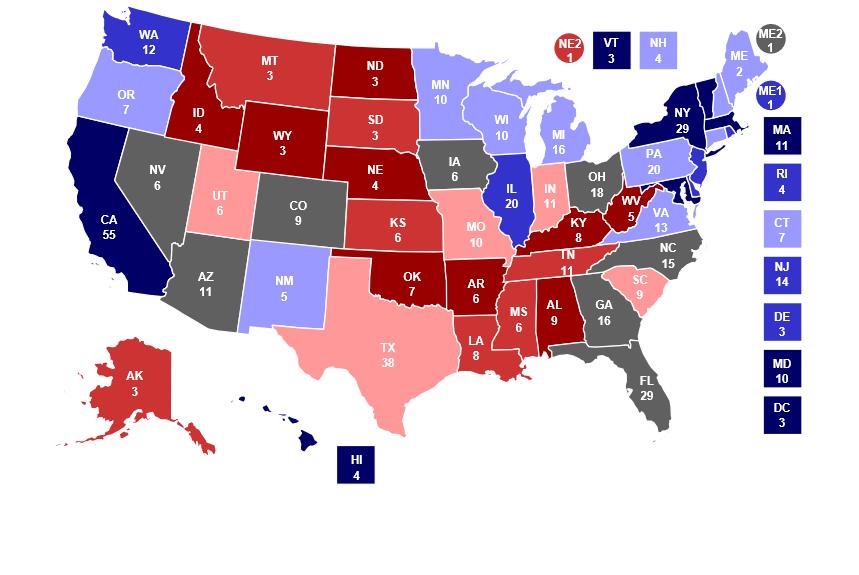
76 Election 2016
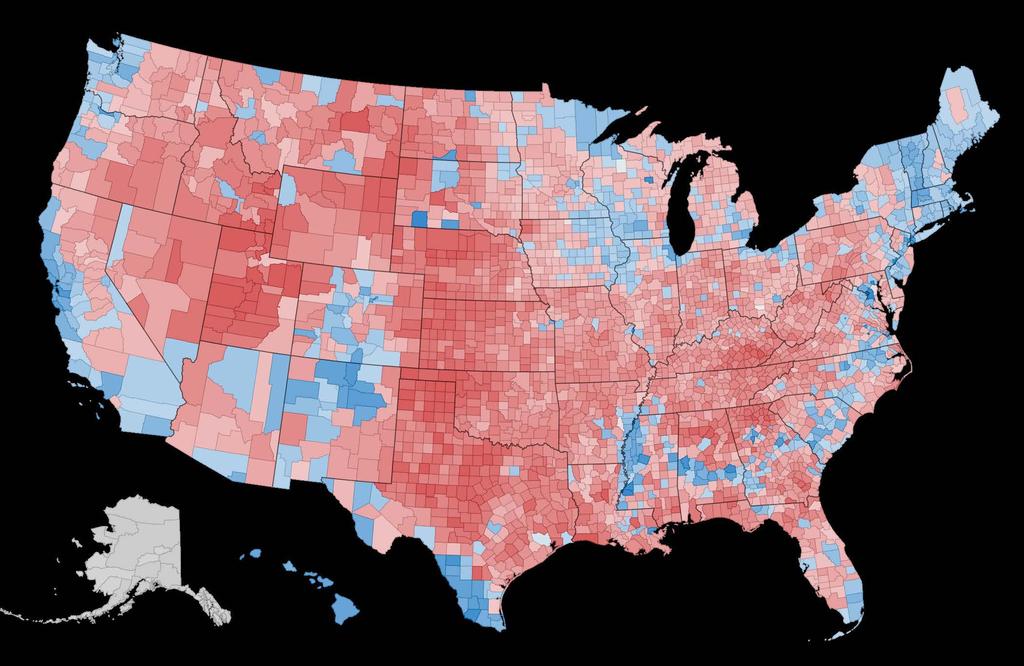

77 2012

78 Thoughts or Questions? Follow on or LinkedIn Ted Abernathy

79
80
for The Nation, North Carolina & its Neighbors NC's Regions & Counties Posted October 2, 2013
 s 1 Table 1 s The Nation, North Carolina & its Neighbors NC's Regions & Counties North Carolina United States South Carolina Georgia Tennessee Virginia AdvantageWest Economic Development Group Alleghany
Current Price. Alamance Suburban Propane Alamance AmeriGas Propane, LP
 Alamance Suburban 0.9631 Alamance AmeriGas, LP 1.0531 Alexander Suburban 0.9631 Alexander AmeriGas, LP 1.1021 Alleghany Suburban 0.9631 Alleghany AmeriGas, LP 1.1021 Anson Ferrellgas 0.8091 Anson AmeriGas,
Current Price. Alamance Suburban Propane Alamance AmeriGas Propane, LP
 Alamance Suburban 0.8955 Alamance AmeriGas, LP 0.9855 Alexander Suburban 0.8955 Alexander AmeriGas, LP 1.0345 Alleghany Suburban 0.8955 Alleghany AmeriGas, LP 1.0345 Anson Ferrellgas 0.7415 Anson AmeriGas,
 RUSSIA OR CA WA AK NV CANADA ID UT AZ MT WY CO NM MEXICO HI ND SD NE KS TX MN OK CANADA IA WI LA IL MI IN OH WV VA FL ME VT NH MA NY CT NJ PA MO KY NC TN SC AR AL GA MS MD BAHAMAS CUBA RI DE 3 RUSSIA 1
H.B. 35 Feb 6, 2019 HOUSE PRINCIPAL CLERK
 H GENERAL ASSEMBLY OF NORTH CAROLINA SESSION 0 HOUSE BILL DRH000-MMa- H.B. Feb, 0 HOUSE PRINCIPAL CLERK D Short Title: Add'l Judges/Onslow, Jones, Duplin, Sampson. (Public) Sponsors: Referred to: Representatives
H.B. 259 Mar 4, 2019 HOUSE PRINCIPAL CLERK
 H GENERAL ASSEMBLY OF NORTH CAROLINA SESSION 0 HOUSE BILL DRH0-NDa-A H.B. Mar, 0 HOUSE PRINCIPAL CLERK D Short Title: Add'l Judge and Magistrates in Union County. (Public) Sponsors: Referred to: Representatives
North Carolina County Weatherization Agencies by County Note: Some agencies serve more than one county.
 Where to Apply for Weatherization Assistance Applications must be placed with the designated local service provider for the county in which you live. Start the application process by contacting the appropriate
Census Affects Children in Poverty by Professors Donald Hernandez and Nancy Denton State University of New York, Albany
 Phone: (301) 457-9900 4700 Silver Hill Road, Suite 1250-3, Suitland, MD 20746 Fax: (301) 457-9901 Census Affects in Poverty by Professors Donald Hernandez and Nancy Denton State University of New York,
CIM & Associates 2479 Murfreesboro Road Nashville, TN Tel: Fax:
 Alabama AL Arkansas AR Arizona AZ California CA (Northern) CA (Southern) Paine & Murray, Inc. 13300 Violet Lane Euless, TX 76040 Tel: 817-868-9584 Fax: 817-545-1312 Email: bruce@painemurray.com Intrex
FBI Drug Demand Reduction Coordinators
 FBI Drug Demand Reduction Coordinators Alabama 2121 Building, Room 1400 Birmingham, AL 35203 (205) 252 7705 One St. Louis Centre One St. Louis Street Mobile, AL 36602 (334) 438 3674 Alaska 222 West Seventh
Occupancy tax collections fiscal year County collections Municipal collections
 Occupancy tax collections fiscal year 2013-2014 County collections Municipal collections Counties Rate Total net Amount to Amount to Amount to Municipalities Rate Total net Amount to Amount to Amount to
OCCUPANCY TAX COLLECTIONS FISCAL YEAR
 OCCUPANCY TAX COLLECTIONS FISCAL YEAR 2014-2015 County collections Municipal collections Counties Rate Total net Amount to Amount to Amount to Municipalities Rate Total net Amount to Amount to Amount to
OUR U.S. FULL SERVICE OFFICES:
 HOW TO NAME US AS YOUR REGISTERED AGENT Listing the correct name and address of your Registered Agent on filings is critically important. To make sure you have the most current address for COGENCY GLOBAL
MapInfo Routing J Server. United States Data Information
 MapInfo Routing J Server United States Data Information Information in this document is subject to change without notice and does not represent a commitment on the part of MapInfo or its representatives.
Published Counts TrafficMetrix
 Published Counts TrafficMetrix Contents Introduction... 1 TrafficMetrix Features... 1 TrafficMetrix Benefits... 1 TrafficMetrix Data... 1 File Descriptions... 2 State Abbreviations... 3 Count Type Glossary...
May Following is a guide to charts and graphs for this report:
 May 212 Strategic tourism marketing and policy decisions depend on accurate, consistent tracking of business indicators such as lodging statistics, attraction and welcome center visitation, transportation
2012 Year End Report
 212 Year End Report Strategic tourism marketing and policy decisions depend on accurate, consistent tracking of business indicators such as lodging statistics, attraction and welcome center visitation,
CSC Agent Office Addresses
 CSC Agent Office Addresses Alabama Montgomery, Inc. 641 South Lawrence Street Montgomery, AL 36104 Montgomery County Arizona Phoenix 2338 West Royal Palm Road, Suite J Phoenix, AZ 85021 Maricopa County
BLACK KNIGHT HPI REPORT
 CONTENTS 1 OVERVIEW 2 NATIONAL OVERVIEW 3 LARGEST STATES AND METROS 4 FEBRUARY S BIGGEST MOVERS 5 20 LARGEST STATES 6 40 LARGEST METROS 7 ADDITIONAL INFORMATION OVERVIEW Each month, the Data & Analytics
Lower Income Journey to Work Market Share From American Community Survey
 Lower Income Journey to Work Market Share From American Community Survey 2006-2010 Table 1: Overall National Data Table 2: Car, Truck or Van Table 3: Transit Table 4: Metrics Table 1 Work Trip Market Share:
House Price Appreciation by State Percent Change in House Prices Period Ended June 30, 2009
 House Price Appreciation by State Percent Change in House Prices (Estimates use FHFA s Seasonally-Adjusted Purchase-Only House Price Index) State Rank* 1-Yr. Qtr. 5-Yr. Since 1991Q1 North Dakota (ND) 1
MAMA Risk Summary Data as of 2008 Q4
 MAMA Risk Summary Data as of 2008 Q4 Table of Contents Contents. 2 Largest 25 Metro Areas based on HMDA originations.. 3 Lowest Risk 25 Metro Areas 4 Highest Risk 25 Metro Areas... 5 Largest 25 States
Geography Quiz: State Capitals
 Geography Quiz: State Capitals Directions: Select the correct capital city for each state in the United States of America. 1. Alabama a. Jackson b. Montgomery c. Jefferson city d. Augusta e. Boston 6.
Political Event Recreational Event Federal Holiday ~ January 2012 ~ Sun Mon Tue Wed Thu Fri Sat 1 2 New Year s Day (Federal Holiday) 5 -Progressive
 5 -Progressive") Political Event Recreational Event Federal Holiday ~ January 2012 ~ 1 2 New Year s Day (Federal Holiday) 8 -Progressive Insurance New York Boat Show. New York City, NY Partners Outdoors 2012, Williamsburg,
Political Event Recreational Event Federal Holiday ~ January 2012 ~ 1 2 New Year s Day (Federal Holiday) 8 -Progressive Insurance New York Boat Show. New York City, NY Partners Outdoors 2012, Williamsburg,
International migration. Total net migration. Domestic migration
 Indicator Direction Comparables a. Net population migration b. Crime rate (city) c. Housing costs d. Cost-of-living index N.A. e. State & local tax intensity f. Performing arts groups g. Air quality index
National Electric Rate Study
 National Electric Rate Study Ranking of typical residential, commercial and industrial electric bills 2017 Study 1040 O Street, P.O. Box 80869 Lincoln, NE 68501-0869 p: 402.475.4211 www.les.com Lincoln
ustravel.org/travelpromotion
 Agenda 1. Power of Travel Promotion Resources 2. New Tool: Travel Economic Impact Calculator 3. Accessing data through Interactive Travel Analytics 4. Unused Vacation Time Opportunity 5. Highlights from
ALN Apartment Data, Inc. (Continued on next page)
") AK - Anchorage 93.0% 90.9% -210-2.2% $1,035 $1,018-1.7% 93.0% 90.9% -210-2.2% $1,035 $1,018-1.7% AK - Misc. AK 90.3% 86.8% -350-3.8% $1,218 $1,245 2.3% 90.3% 86.8% -350-3.8% $1,218 $1,245 2.3% Alaska Average
AK - Anchorage 93.0% 90.9% -210-2.2% $1,035 $1,018-1.7% 93.0% 90.9% -210-2.2% $1,035 $1,018-1.7% AK - Misc. AK 90.3% 86.8% -350-3.8% $1,218 $1,245 2.3% 90.3% 86.8% -350-3.8% $1,218 $1,245 2.3% Alaska Average
Location, Location, Location. 19 th Annual NIC Conference NIC MAP Data & Analysis Service
 Location, Location, Location 19 th Annual NIC Conference NIC MAP Data & Analysis Service The Great Occupancy Decline 94% Occupancy Trends Majority Nursing Seniors Housing 93% 92% 91% 92.8% 91.0% 90% 89%
TOGETHER, MAKING BOATING THE PREFERRED CHOICE IN RECREATION RECREATIONAL BOATING ECONOMIC STUDY $ $
 2012 TOGETHER, MAKING BOATING THE PREFERRED CHOICE IN RECREATION RECREATIONAL BOATING ECONOMIC STUDY In 2013 NMMA s Center of Knowledge contracted with the Recreational Marine Research Center at Michigan
Oct-17 Oct-18 bps %CHG Oct-17 Oct-18 %CHG Oct-17 Oct-18 bps %CHG Oct-17 Oct-18 %CHG
 AK - Anchorage 92.6% 89.9% -270-2.9% $1,023 $1,011-1.2% 92.6% 89.9% -270-2.9% $1,023 $1,011-1.2% AK - Misc. AK 89.9% 85.8% -410-4.6% $1,227 $1,230 0.2% 89.9% 85.8% -410-4.6% $1,227 $1,230 0.2% Alaska Average
Supplementary Figure 1: Clinical Criteria by State.
 Supplementary Figure 1: Clinical Criteria by State. Color Code Fibrosis State used to be in this category but is no longer in this category State is newly in this category n Alabama Alaska Arizona Arkansas
Director: David Roark
 Director: David Roark Service Area: The Texas Service Center accepts and processes certain applications and petitions from individuals residing in the following states: Alabama, Arkansas, Connecticut,
8.7% 3.9% California. California MFG job growth continues to lag the country Percent change since Rest of United States. April Jan.
 MFG job growth continues to lag the country Percent change since Rest of United States 8.7% Jan 10: 10,211,600 Apr 17: 11,098,100 886,500 April 2017 3.9% Jan 10: 1,248,400 Apr 17: 1,297,900 49,500 Jan.
Appendix D: Aggregation Error for New England Metro Areas and for Places
 Appendix D: for New England Metro Areas and for Places D-1 Appendix D: s Figure D-1: New England Metro Areas - Summary of Tract s (2000) Metro ID (msapma99) Metro Area Name Census NCDB 1120 Boston, MA-NH
The 156 Arts & Economic Prosperity III Study Regions
 Full-Time Resident Local NATIONAL ESTIMATES OF ECONOMIC IMPACT $63,053,399,000 $103,145,088,000 $166,198,487,000 5,695,361 $104,234,116,000 $7,936,383,000 $9,140,633,000 AK City of Homer A 5,364 $1,248,208
RANKING OF THE 100 MOST POPULOUS U.S. CITIES 12/7/ /31/2016
 OVERVIEW OF THE DATA The following information is based on incoming communication to the National Human Trafficking Hotline via phone, email, and online tip report from December 7, 2007 December 31, 2016
Q1 Arrival Statistics. January-March 2015
 Q1 Arrival Statistics January-March 2015 Q1 Total Air Arrivals Visitor Expenditure The average per person expenditure increased by $278 vs. Q1 2014. Overall this increase in spend contributed over $6M
Major Metropolitan Area Sales Tax Rates
 August 19, 2010 No. 239 FISCAL FACT Major Metropolitan Area Sales Tax Rates By Lawrence Summers Introduction General sales taxes levied by state, county and city governments in the United States vary greatly,
Weekly Disaster Stats Update
 Weekly Disaster Stats Update The Weekly Disaster Stats Update is published every week on Tuesday. The product is meant to provide a snapshot of major disaster statistics throughout the calendar year to-date,
North Carolina Counties Servicing Social Security Field Office. County Servicing Office District Manager Phone Number
 North Carolina Counties Servicing Social Security Field Office County Servicing Office District Manager Phone Number Alamance Burlington Sandra Muller 336-221-8179 Alexander Hickory Debbie Dedmon 828-328-2484
NATIONAL TOLL FACILITIES USAGE ANALYSIS RECORD-BREAKING YEAR FOR TOLL FACILITIES ACROSS THE U.S.
 NATIONAL TOLL FACILITIES USAGE ANALYSIS RECORD-BREAKING YEAR FOR TOLL FACILITIES ACROSS THE U.S. INTRODUCTION KEY FACTS FROM THE NATIONAL TOLL FACILITIES USAGE ANALYSIS 31 TOLL AUTHORITIES from across
Contact Orion at if you are not able to locate your agent.
 Alabama Alaska Arizona Arkansas California Colorado Connecticut Delaware District of Columbia Florida Georgia Idaho Illinois Indiana Iowa Kansas Kentucky Louisiana Maine Maryland Massachusetts Michigan
The 182 Arts & Economic Prosperity IV Study Regions
 Group Arts ECONOMIC IMPACT OF SPENDING NATIONAL ESTIMATES OF ECONOMIC IMPACT $61.1 Billion $74.1 Billion $135.2 Billion 4.1 Million $86.7 Billion $6.7 Billion $9.6 Billion AK City and Borough of Juneau
Alabama Y Y Birmingham-Hoover, AL Y Y. Alaska N/A. Arizona N Y Phoenix-Mesa-Scottsdale, AZ N Y Tucson, AZ N Y
 - requires bidders to obtain out of state Alabama Y Y Birmingham-Hoover, AL Y Y Alaska Arizona N Y Phoenix-Mesa-Scottsdale, AZ N Y Tucson, AZ N Y Arkansas Y N Little Rock-North Little Rock, AR Y N Memphis,
Rank Place State Native Hawaiian and Pacific Islander population (alone or in combination
 TABLE 2a: 100 Largest Places Ranked by Number of s (race alone or in *) Living in Hard-to- Census Rank Place State (alone or in 1 Honolulu (CDP) HI 64,196 11,130 17.3 2 New York City NY 14,981 8,211 54.8
SGS ACCUTEST STATE CERTIFICATIONS, ACCREDITATIONS, AND PERMITS BY STATE
 Alaska UST-103 5/4/2017 Dayton, NJ Alaska UST-088 8/21/2017 Orlando, FL Arizona AZ0786 9/9/2017 Dayton, NJ Arizona AZ0769 7/12/2017 Houston, TX Arkansas 16-027-0 3/28/2017 Houston, TX Arkansas 16-050-0
Land Information Ontario Data Description. OHN 2M Waterbody
 Unclassified Land Information Ontario Data Description OHN 2M Waterbody Disclaimer This technical documentation has been prepared by the Ministry of Natural Resources (the Ministry ), representing Her
The Economic Impact of Tourism in Missouri. Fiscal Year 2016 Summary December 2016
 The Economic Impact of Tourism in Missouri Fiscal Year 2016 Summary December 2016 Introduction and definitions This study measures the economic impact of tourism in Missouri in FY2016. Visitors included
Manufacturer s Representatives Plumbing Wholesale Channel
 ALABAMA ALASKA ARIZONA Breecher Sales, Inc. 2520 W. Holly Street Phoenix, AZ 85009 602-257-0278 www.breechersales.com ARKANSAS Wiggs, Haun & Bohan 7013 Westbelt Dr. Nashville, TN 37209 615-350-8334 www.whbsales.com
Statistical Report of State Park Operations:
 National Association of State Park Directors Statistical Report of State Park Operations: 2011-2012 Annual Information Exchange for the Period July 1, 2011 through June 30, 2012 Prepared for the National
Population Estimates for U.S. Cities Report 1: Fastest Growing Cities Based on Numeric Increase,
 ulation s for U.S. Cities Report 1: Fastest Growing Cities Based on Numeric Increase, 2015-2015 1 Phoenix AZ 32,113 2.0 1,582,904 1,615,017 167,393 11.6 2 Los Angeles CA 27,173 0.7 3,949,149 3,976,322
L U K A S LIGHTING. If your City or State is not listed, Contact Lukas Lighting Directly:
 If your City or State is not listed, Contact Lukas Lighting Directly: Lukas Lighting 40-20 22nd Street Long Island City, NY 11101 info@lukaslighting.com 1-800-841-4011 ALPHABETICAL BY STATE (Last Updated
1133 POPLAR CREEK ROAD HENDERSON, NORTH CAROLINA INDUSTRIAL BUILDING FOR SALE OR LEASE ±197,086 SF
 HENDERSON, NORTH CAROLINA 27537 ±97,086 SF BUILDING ATURES BUILDING SIZE AVAILABLE SF 97,086 SF 97,086 RSF LIST PRICE $,85,000 RENTAL RATE TICAM LAND AREA Warehouse: 3,094 SF Two-story office: 30,8 SF
840 PHASE I AVAILABLE
 PHASE I AVAILABLE PHASE I - SPEEDWAY BUILDING I - 689,4 SF EXPANDABLE to 1,500,000 SF Class A Distribution Center Under Construction LEBANON MT. JULIET NASHVILLE Nashville International Airport WILSON
1Q 2014 Greater Atlanta HBA Builder Developer Lender Council meeting Information presented by. Atlanta Job Growth
 1Q 2014 Greater Atlanta HBA Builder Developer Lender Council meeting 5-21-2014 Information presented by Eugene James, Regional Director ejames@metrostudy.com 404-510-1080 connect on LinkedIn Atlanta Job
1133 POPLAR CREEK ROAD HENDERSON, NORTH CAROLINA INDUSTRIAL BUILDING FOR SALE OR LEASE ±197,086 SF
 33 POPLAR CREEK ROAD HENDERSON, NORTH CAROLINA ±97,086 SF 33 POPLAR CREEK ROAD BUILDING ATURES BUILDING SIZE AVAILABLE SF 97,086 SF 97,086 RSF LIST PRICE $,,000 RENTAL RATE TICAM LAND AREA Warehouse: 3,094
 https://democracyforvietnam.capwiz.com/democracyforvietnam/admin/repmsgst... Page 1 of 1 DemocracyForVietnam.net Go to your Capwiz site YOUR ACCOUNT LOGOUT Reports Advocacy Communications Site Manager
50 Alumni & Development ALUMNI & DEVELOPMENT
 50 Alumni & Development ALUMNI & DEVELOPMENT INSERT PHOTO HERE Alumni & Development 51 52 Alumni & Development Alumni Association National Board of s 2004-2005 Christopher M. Doran 68 President Susan Power
District Match Data Availability
 District Match Data Availability National & State Data Location Available National Data Australia Parliament, Provincial and Territory Assemblies Canada Parliament, Provincial Legislative Assemblies New
USA Countr First Name Last Name Contact Phone Address City State Zip STATE
 USA Countr First Name Last Name Contact Phone Address City State Zip STATE y Email Address Alabama IAC Acoustics Ted Marquis 614 561 9464 401 Airport Road North Aurora IL 60542 USA tmarquis@soundseal.com
WAVE II JUNE travelhorizons TM WAVE II 2014 PREPARED AND PUBLISHED BY: MMGY Global
 WAVE II June 14 travelhorizons TM WAVE II 14 PREPARED AND PUBLISHED BY: WAVE II JUNE 14 MMGY Global 423 South Keller Road, Suite 1 Orlando, FL 3281, 7-875-1111 MMGYGlobal.com 14 MMGY Global. All rights
Approved FY 2002 Waivers (42**) (10)
 (10)") Summary of Requests to Waive 7 CFR 273.24 Pending FY 2003 Waivers (1) Approved FY 2003 Waivers (43*) Approved FY 2002 Waivers (42**) No Current Waivers (9) Indian Reservations (10) Maine Alabama*** Nevada
Summary of Requests to Waive 7 CFR 273.24 Pending FY 2003 Waivers (1) Approved FY 2003 Waivers (43*) Approved FY 2002 Waivers (42**) No Current Waivers (9) Indian Reservations (10) Maine Alabama*** Nevada
Representative Directory 11/03/17 Starfire Lighting, Inc. 7 Donna Drive Wood-Ridge, NJ
 Representative Directory 11/03/17 Starfire Lighting, Inc. 7 Donna Drive Wood-Ridge, NJ 07075 800-443-8823 www.starfirelighting.com ALABAMA Karl Volk & Co., Inc. PO Box 7080 Spanish Fort, AL 36577 P. 251-621-2663
Norwegian's Free Airfare Promotion
 Norwegian's Free Airfare Promotion Start planning your next vacation with 200+ cruises to incredible destinations, including Alaska, Bahamas & Florida, Bermuda, Canada & New England, Caribbean, Mexican
Exhibition Attendance Certification for Expo! Expo! IAEM s Annual Meeting & Exhibition 2005
 Exhibition Attendance Certification for Expo! Expo! IAEM s Annual Meeting & Exhibition 2005 Date of Conference: November 29 December 1, 2005 Date of Exposition: November 30, 2005 Location: Atlanta, GA
Hector International Airport Fargo, North Dakota
 Hector International Airport Fargo, North Dakota Volume 073 Twelve Months Ended September 2007 January 2008 Airlines Serving Fargo Carried 831 Onboard Passengers Per Day for the Twelve Months Ended September
Matt MacLaren, Esq. SVP Member Relations AzLTA Presentation
 Matt MacLaren, Esq. SVP Member Relations AzLTA Presentation 11.29.16 MOVING THE NEEDLE: MEMBERSHIP & ENGAGEMENT 2013 Properties: 8,500 Rooms: 1.3 Million 2016 Properties: 23,500 Rooms: 2.8 Million +175%
LEA NAME SCH NAME 9 12 ADM 4A SCHOOLS
 LEA NAME SCH NAME 9 12 ADM 4A SCHOOLS MECKLENBURG COUNTY MYERS PARK HIGH 2988 WAKE COUNTY WAKEFIELD HIGH 2797 WAKE COUNTY WILLIAM G ENLOE HIGH 2672 MECKLENBURG COUNTY INDEPENDENCE HIGH 2660 MECKLENBURG
GRND 3D 2D NXT GRND 3D 2D NXT GRND 3D 2D NXT AL
 750's 12 PACK SHIPMENTS Wine Shipping Rates 11/01/2018 6 PACK SHIPMENTS 4 PACK SHIPMENTS GRND 3D 2D NXT GRND 3D 2D NXT GRND 3D 2D NXT AL AK - - $156 - - - $114 - - - $94 - AZ $50 $99 $112 $141 $36 $70
Higher Education in America s Metropolitan Areas A Statistical Profile
 Higher Education in America s Metropolitan Areas A Statistical Profile MSA Study No.2 Higher Education in America s Metropolitan Areas A Statistical Profile CONTENTS Why Metro Areas? 1 Executive Summary
California Craft Brewing: Future and Challenges. Bart Watson, PhD Chief Economist Brewers Association
 California Craft Brewing: Future and Challenges Bart Watson, PhD bart@brewersassociation.org Chief Economist Brewers Association Zeroing in on Industry Challenges 1. All Beverage Alcohol 2. All Beer 3.
Arizona - Phoenix Last Updated by Seyed 12 hours ago Tempe Mission Palms Hotel 60E. 5th St. Tempe, AZ Tel.
 www.iran.org COMPLETE LIST OF ILLEGAL POLLING PLACES SET UP BY THE ISLAMIC REPUBLIC OF IRAN IN THE UNITED STATES FOR THE JUNE 12, 2009 PRESIDENTIAL ELECTIONS 1 Source: Islamic Republic of Iran Interest
Join us! Dare to imagine and take your business from great to outstanding!
 JAFRA Coming to a city near you! Join us! Dare to imagine and take your business from great to outstanding! Get the latest company news. Learn new & different ways to maximize your holiday sells. Discover
Hector International Airport Fargo, North Dakota
 Hector International Airport Fargo, North Dakota Volume 072 Twelve Months Ended June 2007 November 2007 Airlines Serving Fargo Carried 830 Onboard Passengers Per Day for the Twelve Months Ended June 2007,
INDUSTRY CALENDAR Wisconsin State Telephone Association Broadband Forum Stevens Point, WI. 19 WTA PPC Committee Meeting Seattle, WA
 INDUSTRY CALENDAR JANUARY 2016 1 Happy New Year WTA Office Closed 13-14 Wisconsin State Telephone Association Broadband Forum Stevens Point, WI 18 Martin Luther King, Jr. Birthday WTA Office Closed 19
School Calendar Information
 2012-2013 School Calendar Information State County First Day Spring Break Last Day Georgia Kentucky New York North Carolina Georgia Atlanta 8/6/2012 4/8/13-4/12/13 5/22/2013 Augusta 8/3/2012 4/8/13-4/12/13
At the end of the bill (before the short title), insert the following:
, insert the following:") AMENDMENT TO H. R. (CONTINUING APPROPRIATIONS, 0) OFFERED BY MR. PENCE OF INDIANA At the end of the bill (before the short title), insert the following: 0 SEC. ll. None of the funds made available by this
AMENDMENT TO H. R. (CONTINUING APPROPRIATIONS, 0) OFFERED BY MR. PENCE OF INDIANA At the end of the bill (before the short title), insert the following: 0 SEC. ll. None of the funds made available by this
Requests by Intake and Case Status Period. Intake 1 Case Review 6
 Number of Form I-821D,Consideration of Deferred Action for Childhood Arrivals, by Fiscal Year, Quarter, Intake and Case Status Fiscal Year 2012-2018 (March 31, 2018) Requests by Intake and Case Status
Historical Manufacturing Data for Virginia and the United States in 1870
 Historical Manufacturing Data for Virginia and the United States in 1870 May 2015 For additional information or explanation of the content of this document, you may contact the Economic/Operations Research
Access Across America: Transit 2014
 Access Across America: Transit 2014 Final Report CTS 14-11 Prepared by: Andrew Owen David Levinson Accessibility Observatory Department of Civil, Environmental, and Geo- Engineering University of Minnesota
GoToBermuda.com. Q4 Arrivals and Statistics at December 31 st 2015
 Q4 Arrivals and Statistics at December 31 st 1 Q4 Total Vacation Visitor Arrivals Q4 Arrivals Air - Vacation 23,770 23,125-2.7% -645 141,509 139,820-1.2% -1,689 Cruise 39,118 48,344 23.6% 9,226 355,880
Items to include in your final application packet to USCIS:
 PREPARING THE APPLICATION PACKET FOR USCIS OPT EXTENSION CHECK LIST: 1. Sign the OPT Extension I-20. You keep the original. 2. Make a copy of OPT Extension I-20 for the USCIS. Items to include in your
Municipal Bond Credit Report
 Table of Contents Municipal Bond Credit Report Third Quarter 2018 November 2018 1 Table of Contents Table of Contents Table of Contents... 2 Market Summary... 3... 7 Credits... 18 SIFMA is the leading
IAEE s Annual Meeting & Exhibition International Association of Exhibitions and Events
 Expo! Expo! IAEE s Annual Meeting & Exhibition 2010 EVENT AUDIT DATES OF EVENT: Conference: December 7 9, 2010 Exhibits: December 8, 2010 LOCATION: New Orleans, LA EVENT PRODUCER/MANAGER: Company Name:
Snowbelt to Sunbelt The Migration of America s s Voters
 Snowbelt to Sunbelt The Migration of America s s Voters William H. Frey The Brookings Institution & University of Michigan www.frey-demographer.org State Projected Growth, 2000-2030 2030 Projected Growth,
UNITED STATES CITIZENSHIP & IMMIGRATION SERVICES PHOTO GUIDELINES FOR VISA APPLICATIONS AND PETITIONS THAT REQUIRE PHOTOS
 UNITED STATES CITIZENSHIP & IMMIGRATION SERVICES PHOTO GUIDELINES FOR VISA APPLICATIONS AND PETITIONS THAT REQUIRE PHOTOS Beginning September 1, 2004, applications to requiring passport photos must be
State DOL Contacts for Apprenticeship Programs
 State DOL Contacts for Apprenticeship Programs Alabama Gregory Collins Medical Forum Bldg. Room 648 950 22nd Street North Birmingham, Alabama 35203 205/731 1308 E Mail: collins.gregory@dol.gov Alaska John
APPENDIX B AUTHORIZED SECTIONS of the SOCIETY OF MOTION PICTURE AND TELEVISION ENGINEERS with GEOGRAPHICAL BOUNDARIES (Revised )
") APPENDIX B AUTHORIZED SECTIONS of the SOCIETY OF MOTION PICTURE AND TELEVISION ENGINEERS with GEOGRAPHICAL BOUNDARIES (Revised 12-12-2008) ATLANTA SECTION - Southern Region Alabama (Part) by choice Florida
APPENDIX B AUTHORIZED SECTIONS of the SOCIETY OF MOTION PICTURE AND TELEVISION ENGINEERS with GEOGRAPHICAL BOUNDARIES (Revised 12-12-2008) ATLANTA SECTION - Southern Region Alabama (Part) by choice Florida
MUNICIPAL BOND CREDIT REPORT Third Quarter 2017 RESEARCH REPORT
 MUNICIPAL BOND CREDIT REPORT Third Quarter 2017 RESEARCH REPORT TABLE OF CONTENTS Table of Contents... i Market Summary... 2 Charts & Data... 4 Long-Term Municipal State Issuance, 3Q 17... 4 Long-Term
carbon footprinttm COUNTRY SPECIFIC ELECTRICITY FACTORS Last Updated August 2018
 carbon footprinttm COUNTRY SPECIFIC ELECTRICITY FACTORS Last Updated August 2018 COUNTRY SPECIFIC ELECTRICITY FACTORS AUGUST 2018 The following grid electricity emissions factors are used in our online
If you have any other questions, please feel free to call us at MEDICARE ( ). Sincerely, Centers for Medicare & Medicaid Services
. Sincerely, Centers for Medicare & Medicaid Services") Thank you for your recent request for the Patient s Request for Medical Payment form (CMS-1490S). Enclosed is the form, instructions for completing it, and where to return the form for processing. The
Thank you for your recent request for the Patient s Request for Medical Payment form (CMS-1490S). Enclosed is the form, instructions for completing it, and where to return the form for processing. The
Your Questions & Comments. States to Watch in 2017: Transportation Funding
 Agenda National Outlook: Alison Premo Black, American Road & Transportation Builders Association Indiana: Kaitlin Lange, Evansville Courier & Press New Mexico: Andy Lyman, New Mexico Political Report Oregon:
ARD/RD CHAPTER ASSIGNMENTS
 CENTRAL REGION (Bruce Norris) Indiana, Kentucky, Michigan, MID-ATLANTIC REGION (Bill Carter) District of Columbia, Ohio, Western Pennsylvania, West Virginia Delaware, Maryland, North Carolina, South Carolina,
2012 Census of Agriculture Final Data Release
 United States Department of Agriculture National Agricultural Statistics Service 2012 Census of Agriculture Final Data Release King Whetstone, Director USDA/NASS Northeastern Region May 14, 2014 PRACTICES
NCHSAA Men s First Round Basketball Playoff 4A FINAL:: 02/17/18 Overall Seed School Name Game W/L/T
 NCHSAA Men s First Round Basketball Playoff 4A 4A W 1 North Mecklenburg 32 Bye 16 Hough 15-12-0 17 Myers Park 8 Hopewell 19-8-0 25 Bye 9 Rocky River 24 Ronald Reagan 8-17-0 5 McDowell 28 Bye 12 Scotland
Strategic Central Florida Location Big Bend Road & U.S. Highway 41
 Strategic Central Florida Location Big Bend Road & U.S. Highway 41 Park Highlights 337,447 SF (Building 13124) under construction June 2017 occupancy Cross-Dock 101 Trailer Spaces 1.5 miles from I-75 8
Trial Locations ADAPT: AGS 003. United States, Arizona. United States, Arkansas. United States, California. United States, Colorado
 Trial Locations ADAPT: AGS 003 United States, Arizona Scottsdale, Arizona, United States, 85259 United States, Arkansas Little Rock, Arkansas, United States, 72205 United States, California La Jolla, California,
(See Note 1) Solar Energy Factor (SEF D ) Solar Fraction (SF D ) Estimated Energy Savings SYSTEM DETAILS
 Solar Energy Factor (SEF D ) Solar Fraction (SF D ) Estimated Energy Savings SYSTEM DETAILS") OG-300 ICC-SRCC TM CERTIFIED SOLAR SYSTEM # SYSTEM INFORMATION Pumped Internal Backup: Gas Tank Collector Type: Glazed Flat Plate Solar Tank Volume: 379 liter (100 gal) Collector Heat Transfer Fluid: GRAS
OG-300 ICC-SRCC TM CERTIFIED SOLAR SYSTEM # SYSTEM INFORMATION Pumped Internal Backup: Gas Tank Collector Type: Glazed Flat Plate Solar Tank Volume: 379 liter (100 gal) Collector Heat Transfer Fluid: GRAS
DOWNTOWN, CHARLOTTE AMALIE
 TOTAL VISITOR ARRIVALS TO THE USVI : DECEMBER YEAR TO DATE DECEMBER TOTAL VISITOR ARRIVALS 2,85, 2,8, 2,814,257 2,75, 2,7, 2,65, 2,6, 2,642,118 2,71,542 2,648,5 2,55, 212 213 214 215 Visitor arrivals ended