PASO DEL NORTE ECONOMIC INDICATOR REVIEW SPRING 2015
|
|
|
- Sherman Haynes
- 6 years ago
- Views:
Transcription

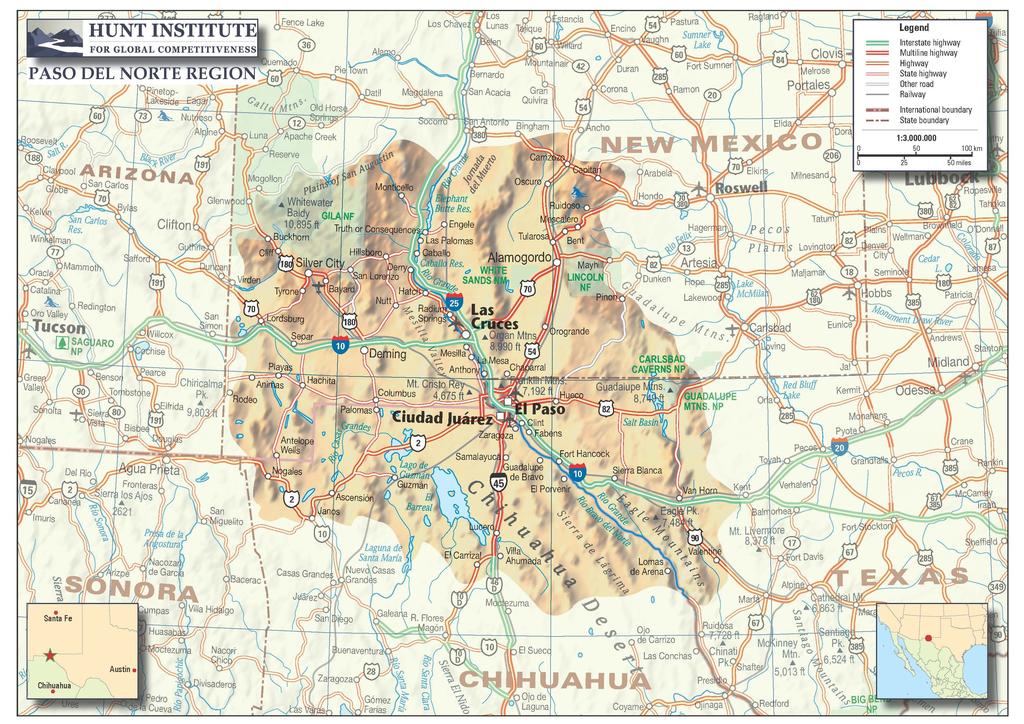
1 PASO DEL NORTE ECONOMIC INDICATOR REVIEW SPRING 2015 UNIVERSITY OF TEXAS AT EL PASO Introduction The Paso del Norte region, comprising West Texas, New Mexico, and Chihuahua, has stood, for millennia, at the crossroads of vital continental trade routes. As demonstrated by the data in this report, its importance as a geostrategic corridor has only grown becoming one of the most critical demographic, industrial, and trade centers, along the entire U.S.-Mexico border. A review of this data and the accompanying analysis, organized into the following POPULATION, EMPLOYMENT, EXPORT-ORIENTED MANU- FACTURING FIRMS, and the REGION S PORTS OF TRADE confirms this significance, and also demonstrates the ever growing need not only to expedite trade flows, but also to add value along the supply chains which pass through the region in order to strengthen and secure our competitive advantages in both the North American and international economic contexts. Population Taken together, with a combined population 1 of over 2.3 million individuals, El Paso County and the municipio of Ciudad Juárez form one of the most populous transboundary metropolitan areas not only along the entire U.S. -Mexico border region, but also in the world. Doña Ana County, which borders Ciudad Juárez and El Paso County just to the north, is home to an additional 213,000 individuals, bringing the total population of the Paso del Norte region to approximately 2.5 million people. For various reasons, the demographic growth in these locations has advanced at a faster pace than that of either the United States or Mexico in recent decades. From 1990 to 2012, while the average annual growth rate was 1.0% in the U.S. and 1.2% in Mexico, those of El Paso, Doña Ana County and Ciudad Juárez were 1.5%, 2.1% and 2.6%, respectively. This trend from 1990 to 2012 is consistent with metropolitan growth on the U.S.-Mexico border which also had higher growth rates than their national averages: 1.6% for U.S. border cities and 3.0% for Mexican border cities. These rates of growth are expected to continue. According to the UTEP Border Region Modeling Project, the PdN metroplex will host 3.4 million individuals by This demographic growth, through the concentration of population centers, simultaneously creates unprecedented economic development and employment opportunities which, in turn, furthers the binational and geo-strategic importance of the region. 1

2 Employment 3 Employment growth is tied to demographic growth as an increase in population boosts demand for goods and services which then leads to job creation in order to satisfy these needs. 4 In order to facilitate an examination of the current and thereby future employment in the Paso del Norte s urban areas, five sectors 5 of employment were grouped and analyzed: i. Manufacturing ii. Construction iii. Services iv. Commerce v. Transportation and Utilities As the data show, the structure of employment in these urban areas has evolved markedly in the recent decades (Figure 1). The most notable change in El Paso is the decline of the manufacturing sector s share to the total employment from 1990 to 2014, going from 19.7% to 5.8%. This decline accompanied an almost parallel increase in the share of the total employment in El Paso s services sector, moving from 53.8% in 1990 to 68.0% in In Las Cruces, the share of employees engaged in the services sector increased slightly during the period and it currently accounts for more than three quarters of its total employment at 76.5%. On the other hand, manufacturing continues to dominate employment in Ciudad Juárez. Although the manufacturing sector share has contracted from 2000 to 2014, it occupies 63.9% of formal employment. However, the manufacturing sector may actually possesses a smaller share of total employment with the services sector holding a larger share provided that only formal employment 6 was analyzed in Ciudad Juárez. Geographical proximity to Ciudad Juárez has shaped the transition from the manufacturing to services sector in El Paso as many service industries in the latter provide support for maquiladoras 7 in Ciudad Juárez. 8 A recent study indicates that the maquiladora production in the Mexican border cities has had a significant positive impact on specific industries in corresponding U.S. border cities. 9 According to this study, for the period from 1990 to 2006, El Paso s manufacturing employment sector did not respond significantly to an increase in Ciudad Juárez maquiladora export output, and only the sectors of personal and business services, finance-insurance-real estate, and transportation were positively and significantly impacted. Figure 1 Structure of Regional Employment Source: U.S. Bureau of Labor Statistics and Instituto Mexicano del Seguro Social (IMSS). Authors calculations. This has been partially attributed to just-in-time inventory management techniques that in combination with higher security crossing border requirements, has resulted in some manufacturing suppliers to move from the U.S. to Mexico. In February 2015, the total employment increased at yearover-year rates in Ciudad Juárez of 8.8% (more than 30,000 job gains). As observed in Figure 2, this yearly percentage increase in employment represent the highest since July 2010 for the city. In contrast, El Paso and Las Cruces employment remained nearly flat during the period February 2014-February 2015 (Table 1). Given that most of the formal employment in Ciudad Juárez derives from the manufacturing sector, changes in total employment can be partially attributed to variations in demand factors, such as the U.S. industrial production, as shown in Figure 2. *Seasonally adjusted. Preliminary information for February 2015 for El Paso and Las Cruces. Source: U.S. Bureau of Labor Statistics (BLS) and Instituto Mexicano del Seguro Social (IMSS). Authors calculations. 2


3 But, while total employment has been increasing at greater year-over-year rates for Ciudad Juárez than for El Paso and Las Cruces since the 2008 global financial crisis, employment levels for Ciudad Juárez have not reached yet that attained before the crisis. The main areas of growth in the yearly employment increase in February 2015 for Ciudad Juárez was the manufacturing sector, which boosted the total employment by more than 26,000 jobs. Although in El Paso this employment sector increased only 0.4%, for the first time in eighteen months it reported a non-negative year-over-year rate. In Las Cruces only two employment sectors, commerce and transportation and utilities, increased for the February 2014-February 2015 period. *Seasonally adjusted. Preliminary information for February 2015 for El Paso and Las Cruces. ** Includes mining and logging sectors. Source: BLS and IMSS. Authors calculations. Export Oriented Manufacturing Firms A substantial portion of the manufacturing sector employees in Ciudad Juárez work in export-oriented manufacturing firms (79.2 % during 2014). In fact, of any urban metropolitan area in Mexico, Ciudad Juárez currently holds the largest number of export-oriented manufacturing employees and possesses more export-oriented manufacturing firms that any other Mexican city except Tijuana. The top ten maquiladoras (by number of employees) in Ciudad Juárez are concentrated mainly in the automotive, electronic and medical device manufacturing sectors, employ approximately 75,000 individuals and account for a third of all the export-oriented manufacturing workers in the city (Table 2). Interestingly, though, the number of export-oriented manufacturing firms in Ciudad Juárez has been declining in recent years. In 2010, there were, on average, 335 exportoriented manufacturing firms in the urban area but this has decreased 6.3% to 315 as of December In contrast, the number of employees directly hired in these same firms increased from approximately 156,500 to 193,093 employees during the same period a 23.4% increase. The decrease in the number of export-oriented manufacturing firms and the simultaneous-increase in the number of directly hired employees is not unique to Ciudad Juárez, as similar trends can be observed along the entire border and within Mexico as well. Ciudad Juárez also holds the highest amount of production workers per export-oriented manufacturing firm across Mexico and its northern border cities (Figure 3). 10 On average, there were 523 production workers per export -oriented manufacturing firm in Ciudad Juárez in 2014, while in Mexico and the border region, there were an average of only 287 and 378 production workers per firm, respectively. In order to assess how the wages for both production and non-production workers in Ciudad Juárez compare relative to other northern Mexican metropolitan areas, these wages (for the month of December 2014) were converted into U.S. Dollars (USD). As seen in Table 3, the average salary of all workers, both production and non-production, in Ciudad Juárez is less than their counterparts in other northern Mexican border cities (only Ciudad Acuña, Coahuila has lower wages per employee). This average salary *The number in parenthesis is the number of plants in Ciudad Juárez. Source: Index Juárez. 3


4 in Ciudad Juárez is due to the weight of the production workers wages, as this type of employee represents 90% of all workers employed in export-oriented manufacturing firms in The December 2014 data reveals that the production workers in Ciudad Juárez had one of the lowest salaries throughout either the Mexican interior or border region. This fact contrasts with the wages of non-production workers who were the best paid across Mexico. Further research is needed to determine the factors influencing these results. On average, real monthly wages per worker in exportoriented manufacturing firms in both Mexico, in general, and Ciudad Juárez, in particular, have not reached the levels attained in January 2010 (Figure 4). Wages paid to workers in the export-oriented manufacturing firms in the Mexican border and Ciudad Juárez are the farthest of all regions from reaching the 2010 levels, and monthly real wages levels in Ciudad Juárez per worker in December 2014 were the lowest across these four regions. *Rail and Truck Source: Bureau of Transportation Statistics. are key to the binational trade between U.S. and Mexico. In 2014, the total value of goods (both imported and exported) passing through El Paso was USD 67.9 billion, 95% of which was carried by truck and rail trade with Mexico. 12 Most of the goods traded with Mexico, both imported and exported, through the El Paso PoE (USD 55.1 billion) went by truck. The category of metals and manufactured articles made mostly by metal was the most tradedcategory of goods, imported and exported, transiting by rail and truck through El Paso (Table 5). The second most traded category of goods transiting by rail was agricultural products (16.6%), while by truck it was chemical and related products (7.1%). *Seasonally adjusted, three month average, index on real pesos. El Paso, Las Cruces, and Juárez as Ports of Trade From January to November 2014, export-oriented manufacturing firms generated roughly 50% of Mexico s total merchandise trade value (USD billion). For that year, Mexico s overall trade in goods with the rest of the world was USD billion, with approximately twothirds of this trade being with the U.S. The U.S. total trade (sum of exports and imports) of goods with the rest of the globe was USD 3.9 trillion in 2014, of which 13.4% (USD billion) was with Mexico. Mexico was the second largest importer (after Canada) of U.S. goods, while for the U.S., Mexico was the third largest source of imports (after China and Canada). Since none of its trading partners account for more than 20% of its overall trade, the U.S. trade market is considered to be well diversified. Mexico, on the other hand, heavily depends on the U.S. for its overall trade (82.5% for exports to the U.S. and 48.8% for imports from the U.S.). Of extreme importance to this mutual, bi-national trade relationship is the role that the Ports of El Paso, Texas 11 and Santa Teresa, New Mexico play in facilitating these commercial flows. For example, these Paso del Norte ports of entry (PoE) taken together ranked second only after the Laredo, Texas PoE- for overall surface trade between the two countries (Table 4). Undoubtedly, the region s PoE 4 Source: Bureau of Transportation Statistics. Authors calculations. Figure 5 displays the top four types of goods that were imported and exported by rail or truck that went through the El Paso PoE to Mexico in The top export and imported good was electrical machinery and equipment and parts thereof with USD 9.1 billion and USD 10.6 billion, respectively. These types of goods accounted for 31% of all the trade value with Mexico through El Paso. The second most traded type of good was machinery and others (totaling USD 14.0 billion in both exports and imports) and, in conjunction with electrical machinery and equipment and parts thereof, these two types of goods accounted for slightly more than half of the goods passing through the El Paso PoE (52.6%) with Mexico.

5 Conclusion *Includes cinematographic, measuring, checking, and precision. ** Includes nuclear reactors, boilers, and mechanical appliances, parts thereof. Additionally, Ciudad Juárez represents an important international gateway for Mexico as this city accounted for 12.8% of the total goods traded through Mexican PoE in 2014, while also mirroring overall industrial trends in the U.S. and Mexico. For example, rail imports that pass through the Ciudad Juárez PoE into Mexico have a pattern similar to the Mexican Industrial Production Index 13. Likewise, the trade activity through Ciudad Juárez matches overall U.S. industrial trends. The Mexican rail exports passing through the Ciudad Juárez PoE have a notably positive relationship with the U.S. Industrial Production Index. The recent deceleration and expansion in Mexican exports by rail through Ciudad Juárez can partially be attributed to the corresponding decline and growth in the U.S. Industrial Production Index starting in mid-2012 and mid 2013 (Figures 6 and 7). The Paso del Norte region is one of the most important centers of demographic growth, industrial activity, and trade flows on the U.S.-Mexico border. The region represents a key nexus and point of interchange for the entire North American market as trade between the U.S. and Mexico greatly depends on the efficient and rapid passage of people, goods, and services through its ports. In order, then, to reinforce the economic vibrancy and importance of the Paso del Norte region as an international gateway, sustained local, regional, and binational efforts and policies must be applied to this end. In particular, the development of infrastructure and the increased participation in customs programs can increase the efficiency of the trade flows while, at the same time, the application of academic programs and workforce training can complement and add significant value to the industrial and service sectors which surround the region s economic activity. In this way, coordinating institutions, policies, and investment among all of the region s communities will not merely further the economic development of the Paso del Norte region, but inform, enrich, and stimulate the broader North American and international economies as well. Notes The Hunt Institute s team is grateful to those who have contributed to the completion of this study as their expertise and insights were of invaluable assistance. 1 Information for El Paso and Las Cruces corresponds to El Paso County and Dona Ana County. 2 Fullerton, T. and Molina, A. (2010) Borderplex Long-Term Economic Trends to Border Region Modeling Project, Business Report SR10-1, pp El Paso: University of Texas at El Paso. 3 This section refers to El Paso Metropolitan Statistical Area (MSA), Las Cruces MSA and Ciudad Juárez seasonally adjusted non-farm payroll employment. Ciudad Juárez corresponds to total non-farm payroll formal employment. 4 Deming W (1996) A decade of economic change and population shifts in U.S. regions. Regional Economic Changes. November These groupings required the harmonization of Mexican and U.S. employment through a comparison of the North American Industry Classification System (NAICS) sectors for the U.S. and Instituto Mexicano del Seguro Social (IMSS) sectors for Mexico. The construction sector includes mining and logging. Services include government services. Commerce sector includes wholesale and retail trade. Water utilities, which is reported under the mining and water utilities sector in Mexico was considered into the transportation and utilities sector. 6 Formal sector corresponds to the employment that is registered with government authorities and is taxed. 7 Maquiladoras are firms that assemble and process imported inputs to be exported. 8 Canas J (2002) A decade for change: El Paso s economic transition of the 1990s. Business Frontier, Federal Reserve Bank of Dallas, El Paso Branch Issue 1. 9 Canas J, Coronado R, Gilmer R, Saucedo E (2013) The Impact of the Maquiladora Industry on U.S. Border Cities Growth and Change. Vol. 44. No Ciudad Acuña, Ciudad Juárez, Matamoros, Mexicali, Nogales, Nuevo Laredo, Reynosa, Tecate, and Tijuana. 11 According to the U.S. Customs and Border Protection (CBP), the main PoE in El Paso are: Yselta, Paso Del Norte, Bridge of the Americas and Stanton bridge USD 29.8 billion for exports and USD 34.4 billion for imports. 13 An industrial production index measures real output in diverse sectors. *Seasonally adjusted, six month moving average. Imports and exports in real dollars. 5
6 6
Paso Del Norte Economic Indicator Review Spring 2015 UNIVERSITY OF TEXAS AT EL PASO
 Paso Del Norte Economic Indicator Review Spring 2015 UNIVERSITY OF TEXAS AT EL PASO Introduction The Paso del Norte region, comprising West Texas, New Mexico, and Chihuahua, has stood, for millennia, at
Income in the border region,
 Income in the border region, 1993-2010 NAFTA at Twenty: Effects on the North American Market Federal Reserve Bank of Dallas, Houston Branch June 5-6, 2014 Dr. James Gerber Professor of Economics San Diego
Industrial Report. Americas Research. Northeast Mexico 4Q 2013
 Industrial Report Americas Research Northeast Mexico 4Q 2013 Northeast Mexico Industrial Overview The Northeast markets have had a considerable rise in activity. The Monterrey Metropolitan area has registered
The Economic Base of Colfax County, NM. PREPARED BY: The Office of Policy Analysis at Arrowhead Center, New Mexico State University.
 The Economic Base of Colfax County, NM PREPARED BY: The Office of Policy Analysis at Arrowhead Center, New Mexico State University DATE: July 2016 The Economic Base of Colfax County, New Mexico Introduction
Regional Economic Report April June 2015
 Regional Economic Report April June 2015 September 10, 2015 Outline I. Regional Economic Report II. Results April June 2015 A. Economic Activity B. Inflation C. Economic Outlook III. Final Remarks Regional
DESIGN, ENGINEERING AND ADVANCED MANUFACTURING IN MEXICO
 DESIGN, ENGINEERING AND ADVANCED MANUFACTURING IN MEXICO Where was this designed? Fusion 2013 (Ford) Corvette s transmission (Chevrolet) Minnesotas s train (Bombardier) Mastretta Sponge iron A340/737 interiors
Economic Impact of Tourism in Hillsborough County September 2016
 Economic Impact of Tourism in Hillsborough County - 2015 September 2016 Key findings for 2015 Almost 22 million people visited Hillsborough County in 2015. Visits to Hillsborough County increased 4.5%
HEALTH SECTOR ECONOMIC INDICATORS REPORT
 HEALTH SECTOR ECONOMIC INDICATORS REPORT For: Mid North Coast Local Health District Report prepared by: April 2013 Table of Contents Introduction 3 Executive Summary 4 Output 5 Value-Added 7 Workforce
DESIGN, ENGINEERING AND ADVANCED MANUFACTURING IN MEXICO. August 30 th, 2012
 DESIGN, ENGINEERING AND ADVANCED MANUFACTURING IN MEXICO August 30 th, 2012 Where was this designed? Fusion 2013 (Ford) Corvette s transmission (Tremec) Minnesotas s train (Bombardier) Mastretta Sponge
TIJUANA: NORTH AMERICA S MEDICAL DEVICE MANUFACTURING CAPITAL
 TIJUANA: NORTH AMERICA S MEDICAL DEVICE MANUFACTURING CAPITAL TIJUANA: NORTH AMERICA S MEDICAL DEVICE MANUFACTURING CAPITAL WHY MEXICO AND WHY TIJUANA? THE EXPERTS AGREE... Tijuana leads in employment
EXECUTIVE SUMMARY. hospitality compensation as a share of total compensation at. Page 1
 EXECUTIVE SUMMARY Applied Analysis was retained by the Las Vegas Convention and Visitors Authority (the LVCVA ) to review and analyze the economic impacts associated with its various operations and southern
VALUE OF TOURISM. Trends from
 VALUE OF TOURISM Trends from 2005-2015 March 2017 TABLE OF CONTENTS 1. Overview... 2 Key highlights in 2015... 2 2. Contributions to the economy... 4 TOURISM REVENUE... 5 Total revenue... 5 Tourism revenue
Regional Economic Report July- September 2014
 Regional Economic Report July- September 2014 December 11, 2014 Outline I. Introduction II. Results July September 2014 A. Economic Activity B. Inflation C. Economic Outlook III. Final Remarks Introduction
Industrial Market Report
 Industrial Report Northeast Mexico 1Q 2014 Tamaulipas, Nuevo Leon, Coahuila, Chihuahua Americas Research Northeast Mexico Industrial Overview JLL s Industrial Services is a dedicated team focused 100%
The Civil Aviation Sector as a Driver for Economic Growth in Egypt
 The Civil Aviation Sector as a Driver for Economic Growth in Egypt EDSCA Conference Cairo, November 10, 2013 Agenda 1. Facts and figures 2. Socio-economic impact of the civil aviation sector 3. Options
Regional Economic Report April June 2013
 Regional Economic Report April June 213 September 12, 213 Outline I. Introduction II. Results April - June 213 A. Economic Activity B. Inflation C. Economic Outlook III. Final Considerations Introduction
Economic Impacts of Campgrounds in New York State
 Economic Impacts of Campgrounds in New York State June 2017 Report Submitted to: Executive Summary Executive Summary New York State is home to approximately 350 privately owned campgrounds with 30,000
For High Altitude Profits, Aerospace Companies Land in Tijuana
 photo: Antonio Mercado photo: North American Production Sharing For High Altitude Profits, Aerospace Companies Land in Tijuana June 2012 Tijuana: Mexico s Nearshore Aerospace Hub The aerospace industry
THE STATE OF ZACATECAS, MEXICO
 2016 THE STATE OF ZACATECAS, MEXICO ZACATECAS Zacatecas is a state with a lot to offer. Its capital city is one of the most beautiful colonial cities in Mexico. Thanks to its history and architecture,
The Economic Impact of Tourism in Jacksonville, FL. June 2016
 The Economic Impact of Tourism in Jacksonville, FL June 2016 Highlights Visitor spending surpassed $2.0 billion in 2015, growing 4.4%. As this money flowed through Duval County, the $2.0 billion in visitor
The Economic Contribution of Cruise Tourism to the Southeast Asia Region in Prepared for: CLIA SE Asia. September 2015
 BREA Business Research & Economic Advisors The Economic Contribution of Cruise Tourism to the Southeast Asia Region in 2014 Prepared for: CLIA SE Asia September 2015 Business Research & Economic Advisors
 @ WWW.TOWNCENTERATMONTECILLO.COM 12350 Montwood, Suite 100 El Paso TX 79928 +1 915 859-3017 naielpaso.com 1200 Summit Avenue, Suite 800 Fort Worth, TX, 76102 +1 817 885-8333 robertlynn.com Paso El Paso,
Spotlight on the U.S. Market. Kentucky
 Market Analysis By AmCham s Research Department Spotlight on the U.S. Market Kentucky With a strong manufacturing base, Kentucky has achieved sustained economic growth in excess of 5% and offers many export
Business Growth (as of mid 2002)
") Page 1 of 6 Planning FHWA > HEP > Planning > Econ Dev < Previous Contents Next > Business Growth (as of mid 2002) Data from two business directories was used to analyze the change in the number of businesses
Page 1 of 6 Planning FHWA > HEP > Planning > Econ Dev < Previous Contents Next > Business Growth (as of mid 2002) Data from two business directories was used to analyze the change in the number of businesses
Regional Economic Report April June 2012
 Regional Economic Report April June 2012 September 13, 2012 Outline I. Introduction II. Results April - June 2012 A. Economic Activity B. Inflation C. Economic Outlook III. Final Considerations Introduction
The Maquiladora Industry in Mexico
 The Maquiladora Industry in Mexico April 2016 1 IMMEX in Numbers Maquiladora Companies 6,109 empresas registradas. 82% in manufacturing. 18% in non manufacturing: fishing, agriculture, commerce and services.
Benchmarking Travel & Tourism in Russia
 Benchmarking Travel & Tourism in Russia How does Travel & Tourism compare to other sectors? Sponsored by: Summary of Findings, November 2013 Outline Introduction... 3 Russia summary..... 8 Data sources
The Economic Impact of Tourism in Hillsborough County. July 2017
 The Economic Impact of Tourism in Hillsborough County July 2017 Table of contents 1) Key Findings for 2016 3 2) Local Tourism Trends 7 3) Trends in Visits and Spending 12 4) The Domestic Market 19 5) The
Regional Economic Report
 Regional Economic Report October December 2015 March 31, 2016 Outline I. Regional Economic Report II. Results October December 2015 A. Economic Activity B. Inflation C. Economic Outlook III. Final Remarks
THE 2006 ECONOMIC IMPACT OF TRAVEL & TOURISM IN INDIANA
 THE 2006 ECONOMIC IMPACT OF TRAVEL & TOURISM IN INDIANA A Comprehensive Analysis Prepared by: In Partnership with: PREPARED FOR: Carrie Lambert Marketing Director Indiana Office of Tourism Development
Economic Impact of Tourism in South Dakota, December 2018
 Economic Impact of Tourism in South Dakota, 2018 December 2018 1) Key Findings Growth rebounds in 2018 as a strong hunting season drives tourism growth Key facts about South Dakota s tourism sector Key
North Carolina (Statewide) 2016 Prosperity Zone Data Books
 2016 Prosperity Zone Data Books") North Carolina (Statewide) 2016 Prosperity Zone Data Books 2 North Carolina Prosperity Zones Western North Carolina Prosperity Zones Northwest Region Piedmont-Triad Region Western Region Southwest Region
North Carolina (Statewide) 2016 Prosperity Zone Data Books 2 North Carolina Prosperity Zones Western North Carolina Prosperity Zones Northwest Region Piedmont-Triad Region Western Region Southwest Region
The Economic Impact of Tourism in Hillsborough County, June 2018
 The Economic Impact of Tourism in Hillsborough County, 2017 June 2018 Table of contents 1) Key Findings for 2017 3 2) Local Tourism Trends 7 3) Trends in Visits and Spending 12 4) The Domestic Market 19
ECONOMIC PROFILE PARK CITY & SUMMIT COUNTY, UTAH
 ECONOMIC PROFILE PARK CITY & SUMMIT COUNTY, UTAH Prepared by the Park City Chamber of Commerce & Visitors Bureau PO Box 1630, Park City, UT 84060 1.800.453.1360 Economic Profile Packet Sections 1. Introduction
The Economic Impact of Tourism on Galveston Island, Texas
 The Economic Impact of Tourism on Galveston Island, Texas 2017 Analysis Prepared for: Headline Results Headline results Tourism is an integral part of the Galveston Island economy and continues to be a
Industrial Market Report
 Industrial Report Northeast Mexico 1Q 2016 Tamaulipas, Nuevo León, Coahuila, Chihuahua Americas Research Northeast Mexico Industrial Overview JLL s Industrial Services is a dedicated team focused 100%
Mexico. How does Travel & Tourism compare to other sectors? GDP. Size. Share. Mexico GDP Impact by Industry. Mexico GDP Impact by Industry
 Mexico Chapultepec Castle in Mexico City Agriculture Automotive Manufacturing Banking Chemicals Manufacturing Communications Education Financial Services Mining Other Service Exports Retail (without wholesale)
Do Scenic Amenities Foster Economic Growth in Rural Areas?
 Do Scenic Amenities Foster Economic Growth in Rural Areas? By Jason Henderson and Kendall McDaniel Rural areas in the Tenth District are experiencing a period of renewed economic growth in the 199s. After
Figure 1.1 St. John s Location. 2.0 Overview/Structure
 St. John s Region 1.0 Introduction Newfoundland and Labrador s most dominant service centre, St. John s (population = 100,645) is also the province s capital and largest community (Government of Newfoundland
ESTIMATION OF ECONOMIC IMPACTS FOR AIRPORTS IN HAWTHORNE, EUREKA, AND ELY, NEVADA
 TECHNICAL REPORT UCED 97/98-14 ESTIMATION OF ECONOMIC IMPACTS FOR AIRPORTS IN HAWTHORNE, EUREKA, AND ELY, NEVADA UNIVERSITY OF NEVADA, RENO ESTIMATION OF ECONOMIC IMPACTS FOR AIRPORTS IN HAWTHORNE, EUREKA
The Economic Impact of Tourism in North Carolina. Tourism Satellite Account Calendar Year 2015
 The Economic Impact of Tourism in North Carolina Tourism Satellite Account Calendar Year 2015 Key results 2 Total tourism demand tallied $28.3 billion in 2015, expanding 3.6%. This marks another new high
Wyoming Travel Impacts
 Wyoming Travel Impacts 2000-2013 Wyoming Office of Tourism April 2014 Prepared for the Wyoming Office of Tourism Cheyenne, Wyoming The Economic Impact of Travel on Wyoming 2000-2013 Detailed State and
Benchmarking Travel & Tourism in United Arab Emirates
 Benchmarking Travel & Tourism in United Arab Emirates How does Travel & Tourism compare to other sectors? Summary of Findings, November 2013 Sponsored by: Outline Introduction... 3 UAE summary...... 8
The Economic Contributions of Agritourism in New Jersey
 The Economic Contributions of Agritourism in New Jersey Bulletin E333 Cooperative Extension Brian J. Schilling, Extension Specialist in Agricultural Policy Kevin P. Sullivan, Institutional Research Analyst
Appendix 3 REMPLAN Economic Impact Modelling: New Energy Port Hedland Waste to Energy Project
 Public Environmental Review Boodarie Waste to Energy and Materials Recovery, Port Hedland Appendix 3 REMPLAN Economic Impact Modelling: New Energy Port Hedland Waste to Energy Project NEW ENERGY PORT HEDLAND
Alianza del Pacífico. October, Germán Ríos May 2012
 Alianza del Pacífico October, 2011 Germán Ríos May 2012 Table of Contents The integration process in Latin America The future is Asia Latin America and Alianza del Pacífico The integration process in Latin
ECONOMIC IMPACT STUDY OF CALIFORNIA AIRPORTS
 ECONOMIC IMPACT STUDY OF CALIFORNIA AIRPORTS MARCH 1, 2013 Prepared for California Airports Council Prepared by Applied Development Economics 100 Pringle Avenue, Suite 560 Walnut Creek, California 94596
Wyoming Travel Impacts
 Wyoming Travel Impacts 2000-2014 Wyoming Office of Tourism April 2015 Prepared for the Wyoming Office of Tourism Cheyenne, Wyoming The Economic Impact of Travel on Wyoming 2000-2014 Detailed State and
United Kingdom. How does Travel & Tourism compare to other sectors? GDP. Size. Share. UK GDP Impact by Industry. UK GDP Impact by Industry
 United Kingdom Stonehenge in Wiltshire Agriculture Automotive Banking Chemicals Communications Education Financial Mining Other Service Manufacturing Manufacturing Services Exports Retail (without wholesale)
The Economic Impact of Travel in Kansas. Tourism Satellite Account Calendar Year 2013
 The Economic Impact of Travel in Kansas Tourism Satellite Account Calendar Year 2013 Who we are Tourism Economics Union of industry expertise and economic disciplines Real world insights based on quantitative
Richard V. Butler, Ph.D. and Mary E. Stefl, Ph.D., Trinity University HIGHLIGHTS
 This study was prepared by Richard V. Butler, Ph.D. and Mary E. Stefl, Ph.D., Trinity University HIGHLIGHTS In 2017, the economic impact of San Antonio s Hospitality Industry was $15.2 billion. The San
The Economic Impact of Tourism in Maryland. Tourism Satellite Account Calendar Year 2016
 The Economic Impact of Tourism in Maryland Tourism Satellite Account Calendar Year 2016 County Results Washington County, Visitors Washington County Visitors (thousands) Year Overnight Day Total Growth
Tourist Traffic in the City of Rijeka For the Period Between 2004 and 2014
 Tourist Traffic in the City of Rijeka For the Period Between 2004 and 2014 Rijeka, February 2015. Table of Contents Pg No. 1. Introduction 3 2. Physical indicators on an annual level 4 2.1. Structure and
The Economic Impact of Tourism in The Appalachian Region of Ohio. June 2014
 The Economic Impact of Tourism in The Appalachian Region of Ohio June 2014 Appalachia Region Tourism Summary Total Tourism Impact Appalachian Region Sales Wages Taxes Employment $4.9 billion $1.2 billion
The Economic Impact of Tourism in The Appalachian Region of Ohio. June 2016
 The Economic Impact of Tourism in The Appalachian Region of Ohio June 2016 Appalachian Region tourism summary Total Tourism Impact Appalachian Region, Ohio Sales Wages Taxes Employment $5.3 billion $1.3
CRUISE ACTIVITY IN BARCELONA. Impact on the Catalan economy and socioeconomic profile of cruise passengers (2014)
") CRUISE ACTIVITY IN BARCELONA Impact on the Catalan economy and socioeconomic profile of cruise passengers (2014) 2 CRUISE ACTIVITY IN BARCELONA 2014 Impact on the Catalan economy and socioeconomic profile
CRUISE ACTIVITY IN BARCELONA Impact on the Catalan economy and socioeconomic profile of cruise passengers (2014) 2 CRUISE ACTIVITY IN BARCELONA 2014 Impact on the Catalan economy and socioeconomic profile
East West Rail Consortium
 East West Rail Consortium EWR Wider Economic Case: Refresh 18 th November 2015 Rupert Dyer Rail Expertise Ltd Rail Expertise Ltd. Tel: 01543 493533 Email: info@railexpertise.co.uk 1 Introduction 1.1 The
Benchmarking Travel & Tourism in Colombia
 Benchmarking Travel & Tourism in Colombia How does Travel & Tourism compare to other sectors? Summary of Findings, November 2013 Sponsored by: Outline Introduction... 3 Colombia summary..... 8 Data sources
Price: $5,250,000 ($23.38 PSF) NOI: $475,109 CAP: 9.05%
 NOI: $475,109 CAP: 9.05%") Bridgestone Distribution Center +2 3974 I-55 Frontage Rd Jackson, MS 39209 Price: $5,250,000 ($23.38 PSF) NOI: $475,109 CAP: 9.05% Phone:212.686.0072 Fax: 212.686.0078 rob@exp1031.com www.exp1031.com Industrial
Bridgestone Distribution Center +2 3974 I-55 Frontage Rd Jackson, MS 39209 Price: $5,250,000 ($23.38 PSF) NOI: $475,109 CAP: 9.05% Phone:212.686.0072 Fax: 212.686.0078 rob@exp1031.com www.exp1031.com Industrial
Benchmarking Travel & Tourism in Australia
 Benchmarking Travel & Tourism in Australia How does Travel & Tourism compare to other sectors? Sponsored by: Summary of Findings, November 2013 Outline Introduction... 3 Australia summary..... 8 Data sources
The Economic Impact of Tourism on Galveston Island, Texas Analysis
 The Economic Impact of Tourism on Galveston Island, Texas 2012 Analysis Headline Results Headline results Tourism is a significant contributor to business sales, employment, and taxes on Galveston Island.
SLOW GROWTH OF SOUTHERN NEVADA ECONOMY
 NEVADA S ECONOMY A monthly report produced for Commerce Real Estate Solutions by Stephen P. A. Brown, PhD, Center for Business & Economic Research, University of Nevada, Las Vegas To receive an electronic
PREMIER PLAZA PHASE 1
 LEASING INFORMATION JEFFREY E. SMITH 956 221 0461 PREMIER PLAZA PHASE 1 LUXURY SHOPPING CENTER 25,000 SQ FT MCALLEN, TEXAS INTERSTATE HIGHWAY MCALLEN 69 MCALLEN INTERNATIONAL AIRPORT INTERSTATE HIGHWAY
2009 Muskoka Airport Economic Impact Study
 2009 Muskoka Airport Economic Impact Study November 4, 2009 Prepared by The District of Muskoka Planning and Economic Development Department BACKGROUND The Muskoka Airport is situated at the north end
S e c u r i t y, a n d W h y I t M a t t e r s. San Diego Regional Economic Development Corporation Board Meeting March 13, 2013
 B a j a C a l i f o r n i a s E c o n o m y, S e c u r i t y, a n d W h y I t M a t t e r s San Diego Regional Economic Development Corporation Board Meeting March 13, 2013 Some (Possibly) Surprising Manufacturing
Overview of the Southern Nevada Convention and Meeting Segment
 Executive Summary Applied Analysis was retained by the Las Vegas Convention and Visitors Authority (the LVCVA ) to review and analyze the economic impacts associated with its various operations and southern
Doing business. in Nuevo Leon
 Doing business in Nuevo Leon WHERE IS NUEVO LEON? CANADA USA MEXICO NUEVO LEON Capital city: Monterrey Subdivisions: 51 municipalities Surface: 64,156 km ECONOMIC OVERVIEW THE HIGHEST GDP PER CAPITA IN
The Economic Impact of Tourism in North Carolina. Tourism Satellite Account Calendar Year 2013
 The Economic Impact of Tourism in North Carolina Tourism Satellite Account Calendar Year 2013 Key results 2 Total tourism demand tallied $26 billion in 2013, expanding 3.9%. This marks another new high
Vera Zelenović. University of Novi Sad, Novi Sad, Serbia. Dragan Lukač. Regional Chamber of Commerce Novi Sad, Novi Sad, Serbia
 Journal of US-China Public Administration, April 2015, Vol. 12, No. 4, 314-324 doi: 10.17265/1548-6591/2015.04.007 D DAVID PUBLISHING The Effectiveness of SMEs Business Sector in AP Vojvodina Vera Zelenović
Land area 1.73 million km 2 Queensland population (as at 31 December 2017) Brisbane population* (preliminary estimate as at 30 June 2017)
 Brisbane population* (preliminary estimate as at 30 June 2017)") Queensland - 11 Queensland OVERVIEW Queensland is nearly five times the size of Japan, seven times the size of Great Britain, and two and a half times the size of Texas. Queensland is Australia s second
Queensland - 11 Queensland OVERVIEW Queensland is nearly five times the size of Japan, seven times the size of Great Britain, and two and a half times the size of Texas. Queensland is Australia s second
Logan Airport in the Boston Regional Economy: A REMI Analysis
 Logan Airport in the Boston Regional Economy: A REMI Analysis Logan Airport Team Final Presentation 11.482J Regional Socioeconomic Impact Analyses and Modeling Professor: Karen R. Polenske Michael Brown,
Provincial Review 2016: KwaZulu-Natal KwaZulu-Natal
 Provincial Review 2016: KwaZulu-Natal KwaZulu-Natal KwaZulu-Natal has a strong role in South Africa s manufacturing and agriculture, and has its largest port and main North-South freight corridor. Its
(More) Reasons Why Texas Needs the Hyperloop
 Reasons Why Texas Needs the Hyperloop") (More) Reasons Why Texas Needs the Hyperloop Federico Schaffler, PhD Director Texas Center for Border Economic and Enterprise Development. Texas A&M International University, Laredo, Texas. wfschaffler@tamiu.edu
(More) Reasons Why Texas Needs the Hyperloop Federico Schaffler, PhD Director Texas Center for Border Economic and Enterprise Development. Texas A&M International University, Laredo, Texas. wfschaffler@tamiu.edu
Kern County: Last Redoubt of the California Dream?
 Kern County: Last Redoubt of the California Dream? Speech to Kern County EDC Economic Summit Bakersfield, CA March 15, 2017 By Joel Kotkin, Presidential Fellow in Urban Futures, Chapman University and
Air Routes as Economic Development Levers. John D. Kasarda, PhD
 Routes News October 2008 Air Routes as Economic Development Levers John D. Kasarda, PhD In his influential recent book, The World Is Flat, Thomas Friedman makes it clear that an increasingly fast-paced,
Australian Cities Accounts Estimates. December 2011
 Australian Cities Accounts 2010-11 Estimates December 2011 This report has been prepared by: SGS Economics and Planning Pty Ltd ACN 007 437 729 Level 5 171 Latrobe Street MELBOURNE VIC 3000 P: + 61 3 8616
Queensland Economic Update
 Queensland Economic Update Chamber of Commerce & Industry March 2018 cciq.com.au Queensland Economic Update: Summary National Accounts GDP expanded 2.3% during calendar year 2017. QLD state final demand
COLUMBUS REGIONAL AIRPORT AUTHORITY. Economic Impact Study Update. Technical Report
 COLUMBUS REGIONAL AIRPORT AUTHORITY Economic Impact Study Update Technical Report November 2012 COLUMBUS REGIONAL AIRPORT AUTHORITY ECONOMIC IMPACT STUDY UPDATE November 2012 Prepared for: Prepared by:
Economic Impact Analysis. Tourism on Tasmania s King Island
 Economic Impact Analysis Tourism on Tasmania s King Island i Economic Impact Analysis Tourism on Tasmania s King Island This project has been conducted by REMPLAN Project Team Matthew Nichol Principal
The Economic Impact of Tourism in Buncombe County, North Carolina
 The Economic Impact of Tourism in Buncombe County, North Carolina 2017 Analysis September 2018 Introduction and definitions This study measures the economic impact of tourism in Buncombe County, North
The Travel and Tourism Industry in Vermont. A Benchmark Study of the Economic Impact of Visitor Expenditures on the Vermont Economy 2005
 The Travel and Tourism Industry in Vermont A Benchmark Study of the Economic Impact of Visitor Expenditures on the Vermont Economy 2005 INTRODUCTION GENERAL November, 2006 This 2005 update of the original
Manawatu District Economic Profile
 Manawatu District Economic Profile Our community Population has grown by 1,000 residents since 2014 to reach 29,800. Population is 86.4% European, with Maori 14.3% of the population. This compares with
International economic context and regional impact
 Contents I. GDP growth trends in Latin America and the Caribbean in 2012 II. Regional performance in 2012: Inflation, employment and wages External sector Policies: Fiscal and Monetary III. Conclusions
Inverness, Culloden and Suburbs Settlement Economic Overview
 Strategic planning and research Economic information December 2007 Inverness, Culloden and Suburbs Settlement Economic Overview Summary Between 2001 and 2006, the population of Inverness, Culloden and
Press Release. Bilfinger 2017: Stable foundation laid for the future
 Press Release February 14, 2018 Bilfinger 2017: Stable foundation laid for the future Organic growth in orders received after three years of decline Trend reversal: Output volume better than expected Growth
The performance of Scotland s high growth companies
 The performance of Scotland s high growth companies Viktoria Bachtler Fraser of Allander Institute Abstract The process of establishing and growing a strong business base is an important hallmark of any
NatWest UK Regional PMI
 NatWest UK Regional PMI Embargoed until 0101 UK (0101 UTC) 14 January 2019 East Midlands is top performing region in 2018 despite strong finish from the North West Key Findings 2018 ends with North West
AIRPORT: Seattle-Tacoma International (SEA) ASSOCIATED CITY: Seattle ARC: D-V Region: Central Puget Sound
 ASSOCIATED CITY: Seattle ARC: D-V Region: Central Puget Sound") AIRPORT: Seattle-Tacoma International (SEA) ASSOCIATED CITY: Seattle ARC: D-V Region: Central Puget Sound AIRPORT DATA AND FACILITIES (Sea-Tac) is located in King County, 10 miles south of downtown Seattle,
AIRPORT: Seattle-Tacoma International (SEA) ASSOCIATED CITY: Seattle ARC: D-V Region: Central Puget Sound AIRPORT DATA AND FACILITIES (Sea-Tac) is located in King County, 10 miles south of downtown Seattle,
Gold Coast: Modelled Future PIA Queensland Awards for Planning Excellence 2014 Nomination under Cutting Edge Research category
 Gold Coast: Modelled Future PIA Queensland Awards for Planning Excellence 2014 Nomination under Cutting Edge Research category Jointly nominated by SGS Economics and Planning and City of Gold Coast August
County of Dufferin Economic Development Strategy and Action Plan
 County of Dufferin Economic Development Strategy and Action Plan Strategic Plan Background Report Information for Those Involved in Stakeholder Consultations About the Dufferin County Economic Development
Subject Property Schuster St Las Vegas, NV SW Las Vegas Ind. LOCATION Distance to Seaport:
 Subject Property 6615 Schuster St Las Vegas, NV 89118 - SW Las Vegas Ind LOCATION Distance to Airport: 6.2 mi Distance to Seaport: 232.5 mi Distance to Rail Terminal: 6.7 mi Population 500 Mile Radius:
The Economic Impact of Tourism in Maryland. Tourism Satellite Account Calendar Year 2015
 The Economic Impact of Tourism in Maryland Tourism Satellite Account Calendar Year 2015 MD tourism economy reaches new peaks The Maryland visitor economy continued to grow in 2015; tourism industry sales
AFTA s 2017 Foreign Policy White Paper Submission
 AFTA s 2017 Foreign Policy White Paper Submission Page 1 of 10 About AFTA Ltd (AFTA) was founded in 1957 to: establish professional standards for travel agents; stimulate and promote travel; bring together
The Economic Impact of Tourism on Guam. Tourism Satellite Account Calendar Year 2016
 The Economic Impact of Tourism on Guam Tourism Satellite Account Calendar Year 2016 Highlights! 2016 was a banner year for tourism on Guam, with visitation to Guam surpassing 1.5 million and visitor spending
A COMPARISON OF THE MILWAUKEE METROPOLITAN AREA TO ITS PEERS
 KRY/WJS/EDL #222377 (PDF: #223479) 1/30/15 PRELIMINARY DRAFT Memorandum Report A COMPARISON OF THE MILWAUKEE METROPOLITAN AREA TO ITS PEERS EXECUTIVE SUMMARY This memorandum report provides a statistical
Contribution from UNCTAD dated: 4 June 2012
 Report of the UN Secretary-General: Necessity of ending the economic, commercial and financial embargo imposed by the United States of America against Cuba (A/67/118) Contribution from UNCTAD dated: 4
SHIP MANAGEMENT SURVEY* July December 2015
 SHIP MANAGEMENT SURVEY* July December 2015 1. SHIP MANAGEMENT REVENUES FROM NON- RESIDENTS Ship management revenues dropped marginally to 462 million, following a decline in global shipping markets. Germany
Impacts of Visitor Spending on the Local Economy: George Washington Birthplace National Monument, 2004
 Impacts of Visitor Spending on the Local Economy: George Washington Birthplace National Monument, 2004 Daniel J. Stynes Department of Community, Agriculture, Recreation and Resource Studies Michigan State
Tourism Satellite Account Calendar Year 2010
 The Economic Impact of Tourism in Georgia Tourism Satellite Account Calendar Year 2010 Highlights The Georgia visitor economy rebounded in 2010, recovering 98% of the losses experienced during the recession
Distinguished guests, parliamentary colleagues, ladies and gentlemen.
 Developing the Territory Keynote 16/06/14 Developing the Top End from the last frontier to the next frontier. Chief Minister Distinguished guests, parliamentary colleagues, ladies and gentlemen. The frontier