YoY growth in both revenue and profit
|
|
|
- Warren Todd
- 6 years ago
- Views:
Transcription


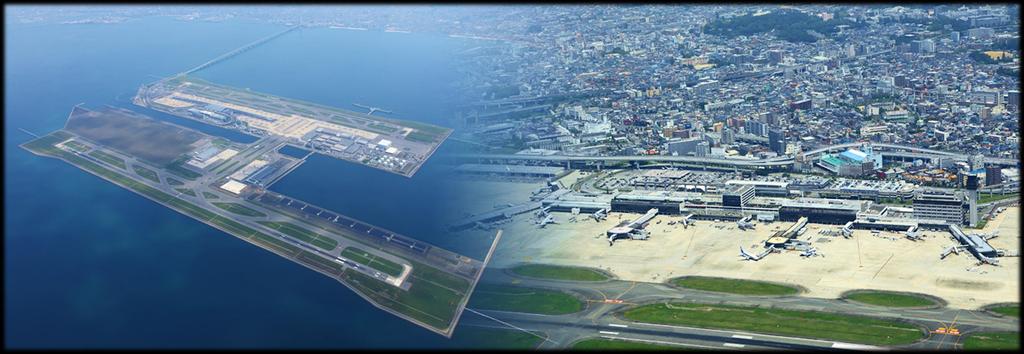
1 PRESS RELEASE December 6, 2017 Mid-year Consolidated Financial Results as of Sept. 30 th 2017: YoY growth in both revenue and profit Kansai Airports today announced its financial results for the 6 months ended September 30, 2017, posting operating revenue of 99.3 billion yen, operating income of 27.2 billion yen, ordinary income of 21.5 billion yen and net profit* of 14.8 billion yen, due partly to strong aviation demand which continued from the previous term. Operating income was up 11%, ordinary income up 35%, and net profit up 61% from the same period of the 1st term, or the 6 months starting on April 1, 2016 when Kansai Airports started operation of the airports. Kansai Airports CEO Yoshiyuki Yamaya and Co-CEO Emmanuel Menanteau delivered a statement: We are delighted to continue to report revenue and profit growth in the first half of fiscal 2017 compared to the same period of the previous year as we served more customers in a favorable business environment. Amid expectations of growing air travel demand, we will strive to offer a wonderful experience and service to all of our customers. Consolidated Profit & Loss Statement (Billions of yen except percentage change) 1st Term 2 Apr. to Sept rd Term Apr. to Sept Increase (decrease) Change (%) Operating Revenues % Operating Expenses % EBITDA % Depreciation & Amortization (0.1) 0% Operating Income % Ordinary Income % Net Profit % 1 Net Profit represents Net Profit Attributable to Parent Company Shareholders." 2 The figures exclude those recorded between December 2015 and March 2016, a part of 1 st Term.
2 Air Travel Demand As a result of the increase in the number of international passenger flights to Asian destinations such as South Korea, Hong Kong and Macau, Kansai Airports achieved a record aircraft movements at KIX in the first half of fiscal 2017 (April to September 2017). The number of aircraft movements combined at both KIX and ITAMI totaled 163,000, marking a record high for the first half of a fiscal year. Passenger traffic at KIX continued to increase from the previous year and hit an all-time high of million in the first half, with the number of international flight passengers reaching million which exceeded 10 million for the first time in the first half of a fiscal year. ITAMI also saw growth in passenger traffic over the previous year partly due to the use of larger sized aircraft. The total number of passengers combined at both KIX and ITAMI was million. Apr to Sept Apr to Sept Increase (Decrease) Change (%) ATM (thousand movements) % KIX % ITAMI % PAX (million persons) % KIX % ITAMI % Consolidated Balance Sheet As of September 30, 2017, total assets decreased by billion yen to 1,745.0 billion yen and total liabilities were 1,673.8 billion yen, a decrease of billion, both from the end of the previous fiscal term, partly due to progress on payments for the Right to Operate Public Facilities and its amortization. (Unit: JPY billion) As of March 31, 2017 As of Sept. 30, 2017 Increase (decrease) Current Assets (107.5) Non-current Assets 1, ,612.3 (24.0) Total Assets 1, ,745.0 (131.5) Current Liabilities (5.9) Non-current Liabilities 1, ,616.1 (130.8) Total Liabilities 1, ,673.8 (136.6) Shareholders' equity Other Comprehensive Income (0.1) Non-controlling Interests Total Net Assets Total Liabilities and Net Assets 1, ,745.0 (131.5) Contact Information for Inquiries Kansai Airports Corporate Communication Dept. TEL:
3 Consolidated Profit and Loss Statement From April 1, 2017 to September 30, 2017 (Unit: Million yen) Operating revenues Operating expenses Gross operating profit Selling, general and administrative expenses Operating income Non-operating income 99,259 61,713 37,545 10,359 27, Interest income and dividends Share of profit of entities accounted for using the equity method Other non-operating income Non-operating expenses 6,368 Interest expense 6,315 Commissions Other non-operating expense 50 3 Ordinary income Special gain 21, Gain on sales of non-current assets 6 Subsidy income 28 Gain on transfer of business 341 Special loss 196 Loss on retirement of non-current assets Loss on sales of non-current assets Loss on reduction of non-current assets Removal cost related to replacement investment Profit before income taxes 21,643 Income taxes-current Income taxes-deferred Profit Profit attributable to non-controlling interests Profit attributable to owners of the parent 7, ,708 14, ,780 Figures under one million yen are rounded down to the nearest million.
4 Consolidated Balance Sheet As of September 30, 2017 (Unit: Million yen) Assets Liabilities Current assets 132,697 Current liabilities 57,724 Cash and deposits Accounts receivable - trade Merchandise inventories Raw materials and supplies Guarantee deposits refundable within one year Deferred tax assets Other Allowance for doubtful accounts 96,276 Accounts payable - trade 3,633 10,238 Accounts payable - other 5,304 4,213 Accrued expenses 2,956 1,134 Current portion of long-term loans payable 3,089 13,175 Current portion of liabilities for the right to operate public facilities 28,955 1,171 Income taxes payable 7,578 6,488 Provision for bonuses 1,024 0 Provision for point card certificates 76 Other 5,105 Non-current assets 1,612,270 Non-current liabilities 1,616,091 Property, plant and equipment Buildings and structures Machinery, equipment and vehicles Land Construction in progress Other 19,428 Bonds payable 4,860 3,812 Long-term loans payable 189,560 7,327 Liabilities for the right to operate public facilities 1,368, Deferred tax liabilities 54 3,407 Provision for special repairs 42,499 4,277 Liability for retirement benefits 3,630 Intangible assets Right to operate public facilities Replacement investment assets 1,460,041 Other 7,024 1,451,150 Total liabilities 1,673,815 7,781 Net assets Other 1,108 Shareholders' equity 70,083 Investments and other assets Investment securities Asset for retirement benefits Guarantee deposits Deferred tax assets Other Allowance for doubtful accounts 132,800 Capital stock 25,000 1,511 Capital surplus 25, Retained earnings 20, ,605 Accumulated other comprehensive income 42 2,471 Valuation difference on availablefor-sale securities Deferred gains or losses on hedge 16 8 Non-controlling interests Total net assets 1,026 71,152 Total assets 1,744,968 Total liabilities and net assets 1,744,968 Figures under one million yen are rounded down to the nearest million.


5 Mid-year Consolidated Financial Results as of September 30 th 2017 Dec. 6, 2017
6 Agenda Highlights Revenues Drivers Investment Plan Overview of Consolidated Results 1
7 Highlights 2
8 Revenue and Profit Growth Operating revenues: JPY 99.3 billion, up 11% or a JPY10.1 billion increase YoY Ordinary income: JPY21.5 billion, up 50% or a JPY7.2 billion increase YoY Net profit: JPY14.8 billion, up 61% or a JPY5.6 billion increase YoY Firm growth of traffic driven by international passengers at KIX Non-aero revenue growth mainly in the directly managed business such as duty-free and retail (JPY billion) 1 2 1st Term Apr Sept rd Term Apr Sept Change % Operating Revenue % EBITDA % Operating Income % Ordinary Income % Net Profit % 1 Net Profit represents Net Profit Attributable to Parent Company Shareholders." 2 The figures exclude those recorded between December 2015 and March 2016, a part of 1 st Term. 3

9 Revenues Drivers 4
10 Aero-Revenues Posted record ATM and passenger traffic at KIX Apr Sept Apr Sept Change % Air traffic movements: +4% YoY Passengers: +10% YoY Passengers on international flights - Over 10 million for the first time in the first 6-month period - Foreign passengers: 7.26 million Recorded passenger traffic growth for the 2nd consecutive year at ITAMI Passengers: +5% YoY ATM (thousand movements) % KIX % ITAMI % Pax (million pax) % KIX % International Pax % Japanese Pax % Foreign Pax % ITAMI % 5


11 Non-aero Revenues Duty-free revenue growth exceeded traffic growth for the 1st half in 2017 Year-on-year sales growth of directly managed duty-free shops 70% 30% 32% 37% 44% Revenue from directly managed shops in KIX 12% 20% 16% 13% 18% 24% KIX International Foreign Pax April May June July August September 6
12 Investment Plan 7


13 Investment Plan Proactively invest 94.6 billion yen over the next 5 years. Major Projects in progress ITAMI Terminal Renovation 1st phase of KIX Terminal 1 renovation, including Fast Travel Replacement of all PBBs in KIX and ITAMI Consolidation of airport operational data(aodb) Investment to ensure safety and security -Enhancement of KIX baggage security screening equipment -Seismic reinforcement of the ceiling 8

14 Overview of Consolidated Results 9
15 Business Performance (JPY billion) 1 st Term 2 Apr. Sept rd Term Apr. - Sept Change % Operating Revenue % Aero % Non-Aero % Operating Expenses % EBITDA % Depreciation & Amortization (0.1) 0% Operating Income % Ordinary Income % Net Profit % 1 Net Profit represents Net Profit Attributable to Parent Company Shareholders." 2 The figures exclude those recorded between December 2015 and March 2016, a part of 1 st Term. 10
16 Growth in both Aero and Non-Aero Revenues 1 st Term* Apr. Sept rd Term Apr. Sept JPY 49.1 billion 55% JPY 40.0 billion 45% JPY 55.9 billion 56% JPY 43.4 billion 44% Aero Non-Aero 航空系 非航空系 Aero: a JPY 3.4 billion increase, mainly driven by growth of the passenger service facility charge due to passenger traffic growth Non-Aero: an JPY 6.8 billion increase, mainly driven by growth of revenue in the directly managed business such as duty-free and retail. Non-aero revenue accounts for 56% of the total revenue. * The figures exclude those recorded between December 2015 and March 2016, a part of 1 st Term. 11
17 Financial Positions ( JPY billion) As of Mar. 31, 2017 As of Sept. 30, 2017 Increase (decrease) Right to Operate Public Facilities. Current Assets (107.5) Non-current Assets 1, ,612.3 (24.0) TOTAL ASSETS 1, ,745.0 (131.5) Current Liabilities (5.9) Debts concerning Right to Operate Public Facilities. Non-current Liabilities 1, ,616.1 (130.8) TOTAL LIABILITIES 1, ,673.8 (136.6) Shareholders' Equity Other Comprehensive Income (0.1) Non-Controlling Interests TOTAL NET ASSETS TOTAL LIABILITIES AND NET ASSETS 1, ,745.0 (131.5) 12
18 Ordinary Income Analysis Comparison of Ordinary Income - Breakdown of the YoY increase (Billions of yen) Apr.-Sept Ordinary Income 1 2 Aero Non-Aero Other Operating Expenses Depreciation & Amortization Non-operating Revenue & Expenses Apr.-Sept Ordinary Income 1:Increase in Aero revenue 2:Increase in Non-Aero revenue (excluding increase in cost of sales) 13
 and commenced business as an operating company for the two airports. Kansai Airports was established by a consortium made up of VINCI Airports and ORIX Corporation as its core members.")
19 As of April 1, 2016, Kansai Airports succeeded the operating rights of Kansai International Airport ( KIX ) and Osaka International Airport ( ITAMI ) from New Kansai International Airport Company ( NKIAC ) and commenced business as an operating company for the two airports. Kansai Airports was established by a consortium made up of VINCI Airports and ORIX Corporation as its core members. Kansai Airports shares the common goal of maximizing the potential of the Kansai International Airport and Osaka International Airport, improving services to passengers and ensuring the highest levels of safety and security, investment to enhance safety, convenience and comfort to increase value, as well as enhancing community relations in the neighborhoods of the airports and benefiting the Kansai regional economy. On December 15, Kansai Airports signed a concession contract with the New Kansai International Airport Company ("NKIAC") for an operating period of 44-years. For more information, please visit: Location Company Representatives 1-banchi, Senshu-kuko kita, Izumisano-shi, Osaka Representative Director and CEO: Yoshiyuki Yamaya Representative Director and Co-CEO: Emmanuel Menanteau Capital Date of Incorporation 25,000 million yen December 1, 2015 Business Scope Operation and management services, etc. of Kansai International Airport and Osaka International Airport Shareholders ORIX 40%, VINCI Airports 40%, Other investors 20% 1 ORIX Corporation (TSE: 8591; NYSE: IX) is an opportunistic, diversified, innovation-driven global powerhouse with a proven track record of profitability. Established in 1964, ORIX at present operates a diverse portfolio of businesses in the operations, financial services, and investment spaces. ORIX s highly complementary business activities span industries including: energy, private equity, infrastructure, automotive, ship and aircraft, real estate and retail financial services. ORIX has also spread its business globally by establishing locations in a total of 37 countries and regions across the world. Through its business activities, ORIX has long been committed to corporate citizenship and environmental sustainability. For more details, please visit our website: VINCI Airports, a top 5 global player in the international airport sector, manages the development and operations of 35 airports: 13 in France, 10 in Portugal (including the hub of Lisbon), 3 in Cambodia, 2 in Japan, 6 in Dominican Republic and Santiago airport in Chile. Served by more than 200 airlines, VINCI Airports network handled 132 million passengers in Through its expertise as a comprehensive integrator and the professionalism of its 11,000 employees, VINCI Airports develops, finances, builds and operates airports, leveraging its investment capability, international network and know-how to optimize the management and performance of existing airport infrastructure, facility extensions and new construction. In 2016, its consolidated revenue amounted to 1.05 bn. More comprehensive information is available on 1 ASICS Corporation; Iwatani Corporation; Osaka Gas Co., Ltd.; Obayashi Corporation; OMRON Corporation; The Kansai Electric Power Company, Incorporated; Kintetsu Group Holding Co., Ltd.; Keihan Holdings Co., Ltd.; Suntory Holdings Limited; JTB Corp.; Sekisui House, Ltd.; Daikin Industries, Ltd.; Daiwa House Industry Co., Ltd.; Takenaka Corporation; Nankai Electric Railway Co., Ltd.; NIPPON TELEGRAPH AND TELEPHONE WEST CORPORATION; Panasonic Corporation; Hankyu Hanshin Holdings, Inc.; Rengo Co., Ltd.; The Senshu Ikeda Bank, Ltd.; Kiyo Holdings, Inc.; The Bank of Kyoto, Ltd.; THE SHIGA BANK,LTD.; The Nanto Bank, Ltd.; Nippon Life Insurance Company; Mizuho Bank, Ltd.; Sumitomo Mitsui Trust Bank, Limited; The Bank of Tokyo-Mitsubishi UFJ Ltd.; Resona Bank, Limited; and the Private Finance Initiative Promotion Corporation of Japan.
YoY growth achieved in both revenue and profit
 PRESS RELEASE June 7, 2018 Consolidated Results for Fiscal Year Ending March 2018: YoY growth achieved in both revenue and profit Kansai Airports today announced its financial results for the fiscal year
Outline of press conference held on Sept. 8
 PRESS RELEASE September 8, 2018 Outline of press conference held on Sept. 8 Outline of press conference held on Sept. 8 Kansai Airports CEO Yoshiyuki Yamaya and Co-CEO Emmanuel Menanteau announced the
ITAMI Art Project to be rolled out throughout terminal
 PRESS RELEASE March 9, 2018 ITAMI Art Project to be rolled out throughout terminal Kansai Airports is pleased to announce that various artworks will be displayed throughout the terminal building at Osaka
Establishment of Kansai Airports Kobe and Signing of Project Agreement for Kobe Airport Concession
 September 26, 2017 ORIX Corporation VINCI Airports S.A.S. Kansai Airports Establishment of Kansai Airports Kobe and Signing of Project Agreement for Kobe Airport Concession The consortium made up of ORIX
ITAMI transformation: pre-opening after renovations! New shops and restaurants unveiled!
 PRESS RELEASE January 30, 2018 ITAMI transformation: pre-opening after renovations! New shops and restaurants unveiled! Kansai Airports is pleased to announce the pre-opening of the central and rooftop
Summary of Results for the First Quarter of FY2015/3
 Summary of for the First Quarter of FY2015/3 August 8, 2014 Tokyu Corporation (9005) http://www.tokyu.co.jp/ Contents Ⅰ.Executive Summary 2 Ⅱ.Conditions in Each Business 4 Ⅲ.Details of Financial for the
Summary o f Results for the First Half of FY2018
 Summary o f Results for the First Half of FY2018 November 9, 2018 (9005) https://www.tokyu.co.jp/ Contents Ⅰ.Executive Summary 2 Ⅱ.Conditions in Each Business 6 Ⅲ.Details of Financial Results for the 13
Summary of Results for the First Three Quarters FY2015/3
 Summary of Results for the First Three Quarters FY2015/3 February 10, 2015 Tokyu Corporation (9005) http://www.tokyu.co.jp/ Contents Ⅰ.Executive Summary 2 Ⅱ.Conditions in Each Business 5 Ⅲ.Details of Financial
OPERATING AND FINANCIAL HIGHLIGHTS
 Copa Holdings Reports Net Income of US$32.0 Million and EPS of US$0.72 for the Second Quarter of 2012 Excluding special items, adjusted net income came in at $58.6 million, or EPS of $1.32 per share Panama
FIRST QUARTER RESULTS 2017
 FIRST QUARTER RESULTS 2017 KEY RESULTS In the 1Q17 Interjet total revenues added $4,421.5 million pesos that represented an increase of 14.8% over the income generated in the 1Q16. In the 1Q17, operating
OPERATING AND FINANCIAL HIGHLIGHTS. Subsequent Events
 Copa Holdings Reports Net Income of US$113.1 Million and EPS of US$2.57 for the First Quarter of 2015 Excluding special items, adjusted net income came in at US$106.0 million, or EPS of US$2.41 per share
OPERATING AND FINANCIAL HIGHLIGHTS
 Copa Holdings Reports Net Income of US$18.6 Million and EPS of US$0.42 for the Second Quarter of 2010 Excluding special items, adjusted net income came in at $26.3 million, or $0.60 per share Panama City,
THIRD QUARTER AND NINE MONTHS OF 2014 KEY RESULTS
 THIRD QUARTER AND NINE MONTHS OF 2014 KEY RESULTS In 3Q14 INTERJET total revenues were $ 3,643.4 million, representing an increase of 9.9% on revenues generated in the 3Q13. Accumulated 9M14 INTERJET total
OPERATING AND FINANCIAL HIGHLIGHTS
 Copa Holdings Reports Financial Results for the Fourth Quarter of 2015 Excluding special items, adjusted net income came in at $31.7 million, or EPS of $0.73 per share Panama City, Panama --- February
HOTEL UNIVERSAL PORT VITA Scheduled to Open in Summer 2018 Seventh Official Hotel of Universal Studios Japan
 HOTEL UNIVERSAL PORT VITA Scheduled to Open in Summer 2018 Seventh Official Hotel of Universal Studios Japan TOKYO, Japan November 29, 2017 ORIX Real Estate Corporation ( ORIX Real Estate ), a subsidiary
ANA HOLDINGS Financial Results for the Three Months Ended June 30, 2018
 ANA HOLDINGS NEWS ANA HOLDINGS Financial Results for the Three Months Ended June 30, 2018 TOKYO, July 31, 2018 ANA HOLDINGS INC. (hereinafter ANA HD ) today reports its financial results for the three
ANA HOLDINGS Financial Results for the Three Months ended June 30, 2015
 ANA HOLDINGS NEWS ANA HOLDINGS Financial Results for the Three Months ended June 30, 2015 TOKYO, July 29, 2015 ANA HOLDINGS (hereinafter ANA HD ) today reports its financial results for the three months
Copa Holdings Reports Net Income of $49.9 million and EPS of $1.18 for the Second Quarter of 2018
 Copa Holdings Reports Net Income of $49.9 million and EPS of $1.18 for the Second Quarter of 2018 Panama City, Panama --- Aug 8, 2018. Copa Holdings, S.A. (NYSE: CPA), today announced financial results
JAPAN OUTLOOK. 1- KANSAI deal 2-KOBE deal 4- Future projects
 JAPAN OUTLOOK 1- KANSAI deal 2-KOBE deal 4- Future projects 1. THE KANSAI DEAL Kansai Deal at a Glance Assets & Transactions Key Features Kansai Airports International - KIX Opening in 1994 and located
OPERATING AND FINANCIAL HIGHLIGHTS SUBSEQUENT EVENTS
 Copa Holdings Reports Financial Results for the Third Quarter of 2016 Excluding special items, adjusted net income came in at $55.3 million, or adjusted EPS of $1.30 per share Panama City, Panama --- November
OPERATING AND FINANCIAL HIGHLIGHTS SUBSEQUENT EVENTS
 Copa Holdings Reports Net Income of US$6.2 Million and EPS of US$0.14 for the Third Quarter of 2015 Excluding special items, adjusted net income came in at $37.4 million, or EPS of $0.85 per share Panama
THIRD QUARTER RESULTS 2018
 THIRD QUARTER RESULTS 2018 KEY RESULTS In the 3Q18 Interjet total revenues added $ 6,244.8 million pesos that represented an increase of 7.0% over the revenue generated in the 3Q17. In the 3Q18, operating
Melco International Development Limited (Incorporated in Hong Kong with limited liability) Website : (Stock Code : 200)
 Website : (Stock Code : 200)") Hong Kong Exchanges and Clearing Limited and The Stock Exchange of Hong Kong Limited take no responsibility for the contents of this announcement, make no representation as to its accuracy or completeness
Hong Kong Exchanges and Clearing Limited and The Stock Exchange of Hong Kong Limited take no responsibility for the contents of this announcement, make no representation as to its accuracy or completeness
THIRD QUARTER RESULTS 2017
 THIRD QUARTER RESULTS 2017 KEY RESULTS In the 3Q17 Interjet total revenues added $5,835.1 million pesos that represented an increase of 22.0% over the revenue generated in the 3Q16. In the 3Q17, operating
Melco International Development Limited (Incorporated in Hong Kong with limited liability) Website : (Stock Code : 200)
 Website : (Stock Code : 200)") Hong Kong Exchanges and Clearing Limited and The Stock Exchange of Hong Kong Limited take no responsibility for the contents of this announcement, make no representation as to its accuracy or completeness
Hong Kong Exchanges and Clearing Limited and The Stock Exchange of Hong Kong Limited take no responsibility for the contents of this announcement, make no representation as to its accuracy or completeness
OPERATING AND FINANCIAL HIGHLIGHTS
 Copa Holdings Reports Financial Results for the Fourth Quarter of 2018 Excluding special items, adjusted net profit came in at $44.0 million, or Adjusted EPS of $1.04 Panama City, Panama --- February 13,
Consolidated Financial Results for the Three Months Ended June 30, 2017 (Japanese GAAP)
") [REFERENCE TRANSLATION] Please note that this translation is to be used solely as reference and the financial statements in this material are unaudited. In case of any discrepancy between this translation
[REFERENCE TRANSLATION] Please note that this translation is to be used solely as reference and the financial statements in this material are unaudited. In case of any discrepancy between this translation
Copa Holdings Reports Net Income of $136.5 million and EPS of $3.22 for the First Quarter of 2018
 Copa Holdings Reports Net Income of $136.5 million and EPS of $3.22 for the First Quarter of 2018 May 9, 2018 PANAMA CITY, May 9, 2018 /PRNewswire/ -- Copa Holdings, S.A. (NYSE: CPA), today announced financial
Copa Holdings Reports Net Income of $57.7 million and EPS of $1.36 for the Third Quarter of 2018
 Copa Holdings Reports Net Income of $57.7 million and EPS of $1.36 for the Third Quarter of 2018 November 14, 2018 PANAMA CITY, Nov. 14, 2018 /PRNewswire/ -- Copa Holdings, S.A. (NYSE: CPA), today announced
OPERATING AND FINANCIAL HIGHLIGHTS. Subsequent Events
 Copa Holdings Reports Financial Results for the First Quarter of 2016 Excluding special items, adjusted net income came in at US$69.9 million, or EPS of US$1.66 per share Panama City, Panama --- May 5,
FOURTH QUARTER RESULTS 2017
 FOURTH QUARTER RESULTS 2017 KEY RESULTS In the 4Q17 Interjet total revenues added $5,824.8 million pesos that represented an increase of 10.8% over the revenue generated in the 4Q16. In the 4Q17, operating
FIRST QUARTER RESULTS 2016
 FIRST QUARTER RESULTS 2016 KEY RESULTS In 1Q16 Interjet total revenues added $3,850.8 million pesos that represented an increase of 21.9% over the income generated in the 1Q15. In 1Q16 total passengers
Interim Business Report 2017
 April 1, 2017 through September 30, 2017 November 22, 2017 Contents SECTION 1 01 Consolidated Statement of Income 02 Factors Leading to Difference in Consolidated Ordinary Income Compared With Same Period
Thank you for participating in the financial results for fiscal 2014.
 Thank you for participating in the financial results for fiscal 2014. ANA HOLDINGS strongly believes that safety is the most important principle of our air transportation business. The expansion of slots
Copa Holdings Reports Record Earnings of US$41.8 Million for 4Q06 and US$134.2 Million for Full Year 2006
 Copa Holdings Reports Record Earnings of US$41.8 Million for 4Q06 and US$134.2 Million for Full Year 2006 Panama City, Panama --- March 7, 2007. Copa Holdings, S.A. (NYSE: CPA), parent company of Copa
Q Earnings Financial Results for the Third Quarter Ended December 31, January 29, 2015 OMRON Corporation
 Q3 2014 Earnings Financial Results for the Third Quarter Ended December 31, 2014 January 29, 2015 OMRON Corporation Contents 1. Summary 2. Q1-Q3 Results P. 2 P. 4 3. Full-Year Forecast P. 13 4. Corporate
ANA HOLDINGS Financial Results for the Six Months Ended September 30, 2018
 ANA HOLDINGS NEWS ANA HOLDINGS Financial Results for the Six Months Ended September 30, 2018 TOKYO, Nov. 2, 2018 ANA HOLDINGS INC. (hereinafter ANA HD ) today reports its financial results for the six
Consolidated Financial Results for the Six Months Ended September 30, 2017 (Japanese GAAP)
") [REFERENCE TRANSLATION] Please note that this translation is to be used solely as reference and the financial statements in this material are unaudited. In case of any discrepancy between this translation
[REFERENCE TRANSLATION] Please note that this translation is to be used solely as reference and the financial statements in this material are unaudited. In case of any discrepancy between this translation
Financial Results 3 rd Quarter MAR/2016 (FY2015)
") Financial Results MAR/2016 (FY2015) January 29 th, 2016 CONTENTS P.1 P.2 P.3 P.4~ Overview of FY MAR/16 Results Operating Revenue Operating Profit 1,030 1,020 1,010 +1.0Bn 1,022.3 1,023.4 (+0.1%) 180 160
Financial Results MAR/2016 (FY2015) January 29 th, 2016 CONTENTS P.1 P.2 P.3 P.4~ Overview of FY MAR/16 Results Operating Revenue Operating Profit 1,030 1,020 1,010 +1.0Bn 1,022.3 1,023.4 (+0.1%) 180 160
OPERATING AND FINANCIAL HIGHLIGHTS. Subsequent Events
 Copa Holdings Reports Net Income of $103.8 million and EPS of $2.45 for the Third Quarter of 2017 Excluding special items, adjusted net income came in at $100.8 million, or EPS of $2.38 per share Panama
MGM Resorts International Reports Second Quarter Financial Results
 NEWS RELEASE MGM Resorts International Reports Second Quarter Financial Results 8/5/2014 Consolidated Adjusted EBITDA Increased 8%, Led By 10% Growth In Wholly Owned Domestic Resorts MGM China Declares
Copa Holdings Reports Net Income of US$113.9 Million for the Fourth Quarter of 2013
 Copa Holdings Reports Net Income of US$113.9 Million for the Fourth Quarter of 2013 Panama City, Panama --- February 12, 2014. Copa Holdings, S.A. (NYSE: CPA), today announced financial results for the
3rd Quarter Result for Fiscal year ending February 29, 2016
 Last updated: January 12, 2016 3rd Quarter Result for Fiscal year ending February 29, 2016 January 12, 2016 Gulliver International Co., Ltd. (7599) Contents Ⅰ. 3rd Quarter Result for FY 2016 Ⅱ. Status
Consolidated Statement of Financial Position as at December 31, 2017
 86 Key Figures Consolidated Statement of Financial Position as at December 31, 2017 Assets in million December 31, 2017 December 31, 2016 Non-current assets Goodwill 19.3 19.3 Investments in airport operating
ANA HOLDINGS Financial Results for FY2014
 ANA HOLDINGS NEWS ANA HOLDINGS Financial Results for FY2014 TOKYO, April 30, 2015 ANA HOLDINGS (hereafter ANA HD ) today reports its consolidated financial results for fiscal year 2014 (April-March). Highlights
Earnings Presentation Material
 April 1, 2017 to March 31, 2018 (FY17) Earnings Presentation Material (May 18, 2018) * This document has been translated from the Japanese original, for reference purposes only. If there is any discrepancy
2018 Summer-Schedule International Flights to hit a record of 1,366 a week
 PRESS RELEASE March 20, 2018 2018 Summer-Schedule International Flights to hit a record of 1,366 a week Growth in both mid- & long-haul and international cargo services Kansai Airports is pleased to announce
Air China Limited Interim Results. August Under IFRS
 Air China Limited 21 Interim Results Under IFRS August 21 1 Agenda 21 Interim Results Overview Business Overview Financial Overview Outlook 2 2 2 21 Interim Results 3 21 Interim Results Overview 4 4 4
PRESS RELEASE Financial Results. Rising passenger traffic at 12.5m Exceeding 1bn in consolidated revenue
 PRESS RELEASE 2016 Financial Results Rising passenger traffic at 12.5m Exceeding 1bn in consolidated revenue Kifissia, 23 March 2017 AEGEAN reports full year 2016 results with consolidated revenue at 1,020m,
Copa Holdings Reports Fourth Quarter and Full Year 2007 Results
 Copa Holdings Reports Fourth Quarter and Full Year 2007 Results Panama City, Panama --- February 21, 2008. Copa Holdings, S.A. (NYSE: CPA), parent company of Copa Airlines and Aero Republica, today announced
Main Points in the Results for FY2015
 0 1 2 Main Points in the Results for FY2015 Operating profit increased to 75.4 billion yen, exceeding the goal of 75.0 billion yen for the final year of the medium-term management plan in the first year
JAPAN AIRLINES Co., Ltd. Financial Results 1 st Quarter Mar/2017(FY2016) July 29, 2016
 July 29, 2016") JAPAN AIRLINES Co., Ltd. Financial Results Mar/2017(FY2016) July 29, 2016 Today s Topics P.1 P.2 P.13 From the first quarter of this fiscal year, figures for Revenue Passengers Carried, ASK, RPK and Load
JAPAN AIRLINES Co., Ltd. Financial Results Mar/2017(FY2016) July 29, 2016 Today s Topics P.1 P.2 P.13 From the first quarter of this fiscal year, figures for Revenue Passengers Carried, ASK, RPK and Load
Volaris Reports Strong First Quarter 2015: 32% Adjusted EBITDAR Margin, 9% Operating Margin
 Volaris Reports Strong First Quarter 2015: 32% Adjusted EBITDAR Margin, 9% Operating Margin Mexico City, Mexico, April 22, 2015 Volaris* (NYSE: VLRS and BMV: VOLAR), the ultra-low-cost airline serving
Overview of financial results for the six months ended September 30, 2017
 Overview of financial results for the six months Seibu Holdings Inc. (9024) http://www.seibuholdings.co.jp/en/ Ⅰ. Executive summary P2 Ⅱ. Key initiatives of six months Ⅲ. Segment information and key performance
ANA HOLDINGS Financial Results for the Year ended March 31, 2016
 ANA HOLDINGS NEWS ANA HOLDINGS Financial Results for the Year ended March 31, 2016 TOKYO, April 28, 2016 ANA HOLDINGS (hereafter ANA HD ) today reports its consolidated financial results for fiscal year
Tokyu Tourist Corporation to become a wholly-owned subsidiary through share exchange
 NOTICE TO SHAREHOLDERS RESIDENT IN THE UNITED STATES: This press release relates to a proposed business combination which involves the securities of a foreign company. It is subject to disclosure requirements
RESULTS RELEASE 20 August GENTING HONG KONG GROUP ANNOUNCES FIRST HALF RESULTS FOR 2015 Highlights
 RESULTS RELEASE 20 August 2015 FOR IMMEDIATE RELEASE INTERNATIONAL GENTING HONG KONG GROUP ANNOUNCES FIRST HALF RESULTS FOR 2015 Highlights The commentary below is prepared based on a comparison of the
JAPAN AIRLINES Co., Ltd. Financial Results MAR/2016(FY2015)
") JAPAN AIRLINES Co., Ltd. Financial Results MAR/2016(FY2015) April 28 th, 2016 CONTENTS P.1 P.2 P.3 P.5 P.6 P.21 Overview of Financial Results Operating Revenue Operating Profit (OP Margin) 1,360 1,340
JAPAN AIRLINES Co., Ltd. Financial Results MAR/2016(FY2015) April 28 th, 2016 CONTENTS P.1 P.2 P.3 P.5 P.6 P.21 Overview of Financial Results Operating Revenue Operating Profit (OP Margin) 1,360 1,340
VINCI Airports 2017 Q4 traffic and annual performance
 VINCI Airports 2017 Q4 traffic and annual performance Rueil Malmaison, 18 January 2017 156.6 million passengers in 2017, all airports combined 12.4% growth in passenger traffic compared to 2016, on like-for-like
Financial Results 1 st Quarter Mar/2016 (FY2015) 30 July, 2015
 30 July, 2015") Financial Results Mar/2016 (FY2015) 30 July, 2015 Today s Topics P.2 P.3 P.15 1 Overview of FY Mar/2016 Financial Results Operating Revenue Operating Profit 320 307.0 +4.9Bn (+1.6%) 312.0 50 +17.6Bn (+94.6%)
Financial Results Mar/2016 (FY2015) 30 July, 2015 Today s Topics P.2 P.3 P.15 1 Overview of FY Mar/2016 Financial Results Operating Revenue Operating Profit 320 307.0 +4.9Bn (+1.6%) 312.0 50 +17.6Bn (+94.6%)
JAPAN AIRLINES Co., Ltd. Financial Results 1 st Quarter Mar/2017(FY2016) July 29, 2016
 July 29, 2016") JAPAN AIRLINES Co., Ltd. Financial Results Mar/2017(FY2016) July 29, 2016 Today s Topics P.1 P.2 P.13 From the first quarter of this fiscal year, figures for Revenue Passengers Carried, ASK, RPK and Load
JAPAN AIRLINES Co., Ltd. Financial Results Mar/2017(FY2016) July 29, 2016 Today s Topics P.1 P.2 P.13 From the first quarter of this fiscal year, figures for Revenue Passengers Carried, ASK, RPK and Load
JAPAN AIRLINES Co., Ltd. Financial Results 1 st Quarter Mar/2018(FY2017)
") JAPAN AIRLINES Co., Ltd. Financial Results Mar/2018(FY2017) July 31, 2017 Today s Topics P.1 P.2 P.3 P.4 P.6 P.15 Overview of Financial Results for (FY2017) 1 st quarter resulted in an increase in both
JAPAN AIRLINES Co., Ltd. Financial Results Mar/2018(FY2017) July 31, 2017 Today s Topics P.1 P.2 P.3 P.4 P.6 P.15 Overview of Financial Results for (FY2017) 1 st quarter resulted in an increase in both
Year ended December 31, 2012
 Consolidated Earnings Report - Supplementary Information Consolidated Results ( ) 1. Consolidated Financial Highlights 2. Major Sales Sales Volume Data 3. Condensed Consolidated Statements of Income Condensed
VINCI Airports 2017 Q2 traffic
 Rueil Malmaison, 12 July 2017 VINCI Airports 2017 Q2 traffic Sharp increase in passenger traffic in the second quarter in all the managed airports (+14.1%): Very strong growth in Portugal (+20.6%) and
INVESTOR RELATIONS Earnings Release
 INVESTOR RELATIONS 2017 2017 Earnings Release 1 Disclaimer This document contains parent results for 2017 based on K-IFRS. These statements involve risks and uncertainties, and actual results may differ.
Historical Statistics
 Historical Statistics FedEx Corporation Financial and Operating Statistics FY 2005 FY 2014 This report is a statistical supplement to FedEx s interim financial reports and is prepared quarterly. Additional
Q Earnings Financial Results for the First Quarter Ended June 30, July 28, 2016 OMRON Corporation
 Q1 2016 Earnings Financial Results for the First Quarter Ended June 30, 2016 July 28, 2016 OMRON Corporation Summary Q1 Results Both sales and operating income are in line with internal plan (decreased
WestJet announces 18th consecutive quarter of profitability Airline reports third quarter net earnings of $31.4 million
 FOR IMMEDIATE RELEASE WestJet announces 18th consecutive quarter of profitability Airline reports third quarter net earnings of $31.4 million CALGARY, ALBERTA. November 4, 2009. WestJet (TSX:WJA) today
LOCATED AT THE GATEWAY OF THE TROPICAL PROVINCE, RIDING ON THE GROWTH MOMENTUM OF THE COUNTRY, WE ARE ON THE RIGHT TRACK OF TAKING OFF.
 LOCATED AT THE GATEWAY OF THE TROPICAL PROVINCE, RIDING ON THE GROWTH MOMENTUM OF THE COUNTRY, WE ARE ON THE RIGHT TRACK OF TAKING OFF. MANAGEMENT DISCUSSION INDUSTRY REVIEW Civil Aviation Industry in
JAPAN AIRLINES Co., Ltd. Financial Results 1 st Quarter Mar/2018(FY2017)
") JAPAN AIRLINES Co., Ltd. Financial Results Mar/2018(FY2017) July 31, 2017 Today s Topics P.1 P.2 P.3 P.4~ P.6~ P.15~ Overview of Financial Results for Mar/18 Mar/18 (FY2017) 1 st quarter resulted in an
JAPAN AIRLINES Co., Ltd. Financial Results Mar/2018(FY2017) July 31, 2017 Today s Topics P.1 P.2 P.3 P.4~ P.6~ P.15~ Overview of Financial Results for Mar/18 Mar/18 (FY2017) 1 st quarter resulted in an
Japan Post Media Release
 Toll Group Level 7, 380 St Kilda Road Melbourne VIC 3004 Australia T +61 3 9694 2888 F +61 3 9694 2880 www.tollgroup.com Toll Holdings Limited ABN 25 006 592 089 18 February 2015 The Manager Australian
Consolidated Financial Results for the Three Months Ended June 30, 2013 (Japanese GAAP)
") [REFERENCE TRANSLATION] Please note that this translation is to be used solely as reference and the financial statements in this material are unaudited. In case of any discrepancy between this translation
[REFERENCE TRANSLATION] Please note that this translation is to be used solely as reference and the financial statements in this material are unaudited. In case of any discrepancy between this translation
FY2008 Financial Results. July 2008 Nankai Electric Railway Co., Ltd.
 FY2008 Financial Results July 2008 Nankai Electric Railway Co., Ltd. Brief Summary Nankai Group is one of the leading railway operators and an urban, residential and leisure developer based in the southern
Highlights from the Annual Results December 2007
 Highlights from the Annual Results December 2007 Disclaimer The information in this document is taken from the BAA 2007 Annual Results ( the Results ) which were published on 11 March 2008 and other public
Copa Holdings Reports Earnings of US$30.3 Million and EPS of US$0.70 for 3Q08
 Copa Holdings Reports Earnings of US$30.3 Million and EPS of US$0.70 for 3Q08 Panama City, Panama --- November 13, 2008. Copa Holdings, S.A. (NYSE: CPA), parent company of Copa Airlines and Aero Republica,
Air China Limited Annual Results. March Under IFRS
 Air China Limited 21 Annual Results Under IFRS March 211 Agenda Part 1 Highlights Part 2 Business Overview Part 3 Financial Overview Part 4 Outlook 2 Part 1 Highlights Steady Economic Growth; Asia Pacific
Consolidated Financial Results for the Three Months Ended June 30, 2015 (Japanese GAAP)
") [REFERENCE TRANSLATION] Please note that this translation is to be used solely as reference and the financial statements in this material are unaudited. In case of any discrepancy between this translation
[REFERENCE TRANSLATION] Please note that this translation is to be used solely as reference and the financial statements in this material are unaudited. In case of any discrepancy between this translation
May 15, I. Absorption-type Company Split Pursuant to the Move to a Holding Company Structure
 May 15, 2012 Corporate Name: ALL NIPPON AIRWAYS CO., LTD. President and C.E.O. Shinichiro Ito (Code Number: 9202, First Section of the Tokyo Stock Exchange and the Osaka Securities Exchange) Contact: Director,
Over 1,400 International Flights from KIX Scheduled for Winter 2018
 PRESS RELEASE October 23, 2018 Over 1,400 International Flights from KIX Scheduled for Winter 2018 - Bolstered mid- to long-haul route networks and added service to China - Kansai Airports is delighted
VINCI Airports 2018 Q1 traffic 1
 Rueil Malmaison, 12 April 2018 VINCI Airports 2018 Q1 traffic 1 Continued traffic increase trend in passenger traffic in the first quarter of 2018 (+11.6 2 %) compared to the first quarter of 2017 Very
2010 half year financial results Growth in results despite the downturn in traffic
 Paris, 31 August half year financial results Growth in results despite the downturn in traffic Results in progression despite the decrease in traffic of 2.1%: Revenue up by 2.5% 1 to 1,318.4 million EBITDA
ANA Fact Book All Nippon Airways Co., Ltd. Contents
 All Nippon Airways Co., Ltd. Contents 2 Domestic Passenger Market 4 International Passenger Market 5 Cargo Market 6 Haneda and Narita Airports 7 Global Alliance Statistics 8 Aircraft Specifications 9 Consolidated
ASUR 2Q11 PASSENGER TRAFFIC UP 2.89% YOY
 In Mexico ASUR Lic. Adolfo Castro (52) 5552-84-04-08 acastro@asur.com.mx In the U.S. Breakstone Group Susan Borinelli (646) 330-5907 sborinelli@breakstone-group.com ASUR 2Q11 PASSENGER TRAFFIC UP 2.89%
1Q13 R sults esentation
 1Q13 Results Presentation 14 May 2013 Disclaimer The presentation is dated the day it is given. The delivery of this presentation shall not, under any circumstances, create any implication that there has
Presentation on Results for the 2nd Quarter FY Idemitsu Kosan Co.,Ltd. November 14, 2018
 Presentation on Results for the 2nd Quarter FY 2018 Idemitsu Kosan Co.,Ltd. November 14, 2018 Table of Contents 1. FY 2018 2nd Quarter Financials (1) Overview (2) Segment Information 2. Reference Materials
Copa Holdings Reports Net Income of US$51.9 Million for the Fourth Quarter of 2008 and US$152.2 Million for Full Year 2008
 Copa Holdings Reports Net Income of US$51.9 Million for the Fourth Quarter of 2008 and US$152.2 Million for Full Year 2008 Panama City, Panama --- February 19, 2009. Copa Holdings, S.A. (NYSE: CPA), parent
Presentation on Results for the 2nd Quarter FY Idemitsu Kosan Co.,Ltd. November 1, 2016
 Presentation on Results for the 2nd Quarter FY 2016 Idemitsu Kosan Co.,Ltd. November 1, 2016 Table of Contents 1. 2nd Quarter FY 2016 Financials (1) Overview (2) Segment Information 2. Reference Materials
PRESS RELEASE / NOTICE TO INVESTORS
 March 25, 2015 PRESS RELEASE / NOTICE TO INVESTORS El Al's CEO David Maimon and its CFO, Dganit Palti, today presented the financial statements for the fourth quarter of 2014 In 2014 the Company's revenues
Air China Limited 2015 First Quarter Results
 Air China Limited 2015 First Quarter Results April 2015 Under PRC GAAP, unaudited Agenda Part 1 Part 2 Part 3 Results Highlights Business Performance Financial Review Part 1 Results Highlights Results
Q Fast growth continued, Comparable operating result at record high levels Pekka Vauramo
 2018 Fast growth continued, Comparable operating result at record high levels 17.7.2018 Pekka Vauramo 2 A good - Comparable operating result increased to new seasonal high Revenue Comparable operating
PRESS RELEASE. First Half 2017 Financial Results Higher Load Factors and traffic lead to a significant rebound in second quarter profitability
 PRESS RELEASE First Half 2017 Financial Results Higher Load Factors and traffic lead to a significant rebound in second quarter profitability Kifissia, 12 September 2017 AEGEAN announces first half 2017
Opening of aviation industry will bring opportunities to the Group. Management Discussion and Analysis
 10 HAINAN MEILAN INTERNATIONAL AIRPORT COMPANY LIMITED annual report 2003 Management Discussion and Analysis Opening of aviation industry will bring opportunities to the Group. HAINAN MEILAN INTERNATIONAL
Interim Release Q3/9M 2017
 Overview by the Executive Board November 2, 207 In the first nine months of 207, the airports of the Fraport Group recorded strong passenger development. At approximately 48.9 million, passenger numbers
MGM MIRAGE Reports Record Second Quarter Revenue, Cash Flow and Net Income
 NEWS RELEASE MGM MIRAGE Reports Record Second Quarter Revenue, Cash Flow and Net Income 7/24/2001 PRNewswire LAS VEGAS MGM MIRAGE (NYSE: MGG) today reported earnings of 47 cents per diluted share for the
United Continental Holdings, Inc (NYSE: UAL) ONE YEAR PRICE RANGE : $ LAST PRICE: $ ANALYST RATING: Sell
 ONE YEAR PRICE RANGE : $ LAST PRICE: $ ANALYST RATING: Sell") United Continental Holdings, Inc (NYSE: UAL) ONE YEAR PRICE RANGE : $61.91 68.76 LAST PRICE: $68.39 ANALYST RATING: Sell VALUATION DATE: August 3, 2017 NEXT EARNINGS DATE: October 17, 2017 Investment Thesis:
United Continental Holdings, Inc (NYSE: UAL) ONE YEAR PRICE RANGE : $61.91 68.76 LAST PRICE: $68.39 ANALYST RATING: Sell VALUATION DATE: August 3, 2017 NEXT EARNINGS DATE: October 17, 2017 Investment Thesis:
PRESS RELEASE VINCI QUARTERLY INFORMATION AT 31 MARCH 2015
 Rueil Malmaison, 23 April 2015 PRESS RELEASE VINCI QUARTERLY INFORMATION AT 31 MARCH 2015 Revenue: 8.2 billion (down 5.3%) Buoyant traffic at VINCI Autoroutes (up 2.0%) and VINCI Airports (up 11.8%) Decline
Historical Statistics
 Historical Statistics FedEx Corporation Financial and Operating Statistics FY 2006 FY 2015 This report is a statistical supplement to FedEx s interim financial reports and is prepared annually. Additional
ANA Reports Record Profits for FY2012
 ANA HOLDINGS NEWS ANA Reports Record Profits for FY2012 TOKYO April 30, 2013 - ANA Holdings today reports consolidated financial for the fiscal year ended March, 2013. Financial and Operational Highlights
Part 1 Performance Highlights. Part 2 Business Overview. Part 3 Financial Review
 August 216 1 Part 1 Performance Highlights Part 2 Business Overview Part 3 Financial Review Part 4 Outlook 2 Under IFRS 3 Part 1 Performance Highlights Performance Highlights - Key Operational Metrics
FINANCIAL RESULTS (in HK$ million) 20,000 18,000 16,000 14,000 12,000 10,000 8,000 6,000 4,000 2,000
 20,000 18,000 16,000 14,000 12,000 10,000 8,000 6,000 4,000 2,000") FINANCIAL REVIEW Financial Summary (in HK$ million) 2016/17 2015/16 +/ % 1 Revenue 18,627 18,184 +2.4% Operating expenses before depreciation and amortisation 5,796 5,848 0.9% Earnings before interest,
FINANCIAL REVIEW Financial Summary (in HK$ million) 2016/17 2015/16 +/ % 1 Revenue 18,627 18,184 +2.4% Operating expenses before depreciation and amortisation 5,796 5,848 0.9% Earnings before interest,