Forward-Looking Statements Statements in this presentation that are not historical facts are "forward-looking" statements and "safe harbor
|
|
|
- Esmond Bruce
- 6 years ago
- Views:
Transcription


1 Investor Presentation November 2017
2 Forward-Looking Statements Statements in this presentation that are not historical facts are "forward-looking" statements and "safe harbor statements" within the meaning of the Private Securities Litigation Reform Act of 1995 that involve risks and/or uncertainties, including those described in the Company's public filings with the Securities and Exchange Commission and any amendments thereto. The Company has based forwardlooking statements on management's current expectations and assumptions and not on historical facts. Examples of these statements include, but are not limited to, the Company s expectations regarding its ability to meet its financial and strategic goals, the Company s ability to further grow its portfolio on an accretive basis and the Company s expectations with respect to future rent growth, including potential rent from the ROFO property. These forward-looking statements involve a number of risks and uncertainties. Among the important factors that could cause actual results to differ materially from those indicated in such forward-looking statements include risks related to the Company s ability to receive, or delays in obtaining, any regulatory approvals required to own its properties, or other delays or impediments to completing the Company s planned acquisitions or projects, including any acquisitions of properties from MGM Resorts International ( MGM ); the ultimate timing and outcome of any planned acquisitions or projects; the Company s ability to maintain its status as a REIT; the availability of and the ability to identify suitable and attractive acquisition and development opportunities and the ability to acquire and lease those properties on favorable terms; the Company s ability to access capital through debt and equity markets in amounts and at rates and costs acceptable to the Company; changes in the U.S. tax law and other state, federal or local laws, whether or not specific to REITs or to the gaming or lodging industries; and other factors described in the Company's public filings with the Securities and Exchange Commission (the SEC ). In providing forward-looking statements, the Company is not undertaking any duty or obligation to update these statements publicly as a result of new information, future events or otherwise, except as required by law. If the Company updates one or more forward-looking statements, no inference should be drawn that it will make additional updates with respect to those other forward-looking statements. In addition, the Company has included certain historical information in this presentation related to the Company and MGM, including historical information related to the Company s and MGM s business, financial condition and results of operations. The delivery of this presentation is not intended to and does not create any implication that there have been no changes to the Company s or MGM s affairs since the date of any of the historical information provided. Market and Industry Data This presentation also contains estimates and information concerning the Company s industry, including market position, rent growth and rent coverage of the Company s peers, that are based on industry publications, reports and peer company public filings. This information involves a number of assumptions and limitations, and you are cautioned not to rely on or give undue weight to this information. The Company has not independently verified the accuracy or completeness of the data contained in these industry publications, reports or filings. The industry in which we operate is subject to a high degree of uncertainty and risk due to variety of factors, including those described in the Risk Factors section of the Company s public filings with the SEC. Non-GAAP Disclaimer The following presentation includes certain non-gaap financial measures as defined in Regulation G under the Securities Exchange Act of 1934, as amended. Schedules that reconcile the non-gaap financial measures to the most directly comparable financial measures calculated and presented in accordance with Generally Accepted Accounting Principles in the United States are included in MGP s earnings releases that have been furnished with the SEC and are available on MGP s website at This presentation also includes certain financial measures, such as MGM s Adjusted EBITDA and MGM s Adjusted Property EBITDA, which are not calculated in accordance with U.S. generally accepted accounting principles ( U.S. GAAP ). Management recommends that you focus on the U.S. GAAP numbers as the best indicator of financial performance. These alternative measures are provided only as a supplement to aid in your analysis. MGM uses Adjusted EBITDA and Adjusted Property EBITDA as the primary profit measure for its reportable segments. Adjusted EBITDA is a measure defined as earnings before interest and other non-operating income (expense), taxes, depreciation and amortization, preopening and start-up expenses, and property transactions, net. Adjusted Property EBITDA is a measure defined as Adjusted EBITDA before corporate expense and stock compensation expense related to MGM s stock option plan, not allocated to each casino resort. Adjusted EBITDA or Adjusted Property EBITDA should not be construed as an alternative to operating income or net income, as an indicator of MGM s performance; or as an alternative to cash flows from operating activities, as a measure of liquidity; or as any other measure determined in accordance with generally accepted accounting principles. MGM has significant uses of cash flows, including capital expenditures, interest payments, taxes and debt principal repayments, which are not reflected in Adjusted EBITDA or Adjusted Property EBITDA. Also, other companies in the gaming and hospitality industries that report Adjusted EBITDA or Adjusted Property EBITDA information may calculate Adjusted EBITDA or Adjusted Property EBITDA in a different manner. Please see MGM s earnings releases which have been filed with the SEC and are available on MGM s website for a reconciliation of MGM s reported Adjusted EBITDA and Adjusted Property EBITDA to net income. Financial information for MGM included in this presentation has been derived from MGM s public filings, which includes certain expenses related to the Company that are not eliminated in consolidation. 1
3 MGP Premier Triple Net REIT Triple net lease REIT engaged in owning, acquiring and leasing high-quality leisure, entertainment and hospitality assets with one of the largest portfolios of premier assets on the Las Vegas Strip Assets leased to MGM Resorts with expected annual rent of approximately $757 million, prorated for the remainder of the current lease year after the completion of the MGM National Harbor acquisition, as part of a long-term triple net master lease Company Highlights Las Vegas Assets Regional Assets 4.1x Corporate Rent Coverage in 2016 (1) Embedded Growth Pipeline through ROFO Asset 1 3 Tenant Financial Performance Publicly Disclosed ~10.5% Dividend Growth since April 2016 IPO % Annual Rent Increase Fixed Through 2022 (2) 5.4% Dividend Yield (3) 5 1 ROFO (4) No Near Term Lease Expirations (1) Historical corporate rent coverage ratio for the year ended 12/31/2016. Management currently anticipates that the corporate rent coverage ratio for the year ending 12/31/2017 will be negatively impacted as a result of the contractual rent escalator in the Master Lease that went into effect 4/1/2017 and the expected $95.0 million increase in rent under the Master Lease following the MGM National Harbor acquisition. (2) Based on 2.0% annual escalator on fixed rent (90% of total rent), compounded through the lease year ending 4/1/2022. (3) Based on closing share price on 11/10/2017 and annual per Share dividend amount of $1.58, which amount may be changed in the future at the discretion of the Company. (4) The Master Lease provides us with a right of first offer with respect to MGM s development property located in Springfield, Massachusetts should MGM Resorts choose to sell such asset. 2
 8.0% acquisition cap rate (2) / 12.")
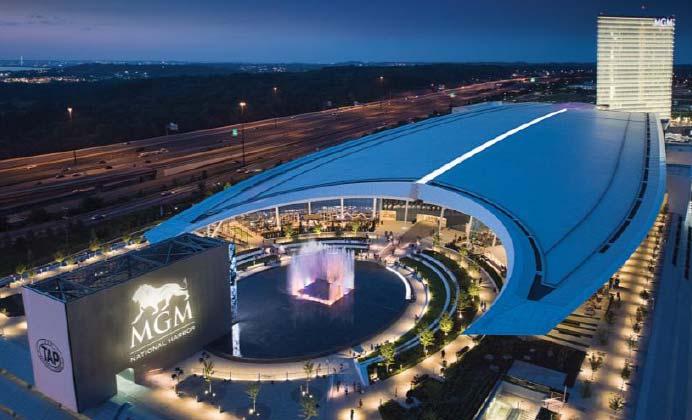
 (5) Remainder funded with Cash on Balance Sheet MGM National Harbor Aerial View (1) Prorated for the remainder of the current lease year after the")
4 Acquisition of MGM National Harbor Assets Transaction Overview MGP purchased MGM National Harbor s real estate for $1,188 million $95 million in rent added to the Master Lease with MGM Resorts Increased rental income by 14% from ~$662 million to ~$757 million for lease year 2018 (1) 8.0% acquisition cap rate (2) / 12.5x EBITDA multiple (3) Transaction Financing Gross proceeds from Class A Shares Offering ~$405 million (4) Senior Notes offering of $ % OP Units issued to MGM Resorts (~$300 million) (5) Remainder funded with Cash on Balance Sheet MGM National Harbor Aerial View (1) Prorated for the remainder of the current lease year after the completion of the MGM National Harbor acquisition. (2) Calculated based on $95 million Master Lease annual rent increase following MGM National Harbor acquisition, divided by $1,188 million MGM National Harbor acquisition price. (3) Reflects anticipated $95 million Master Lease annual rent increase following MGM National Harbor acquisition, and assumes no incremental general and administrative expenses. (4) Based on issue price of $30.60 per Share. (5) Number of OP units issued based on issue price of $30.70 per Share. 3
 # of Hotel Rooms 27,541 MGM National Harbor The Mirage Total Acres (Las")
 as of 6/30/17")
 As of 12/31/2016, post-acquisition numbers include MGP's")
, 50,000")
 As of 6/30/2017, post-acquisition numbers include MGM National Harbor.")

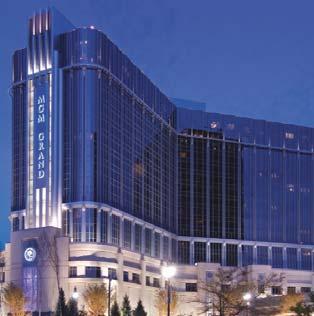
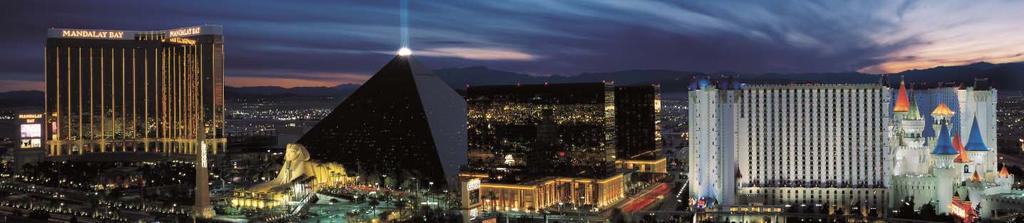
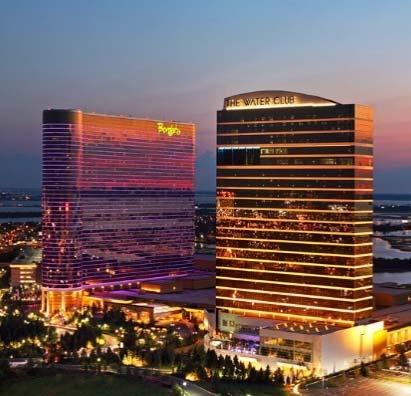
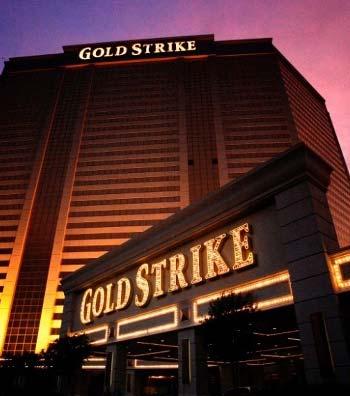
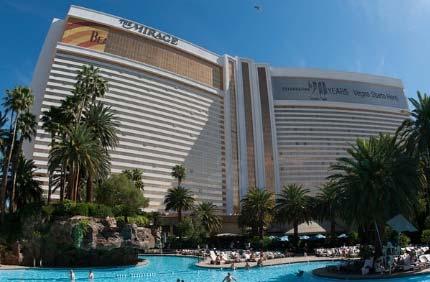
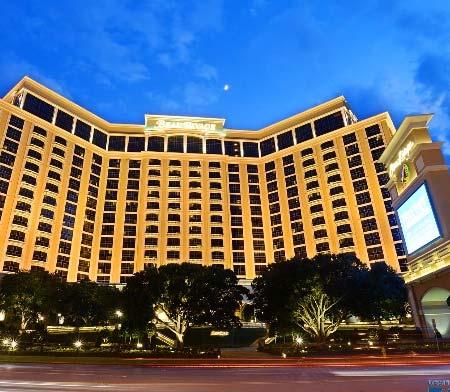
5 Landmark Real Estate Portfolio Snapshot PF for National Harbor Significant Real Estate Asset Value as of 12/31/16 adjusted for National Harbor acquisition (1) # of Hotel Rooms 27,541 MGM National Harbor The Mirage Total Acres (Las Vegas / Regional) Meeting / Convention Space Square Footage ~488 (354 / 134) >2.65 million Total Casino Square Footage ~1,153,000 Borgata Gross Book Value of Assets ($ in millions) as of 6/30/17 adjusted for National Harbor acquisition (2) Land Value $4,144 MGM Grand Detroit Buildings Value $8,458 Mandalay Bay Gross Land & Building Value $12,602 Beau Rivage (1) As of 12/31/2016, post-acquisition numbers include MGP's properties and MGM National Harbor. As of 12/31/2016, MGM National Harbor had 308 hotel rooms, 23 acres of land (subject to a ground lease), 50,000 square feetof convention space, and approximately 125,000 square feet of casino space. (2) As of 6/30/2017, post-acquisition numbers include MGM National Harbor. As of 6/30/2017, the Company estimates the net carrying value of the MGM National Harbor assets was $1.14 billion, solely comprising the estimated net carrying value of the buildings and improvements at MGM National Harbor, including accumulated depreciation of $22.0 million. The land at MGM National Harbor is subject to a ground lease and not included in the estimate of the net carrying value of the MGM National Harbor assets. 4
 8 1 7 2 9 Detroit, MI Atlantic City, NJ 11 6 Las")
 (1) MGP has a right of first offer on one")
6 Geographic Overview Premium real estate portfolio consisting of 12 high-quality, mixed-use Las Vegas resorts and market-leading regional assets, as well as one ROFO asset (1) Detroit, MI Atlantic City, NJ 11 6 Las Vegas _1.wor (NY008MZK) Tunica, MS Washington, D.C. 12 Biloxi, MS Las Vegas Assets Regional Assets ROFO Asset (1) (1) MGP has a right of first offer on one MGM property currently under development: MGM Springfield. 5


7 Rent Supported by Diversified Revenue Stream The Las Vegas market continues to diversify its offerings, solidifying its position as a major U.S. entertainment destination with MGM Resorts leading this diversification 2016 LV Market Total Revenue Mix Las Vegas Source: MGM Resorts International public filings, Nevada Gaming Abstract 6
(2) Master Lease All")
 Coverage stress")

 As of 12/31/2016.")


8 Stable and Secure Rent Corporate Rent Coverage (1)(2) Master Lease All Properties Under 1 Master Lease Over 4x Corporate Coverage (2) Coverage stress tested through both the Recession & Las Vegas supply increases Corporate Guarantee from MGM Source: MGM Resorts International public filings (1) As of 12/31/2016. (2) Management currently anticipates that the corporate rent coverage ratio for the year ending 12/31/2017 will be negatively impacted as a result of the contractual rent escalator in the Master Lease that went into effect 4/1/2017 and the expected $95.0 million increase in rent under the Master Lease following the MGM National Harbor acquisition. MGM Macau MGM Cotai 7
9 Industry Leading Rent Security FY2016 Corporate Rent Coverage (1) (6) % of Total Rent Income Disclosed 100% 44% (2) 50% (3) Tenants that Only For Retail Information (4) Provide 97%(5) 97%(6) Source: Company filings as of 12/31/2016 (1) The Rent Coverage calculations for each of the peer companies listed in the table are derived from disclosures in such company s periodic reports with the SEC. These calculations differ from how the Company calculates its Corporate Rent Coverage and such differences may be material. (2) National Retail Properties discloses Rent Coverage for its top 14 tenants, 44% of annualized base rent for all leases in place as of 12/31/16. (3) Spirit Realty Capital based on Company provided Unit Level Rent Coverage from tenants that provide unit level financial reporting. As of 12/31/16, represents 50% of rental revenue. (4) Realty Income based on the analysis of the most recently provided information from retail tenants that provide such information. Realty Income does not independently verify the information received. (5) Store Capital % based on locations subject to unit-level financial reporting. (6) Gaming & Leisure Properties based on weighted average rent coverage 12 months ended 12/31/16 of PENN & PNK excluding Meadows of 1.81x and 1.89x, respectively. 12 months ended 12/31/16 cash rental income from PENN of $442 million & PNK including land leases and excluding Meadows of $256 million. 8


 months after that date, and may be renewed thereafter at the option of the Tenant for an")
, after which the term of the Master Lease with respect to MGM National Harbor will be the same as the term of the")
10 Master Lease Provides Stable Income Plus Embedded Growth High Organic Growth Current Annual Rent of $757 million, pro-rated for remainder of the lease year Predictable Rent Growth (1) Illustrative 6-Year Total Growth: +48% 2% Escalator on $682 of $757 million current year Rent ~$14 million expected annual rent increase on April 1, % Escalator Fixed through 2021 First test in 2022 ($ in millions) $75 of current year rent of $757 million 1 st Adjustment in 2022 based on average Net Revenue for prior 5 year period 30 year total term 10 year Initial with (4) 5-Year Extensions (2) (1) Illustrative Rent Growth based on current Master Lease; in year 2, assumes full year impact of the Borgata & National Harbor transaction plus 1 year of the fixed rent escalator pro forma for the Borgata transaction and rent at year 1 only; thereafter, based on current Master Lease (2) The initial term of the Master Lease with respect to MGM National Harbor will be the period from the closing date of the MGM National Harbor Transaction until the last day of the calendar month that is eighty-two (82) months after that date, and may be renewed thereafter at the option of the Tenant for an initial renewal period lasting until the earlier of the end of the then-current term of the Master Lease or the next renewal term (depending on whether MGM elects to renew the other properties under the Master Lease in connection with the expiration of the initial ten-year term), after which the term of the Master Lease with respect to MGM National Harbor will be the same as the term of the Master Lease with respect to the other properties currently under the Master Lease. If MGM does not renew the lease with respect to MGM National Harbor after the initial term, MGM would lose the right to renew the Master Lease with respect to the rest of the properties when the initial ten-year lease term related to the rest of the properties ends in
11 Strong Organic Growth with No Near Term Lease Turnover Same-Store / Contractual Rent Growth (1) % of Annualized Rental Revenue Expiring by 2026 (2) Source: Company filings as of 9/30/2017 (1) MGM Growth Properties based on fixed annual rent escalator; Store Capital based on % of Base Rent and Interest subject to weighted average annual escalation rate annually only; Realty Income based on same store rent guidance for 2017E; W.P Carey based on LTM same store ABR vs. prior LTM same store ABR for Owned Real Estate Portfolio; GLPI based on cash rent from PENN Building rent component increase of $0.7 million effective 11/1/17 and cash rent from PNK Building rent component increase of $3.9 million effective 4/28/17 vs. current full year rent guidance of $873.1 million less Building rent component increases from PENN and PNK; National Retail Properties based on same store rental income (cash basis) year ended 12/31/2016 vs. 12/31/2015; VEREIT based on same-store rental growth over LTM vs. previous LTM period; Spirit Realty Capital based on LTM same store contractual cash rent vs. prior LTM period. (2) Assumes National Harbor structure in-line with the rest of Master Lease; please see footnote (2) on Slide 9 for additional information. 10
12 Growth Competitive with Peers Net Acquisition / Investment Activity (1)(2)(3) ($ in millions) Source: Company filings, Wall Street Research as of 9/30/2017 Note: MGM Growth Properties & Gaming & Leisure Properties 2017E Net Acquisition based on actuals YTD as of 9/30/2017. (1) (3) See appendix for additional details 11
13 Highly Visible Growth Path & Strategy Organic Growth ~$0.21 (1) of AFFO/unit from contractual rent growth over 5 years ROFO Properties MGM National Harbor transaction completed on October 5, 2017 MGM Springfield opening in September 2018 MGM Wholly Owned, Joint Ventures & Add-ons Add-ons: Park Theater, Park MGM (Monte Carlo re-development) Wholly Owned: Bellagio, MGM Grand and Circus Circus Joint Ventures: CityCenter, Grand Victoria and T-Mobile Arena Asset & Tenant Diversification ~59 Target Gaming Properties across 20+ different owners Numerous other attractive net lease acquisitions in leisure, entertainment, hospitality and related sectors +$56 million through YE 2021 MGM National Harbor +$95mm of Rent so far Wholly Owned & Joint Venture Total Potential Rent: ~$665 million (2) Gaming Properties potential rent of ~$2.5 billion (3) (1) ~266.0 million units outstanding pro forma for National Harbor. (2) Based on 2.0x rent coverage on LTM Adjusted EBITDA reported by MGM related to the Bellagio, MGM Grand Las Vegas, Circus Circus Las Vegas and CityCenter Holdings, LLC (excluding Crystals, Resort Operations only) as of 9/30/17 ($515.4, $323.1, $73.5 and $417.1 million, respectively, totaling ~$1.329 billion, 12 months ended 9/30/2017). (3) Based on 2.0x rent coverage on estimated total EBITDAR of target gaming opportunity universe. 12
14 Rent Growth Potential From the initial rent of $550 million at IPO, there is an achievable path to over $1 billion of rental revenue Total Potential Growth: 86%+ ($ in millions) (1) Source: Wall Street Research (1) Consensus Wall Street analyst Adjusted EBITDAR estimates for Springfield based on 2019E as of 11/10/2017. MGM Springfield Rent based on rent coverage of 2.0x, rounded. 13
 ($ in millions) Credit Ratios Pro Forma for National Harbor Leverage Metrics 3Q'17 Net")
 4.48% Coverage Metrics Ann. Adj. EBITDA / Ann. Cash Int.")
 based on int. rate as of 9/30/17 of 3.")


15 Conservative Balance Sheet with Flexibility to Grow Debt Maturity Profile Capital Structure (2) ($ in millions) Credit Ratios Pro Forma for National Harbor Leverage Metrics 3Q'17 Net Debt / Annualized Adjusted EBITDA (3) 5.1x Debt / Total Capitalization 33.8% Weighted Average Cost of Debt (1) 4.48% Coverage Metrics Ann. Adj. EBITDA / Ann. Cash Int. Exp. (4) 4.5x (1) Wgt. avg. int. rate incl. interest rate swaps adjustments. Int. rate on Term Loan A and B (based on un-swapped balance) based on int. rate as of 9/30/17 of 3.99% and 3.49%, respectively. (2) Fixed rate debt includes $1.2 billion of notional amount swapped to fixed; share price as of 11/10/2017. (3) See appendix for definition of Adjusted EBITDA & additional details. Note: Cash reported as of 9/30/17 of $1,138.8 million. Ratio shown adjusts reported Cash for National Harbor transaction. (4) See appendix for definition of Cash Interest Expense & additional details. 14
16 Superior Portfolio and Growth 4.1x Corporate Rent Coverage (1) Tenant Financial Performance Publicly Disclosed 1.8%+ Annual Increases Fixed through 2022 (2) No Near Term Annual Lease Expirations Embedded Growth Pipeline through ROFOs ~10.5% Dividend Growth Since IPO 5.4% Dividend Yield (3) (1) As of 12/31/2016. Management currently anticipates that the corporate rent coverage ratio for the year ending 12/31/2017 will be negatively impacted as a result of the contractual rent escalator in the Master Lease that went into effect 4/1/2017 and the expected $95.0 million increase in rent under the Master Lease following the MGM National Harbor acquisition. (2) Based on 2.0% annual escalator on fixed rent (90% of total rent), compounded through (3) As of share price close on 11/10/
17 Appendix 16


18 ROFO Assets MGM Springfield NY Albany Rivers Mohawk VT NH MA Everett Wynn Boston PA Hartford CT Springfield RI Mohegan Sun Plainridge Park Twin River Providence Newport Grand Foxwoods NJ New York Other Casino Properties Planned Casino Projects Project Highlights Project Cost: ~$960 million Opening Date: 3 rd Quarter 2018 Location: 14 acres of land in downtown Springfield, MA Casino with approx. 2,550 slots and 120 tables (1) Hotel with 250 rooms 100,000 sq.ft. of retail and dining 3,500-space parking garage Meeting & Event Space: ~44,000 sq. ft. Source: MGM Resorts International public filings (1) Includes Poker Tables. 17
19 Detailed Footnotes (1) Net Acquisition defined as acquisition volume less disposition volume. (2) 2016A Net Acquisition Volume: Realty Income based on New Property Acquisitions less Net Proceeds of total real estate dispositions; Spirit Realty Capital based on "Gross Investments less disposition of "Real Estate Investment"; EPR Properties based on acquisitions and investments in mortgage notes only and excludes development/redevelopment; EPR Properties dispositions based on net proceeds from sale of properties/land and mortgage note payoffs; W.P. Carey based on Owned Real Estate Portfolio, acquisitions & dispositions only; National Retail Properties based on Total Dollars Invested in property acquisitions; National Retail Properties dispositions based on net sale proceeds of property dispositions; VEREIT based on purchase price of acquisitions; VEREIT dispositions based on Sale Price of dispositions. (3) Net acquisition guidance, based on difference of midpoint of acquisition & disposition guidance, less YTD development spend; Spirit Realty Capital based on research estimates; EPR based on midpoint of Investment Spending guidance less YTD capital spending on development/redevelopment; W.P. Carey based on midpoint of 2017E acquisition guidance less YTD disposition proceeds in the Owned Real Estate Portfolio, pro rata. 18
20 Adjusted EBITDA & Cash Interest Expense Reconciliation ($ in 000s) 3 Mo. Ended Reconciliation of Net Incom e to Adj. EBITDA 9/30/2017 Net Income (Loss) $43,700 Depreciation 68,662 Property transactions, net 1,662 Funds from Operations $114,024 Amortization of financing costs 2,954 Non-cash compensation expense 393 Net effect of straight-line rent & amortization of deferred revenu 1,611 Acquisition-related expenses 1,059 Amortization of above market lease, net 172 Provision for income taxes 1,488 Adjusted Funds from Operations $121,701 Interest Income (1,480) Interest Expense 45,544 Amortization of Financing Costs (2,954) Adjusted EBITDA $162,811 Annualized Adjusted EBITDA $651,244 Plus: National Harbor Initial Rent 95,000 Pro Form a Annualized Adjusted EBITDA $746,244 Interest Expense $45,544 Less: Amortization of Financing Fees (2,954) Less: Interest Income (1,480) Cash Interest Expense $41,110 Annualized Cash Interest Expense $164,440 Note: All figures reported as of 9/30/17 with exception of National Harbor initial rent which is based on year 1 total rent; Interest expense based on partial quarter of recent $350 million 4.50% Senior Notes offering. 19
21 MGM Supplemental Data Non-GAAP Financial Measures 20
22 Calculation of MGM Historical Corporate Rent Coverage Ratio (1)(2) ($ in 000s) Year Ended December 31, Adjusted EBITDA Related to: Domestic Resorts $1,901,031 $1,343,562 $1,165,413 $1,298,116 $1,325,220 $1,442,686 $1,518,307 $1,689,966 $2,063,016 Management & Other Operations 16,894 18,322 (12,158) 287 9,947 25,777 35,984 37,419 13,000 Corporate (Excluding Stock-Based Compensation) (95,862) (131,142) (109,911) (156,086) (215,757) (200,708) (220,664) (254,104) (264,160) Subtotal $1,822,063 $1,230,742 $1,043,344 $1,142,317 $1,119,410 $1,267,755 $1,333,627 $1,473,281 $1,811,856 Dividends & distributions received by MGM CityCenter $200,000 $540,000 MGM China ,355 30, , , , ,159 52,902 Grand Victoria 41,125 33,750 33,500 30,000 22,000 16,275 15,450 16,850 14,250 Borgata 19,579 60, , ,094 2,654 Subtotal $60,704 $93,886 $339,277 $60,513 $225,886 $328,500 $405,189 $535,103 $609,806 Total Adj. EBITDA & Div. & Dist. $1,882,767 $1,324,628 $1,382,621 $1,202,830 $1,345,296 $1,596,255 $1,738,816 $2,008,384 $2,421,662 Corporate Rent Coverage Ratio 3.4x 2.4x 2.5x 2.2x 2.4x 2.9x 3.2x 3.7x 4.1x (1) MGM s historical corporate rent coverage ratio is calculated by dividing (a) the sum of Adjusted EBITDA as reported by MGM related to domestic resorts, management and other operations, and corporate (excluding stockbased compensation), plus dividends and distributions received by MGM from CityCenter, Borgata, Grand Victoria and MGM China, by (b) either (i) for all periods up to and including the year ended December 31, 2015, year one rent under the Master Lease of $550.0 million, or (ii) for the year ended December 31, 2016, rent under the Master Lease of $591.7 million, which reflects year one rent under the Master Lease of $550.0 million prorated for the period prior to the Borgata Transaction, and $650.0 million prorated for the remainder of the lease year following the closing of the Borgata Transaction on August 1, For a calculation of MGM s historical corporate rent coverage ratio, see Annex II Calculation of MGM Historical Corporate Rent Coverage Ratio. We use MGM s historical corporate rent coverage ratio to illustrate our Tenant s ability to meet its obligations under the Master Lease. The numerator to the calculation of MGM s historical corporate rent coverage ratio for the year ended December 31, 2016 shown above includes Adjusted Property EBITDA with respect to MGM National Harbor following its opening on December 8, 2016 and Adjusted Property EBITDA with respect to Borgata following its acquisition on August 1, However, the denominator to the calculation of the ratio shown above does not reflect what the rent would have been under the Master Lease had MGM National Harbor been subject to the Master Lease following its opening on December 8, In addition, the ratio shown above does not reflect what the historical corporate rent coverage ratio would have been had Borgata and MGM National Harbor been included in MGM s operating results (and, in the case of MGM National Harbor, had it been fully stabilized) and had such properties been subject to the Master Lease for the entire period presented. On August 1, 2016, Borgata was added to the existing Master Lease between the Landlord and the Tenant. As a result, the initial annual rent amount under the Master Lease increased by $100.0 million to $650.0 million, prorated for the remainder of the first lease year. Furthermore, upon the completion of the proposed MGM National Harbor Transaction, it is anticipated that the Master Lease will be amended to add MGM National Harbor, increasing the annual rent amount under the Master Lease by $95.0 million to $756.7 million, prorated for the remainder of the lease year. The calculation of MGM s historical corporate rent coverage ratio shown above does not include the impact of the MGM National Harbor Transaction. MGM National Harbor had net revenues of $350.9 million, operating income of $28.6 million and Adjusted Property EBITDA of $69.1 million for the six months ended June 30, Management currently anticipates that the corporate rent coverage ratio for the year ending December 31, 2017 will be negatively impacted as a result of the contractual rent escalator in the Master Lease that went into effect on April 1, 2017 and the expected $95.0 million increase in annual rent under the Master Lease following the MGM National Harbor Transaction. (2) The numerator to the calculation of MGM s historical corporate rent coverage ratio includes $60.7 million, $93.9 million, $339.3 million, $60.5 million, $225.9 million, $328.5 million, $405.2 million, $535.1 million and $609.8 million of special and ordinary dividends and other cash distributions actually received by MGM from CityCenter, Borgata, Grand Victoria and MGM China for the years ended December 31, 2008, 2009, 2010, 2011, 2012, 2013, 2014, 2015 and 2016, respectively. Dividends and distributions are made at the discretion of each relevant entity s board of directors or similar body, and depend on several factors, including financial position, results of operations, cash flows, capital requirements, debt covenants, and applicable law, among others. Accordingly, historical dividends and distributions may not be indicative of future dividends or distributions and should not be relied upon as an indicator of MGM s historical corporate rent coverage ratio for future periods. In addition, as described in note (1) above, Borgata was acquired by MGM on August 1, The historic dividends and distributions related to Borgata have not been adjusted as a result of the Borgata Transaction. MGM s corporate rent coverage ratio excluding dividends and distributions received by MGM from CityCenter, Borgata, Grand Victoria and MGM China was 3.3x, 2.2x, 1.9x, 2.1x, 2.0x, 2.3x, 2.4x, 2.7x and 3.0x for the years ended December 31, 2008, 2009, 2010, 2011, 2012, 2013, 2014, 2015 and 2016, respectively. Since the 2008 recession, the lowest annual MGM corporate rent coverage ratio (excluding dividends and distributions received by MGM from CityCenter, Borgata, Grand Victoria and MGM China) was 1.9x. 21
Forward-Looking Statements Statements in this presentation that are not historical facts are "forward-looking" statements and "safe harbor
 2017 Annual Meeting of Shareholders Presentation May 2017 Forward-Looking Statements Statements in this presentation that are not historical facts are "forward-looking" statements and "safe harbor statements"
MGM GROWTH PROPERTIES LLC Second Quarter 2016 Earnings Presentation
 MGM GROWTH PROPERTIES LLC Second Quarter 06 Earnings Presentation August 4, 06 Forward-Looking Statements Statements in this presentation that are not historical facts are "forward-looking" statements
Market and Industry Data
 Investor Presentation March 2018 Forward-Looking Statements Statements in this presentation that are not historical facts are "forward-looking" statements and "safe harbor statements" within the meaning
Investor Presentation
 Investor Presentation December 2016 Forward-Looking Statements Statements in this presentation that are not historical facts are "forward-looking" statements and "safe harbor statements" within the meaning
Market and Industry Data
 Investor Presentation June 2018 Forward-Looking Statements Statements in this presentation that are not historical facts are "forward-looking" statements and "safe harbor statements" within the meaning
Wells Fargo Net Lease REIT Forum 2016
 Wells Fargo Net Lease REIT Forum 2016 September 2016 Forward-Looking Statements Statements in this presentation that are not historical facts are "forward-looking" statements and "safe harbor statements"
Forward-Looking Statements Statements in this presentation that are not historical facts are "forward-looking" statements and "safe harbor
 Investor Presentation November 2018 Forward-Looking Statements Statements in this presentation that are not historical facts are "forward-looking" statements and "safe harbor statements" within the meaning
GAMING INVESTMENT FORUM AT G2E. September 26, 2016
 GAMING INVESTMENT FORUM AT G2E September 26, 2016 Dan D Arrigo EVP & Chief Financial Officer MGM Resorts International MGM RESORTS INTERNATIONAL Strong Domestic Operating Results Las Vegas Trends Maximizing
MGM Resorts International Reports Second Quarter Financial Results
 NEWS RELEASE MGM Resorts International Reports Second Quarter Financial Results 8/5/2014 Consolidated Adjusted EBITDA Increased 8%, Led By 10% Growth In Wholly Owned Domestic Resorts MGM China Declares
MGM Resorts International Reports Strong First Quarter Financial And Operating Results
 NEWS RELEASE MGM Resorts International Reports Strong First Quarter Financial And Operating Results 5/5/2016 Increases Wholly Owned Domestic Resorts Net Revenue and Adjusted Property EBITDA by 3% and 24%
MGM Resorts International Reports First Quarter Financial And Operating Results
 NEWS RELEASE MGM Resorts International Reports First Quarter Financial And Operating Results 4/27/2017 LAS VEGAS, April 27, 2017 /PRNewswire/ -- MGM Resorts International (NYSE: MGM) ("MGM Resorts" or
MGM RESORTS INTERNATIONAL Third Quarter 2016 Earnings Presentation
 MGM RESORTS INTERNATIONAL Third Quarter 2016 Earnings Presentation November 7, 2016 Forward-Looking Statements Statements in this presentation that are not historical facts are forward-looking statements,
MGM Resorts International Reports Fourth Quarter And Full Year Financial And Operating Results; Announces Quarterly Dividend
 NEWS RELEASE MGM Resorts International Reports Fourth Quarter And Full Year Financial And Operating Results; Announces Quarterly Dividend 2/16/2017 Increased diluted earnings per share in the fourth quarter
Forward-Looking Statements. Note Regarding Presentation of Non-GAAP Financial Measures
 First Quarter 2016 Earnings Presentation May 5, 2016 Forward-Looking Statements Statements in this presentation that are not historical facts are forward-looking statements, within the meaning of the Private
MGM Resorts International Reports Fourth Quarter and Full Year Results
 NEWS RELEASE MGM Resorts International Reports Fourth Quarter and Full Year Results 2/14/2011 LAS VEGAS, Feb. 14, 2011 /PRNewswire-FirstCall/ -- MGM Resorts International (NYSE: MGM) today announced a
MGM MIRAGE Reports Record First Quarter Results
 NEWS RELEASE MGM MIRAGE Reports Record First Quarter Results 5/3/2007 PRNewswire-FirstCall LAS VEGAS MGM MIRAGE (NYSE: MGM) today reported its first quarter 2007 financial results, achieving the Company's
BAML 2017 Japan Conference The Opportunity For Integrated Resorts In Japan
 BAML 2017 Japan Conference The Opportunity For Integrated Resorts In Japan September 7, 2017 Jim Murren Chairman and CEO MGM Resorts International AGENDA 1. MGM Resorts Who We Are 2. The Japan Opportunity
Q2 Financial Results Before One-Time Charges
 Q2 Highlights Generated Record Net Revenues of $1.7 Billion, Up 60% Same-Store Net Revenues were $1.2 Billion, Up 11% Over 2004 Produced Record Property-Level EBITDA of $567 Million Same-Store Property-Level
Q3 HIGHLIGHTS. Strong High End Table Games Volume Baccarat Volume Up 22%
 what if Q3 HIGHLIGHTS Net Revenues up 5% to $1.9 Billion 5% Increase in Gaming Revenues Strong High End Table Games Volume Baccarat Volume Up 22% Slot Revenue Up 5% Hotel Revenues Grew 3% - Led by a 6%
MGM MIRAGE Reports Fourth Quarter and Full Year Financial Results
 NEWS RELEASE MGM MIRAGE Reports Fourth Quarter and Full Year Financial Results 2/18/2010 CityCenter Opens to Rave Reviews Convention Booking Pace Continues to Strengthen PRNewswire-FirstCall LAS VEGAS
Investor Conference April 2016
 Investor Conference April 2016 Forward Looking Statements This presentation contains forward-looking statements regarding operating trends, future results of operations and the completion of new projects,
MGM Resorts International INVESTOR PRESENTATION
 MGM Resorts International INVESTOR PRESENTATION March 2017 Forward-Looking Statements Statements in this presentation that are not historical facts are forward-looking statements, within the meaning of
CLSA Investors Forum 2015 September 2015
 CLSA Investors Forum 2015 September 2015 Forward Looking Statements This presentation contains forward-looking statements regarding operating trends, future results of operations and the completion of
Gaming Investment Forum September 2014
 Gaming Investment Forum September 2014 Forward Looking Statements This presentation contains forward-looking statements regarding operating trends, future results of operations and the completion of new
MGM RESORTS INTERNATIONAL REPORTS SECOND QUARTER FINANCIAL AND OPERATING RESULTS
 Exhibit 99.1 MGM RESORTS INTERNATIONAL REPORTS SECOND QUARTER FINANCIAL AND OPERATING RESULTS Las Vegas, Nevada, August 2, 2018 MGM Resorts International (NYSE: MGM) ( MGM Resorts or the Company ) today
LD Micro Conference June 2017 FULL HOUSE RESORTS 1
 LD Micro Conference June 2017 FULL HOUSE RESORTS 1 Forward-looking Statements / Regulation G This presentation may contain statements that are "forward-looking statements" within the meaning of the safe
MGM Resorts International (Exact name of registrant as specified in its charter)
") UNITED STATES SECURITIES AND EXCHANGE COMMISSION Washington, D.C. 20549 FORM 8-K CURRENT REPORT PURSUANT TO SECTION 13 OR 15(d) OF THE SECURITIES EXCHANGE ACT OF 1934 Date of report (Date of earliest event
UNITED STATES SECURITIES AND EXCHANGE COMMISSION Washington, D.C. 20549 FORM 8-K CURRENT REPORT PURSUANT TO SECTION 13 OR 15(d) OF THE SECURITIES EXCHANGE ACT OF 1934 Date of report (Date of earliest event
MGM MIRAGE Reports Second Quarter Results
 NEWS RELEASE MGM MIRAGE Reports Second Quarter Results 8/5/2008 PRNewswire-FirstCall LAS VEGAS MGM MIRAGE (NYSE: MGM) today reported its second quarter 2008 financial results. The Company achieved 97%
MGM RESORTS INTERNATIONAL 4Q and FY 2016 Earnings Presentation
 MGM RESORTS INTERNATIONAL 4Q and FY 2016 Earnings Presentation February 16, 2017 Forward-Looking Statements Statements in this presentation that are not historical facts are forward-looking statements,
CLSA Asia Investor Forum. January, 2008
 CLSA Asia Investor Forum January, 2008 Forward Looking Statements This presentation contains forward-looking statements regarding operating trends, future results of operations and the completion of new
Management Presentation. March 2016
 Management Presentation March 2016 Forward looking statements This presentation as well as oral statements made by officers or directors of Allegiant Travel Company, its advisors and affiliates (collectively
MGM MIRAGE Reports Record Second Quarter Revenue, Cash Flow and Net Income
 NEWS RELEASE MGM MIRAGE Reports Record Second Quarter Revenue, Cash Flow and Net Income 7/24/2001 PRNewswire LAS VEGAS MGM MIRAGE (NYSE: MGG) today reported earnings of 47 cents per diluted share for the
Copa Holdings Reports Record Earnings of US$41.8 Million for 4Q06 and US$134.2 Million for Full Year 2006
 Copa Holdings Reports Record Earnings of US$41.8 Million for 4Q06 and US$134.2 Million for Full Year 2006 Panama City, Panama --- March 7, 2007. Copa Holdings, S.A. (NYSE: CPA), parent company of Copa
Spirit Airlines Reports First Quarter 2017 Results
 Spirit Airlines Reports First Quarter 2017 Results MIRAMAR, Fla., April 28, 2017 - Spirit Airlines, Inc. (NASDAQ: SAVE) today reported first quarter 2017 financial results. GAAP net income for the first
Management Presentation. November 2011
 Management Presentation November 2011 Forward looking statements This presentation as well as oral statements made by officers or directors of Allegiant Travel Company, its advisors and affiliates (collectively
Spirit Airlines Reports First Quarter 2018 Results
 Spirit Airlines Reports First Quarter 2018 Results MIRAMAR, Fla., April 26, 2018 - Spirit Airlines, Inc. (NYSE: SAVE) today reported first quarter 2018 financial results. For the first quarter 2018, Spirit
Spirit Airlines Reports Third Quarter 2017 Results
 Spirit Airlines Reports Third Quarter 2017 Results MIRAMAR, Fla., October 26, 2017 - Spirit Airlines, Inc. (NASDAQ: SAVE) today reported third quarter 2017 financial results. GAAP net income for the third
Management Presentation. September 2011
 Management Presentation September 2011 Forward looking statements This presentation as well as oral statements made by officers or directors of Allegiant Travel Company, its advisors and affiliates (collectively
Nomura Investor Forum December 2014
 Nomura Investor Forum December 2014 Forward Looking Statements This presentation contains forward-looking statements regarding operating trends, future results of operations and the completion of new projects,
MGM MIRAGE Reports Record Third Quarter Revenue, Cash Flow, and Net Income
 NEWS RELEASE MGM MIRAGE Reports Record Third Quarter Revenue, Cash Flow, and Net Income 10/18/2000 PRNewswire LAS VEGAS MGM MIRAGE (NYSE: MGG) today reported earnings of 42 cents per diluted share for
Crown Resorts Limited
 Crown Resorts Limited 2015 Full Year Results Presentation 13 August 2015 1 Crown Resorts Limited Results Overview Crown Resorts Limited (Crown) performance: Overall, the results for Crown s portfolio of
Spirit Airlines Reports Fourth Quarter and Full Year 2016 Results
 Spirit Airlines Reports Fourth Quarter and Full Year 2016 Results MIRAMAR, FL. (February 7, 2017) - Spirit Airlines, Inc. (NASDAQ: SAVE) today reported fourth quarter and full year 2016 financial results.
Management Presentation. November 2018
 Management Presentation November 2018 Forward looking statements This presentation as well as oral statements made by officers or directors of Allegiant Travel Company, its advisors and affiliates (collectively
MIRAMAR, Fla., April 29, 2015 (GLOBE NEWSWIRE) -- Spirit Airlines, Inc. (Nasdaq:SAVE) today reported first quarter 2015 financial results.
 -- Spirit Airlines, Inc. (Nasdaq:SAVE) today reported first quarter 2015 financial results.") April 29, 2015 Spirit Airlines Announces First Quarter 2015 Results; Adjusted Net Income Increases 87.1 Percent to $70.7 Million and Pre-Tax Margin Increases 900 Basis Points to 22.7 Percent MIRAMAR, Fla.,
April 29, 2015 Spirit Airlines Announces First Quarter 2015 Results; Adjusted Net Income Increases 87.1 Percent to $70.7 Million and Pre-Tax Margin Increases 900 Basis Points to 22.7 Percent MIRAMAR, Fla.,
Investor Relations Update January 25, 2018
 General Overview Investor Relations Update Accounting Changes On January 1, 2018, the company adopted two new Accounting Standard Updates: (ASUs): ASU 2014-9: Revenue from Contracts with Customers (the
Spirit Airlines Reports Second Quarter 2018 Results
 Spirit Airlines Reports Second Quarter 2018 Results MIRAMAR, Fla., July 25, 2018 - Spirit Airlines, Inc. (NYSE: SAVE) today reported second quarter 2018 financial results. GAAP net income for the second
AIR CANADA REPORTS 2010 THIRD QUARTER RESULTS; Operating Income improved $259 million or 381 per cent from previous year s quarter
 AIR CANADA REPORTS 2010 THIRD QUARTER RESULTS; Operating Income improved $259 million or 381 per cent from previous year s quarter MONTRÉAL, November 4, 2010 Air Canada today reported operating income
Investor Presentation
 MGM Resorts International Investor Presentation The MGM Resorts Investment Case July 27, 2017 Forward-Looking Statements Statements in this presentation that are not historical facts are forward-looking
Cowen 11 th Annual Global Transportation Conference
 Cowen 11 th Annual Global Transportation Conference September 5, 2018 Disclaimer This presentation contains forward-looking statements within the meaning of Section 27A of the Securities Act of 1933, as
Management Presentation. May 2013
 Management Presentation May 2013 Forward looking statements This presentation as well as oral statements made by officers or directors of Allegiant Travel Company, its advisors and affiliates (collectively
Fourth Quarter 2015 Financial Results
 Fourth Quarter 2015 Financial Results AerCap Holdings N.V. February 23, 2016 Disclaimer Incl. Forward Looking Statements & Safe Harbor This presentation contains certain statements, estimates and forecasts
Management Presentation. September 2015
 Management Presentation September 2015 Forward looking statements This presentation as well as oral statements made by officers or directors of Allegiant Travel Company, its advisors and affiliates (collectively
Management Presentation. August 2012
 Management Presentation August 2012 Forward looking statements This presentation as well as oral statements made by officers or directors of Allegiant Travel Company, its advisors and affiliates (collectively
FORWARD LOOKING STATEMENTS
 MARCH 2007 FORWARD LOOKING STATEMENTS This presentation contains statements regarding operating trends, future results, new projects, and other market, business and property trends that are forward-looking.
Forward Looking Statements
 October 2, 2012 Forward Looking Statements Certain information in this presentation may be considered forward-looking information within the meaning of the Private Securities Litigation Reform Act of 1995.
Spirit Airlines Reports Third Quarter 2015 Pre-Tax Margin of 26.9 Percent
 October 27, 2015 Spirit Airlines Reports Third Quarter 2015 Pre-Tax Margin of 26.9 Percent MIRAMAR, Fla., Oct. 27, 2015 (GLOBE NEWSWIRE) -- Spirit Airlines, Inc. (NASDAQ:SAVE) today reported third quarter
Great Portland Estates Trading Update Strong Operational Performance
 Press Release 6 July 2017 Great Portland Estates Trading Update Strong Operational Performance Great Portland Estates plc ( GPE ) today publishes its trading update for the quarter to 30 June 2017. Continued
CONTACT: Investor Relations Corporate Communications
 NEWS RELEASE CONTACT: Investor Relations Corporate Communications 435.634.3200 435.634.3553 Investor.relations@skywest.com corporate.communications@skywest.com SkyWest, Inc. Announces Second Quarter 2017
Spirit Overview & 2016 Priorities
 March 2016 Disclaimer Statements in this release and certain oral statements made from time to time by representatives of the Company contain various forward-looking statements within the meaning of Section
OPERATING AND FINANCIAL HIGHLIGHTS. Subsequent Events
 Copa Holdings Reports Net Income of $103.8 million and EPS of $2.45 for the Third Quarter of 2017 Excluding special items, adjusted net income came in at $100.8 million, or EPS of $2.38 per share Panama
Crown Resorts Limited
 Crown Resorts Limited 2016 Half Year Results Presentation 25 February 2016 1 Crown Resorts Limited Results Overview Crown Resorts Limited (Crown) performance: The 2016 First Half results across Crown s
CONTACT: Investor Relations Corporate Communications
 NEWS RELEASE CONTACT: Investor Relations Corporate Communications 435.634.3200 435.634.3553 Investor.relations@skywest.com corporate.communications@skywest.com SkyWest, Inc. Announces Fourth Quarter 2017
ISI Group Annual Conference February 15, 2011
 ISI Group Annual Conference February 15, 2011 CURRENT LAS VEGAS MARKET TRENDS (Full Year 2010) Visitation Up 2.7% Las Vegas Strip Gaming Revenues Up 4.1% Airline Passengers Down 1.8% Auto Traffic Up 3.1%
Management Presentation. November 2013
 Management Presentation November 2013 Forward looking statements This presentation as well as oral statements made by officers or directors of Allegiant Travel Company, its advisors and affiliates (collectively
44th Consecutive Profitable Quarter Fourth Quarter Fully Diluted Earnings per Share of $0.94 Full Year Fully Diluted Earnings per Share of $4.
 Allegiant Travel Company Fourth Quarter and Full Year 2013 Financial Results January 29, 2014 1:00 PM PT 44th Consecutive Profitable Quarter Fourth Quarter Fully Diluted Earnings per Share of $0.94 Full
ABX HOLDINGS, INC. Shareholders Meeting. May 13, 2008
 Shareholders Meeting May 13, 2008 1 1 1 Safe Harbor Statement Except for historical information contained herein, the matters discussed in this presentation contain forward-looking statements that involve
Analyst and Investor Conference Call Q Ulrik Svensson, CFO and Member of the Executive Board
 Analyst and Investor Conference Call Q2 2017 Ulrik Svensson, CFO and Member of the Executive Board Frankfurt, 2 August 2017 Disclaimer The information herein is based on publicly available information.
SkyWest, Inc. Announces First Quarter 2018 Profit
 NEWS RELEASE CONTACT: Investor Relations Corporate Communications 435.634.3200 435.634.3553 Investor.relations@skywest.com corporate.communications@skywest.com SkyWest, Inc. Announces First Quarter 2018
E190 REPLACEMENT & FLEET UPDATE JULY 11, 2018
 1 E190 REPLACEMENT & FLEET UPDATE JULY 11, 2018 SAFE HARBOR This presentation contains forward-looking statements within the meaning of the Private Securities Litigation Reform Act of 1995, Section 27A
10TH ANNUAL WOLFE RESEARCH GLOBAL TRANSPORTATION CONFERENCE MAY 23, 2017
 1 10TH ANNUAL WOLFE RESEARCH GLOBAL TRANSPORTATION CONFERENCE MAY 23, 2017 SAFE HARBOR This presentation contains forward-looking statements within the meaning of the Private Securities Litigation Reform
1Q 2017 EARNINGS PRESENTATION APRIL 25, 2017
 1 1Q 2017 EARNINGS PRESENTATION APRIL 25, 2017 SAFE HARBOR This presentation contains forward-looking statements within the meaning of the Private Securities Litigation Reform Act of 1995, Section 27A
Joe Randell President and Chief Executive Officer Jolene Mahody Executive Vice President and Chief Financial Officer
 Joe Randell President and Chief Executive Officer Jolene Mahody Executive Vice President and Chief Financial Officer Nathalie Megann Vice President, Investor Relations and Corporate Affairs December, 2015
Full House Resorts. Investor Presentation December 2018
 Full House Resorts Investor Presentation December 2018 Forward-looking Statements & Regulation G 2 This presentation may contain statements that are "forward-looking statements" within the meaning of the
ABX. Holdings, Inc. BB&T Transportation Conference. February 2008
 ABX Holdings, Inc. BB&T Transportation Conference February 2008 1 Safe Harbor Statement Except for historical information contained herein, the matters discussed in this presentation contain forward-looking
Financial Results 1 st Quarter Mar/2016 (FY2015) 30 July, 2015
 30 July, 2015") Financial Results Mar/2016 (FY2015) 30 July, 2015 Today s Topics P.2 P.3 P.15 1 Overview of FY Mar/2016 Financial Results Operating Revenue Operating Profit 320 307.0 +4.9Bn (+1.6%) 312.0 50 +17.6Bn (+94.6%)
Financial Results Mar/2016 (FY2015) 30 July, 2015 Today s Topics P.2 P.3 P.15 1 Overview of FY Mar/2016 Financial Results Operating Revenue Operating Profit 320 307.0 +4.9Bn (+1.6%) 312.0 50 +17.6Bn (+94.6%)
Spirit Airlines Reports Highest Second Quarter Pre-Tax Margin in Company History
 July 24, 2013 Spirit Airlines Reports Highest Second Quarter Pre-Tax Margin in Company History MIRAMAR, Fla., July 24, 2013 (GLOBE NEWSWIRE) -- Spirit Airlines, Inc. (Nasdaq:SAVE) today reported second
Investor Relations Update October 25, 2018
 General Overview Investor Relations Update Revenue The company expects its fourth quarter total revenue per available seat mile (TRASM) to be up approximately 1.5 to 3.5 percent year-over-year. Fuel Based
MARRIOTT INTERNATIONAL, INC. PRESS RELEASE SCHEDULES QUARTER 4, 2016 TABLE OF CONTENTS
 PRESS RELEASE SCHEDULES QUARTER 4, 06 TABLE OF CONTENTS Consolidated Statements of Income - As Reported A- Consolidated Statements of Income - Fourth Quarter Adjusted 06 Compared to Combined 05 A-3 Consolidated
Copa Holdings Reports Fourth Quarter and Full Year 2007 Results
 Copa Holdings Reports Fourth Quarter and Full Year 2007 Results Panama City, Panama --- February 21, 2008. Copa Holdings, S.A. (NYSE: CPA), parent company of Copa Airlines and Aero Republica, today announced
Copa Holdings Reports Net Income of US$51.9 Million for the Fourth Quarter of 2008 and US$152.2 Million for Full Year 2008
 Copa Holdings Reports Net Income of US$51.9 Million for the Fourth Quarter of 2008 and US$152.2 Million for Full Year 2008 Panama City, Panama --- February 19, 2009. Copa Holdings, S.A. (NYSE: CPA), parent
INVESTOR PRESENTATION. Imperial Capital Global Opportunities Conference September 2015
 INVESTOR PRESENTATION Imperial Capital Global Opportunities Conference September 2015 Forward-looking Statements This presentation contains forward-looking statements within the meaning of the Private
Ramsay Health Care Limited Results Briefing Half Year ended 31 December 2018
 Ramsay Health Care Limited Results Briefing Half Year ended 31 December 2018 Craig McNally, Group Managing Director & Bruce Soden, Group Finance Director 28 February 2019 ramsayhealth.com Agenda Group
Volaris Reports Strong First Quarter 2015: 32% Adjusted EBITDAR Margin, 9% Operating Margin
 Volaris Reports Strong First Quarter 2015: 32% Adjusted EBITDAR Margin, 9% Operating Margin Mexico City, Mexico, April 22, 2015 Volaris* (NYSE: VLRS and BMV: VOLAR), the ultra-low-cost airline serving
CONTACT: Investor Relations Corporate Communications
 NEWS RELEASE CONTACT: Investor Relations Corporate Communications 435.634.3200 435.634.3553 Investor.relations@skywest.com corporate.communications@skywest.com SkyWest, Inc. Announces Second Quarter 2016
The Manager Company Announcements Australian Stock Exchange Limited Sydney NSW Dear Sir. Demerger of BHP Steel
 The Manager Company Announcements Australian Stock Exchange Limited Sydney NSW 2000 Dear Sir Demerger of BHP Steel At the time of the announcement of the creation of the DLC between BHP Limited and Billiton
2014 J.P. Morgan Global High Yield & Leveraged Finance Conference February 26, 2014
 2014 J.P. Morgan Global High Yield & Leveraged Finance Conference February 26, 2014 MTGA Overview MTGA: Premier Tribal Gaming Operator High Quality Built to Last Gaming Assets Leading Market Share/Fair
First Quarter Results August 31 st, 2006
 First Quarter Results 2006-07 August 31 st, 2006 Key features of the First Quarter Market context Sustained global economic growth, and a recovery in Europe Average jet fuel price of 691 $/t, up 25% year-on-year
M2 Group Ltd 2014 Interim Results
 M2 Group Ltd 2014 Interim Results 24 February 2014 Geoff Horth, CEO Presentation Content Record Financial Performance Strong Organic Growth FY14 Priorities and Guidance Slide 2, 24 February 2014 Record
Deutsche Bank 2011 Leveraged Finance Conference Sarah Rogers - Investor Relations
 Deutsche Bank 2011 Leveraged Finance Conference Sarah Rogers - Investor Relations Las Vegas Indicators Improving (YTD through August 2011) Visitation +5% Average Daily Auto Traffic Flat McCarran Airport
Copa Holdings Reports Net Income of $49.9 million and EPS of $1.18 for the Second Quarter of 2018
 Copa Holdings Reports Net Income of $49.9 million and EPS of $1.18 for the Second Quarter of 2018 Panama City, Panama --- Aug 8, 2018. Copa Holdings, S.A. (NYSE: CPA), today announced financial results
WH Smith PLC Acquisition of InMotion providing access to the world s largest travel retail market 30 October 2018
 WH Smith PLC Acquisition of InMotion providing access to the world s largest travel retail market 30 October 2018 Transaction highlights WH Smith announces acquisition of InMotion for $198m ( 155 million)
OPERATING AND FINANCIAL HIGHLIGHTS
 Copa Holdings Reports Financial Results for the Fourth Quarter of 2015 Excluding special items, adjusted net income came in at $31.7 million, or EPS of $0.73 per share Panama City, Panama --- February
JAPAN AIRLINES Co., Ltd. Financial Results 1 st Quarter Mar/2017(FY2016) July 29, 2016
 July 29, 2016") JAPAN AIRLINES Co., Ltd. Financial Results Mar/2017(FY2016) July 29, 2016 Today s Topics P.1 P.2 P.13 From the first quarter of this fiscal year, figures for Revenue Passengers Carried, ASK, RPK and Load
JAPAN AIRLINES Co., Ltd. Financial Results Mar/2017(FY2016) July 29, 2016 Today s Topics P.1 P.2 P.13 From the first quarter of this fiscal year, figures for Revenue Passengers Carried, ASK, RPK and Load
American Airlines Group Reports Second-Quarter Profit
 NEWS RELEASE American Airlines Group Reports Second-Quarter Profit 7/28/2017 FORT WORTH, Texas American Airlines Group Inc. (NASDAQ:AAL) today reported its second-quarter 2017 results, including these
Copa Holdings Reports Net Income of $136.5 million and EPS of $3.22 for the First Quarter of 2018
 Copa Holdings Reports Net Income of $136.5 million and EPS of $3.22 for the First Quarter of 2018 May 9, 2018 PANAMA CITY, May 9, 2018 /PRNewswire/ -- Copa Holdings, S.A. (NYSE: CPA), today announced financial
Air Canada Reports 2016 Annual Results
 Air Canada Reports 2016 Annual Results Record annual EBITDAR (1) (excluding special items) of $2.768 billion Annual operating income of $1.345 billion Net income of $876 million and Adjusted net income
Copa Holdings Reports Net Income of $57.7 million and EPS of $1.36 for the Third Quarter of 2018
 Copa Holdings Reports Net Income of $57.7 million and EPS of $1.36 for the Third Quarter of 2018 November 14, 2018 PANAMA CITY, Nov. 14, 2018 /PRNewswire/ -- Copa Holdings, S.A. (NYSE: CPA), today announced
Half Year F1 Results. November 4, 2015
 Half Year F1 Results November 4, 2015 F17 Q1 Results 20 JULY 2016 Q1 BUSINESS HIGHLIGHTS Passenger growth of 18% to 5.8m pax on 17% seat growth Record underlying profit of 38.6m (+14%) despite Easter effect
OPERATING AND FINANCIAL HIGHLIGHTS
 Copa Holdings Reports Financial Results for the Fourth Quarter of 2018 Excluding special items, adjusted net profit came in at $44.0 million, or Adjusted EPS of $1.04 Panama City, Panama --- February 13,
Crown Limited Full Year Results Presentation 27th August 2009
 Crown Limited 2009 Full Year Results Presentation 27th August 2009 1 Crown Limited Overview Normalised 1 revenue up 6.8%, normalised EBITDA up 5.2%, normalised NPAT $280.7 million Australian casinos delivered