Revenue Per Available Room for Hawai i Hotels Grew 5.5 Percent in November Hotel Occupancy and Average Daily Rate Also Increased Year-Over-Year
|
|
|
- Gervais Walters
- 6 years ago
- Views:
Transcription
1 For Immediate Release: December 21, 2017 HTA Release (17-49) Revenue Per Available Room for Hawai i Hotels Grew 5.5 Percent in November 2017 Hotel Occupancy and Average Daily Rate Also Increased Year-Over-Year HONOLULU Hotels in the Hawaiian Islands earned more revenue per available room (RevPAR) in November at $190 (+5.5%) compared to a year ago, according to the Hawai i Hotel Performance Report released today by the Hawai i Tourism Authority (HTA). Additionally, both average daily rate (ADR) in November at $243 (+1.4%) and occupancy at 78.5 percent (+3 percentage points) grew year-over-year. HTA s Tourism Research Division issued the report s findings utilizing data compiled by STR, Inc., which conducts the largest and most comprehensive survey of hotel properties in the Hawaiian Islands. Jennifer Chun, HTA director of tourism research, commented, November was a good month for hotel properties as a whole, as RevPAR increased statewide and for each island county, most notably on the neighbor islands. These across-the-board increases help support jobs and families in each county and generate increased state tax revenue, which ultimately helps to fund community needs statewide. The biggest eye-opener for November were the impressive results reported for Midscale and Economy Class hotels, with RevPAR jumping by 18.4 percent and occupancy by 10.1 percent. That kind of increase in occupancy is phenomenal considering that tourism in Hawai i has been thriving in recent years. It s a sign the industry did an effective job in attracting price-conscious travelers, especially to O ahu where the increase in occupancy was 12.9 percent. Year-to-date, hotel properties on the island of Hawai i and Kaua i continue to report the strongest rate of growth in both RevPAR and occupancy. Occupancy for Kaua i hotels has risen to 76.8 percent and for hotels on the island of Hawai i to 74.3 percent, meaning the gap between these islands with hotel occupancies on O ahu and Maui has closed considerably this year. As seen in the accompanying tables, all classes of hotel properties in Hawai i earned more per available room in November compared to a year ago. Midscale and Economy Class hotels charted the highest RevPAR growth statewide for November to $111 (+18.4%), boosted by growth in both occupancy at 79.1 percent (+10.1 percentage points) and ADR at $140 (+3.3%). Upper Upscale Class properties statewide achieved the highest occupancy rate at 83.6 percent (+1.2 percentage points) in November, however, ADR for this class of hotel properties remained unchanged from a year ago. All four island counties in Hawai i achieved higher RevPAR in November year-over-year. Hotels in Maui County recorded the highest RevPAR at $236 (+6.5%), supported by growth in both ADR to $314 (+4.7%) and occupancy at 75.2 percent (+1.2 percentage points). Kaua i hotels earned the largest gain in RevPAR to $168 (+13%) in November, boosted by increases in ADR to $232 (+4.2%) and occupancy at 72.5 percent (+5.6 percentage points). Hotels on the island of Hawai i achieved the highest rate of growth in occupancy at 73.2 percent, up 10.8 percentage points, in November. This drove the island s RevPAR growth to $167 (+12.9%), despite the ADR declining to $228 (-3.8%).
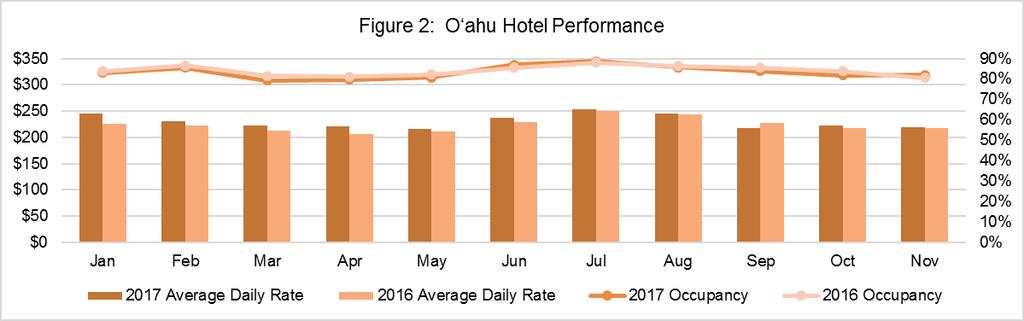
2 Page 2 O ahu hotels reported a small increase in RevPAR to $180 (+2.3%), with modest growth in occupancy at 82.1 percent (+1.5 percentage points) offsetting flat ADR of $219 (+0.4%). Waikīkī hotels performed similarly to last November. Hotels in Hawai i s luxury resort areas performed well in November compared to a year ago, with Wailea leading the state in RevPAR to $409 (+13.2%), ADR to $489 (+7.5%), and occupancy at 83.8 percent (+4.2 percentage points ). The Lahaina-Kā anapali-kapalua resort area reported growth in RevPAR to $194 (+4.4%) and ADR to $258 (+2.6%), with occupancy at 75.1 percent (+1.3 percentage points). The Kohala Coast resort area reported strong growth in RevPAR to $231 (+8.5%), driven by an increase in occupancy at 69.6 percent (+6 percentage points), which offset a slight dip in ADR to $333 (-0.9%). Year-to-Date 2017 Year-to-date through November, Hawai i hotels statewide reported growth in RevPAR to $208 (+5.7%), ADR to $259 (+4.2%) and occupancy at 80.2 percent (up 1.1 percentage points). Through the first 11 months of the year, Luxury Class hotels achieved the strongest overall results of all hotel classes, with increases in RevPAR to $384 (+7.3%), ADR to $506 (+4.8%) and occupancy at 75.7 percent (+1.8 percentage points). Midscale and Economy Class hotels also reported a strong increase in RevPAR to $117 (+5.8%), supported by growth in ADR to $151 (+3.2%) and occupancy at 77.6 percent (+1.9 percentage points). Tables of hotel performance statistics, including data presented in the news release are available for viewing online at: About the Hawai i Hotel Performance Report The Hawai i Hotel Performance Report is produced using hotel survey data compiled by STR, Inc., the largest survey of its kind in Hawai i. The survey generally excludes properties with under 20 lodging units, such as small bed and breakfasts, youth hostels, single-family vacation rentals, cottages, individually rented vacation condominiums and sold timeshare units no longer available for hotel use. The data has been weighted both geographically and by class of property to compensate for any over and/or under representation of hotel survey participants by location and type. For November 2017, the survey included 165 properties representing 48,788 rooms, or 90.4 percent of all lodging properties with 20 rooms or more in the Hawaiian Islands, including full service, limited service, and condominium hotels. ###
3 Page 3 About the Hawai i Tourism Authority The Hawai i Tourism Authority is responsible for strategically managing the State of Hawai i s marketing initiatives to support tourism. HTA s goal is to optimize tourism s benefits for Hawai i, while being attentive to the interests of travelers, the community and visitor industry. Established in 1998 to support Hawai i s leading industry and largest employer, HTA continually strives to help ensure the sustainability of tourism s success. For more information about HTA, please visit Follow updates about HTA on Facebook, Twitter (@HawaiiHTA) and its YouTube Channel. For more information, contact: Charlene Chan Director of Communications Hawai i Tourism Authority (808) Charlene@gohta.net Jennifer Chun Director of Tourism Research Hawai i Tourism Authority (808) Jennifer@gohta.net Patrick Dugan Anthology Marketing Group (808) /(808) Patrick.Dugan@AnthologyGroup.com Erin Kinoshita Anthology Marketing Group (808) /(808) Erin.Kinoshita@AnthologyGroup.com
4 Page 4 Month of November 2017 Occupancy % Average Daily Rate RevPAR Percentage Pt. Change % Change % Change State of Hawai i 78.5% 75.5% 3.0% $ $ % $ $ % Luxury Class 74.9% 72.0% 2.9% $ $ % $ $ % Upper Upscale Class 83.6% 82.4% 1.2% $ $ % $ $ % Upscale Class 73.2% 70.7% 2.6% $ $ % $ $ % Upper Midscale Class 78.8% 74.2% 4.6% $ $ % $ $ % Midscale & Economy Class 79.1% 69.0% 10.1% $ $ % $ $ % O ahu 82.1% 80.6% 1.5% $ $ % $ $ % Waikīkī 83.2% 82.7% 0.4% $ $ % $ $ % Other O ahu 75.6% 68.2% 7.4% $ $ % $ $ % O ahu Luxury 72.8% 68.1% 4.7% $ $ % $ $ % O ahu Upper Upscale 88.3% 88.5% -0.3% $ $ % $ $ % O ahu Upscale 74.8% 77.1% -2.3% $ $ % $ $ % O ahu Upper Midscale 80.7% 77.7% 3.0% $ $ % $ $ % O ahu Midscale & Economy 84.9% 72.0% 12.9% $ $ % $ $ % Maui County 75.2% 73.9% 1.2% $ $ % $ $ % Wailea 83.8% 79.6% 4.2% $ $ % $ $ % Lahaina/Kā anapali/kapalua 75.1% 73.8% 1.3% $ $ % $ $ % Other Maui County 75.3% 74.1% 1.1% $ $ % $ $ % Maui County Luxury 74.2% 74.9% -0.7% $ $ % $ $ % Maui County Upper Upscale & 76.3% 74.1% 2.2% $ $ % $ $ % Upscale Island of Hawai i 73.2% 62.4% 10.8% $ $ % $ $ % Kohala Coast 69.6% 63.6% 6.0% $ $ % $ $ % Kaua i 72.5% 66.9% 5.6% $ $ % $ $ % Source: STR, Inc. Copyright 2017 Hawai i Tourism Authority Note: Samples for Maui Upper Midscale, Midscale and Economy Classes were insufficient for reporting purposes, but these data are included in Maui and statewide totals.

5 Page 5 Year to Date November 2017 Occupancy % Average Daily Rate RevPAR Percentage Pt. Change % Change % Change State of Hawai i 80.2% 79.1% 1.1% $ $ % $ $ % Luxury Class 75.7% 74.0% 1.8% $ $ % $ $ % Upper Upscale Class 85.8% 85.2% 0.6% $ $ % $ $ % Upscale Class 75.3% 73.8% 1.5% $ $ % $ $ % Upper Midscale Class 81.3% 80.5% 0.8% $ $ % $ $ % Midscale & Economy Class 77.6% 75.7% 1.9% $ $ % $ $ % O ahu 83.4% 84.1% -0.7% $ $ % $ $ % Waikīkī 84.6% 85.6% -1.0% $ $ % $ $ % Other O ahu 76.3% 74.6% 1.7% $ $ % $ $ % O ahu Luxury 72.0% 72.1% -0.1% $ $ % $ $ % O ahu Upper Upscale 89.3% 89.4% -0.1% $ $ % $ $ % O ahu Upscale 77.9% 80.8% -2.9% $ $ % $ $ % O ahu Upper Midscale 83.5% 83.6% 0.0% $ $ % $ $ % O ahu Midscale & Economy 81.9% 80.1% 1.8% $ $ % $ $ % Maui County 77.3% 76.0% 1.3% $ $ % $ $ % Wailea 84.9% 80.9% 4.0% $ $ % $ $ % Lahaina/Kā anapali/kapalua 77.7% 76.9% 0.9% $ $ % $ $ % Other Maui County 76.7% 74.9% 1.8% $ $ % $ $ % Maui County Luxury 75.9% 75.1% 0.8% $ $ % $ $ % Maui County Upper Upscale & 78.7% 76.7% 2.0% $ $ % $ $ % Upscale Island of Hawai i 74.3% 68.3% 6.0% $ $ % $ $ % Kohala Coast 73.4% 70.2% 3.2% $ $ % $ $ % Kaua i 76.8% 72.8% 4.0% $ $ % $ $ % Source: STR, Inc. Copyright 2017 Hawai i Tourism Authority Note: Samples for Maui Upper Midscale, Midscale and Economy Classes were insufficient for reporting purposes, but these data are included in Maui and statewide totals.
6 Page 6
7 Page 7
Hawai i Hotels Statewide Averaged RevPAR of $252, ADR of $294 and Occupancy of 85.6% in February
 For Immediate Release: March 28, 2018 HTA Release (18-18) Hawai i Hotels Statewide Averaged RevPAR of $252, ADR of $294 and Occupancy of 85.6 in February RevPAR, ADR and Occupancy Increased for All Hotel
Hawai i Hotels Statewide Set New Annual Records in 2017 for Revenue Per Available Room and Average Daily Rate
 For Immediate Release: January 25, 2018 HTA Release (18-11) Hawai i Hotels Statewide Set New Annual Records in 2017 for Revenue Per Available Room and Average Daily Rate Statewide Average Daily Rate Rose
Hawai i Hotels Statewide Led U.S. Markets in RevPAR ($229) and ADR ($280) in First Half of 2018
 and ADR ($280) in First Half of 2018") For Immediate Release: July 26, 2018 HTA Release (18-40) Hawai i Hotels Statewide Led U.S. Markets in RevPAR ($229) and ADR ($280) in First Half of 2018 HONOLULU Hawai i hotels statewide recorded the highest
For Immediate Release: July 26, 2018 HTA Release (18-40) Hawai i Hotels Statewide Led U.S. Markets in RevPAR ($229) and ADR ($280) in First Half of 2018 HONOLULU Hawai i hotels statewide recorded the highest
Hawai i Visitor Spending Increased 4.8 Percent to $1.66 Billion in July 2018
 For Immediate Release: August 30, 2018 HTA Release (18-51) Hawai i Visitor Spending Increased 4.8 Percent to $1.66 Billion in July 2018 HONOLULU Visitors to the Hawaiian Islands spent a total of $1.66
HAWAI I TOURISM INDUSTRY SET NEW RECORDS IN 2016 $15.6 BILLION IN VISITOR SPENDING; 8.9 MILLION ARRIVALS
 For Immediate Release: January 30, 2017 HTA Release (17-04) HAWAI I TOURISM INDUSTRY SET NEW RECORDS IN 2016 $15.6 BILLION IN VISITOR SPENDING; 8.9 MILLION ARRIVALS HONOLULU Hawai i s tourism industry
Hawai i Visitor Spending Rose 9 Percent in April 2017 Four Largest Visitor Markets Reported Growth in Spending and Arrivals
 For Immediate Release: May 25, 2017 HTA Release (17-16) Hawai i Visitor Spending Rose 9 Percent in April 2017 Four Largest Visitor Markets Reported Growth in Spending and Arrivals HONOLULU Visitors spent
Hawai i Timeshare Quarterly April - June 2018
 Statewide Timeshare Performance & es During the second quarter of 2018, Hawai i s timeshare industry achieved an 91.5% occupancy rate, an increase of 1.6 percentage points compared with the same period
Hawai i Timeshare Quarterly July - September 2018
 Statewide Timeshare Performance & es During the third quarter of 2018, Hawai i s timeshare industry achieved an 90.1% occupancy rate, unchanged compared with the same period during 2017. The statewide
2013 Annual Visitor Research Report
 2013 Annual Visitor Research Report Aloha, On behalf of the Hawai i Tourism Authority (HTA), the state agency for tourism, we are pleased to present the 2013 Annual Visitor Research Report. This report
MARKET INSIGHTS UPDATE North America
 SPOTLIGHT ON: THE SHOULDER TRAVEL SEASON PG2 A monthly update including relevant information on travel industry trends, consumer and meetings market research, competitive intelligence, and Hawai i s performance
Occupancy in North Carolina
 Smith Travel Research Year-End 2009 Lodging Report Year-end 2009 hotel/motel occupancy was down -9.0% statewide from 2008. This represents a decrease of -12.2% since 2005. o The US occupancy was down -8.6%
A RECORD 8.3 MILLION VISITORS CAME TO HAWAI I IN 2014 TOTAL VISITOR EXPENDITURES GREW TO $14.7 BILLION
 For Immediate Release: January 29, 2015 HTA Release (15-03) A RECORD 8.3 MILLION VISITORS CAME TO HAWAI I IN 2014 TOTAL VISITOR EXPENDITURES GREW TO $14.7 BILLION HONOLULU A total of 8,282,680 visitors
TOTAL VISITOR EXPENDITURES FOR JANUARY 2015 DECREASED 2.5 PERCENT TO $1.4 BILLION
 For Immediate Release: February 26, 2015 HTA Release (15-05) TOTAL VISITOR EXPENDITURES FOR 2015 DECREASED 2.5 PERCENT TO $1.4 BILLION Total Visitor Days Rose Slightly Compared to January 2014 HONOLULU
TOTAL VISITOR EXPENDITURES IN JULY 2013 ($1.3 BILLION) WAS SIMILAR TO A YEAR AGO WHILE ARRIVALS ROSE 4.6 PERCENT
 WAS SIMILAR TO A YEAR AGO WHILE ARRIVALS ROSE 4.6 PERCENT") For Immediate Release: August 29, 2013 HTA Release (13-27) TOTAL VISITOR EXPENDITURES IN 2013 ($1.3 BILLION) WAS SIMILAR TO A YEAR AGO WHILE ARRIVALS ROSE 4.6 PERCENT HONOLULU Visitors who came to Hawai
For Immediate Release: August 29, 2013 HTA Release (13-27) TOTAL VISITOR EXPENDITURES IN 2013 ($1.3 BILLION) WAS SIMILAR TO A YEAR AGO WHILE ARRIVALS ROSE 4.6 PERCENT HONOLULU Visitors who came to Hawai
TOTAL VISITOR EXPENDITURES DECREASED 2.2 PERCENT IN APRIL 2014 AND 2.9 PERCENT IN THE FIRST FOUR MONTHS OF 2014
 For Immediate Release: May 29, 2014 HTA Release (14-16) TOTAL VISITOR EXPENDITURES DECREASED 2.2 PERCENT IN 2014 AND 2.9 PERCENT IN THE FIRST FOUR MONTHS OF 2014 HONOLULU Total expenditures by visitors
Measures & Projections October 31, GoToBermuda.com
 Measures & Projections October 31, 2015 GoToBermuda.com October Total Vacation Visitor Arrivals Vacation Arrivals Oct-14 Oct-15 2015 Air Vacation 9,203 10,344 1,141 12.40 126,842 127,044 202 0.16 Cruise
EU Report. Europe APRIL 2016
 H EU Report Europe APRIL 2016 ANALYSIS OF HOTEL RULTS APRIL 2016 Europe's hotel industry improves overall, despite a deepening gap Across the continent, the month of April allowed hoteliers to post the
Total Visitor Expenditures Grew 3 percent to $1.3 Billion
 For Immediate Release: May 8, 2015 HTA Release (15-07) TOTAL VISITOR ARRIVALS ROSE 7 PERCENT COMPARED TO 2014 Total Visitor Expenditures Grew 3 percent to $1.3 Billion HONOLULU Total visitor arrivals to
EU Report. Europe JANUARY 2017
 H EU Report Europe JANUARY 2017 ANALYSIS OF HOTEL RESULTS JANUARY 2017 Overall improvement in the European hospitality industry The European industry starts the year on a positive note, with indicators
Year-to-Date Total Expenditures and Visitor Arrivals Remained Ahead of Last Year
 For Immediate Release: November 27, 2013 HTA Release (13-35) 2013 TOTAL VISITOR EXPENDITURES AND ARRIVALS DECLINED FOR THE SECOND MONTH Year-to-Date Total Expenditures and Visitor Arrivals Remained Ahead
EU Report. Europe JANUARY 2019
 H EU Report Europe JANUARY 2019 ANALYSIS OF HOTEL RESULTS JANUARY 2019 A cloud on the horizon for European hoteliers The year is off to a slow start for European hoteliers who post less encouraging results
Is NYC coming back sooner than we think?
 Research Is NYC coming back sooner than we think? 23 AUGUST 2016 7:26 AM New York City and its Manhattan submarket could rebound sooner than expected with the amount of foreign capital coming in and a
EU Report. Europe APRIL 2017
 H EU Report Europe APRIL 2017 ANALYSIS OF HOTEL RULTS APRIL 2017 hospitality has the wind in its sails Despite slower growth than the previous month, hospitality figures are still pretty good, with 4.3%
Year-to-Date Total Visitor Expenditures and Arrivals Continued to Exceed Last Year
 For Immediate Release: December 27, 2013 HTA Release (13-36) TOTAL VISITOR EXPENDITURES AND ARRIVALS FOR 2013 DECREASED FOR THE THIRD CONSECUTIVE MONTH Year-to-Date Total Visitor Expenditures and Arrivals
EU Report. Europe APRIL 2018
 H EU Report Europe APRIL 2018 ANALYSIS OF HOTEL RULTS APRIL 2018 The business supply in full expansion in Europe s hotel industry For the fourth consecutive month, the hotel business recorded an increase
Lodging Industry Overview. 14 December Bobby Bowers Smith Travel Research / STR Global
 Lodging Industry Overview 14 December 2011 Bobby Bowers Smith Travel Research / STR Global Global / U.S. Overview Key U.S. Markets Construction Pipeline Forecast Takeaways Today s Agenda RevPar Growth
EU Report. Europe JULY 2018
 H EU Report Europe JULY 2018 ANALYSIS OF HOTEL RULTS JULY 2018 Europe's hotels show timid growth After a month of June marked by improved hotel results, Europe's summer shows less significant growth. Driven
Tourism Report Spring A Report Prepared by the Sonoma County Economic Development Board. Ben Stone, Director
 Tourism Report Spring A Report Prepared by the Sonoma County Economic Development Board Ben Stone, Director Though long renowned for its picturesque scenery, Sonoma County has steadily gained recognition
MARRIOTT INTERNATIONAL, INC. PRESS RELEASE SCHEDULES QUARTER 4, 2016 TABLE OF CONTENTS
 PRESS RELEASE SCHEDULES QUARTER 4, 06 TABLE OF CONTENTS Consolidated Statements of Income - As Reported A- Consolidated Statements of Income - Fourth Quarter Adjusted 06 Compared to Combined 05 A-3 Consolidated
FOR IMMEDIATE RELEASE. Contact: Roy Catalani Young Brothers (808)
") FOR IMMEDIATE RELEASE 1 Contact: Roy Catalani Young Brothers (808) 543-9409 rcatalani@htbyb.com Kirra Downing DTL Hawai i (808) 292-7100 kirra@dtlhawaii.com Young Brothers Reports Intrastate Cargo Volumes
FOR IMMEDIATE RELEASE 1 Contact: Roy Catalani Young Brothers (808) 543-9409 rcatalani@htbyb.com Kirra Downing DTL Hawai i (808) 292-7100 kirra@dtlhawaii.com Young Brothers Reports Intrastate Cargo Volumes
Tourism Snapshot. A focus on the markets that the CTC and its partners are active in. July 2011 Volume 7, Issue 7.
 Tourism Snapshot Echo Valley Ranch and Spa, British Columbia A focus on the markets that the CTC and its partners are active in www.canada.travel/corporate July 2011 Volume 7, Issue 7 Key highlights In
Panama City Beach Travel Market Economic Impact Report. Prepared for: Panama City Beach Convention & Visitors Bureau
 Panama City Beach 2016 Travel Market Economic Impact Report Presented by: Berkeley Young, President Young Strategies, Inc. Data Analysis: Larry D. Gustke, PhD Steve Morse, PhD Prepared for: Panama City
2013 Visitor Profile & Impact Report
 2013 Visitor Profile & Impact Report Berkeley Young, President Larry D. Gustke, PhD Young Strategies, Inc. YOUR LOGO PCB LODGING MARKET PCB Lodging That Reports to STR Holiday Inn Resort Panama City Beach
MARKET INSIGHTS UPDATE
 SPOTLIGHT ON: Photo courtesy of Hawai i Tourism Authority (HTA) A monthly update including relevant information on travel industry trends, consumer and meetings market research, competitive intelligence,
PREFERRED HOTELS & RESORTS
 PREFERRED HOTELS & RESORTS SUMMARY Using data provided by STR Analytics, HVS evaluated the performance of the 72 hotels affiliated with (PHR) in North America. The study focused on the performance of the
Press Release. First-Quarter 2005 Revenues : First quarter 2005 confirms a good overall trend : +5.6%
 Press Release First-Quarter 2005 Revenues : First quarter 2005 confirms a good overall trend : +5.6% Paris, April 27 th, 2005 (In EUR millions) 2004 2004 2005 % Change % Change reported IFRS IFRS reported
Coast to coast. STR Coastal Town Review Coastal Towns Market Review Report_JE.indd 3
 Coast to coast. STR Coastal Town Review 16 Coastal Towns Market Review Report_JE.indd 3 4//17 8:31:38 AM Table of Contents Introduction...3 United Kingdom...4 Blackpool...6 Bournemouth...8 Brighton...
China Lodging Group (HTHT.US) Q Earnings March 15, 2017
 Q Earnings March 15, 2017") China Lodging Group (HTHT.US) Q4 2016 Earnings March 15, 2017 Agenda Strategy Review Acquisition of Crystal Orange Hotel Operational and Financial Review Q & A Appendix 1 What We Have Achieved in 2016
China Lodging Group (HTHT.US) Q4 2016 Earnings March 15, 2017 Agenda Strategy Review Acquisition of Crystal Orange Hotel Operational and Financial Review Q & A Appendix 1 What We Have Achieved in 2016
PART II. Authors: Agnes DeFranco, Ed.D., CHAE Arlene Ramirez, CHE, CHAE Tanya Venegas, MBA, MHM, CHIA
 PART II AN ANALYSIS OF IT SPENDING DATA IN THE LODGING INDUSTRY BASED ON REPORTING IN THE NEW USALI SCHEDULE 6 INFORMATION AND TELECOMMUNICATIONS SYSTEMS. THIS REPORT COMPARES SPENDING DATA OVER A THREE
The Economic Impact of Tourism in Hillsborough County. July 2017
 The Economic Impact of Tourism in Hillsborough County July 2017 Table of contents 1) Key Findings for 2016 3 2) Local Tourism Trends 7 3) Trends in Visits and Spending 12 4) The Domestic Market 19 5) The
THE LODGING INDUSTRY. Standard 2: Objective 1 Hospitality and Tourism Marketing
 Standard 2: Objective 1 Hospitality and Tourism Marketing THE LODGING INDUSTRY Click here to play 25 Wackiest and Most Unique Hotels on Earth on YouTube Evolution of the Hotel INN Ancestor to the hotel
China Lodging Group (HTHT.US) Q Earnings Call August 17, 2017
 Q Earnings Call August 17, 2017") China Lodging Group (HTHT.US) Q2 2017 Earnings Call August 17, 2017 Agenda Lodging Landscape in China Strategy Review Operational and Financial Review Q & A Appendix 1 Strong Demand: Domestic Travel Remains
China Lodging Group (HTHT.US) Q2 2017 Earnings Call August 17, 2017 Agenda Lodging Landscape in China Strategy Review Operational and Financial Review Q & A Appendix 1 Strong Demand: Domestic Travel Remains
Third Quarter Marketing Report B R A N SON/LAKES A R EA C VB N OVEMBER, 2013
 Third Quarter Marketing Report B R A N SON/LAKES A R EA C VB N OVEMBER, 2013 Economic Outlook +5.1% from July 2011 Consumer Confidence is Up 7% This Year Increasing from 66.7 in Dec to 71.2 Today +6.7%
Visit Loudoun 2016 Lodging Market Research
 2016 Lodging Market Research Prepared for: Loudoun County Lodging Market Research & Analysis Study Conducted: November December 2016 Final Report Submitted: December 2016 2016 Lodging Market Analysis Summary
EU Report. Europe AUGUST 2017
 H EU Report Europe AUGUST 2017 ANALYSIS OF HOTEL RULTS AUGUST 2017 hospitality is soaring After a vibrant month of July, August has confirmed that the hospitality sector is sailing on particularly strong
MENA HOTEL MARKET REVIEW MUSCAT OMAN 2018
 MENA HOTEL MARKET REVIEW MUSCAT OMAN 2018 www.trimideast.com 1 OMR (billion) MENA HOTEL MARKET REVIEW MUSCAT OMAN 2018 OMAN ECONOMIC OVERVIEW Oman s economy continues to be heavily reliant on hydrocarbons,
2014 Spring Marketing Update. Presented by Ashlee Galea Country Manager Australia
 2014 Spring Marketing Update Presented by Ashlee Galea Country Manager Australia 2014 SPRING MARKETING UPDATE Presentation Overview 2013 RECAP 2014 MARKET CONDITIONS MARKET INSIGHTS AIRLIFT UPDATE 2014
SLOW BUT SUSTAINED GROWTH FOR 2014 FORECASTS REMAIN POSITIVE FOR THE HOTEL SECTOR, WITH A CAUTIOUS EYE TOWARDS CONSTRUCTION
 HOTEL MARKET REPORT: 4Q2013 SLOW BUT SUSTAINED GROWTH FOR 2014 FORECASTS REMAIN POSITIVE FOR THE HOTEL SECTOR, WITH A CAUTIOUS EYE TOWARDS CONSTRUCTION DEMAND: Demand trends continue to slow, but remain
Hospitality Market Snapshot Nairobi & Its Suburbs. June 2016
 Hospitality Market Snapshot Nairobi & Its Suburbs June 2016 Kenya Nairobi In this issue 3 Nairobi Economic Overview Current Room Supply & Outlook 3 4 4 4 5 CBD 6 Westlands & Surrounds & Surrounds 7 Upper
Hertfordshire Business Barometer April 2018
 Hertfordshire Business Barometer April 1 Contents Summary of findings 3 Marketing update 4 Visitor Attractions: monthly performance 6 Serviced Accommodation: monthly performance 10 Other news: national
OREGON S TRAVEL & TOURISM INDUSTRY OVERVIEW
 OREGON S TRAVEL & TOURISM INDUSTRY OVERVIEW WHO IS OREGON S TRAVEL & TOURISM INDUSTRY? 105,600 OREGONIANS DIRECTLY EMPLOYED* Restaurants, hotels, wineries, attractions, guiding & outfitter businesses,
CAPE TOWN ACCOMMODATION Performance Review & Forecast Report January 2018
 CAPE TOWN ACCOMMODATION Performance Review & Forecast Report January 2018 www.capetown.travel +27 (0)861 322 223 info@capetown.travel Report compiled in cooperation with Cape Town Tourism members INSIDE
Destination Marketing and the Lodging Industry STANDARD 2
 Destination Marketing and the Lodging Industry STANDARD 2 Marketing The process of developing, promoting, and distributing products to satisfy customers needs and wants. It is a series of activities that
EU Report. Europe SEPTEMBER 2018
 H EU Report Europe SEEMR 2018 ANALYSIS OF HOTEL RULTS SEEMR 2018 An Indian summer for hotels Hospitality activity is good this Fall 2018, confirming the stability of all destinations since the beginning
CARIBBEAN TRENDS IN THE HOTEL INDUSTRY TWELFTH EDITION SAMPLE
 CARIBBEAN TRENDS IN THE HOTEL INDUSTRY TWELFTH EDITION - 2017 Maps Table of Contents Map of the Caribbean Region 5 One Step Back 6 Caribbean Hospitality Industry Updates Airbnb in the Caribbean 8 How Currency
Panama City Beach CVB Travel Market Preliminary Report. Prepared for: Panama City Beach Convention & Visitors Bureau
 Panama City Beach CVB 2017 Travel Market Preliminary Report Prepared for: Panama City Beach Convention & Visitors Bureau Presented by: Berkeley Young, President Young Strategies, Inc. Larry D. Gustke,
Metropolitan Boston February 2015
 33 Arch Street, 28 th Floor Boston, MA 02110 Telephone (617) 488-7291 Fax (617) 912-7001 Metropolitan Boston February 2015 Boston Area Roundup The greater Boston area hotels reported significantly increased
The Economic Impact of Tourism in Hillsborough County, June 2018
 The Economic Impact of Tourism in Hillsborough County, 2017 June 2018 Table of contents 1) Key Findings for 2017 3 2) Local Tourism Trends 7 3) Trends in Visits and Spending 12 4) The Domestic Market 19
EU Report. Europe OCTOBER 2015
 H EU Report Europe OCTOR 2015 ANALYSIS OF HOTEL RULTS OCTOR 2015 Europe's hotel industry pursues growth While the hotel business has remained dynamic in most countries in October thanks to the organization
Quarterly Report Doha Hotels Q Doha Q Review. Hotel Market
 Quarterly Report Doha Hotels Q2 2016 Doha Q2 2016 Review Hotel Market Doha SUPPLY Doha saw an influx of 538 hotel keys in Q2 2016. The most recent openings included properties such as the Moevenpick Al
FALL STATEWIDE PULSE. Category % +/- A Quarterly Travel Barometer February-March 2002 INSIDE THIS ISSUE
 A Quarterly Travel Barometer February-March 2002 FALL STATEWIDE PULSE Statewide travel indicators for the season (September-November) are included in the following table. Fall trends for the last 3-5 years
Tourism Snapshot A focus on the markets that the CTC and its partners are active in Ontario June 2011 Volume 7, Issue 6
 Tourism Snapshot Ontario A focus on the markets that the CTC and its partners are active in www.canada.travel/corporate June 2011 Volume 7, Issue 6 Key highlights In June 2011, overnight travel to Canada
Tourism Snapshot. A focus on the markets in which the CTC and its partners are active. October 2012 Volume 8, Issue 10.
 Tourism Snapshot Niagara Helicopters Tour A focus on the markets in which the CTC and its partners are active www.canada.travel/corporate October 2012 Volume 8, Issue 10 Total arrivals from CTC s international
Holiday visitation grew 8.6% to a record 41.7m visitors, who spent a record $29.6bn, up 8.4% year on year.
 Domestic overnight visitors within Australia Interstate 33,58,000 8.0% 4.7-0.1 Holiday 11,95,000 8.% 5.5 0.0 Business 10,73,000 1.3% 3.2-0.1 VFR 10,452,000 2.% 4.9-0.1 Domestic travel continues to break
CAPE TOWN ACCOMMODATION Performance Review & Forecast Report December 2018
 CAPE TOWN ACCOMMODATION Performance Review & Forecast Report December 2018 www.capetown.travel +27 (0)861 322 223 info@capetown.travel Report compiled in cooperation with Cape Town Tourism members INSIDE
Kent Business Barometer December 2018
 Kent Business Barometer December Q4 1 Contents BREXIT- Business sentiment 3 Summary of findings 4 Marketing update 5 Visitor Attractions: monthly performance 7 Visitor Attractions: quarterly performance
Hotel Association of North Texas. Karrie Keen Director, Destination and Trend Operations
 Hotel Association of North Texas Karrie Keen Director, Destination and Trend Operations To view this presentation, go to HotelNewsNow.com and click on Industry Analysis then Hotel data presentations. Agenda
Tourism snapshot Canadian Tourism Commission
 Canadian Tourism Commission Commission canadienne du tourisme Tourism snapshot www.canada.travel A focus on the markets that the CTC and its partners are active in Volume 5, Issue 04 Key highlights Following
Asset Manager s Report to the DRA Board
 Asset Manager s Report to the DRA Board March 2013 HILTON VANCOUVER WASHINGTON DASHBOARD SUMMARY MARCH 2013 1 PERFORMANCE RELATIVE TO THE COMPETITIVE SET The following table summarizes the Hotel s revenue
The Economic Impact of Tourism on Galveston Island, Texas Analysis
 The Economic Impact of Tourism on Galveston Island, Texas 2012 Analysis Headline Results Headline results Tourism is a significant contributor to business sales, employment, and taxes on Galveston Island.
Atlantic City Tourism Performance Indicators (AC-TPI) 2014 Year End
 2014 Year End") Atlantic City Tourism Performance Indicators (AC-TPI) 2014 Year End Prepared by Brian J. Tyrrell, Ph.D. Supported by Israel Posner, Ph.D. Executive Director Atlantic City Tourism Performance Indicators
Atlantic City Tourism Performance Indicators (AC-TPI) 2014 Year End Prepared by Brian J. Tyrrell, Ph.D. Supported by Israel Posner, Ph.D. Executive Director Atlantic City Tourism Performance Indicators
The Hotel Industry: The United States, Virginia And Hampton Roads
 The Hotel Industry: The United States, Virginia And Hampton Roads THE HOTEL INDUSTRY: THE UNITED STATES, VIRGINIA AND HAMPTON ROADS Do not forget to show hospitality to strangers. Hebrews 12:2 This chapter
Tourism Snapshot A focus on the markets that the CTC and its partners are active in
 Tourism Snapshot A focus on the markets that the CTC and its partners are active in Newfoundland and Labrador www.canada.travel/corporate October 2011 Volume 7, Issue 10 Key highlights In October 2011,
Charleston County Monthly Hotel Occupancy Report
 Monthly Hotel Occupancy Report December Prepared by: Kevin Smith Office of Tourism Analysis School of Business College of Monthly Summary - December Overall, had a December occupancy of 46.6%, an ADR of
The Economic Impact of Tourism on Galveston Island, Texas
 The Economic Impact of Tourism on Galveston Island, Texas 2017 Analysis Prepared for: Headline Results Headline results Tourism is an integral part of the Galveston Island economy and continues to be a
MARKET INSIGHTS UPDATE
 SPOTLIGHT ON SUMMER 2015 TRAVEL OUTLOOK PG2 Photo courtesy of HTA / Tor Johnson MARKET INSIGHTS UPDATE North America May 2015 A monthly update including relevant information on travel industry trends,
PKF Consulting Canada
 PKF Consulting Canada July 27, 2015 Carol Caputo Executive Director Ontario s Algoma Country 334 Bay Street Sault Ste. Marie, ON P6A 1X1 Via e mail: carol@algomacountry.com RE: ALGOMA COUNTRY ACCOMMODATION
Visit Phoenix Market Update January Eric Kerr Director of Research & Business Analysis
 Visit Phoenix Market Update January 2019 Eric Kerr Director of Research & Business Analysis Visitation totals 2012-2017 & Spending trends Hotel Market Overview YTD - November Chain scales, Submarkets,
U.S. Hotel Industry Performance What Lies Ahead
 U.S. Hotel Industry Performance What Lies Ahead Vail R. Brown, CHMS Vice President, Global Business Development & Marketing vail_str May 5, 2015 vbrown@str.com 1. Visit www.hotelnewsnow.com 2. Create Free
Louisiana Travel Pulse July 2007
 Louisiana Travel Pulse July 2007 Produced by the Louisiana Office of Tourism Monthly Analysis/Highlights: A successful New Orleans JazzFest boosted airport and hotel traffic in New Orleans and ultimately
Economic Impact of Tourism in South Dakota, December 2017
 Economic Impact of Tourism in South Dakota, 2017 December 2017 1) Key findings 1) Growth continues in 2017 but pales against the event driven years of 2015 and 2016 in South Dakota Key facts about South
China Lodging Group (HTHT.US) Investor Presentation March 2016
 Investor Presentation March 2016") China Lodging Group (HTHT.US) Investor Presentation March 2016 Agenda Our Vision Who We Are Company Highlights Strategic Focus Operational and Financial Review Q & A 1 Our Vision We will build a world-class,
China Lodging Group (HTHT.US) Investor Presentation March 2016 Agenda Our Vision Who We Are Company Highlights Strategic Focus Operational and Financial Review Q & A 1 Our Vision We will build a world-class,
Atlantic City Tourism Performance Indicators (AC-TPI) nd Quarter
 nd Quarter") Atlantic City Tourism Performance Indicators (AC-TPI) 2018 2nd Quarter Prepared by Brian J. Tyrrell, Ph.D. and Rummy Pandit, L.P.D., M.B.A., C.H.A. Executive Director Atlantic City Tourism Performance
Atlantic City Tourism Performance Indicators (AC-TPI) 2018 2nd Quarter Prepared by Brian J. Tyrrell, Ph.D. and Rummy Pandit, L.P.D., M.B.A., C.H.A. Executive Director Atlantic City Tourism Performance
Sheraton Princess Kaiulani
 ON SALE UNTIL 1 DECEMBER 2017 Welcome to Hawai i There's no place on earth like Hawai i. Whether you're visiting for the first time or returning, the unique islands offer distinct experiences that will
MARKET AND OPERATIONS STUDY OF THE FOUR SEASONS BARBADOS HOTEL PROJECT
 MARKET AND OPERATIONS STUDY OF THE FOUR SEASONS BARBADOS HOTEL PROJECT FRESHWATER BAY, BARBADOS Prepared For: INTER-AMERICAN DEVELOPMENT BANK November 4, 2011 Prepared by: Jones Lang LaSalle Hotels 2333
North America Fact Sheet
 North America Overview North America continues to be Hawai i s largest source market for visitors. This market includes visitors who travel to the Hawaiian Islands from the (defined as the 11 Pacific states
2018 ASEAN Hotel Industry Survey of Operations Calendar Year
 2018 ASEAN Hotel Industry Survey of Operations 2017 Calendar Year TABLE OF CONTENTS SUMMARY OF RESULTS 5 TABLE 2.1 DEPARTMENTAL REVENUES AND EXPENSES (BANGKOK) 9 TABLE 2.2 DEPARTMENTAL REVENUES AND EXPENSES
BUSINESS BAROMETER December 2018
 Credit: Chris Orange BUSINESS BAROMETER December Credit: Nigel Moore 1 Contents Summary of findings 3 Annual monthly performance: visitor attractions..4 Visit Herts Team update 5 National context.8 Visitor
Atlantic City Tourism Performance Indicators (AC-TPI) st Quarter
 st Quarter") Atlantic City Tourism Performance Indicators (AC-TPI) 2018 1st Quarter Prepared by Brian J. Tyrrell, Ph.D. and Rummy Pandit, L.P.D., M.B.A., C.H.A. Executive Director Atlantic City Tourism Performance
Atlantic City Tourism Performance Indicators (AC-TPI) 2018 1st Quarter Prepared by Brian J. Tyrrell, Ph.D. and Rummy Pandit, L.P.D., M.B.A., C.H.A. Executive Director Atlantic City Tourism Performance
Mexico Hotel & Tourism Investment Conference Global Hotel Industry Overview
 Mexico Hotel & Tourism Investment Conference Global Hotel Industry Overview Jeff Higley VP, digital media & communications Thursday, 7 February 2013 www.hotelnewsnow.com Click on Hotel Data Presentations
Acceleration of tourism
 Belgrade 217 Tourism & Hotel Outlook Regulated by RICS Tourism & Hotel Market Outlook 217 LeRoy Realty Consultants 1 The growth of travel & tourism industry considerably outperforms that of the local economy
Downtown Boise Hotel Market Study
 Hotel Market Study Prepared for: The Boise Tri-Agency Group June 15, 2015 Photo Credit: Warren Lassen 1 Scope and Methodology In evaluating the Downtown Boise lodging market we: Reviewed, identified, and
INDEX OF LETTERS OF SUPPORT SET 1 of 2
 Docket OST-2010-0018 INDEX OF LETTERS OF SUPPORT SET 1 of 2 1. Governor of the State of Hawaii 2. United States Congressional Delegation for State of Hawaii 3. Hawaii State Senate Delegation 4. Chair of
China Lodging Group (HTHT.US) Q4 and full year 2017 Earnings Call March 13, 2018
 Q4 and full year 2017 Earnings Call March 13, 2018") China Lodging Group (HTHT.US) Q4 and full year 2017 Earnings Call March 13, 2018 Agenda Strategy Review Operational and Financial Review Q & A Appendix 1 Strong RevPAR Growth Driven by ADR + Occupancy
China Lodging Group (HTHT.US) Q4 and full year 2017 Earnings Call March 13, 2018 Agenda Strategy Review Operational and Financial Review Q & A Appendix 1 Strong RevPAR Growth Driven by ADR + Occupancy
Panama City Beach CVB Visitor Profile & Economic Impact Report. Prepared for: Panama City Beach Convention & Visitors Bureau
 Panama City Beach CVB 2015 Visitor Profile & Economic Impact Report Presented by: Berkeley Young, President Young Strategies, Inc. Larry D. Gustke, PhD Prepared for: Panama City Beach Convention & Visitors
Municipal Policy Committee (MPC) Meeting, Planning and Development Services
 Meeting, Planning and Development Services") Municipal Policy Committee (MPC) Meeting, 02.05.2019 Gincy Thoppil, Director Planning and Development Services Ron Price, President Arlington CVB Lodging Facilities: 1. Full Service Permitted by right
Municipal Policy Committee (MPC) Meeting, 02.05.2019 Gincy Thoppil, Director Planning and Development Services Ron Price, President Arlington CVB Lodging Facilities: 1. Full Service Permitted by right
Tourism Snapshot A Monthly Monitor of the Performance of Canada s Tourism Industry
 Tourism Snapshot A Monthly Monitor of the Performance of Canada s Tourism Industry September Volume 14, Issue 8 Tourism Toronto www.destinationcanada.com Tourism Snapshot September 1 KEY HIGHLIGHTS IMPORTANT
HAWAI I TOURISM CANADA
 HAWAI I TOURISM CANADA Canada Economic Overview GDP very strong 2017, 3% growth, leading the G8 Unemployment at 5.9%, lowest in 40 years Canadian Dollar is $0.79, some economists predict $0.85 later in
MEMORANDUM MARKET OVERVIEW. Matt Roberts, Director of Parks and Recreation City of Carpinteria. Kevin Engstrom James Rabe. Date: June 21, 2016
 MEMORANDUM ADVISORS IN: REAL ESTATE REDEVELOPMENT AFFORDABLE HOUSING ECONOMIC DEVELOPMENT SAN FRANCISCO A. JERRY KEYSER TIMOTHY C. KELLY KATE EARLE FUNK DEBBIE M. KERN REED T. KAWAHARA DAVID DOEZEMA LOS
Atlantic City Tourism Performance Indicators (AC-TPI) nd Quarter
 nd Quarter") Atlantic City Tourism Performance Indicators (AC-TPI) 20 2nd Quarter Prepared by Brian J. Tyrrell, Ph.D. Supported by Rummy Pandit, M.B.A., L.P.D., C.H.A. Executive Director Atlantic City Tourism Performance
Atlantic City Tourism Performance Indicators (AC-TPI) 20 2nd Quarter Prepared by Brian J. Tyrrell, Ph.D. Supported by Rummy Pandit, M.B.A., L.P.D., C.H.A. Executive Director Atlantic City Tourism Performance