S&OP Sales and Operations Planning. Dejan Đorđević, Dmitar Zaklan, Vladimir Jovanović
|
|
|
- Gerard Hood
- 6 years ago
- Views:
Transcription
1 S&OP Sales and Operations Planning Dejan Đorđević, Dmitar Zaklan, Vladimir Jovanović


2 Supply Chain direktor Knjaz Miloš a.d. Dmitar Zaklan Vladimir Jovanović COO Imlek a.d. Vladimir Popadić Olja Lapčević Nemanja Petrašinović
3 Agenda: Šta je S&OP? S&OP ciklus S&OP proces i veza sa operativnim planiranjem (MPS) Implemntacija S&OP upravljanje promenama

4 Benefiti S&OP procesa
5 Šta je S&OP? S&OP (Sales and Operations) je proces koji obuhvata seriju sastanaka koji se ciklično održavaju na različitim nivoima prema unapred utvrđenom redosledu i šablonu sa ciljem da se kroz generisanje precizno definisanih informacija (planova i pokazatelja performansi) kao rezultata navedenih sastanaka obezbedi pravovremena i relevantna informacija za menadžment u cilju donošenja poslovnih odluka. Ključne reči: - DisciplinaProces - Serija sastanaka - Unapred utvrđen šablon i redosled - Informacija - Donošenje odluka

6 Koja je svrha S&OP?
 Disciplina u planiranju Obezbeđenje efikasnog upravljanja i kontrole celokupnog")
7 Koja je svrha S&OP? Balans između ponude i tražnje Usaglašavanje volumena i mix-a Menadžment rizikom (Risk Management) Disciplina u planiranju Obezbeđenje efikasnog upravljanja i kontrole celokupnog biznisa Razumevanje finansijskih implikacija donetih odluka i minimiziranje odstupanja od biznis plana Integracija operacionih planova sa finansijskim planovima

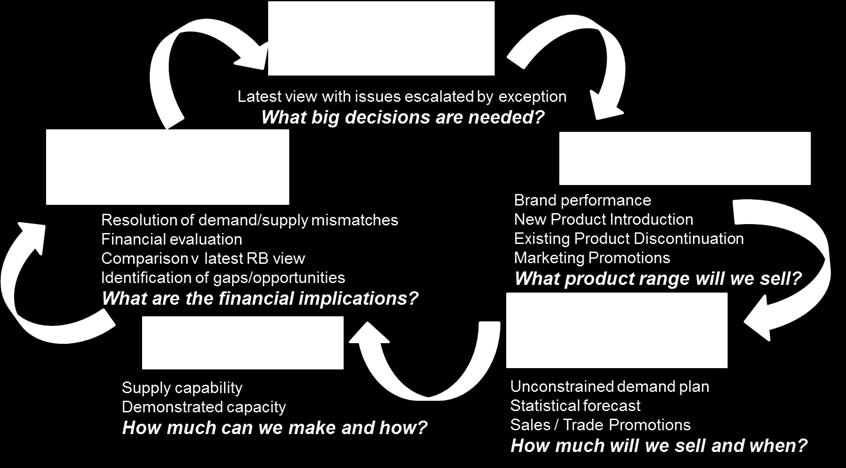
8 S&OP ciklus


9 S&OP ciklus učesnici i vremenski horizont Vremenski horizont Nivo menadžmenta
 Plan dopuna DC-a Konsolidacija planova Usklađivanje proizvodnih, ljudskih,materijalnih resursa ( repromaterijala) i logističkih resursa za ispunjenje plana")
10 S&OP ciklus Fokus: Planiranje potrebnih zaliha GP da bi se zadovoljila tražnja YTG po mesecima i SKU. Fokus na 1+2 meseca. Trend zaliha po SKU ( min opt zalihe) Plan dopuna DC-a Konsolidacija planova Usklađivanje proizvodnih, ljudskih,materijalnih resursa ( repromaterijala) i logističkih resursa za ispunjenje plana zaliha / tražnje. KPI: analiza tačnosti planova za prethodni period (mesec- kvartal); mesečni KPI dashboard Učesnici: demand and supply menadžer, menadžer nabavke, menadžer proizvodnje, menadžer menadžer logistike Chairman: supply chain menadžer Supply Review Ključni inputi: Prognoza prodaje (plan) i preporuke sa Demand/commercial review sastanka Pregled realizacije proizvodnje i nabavake u prethodnom periodu ( LY,YTD) Raspoloživost resusra ( opreme, magacina, transporta, radne snage ) Plan remonta Raspoloživost RM Trenutne zalihe Ključni outputi: Plan zaliha Plan proizvodnje Plan nabavke Plan iskorišćenja kapaciteta resursa (proizvodnih, logističkih, dobavljača) Odstupanja od plana i preporuke za prevazilaženje GAP-a Otvorena pitanja i preporuke za S&OP sastanak
11 S&OP proces I ključna pitanja Neka od ključnih pitanja: Da li znamo tačnost naših predviđanja na srednjem i dugoročnom nivou? Da li je fleksibilnost naših kapaciteta poznata za naš planski horizont? Da li back-up planovi postoje i da li pokrivaju najbolje i najgora scenarija? Da li donosioci odluka znaju ključne horizonte (mileston) i raspoložive scenarije i akcije?
 sa ciljem balansiranja")
12 S&OP proces i veza sa MPS Strateško planiranje 1-5 godina Strategija, pravila i parametri Sales & Operations Planning 1-18 meseci Podaci za planiranje MRP/MPS planiranje 1-3 meseca Dobro definisani horizonti za planiranje i donošenje odluka omogućuju jasno identifikovanje odluka i mera koje je potrebno doneti kao i procesa ondnosno funkcije koje ce ih doneti (S&OP) sa ciljem balansiranja situacije ili iskorišćavanja prednosti i novih prilika na tržištu


13 S&OP proces i veza sa MPS 1 S&OP 3 2 MPS Scheduling Purchace short LT 4 Purchase Purchace long LT Koraci u integrisanom biznis planiranju Production order Purchase order
14 S&OP proces i veza sa MPS S&OP Volumen Demand Planning/ Forecasting Demand Supply Supply (Capacity) Planning Mix Master Scheduling Supplier and Plant Scheduling Distribution Scheduling
15 S&OP proces i predvidjanje Predviđanje je Prvo i najvažnije pravilo u predviđanju je UVEK POGREŠNO


16 S&OP proces i predvidjanje Predviđanje na Detaljnom nivou (Nivo artikla, SKU) dugačkog horizonta uglavnom neće poboljšati preciznost a sa druge strane zahteva ogroman napor I dosta resursa Fokusirati se na VOLUMEN ne MIX
17 Fleksibilnost resursa QTY Prekovremeni + 2 smene subotom Novi smenski model Zapošljavanje privremenih radnika + 2 smene 5 dana Zapošljavanje privremenih radnika + 1 smena 5 dana (na 2 linije) Otpuštanje privremenih radnika -1 smena 5 dana Kupovina opreme+ alati + 1 linije za montažu u 3 smene Otpuštanje privremenih radnika -1 smena 5 dana Moguće ograničenje Dobavljači Novi pogon/ fabrika MAX (5 smena) MAX (3 smene) Trenutni kapacitet MIN TIME

 Volumen Izgubljeni u šumi detalja Uključiti TOP")
18 S&OP proces i veza sa MPS Vreme 18 meseci Nivo detalja Agregirani nivo Tacna konfiguracija.egzaktni materijali #Ljudi.Kapitalna ulaganja.fabrika Detaljno predvidjanje I S&OP / Rough Cut master raspored (MPS) Super MPS MPS MIX Raspored proizvodnje/pull PTF (Planski horizont) Volumen Izgubljeni u šumi detalja Uključiti TOP menadžment? Daje malo dodatne vrednosti izvan planskog horizonta
19 S&OP i MPS , , , , pcs/week UREA - scenario UREA - next 12 weeks , , , , , okt nov dec jan feb mar apr maj jun jul avg sep okt nov dec jan feb mart Stock simulation with increased capacity Total forecast demand PROTO Capacity increase CW44 CW45 CW46 CW47 CW48 CW49 CW50 CW51 CW52 CW1 CW2 CW3 Average stock SERIAL Sim Demand Production plan 2 per. Mov. Avg. (Sim Demand)
20 Definisanje proizvodnog takta po VS (value stream) 500, , , , , ,000 Stable takt time Control of inventory level Different level of demand 250, , , , , , ,000 50,000 0 CW36 CW37 CW38 CW39 Inventory level Demand Average demand Production level Definisanje proizvodnog takta (proizodnog volumena za definisani S&OP interval) Stabilna proizvodnja odrzavanje volumena na jednakom nivou do sledeceg ciklusa planiranja Kontrola nivoa zaliha I fleksibilnost istih omogćava stabilni, ujednacen plan proizvodnje.

21 Struktura S&OP procesa primer
22 S&OP implementacija Preduslovi: Promena kulture ( S&OP spremnost) Podrska CEO-a ili vlasnika kompanije Usaglašenost na nivou top tima Među sektorska saradnja Disciplina
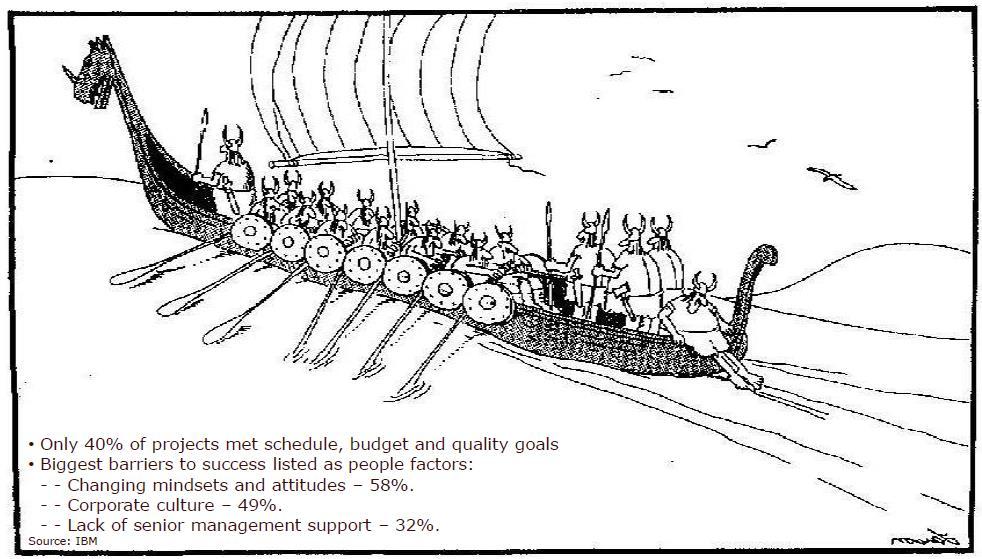
23 S&OP implementacija
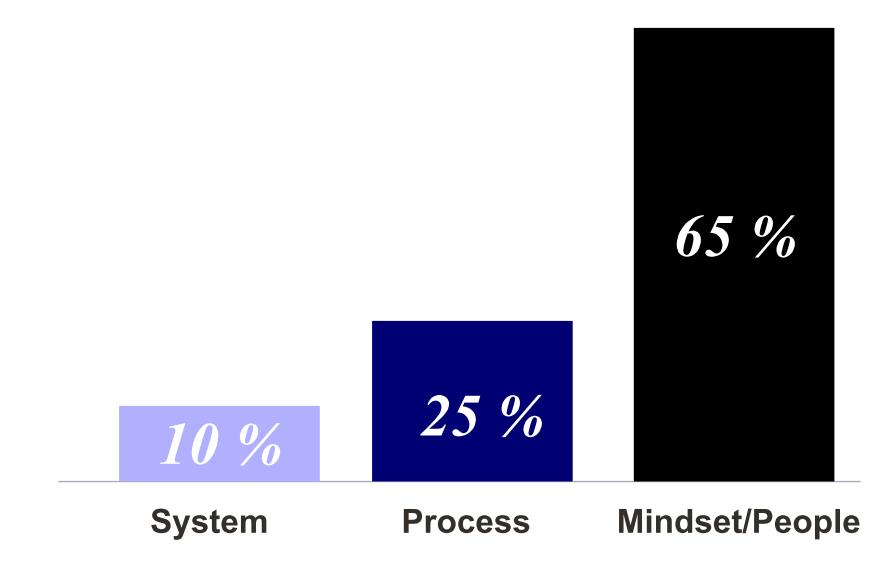
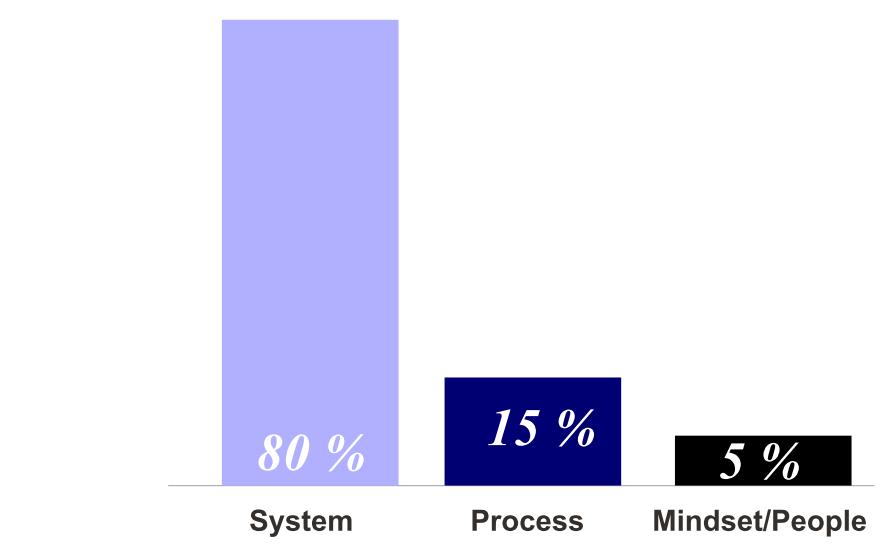

24 S&OP implementacija Ovo je praksa u implementaciji Ovo treba da bude fokus

25 S&OP implementacija projektni pristup
26 S&OP Kultura Leadership Kontinuirano unapredjenje Poverenje Odgovornost Rusenje silos mentaliteta Zajednicki KPI-evi Politika nagradjivanja zaposlenih Razviti razuman vid konflikta misljenja medju zaposlenima

27 Nivo zrelosti S&OP procesa

28 Četiri faze S&OP modela zrelosti (Lapide)
January 2018 Air Traffic Activity Summary
 January 2018 Air Traffic Activity Summary Jan-2018 Jan-2017 CY-2018 CY-2017 Passengers 528,947 505,421 4.7% 528,947 505,421 4.7% Passengers 537,332 515,787 4.2% 537,332 515,787 4.2% Passengers 1,066,279
SYSTEM BRIEF DAILY SUMMARY
 SYSTEM BRIEF SUMMARY * ANNUAL (PEAK HOURS 7:00 AM TO 10:00 PM MON-SAT) MaxTemp NEL (MWH) Hr Ending Hr Ending LOAD ENERGY (MWH) INCREMENTAL COST DAY DATE Civic TOTAL MAXIMUM @Max MINIMUM @Min FACTOR ON
STRUČNA PRAKSA B-PRO TEMA 13
 MAŠINSKI FAKULTET U BEOGRADU Katedra za proizvodno mašinstvo STRUČNA PRAKSA B-PRO TEMA 13 MONTAŽA I SISTEM KVALITETA MONTAŽA Kratak opis montže i ispitivanja gotovog proizvoda. Dati izgled i sadržaj tehnološkog
Annual Weather Book RECORDED BY NW RESEARCH & OUTREACH CTR. By: Michael Leiseth
 Annual Weather Book RECORDED BY NW RESEARCH & OUTREACH CTR. By: Michael Leiseth Table I II 1 2 3 4 5 6 7 8 9, 10 11, 12 13, 14 15, 16 17 18 An average year in Crookston, MN. Seasonal extremes in Crookston,
PROJEKTNI PRORAČUN 1
 PROJEKTNI PRORAČUN 1 Programski period 2014. 2020. Kategorije troškova Pojednostavlj ene opcije troškova (flat rate, lump sum) Radni paketi Pripremni troškovi, troškovi zatvaranja projekta Stope financiranja
BENCHMARKING HOSTELA
 BENCHMARKING HOSTELA IZVJEŠTAJ ZA SVIBANJ. BENCHMARKING HOSTELA 1. DEFINIRANJE UZORKA Tablica 1. Struktura uzorka 1 BROJ HOSTELA BROJ KREVETA Ukupno 1016 643 1971 Regije Istra 2 227 Kvarner 4 5 245 991
Measures & Projections October 31, GoToBermuda.com
 Measures & Projections October 31, 2015 GoToBermuda.com October Total Vacation Visitor Arrivals Vacation Arrivals Oct-14 Oct-15 2015 Air Vacation 9,203 10,344 1,141 12.40 126,842 127,044 202 0.16 Cruise
SIMPLE PAST TENSE (prosto prošlo vreme) Građenje prostog prošlog vremena zavisi od toga da li je glagol koji ga gradi pravilan ili nepravilan.
 Građenje prostog prošlog vremena zavisi od toga da li je glagol koji ga gradi pravilan ili nepravilan.") SIMPLE PAST TENSE (prosto prošlo vreme) Građenje prostog prošlog vremena zavisi od toga da li je glagol koji ga gradi pravilan ili nepravilan. 1) Kod pravilnih glagola, prosto prošlo vreme se gradi tako
SIMPLE PAST TENSE (prosto prošlo vreme) Građenje prostog prošlog vremena zavisi od toga da li je glagol koji ga gradi pravilan ili nepravilan. 1) Kod pravilnih glagola, prosto prošlo vreme se gradi tako
DTTAS Quarterly Aviation Statistics Snapshot Quarter Report
 Contents DTTAS Quarterly Aviation Statistics Snapshot Quarter 4 2015 Report 1.1 Dublin Airport Key Statistics... 1 1.2 Cork Airport Key Statistics... 3 1.3 Shannon Airport Key Statistics... 5 1.4 Total
DTTAS Quarterly Aviation Statistics Snapshot Quarter Report
 Contents DTTAS Quarterly Aviation Statistics Snapshot Quarter 3 2018 Report 1.1 Dublin Airport Key Statistics... 1 1.2 Cork Airport Key Statistics... 3 1.3 Shannon Airport Key Statistics... 5 1.4 Total
DTTAS Quarterly Aviation Statistics Snapshot Quarter Report
 Contents DTTAS Quarterly Aviation Statistics Snapshot Quarter 1 2018 Report 1.1 Dublin Airport Key Statistics... 1 1.2 Cork Airport Key Statistics... 3 1.3 Shannon Airport Key Statistics... 5 1.4 Total
The SAS Group five business areas as from Q SAS Group statement of income
 Weak full year result but according to plan Teleconference Fiscal year st Quarter weak according to plan nd Quarter passenger load factors and yields better than expected 3 rd and 4 th Quarter pressure
DEFINISANJE TURISTIČKE TRAŽNJE
 DEFINISANJE TURISTIČKE TRAŽNJE Tražnja se može definisati kao spremnost kupaca da pri različitom nivou cena kupuju različite količine jedne robe na određenom tržištu i u određenom vremenu (Veselinović
Sound Transit Operations December 2014 Service Performance Report. Ridership
 Ridership Total Boardings by Mode Mode Dec-13 Dec-14 % YTD-13 YTD-14 % ST Express 1,266,130 1,396,787 10.3% 16,605,299 17,661,976 6.4% Sounder 248,710 285,016 14.6% 3,035,735 3,361,317 10.7% Tacoma Link
Biznis scenario: sekcije pk * id_sekcije * naziv. projekti pk * id_projekta * naziv ꓳ profesor fk * id_sekcije
 Biznis scenario: U školi postoje četiri sekcije sportska, dramska, likovna i novinarska. Svaka sekcija ima nekoliko aktuelnih projekata. Likovna ima četiri projekta. Za projekte Pikaso, Rubens i Rembrant
Yukon Bureau of Statistics
 Yukon Bureau of Statistics 2 9 # 1 $ > 0-2 + 6 & ± 8 < 3 π 7 5 9 1 ^ 1 Retail Motor Fuel Prices in the Yukon Average prices as of May 20 th, 2009 Self-serve regular premium diesel Whitehorse 99.5 105.9
Kontroling kao pokretač promjena u Orbico d.o.o. Sarajevo. Orbico Group
 Kontroling kao pokretač promjena u Orbico d.o.o. Sarajevo Emina Leka Ilvana Ugarak 1 Orbico Group vodeći distributer velikog broja globalno zastupljenih brendova u Europi 5.300 zaposlenika 19 zemalja 646
HOTEL INDUSTRY OVERVIEW. Texas
 HOTEL INDUSTRY OVERVIEW Texas DEMAND GROWTH STRONG BALANCED OCC & ADR GROWTH % Change Room Supply* 149M 1.3% Room Demand* 92M 5.6% Occupancy 61.6% 4.3% A.D.R. $90 4.4% RevPAR $55 8.9% Room Revenue* $8.3B
METRO OPERATIONS COMMITTEE
 Los Angeles County Metropolitan Transportation Authority Item 1 CHIEF OPERATIONS OFFICER S S REPORT METRO OPERATIONS COMMITTEE Lonnie Mitchell Chief Operations Officer May 19, 20 1 Employee Recognition
GoToBermuda.com. Q4 Arrivals and Statistics at December 31 st 2015
 Q4 Arrivals and Statistics at December 31 st 1 Q4 Total Vacation Visitor Arrivals Q4 Arrivals Air - Vacation 23,770 23,125-2.7% -645 141,509 139,820-1.2% -1,689 Cruise 39,118 48,344 23.6% 9,226 355,880
HVCB Market Insights Maui Visitors & Convention Bureau Membership Meeting October 27, Hawai i Tourism Authority (HTA)/Tor Johnson
/Tor Johnson") HVCB Maui Visitors & Convention Bureau Membership Meeting October 27, 2015 Hawai i Tourism Authority (HTA)/Tor Johnson 2015-16: The Road Ahead North America: Following notable increases in 2015, continued
HVCB Maui Visitors & Convention Bureau Membership Meeting October 27, 2015 Hawai i Tourism Authority (HTA)/Tor Johnson 2015-16: The Road Ahead North America: Following notable increases in 2015, continued
Sound Transit Operations June 2016 Service Performance Report. Ridership
 Ridership Total Boardings by Mode Mode Jun-15 Jun-16 % YTD-15 YTD-16 % ST Express 1,622,222 1,617,420-0.3% 9,159,934 9,228,211 0.7% Sounder 323,747 361,919 11.8% 1,843,914 2,099,824 13.9% Tacoma Link 75,396
Greater Orlando Aviation Authority Board Meeting. Wednesday, January 17, 2018
 Greater Orlando Aviation Authority Board Meeting Wednesday, Award Recognition South Terminal Complex Phase 1 and Phase 2 Planning Overview Greater Orlando Aviation Authority AGENDA PASSENGER TRAFFIC
Sound Transit Operations August 2015 Service Performance Report. Ridership
 Ridership Total Boardings by Mode Mode Aug-14 Aug-15 % YTD-14 YTD-15 % ST Express 1,534,241 1,553,492 1.3% 11,742,839 12,354,957 5.2% Sounder 275,403 326,015 18.4% 2,139,086 2,463,422 15.2% Tacoma Link
Sound Transit Operations January 2014 Service Performance Report. Ridership
 Ridership Total Boardings by Mode Mode Jan-13 Jan-14 % YTD-13 YTD-14 % ST Express 1,343,290 1,426,928 6.2% 1,343,290 1,426,928 6.2% Sounder 245,135 256,775 4.7% 245,135 256,775 4.7% Tacoma Link 86,229
Weekly Performance Update
 Pr. Rupert Vancouver Grain Monitoring Program Weekly Performance Update January, 19 For Grain (1-19 CY) Summary 1. Stocks in Store (' tonnes) Country Elevators % of Working T his Week Last Week Var. fro
Weekly Performance Update
 Pr. Rupert Vancouver Grain Monitoring Program Weekly Performance Update February 19, 19 For Grain (18-19 CY) Summary 1. Stocks in Store (' tonnes) Country Elevators % of Working T his Week Last Week Var.
Latest market insights and marketing plans from VisitBritain/VisitEngland. Anke Monestel, VisitEngland 8 th February 2018
 Latest market insights and marketing plans from VisitBritain/VisitEngland Anke Monestel, VisitEngland 8 th February 2018 1 Inbound tourism trends 2 Friday, February 9, 2018 2003 2004 2005 2006 2007 2008
Date Travel - Travel - Travel - Travel - Travel - Total Description Mileage Train / Air Meals Accommodation Other Hospitality
 Name: Mary Clare Egberts Title: CEO 2-Feb-17 15.00 15.00 Meeting 14-Feb-17 45.08 45.08 Meeting 15-Mar-17 53.42 53.42 Meeting 31-Mar-17 25.60 25.60 Meeting 3-Apr-17 25.00 17.02 42.02 Meeting 25-Apr-17 280.00
PERFORMANCE MEASURE INFORMATION SHEET #16
 PERFORMANCE MEASURE INFORMATION SHEET #16 ARROW LAKES RESERVOIR: RECREATION Objective / Location Recreation/Arrow Lakes Reservoir Performance Measure Access Days Units Description MSIC 1) # Access Days
Sound Transit Operations March 2018 Service Performance Report. Ridership
 March 218 Service Performance Report Ridership Total Boardings by Mode Mar-17 Mar-18 % YTD-17 YTD-18 % ST Express 1,622,116 1,47,79-4.6% 4,499,798 4,428,14-1.6% Sounder 393,33 39,6.% 1,74,96 1,163,76 8.3%
TOURISM PERFORMANCE 2017
 4 th QUARTER TOURISM PERFORMANCE 2017 TOTAL STAYOVER ARRIVALS 105,658 TOTAL CRUISE ARRIVALS 224,212 TOTAL VISITOR NIGHTS AVERAGE HOTEL OCCUPANCY 935,402 71.7% ECONOMIC IMPACT $142.6 million HOW WAS OUR
The Geography of Climate
 The Geography of Climate Objective for Today: Today we will examine ways that latitude and landforms influence climate The focus of our study will be the South American Continent in the Formal Region known
The Outlook for the Residential Construction Industry Hunter and the Central Coast
 The Outlook for the Residential Construction Industry Hunter and the Central Coast Graham Wolfe HIA Chief Executive Industry Policy and Media HIA Industry Outlook Breakfast Newcastle February 2013 Backdrop:
AirportInfo. ACI-NA 2011 Traffic Report
 AirportInfo ACI-NA 2011 Traffic Report July 2012 2011 ACI World Airport Traffic Summary North America 2011 % Change 2010 Worldwide 2011 % Change 2010 Total Passengers 1.5B Up 1.8% 5.1B Up 5.2% Total International
SAMPLE CLIENT. PPC Performance Report. Google AdWords Performance Detail Text Ad Performance Comparisons & Trend Analysis Revenue Tracking Data
 SAMPLE CLIENT PPC Performance Report Included in this report: Google AdWords Performance Detail Text Ad Performance Comparisons & Trend Analysis Revenue Tracking Data SUGAR AND SPICE - AUGUST 213 2 4 8
Weekly Performance Update
 Pr. Rupert Vancouver Grain Monitoring Program Weekly Performance Update January, 19 For (1-19 CY) Summary 1. Stocks in Store (' tonnes) Country Elevators % of Working T his Week Last Week Var. fro m Last
CONTINENTAL OUTDOOR MEDIA ROMItrack
 CONTINENTAL OUTDOOR MEDIA ROMItrack CADBURY EVENT EVALUATION ANALYSIS Nielsen Analytics Team AGENDA 1 Business Question & Solution 2 Scope 4 Volume drivers 5 Results & Insights 6 Summary of findings 2
MONTROSE REGIONAL AIRPORT
 MONTROSE REGIONAL AIRPORT FEBRUARY 25, 2016 DRAFT AGENDA READY FOR TAKE OFF WHAT ARE WE GOING TO DO TODAY? Introductions Why conduct an airport master plan? Master Plan Process Deliverables Schedule Identify
Industry. OH&LA Hospitality It s not all BLACK & WHITE. Duane Vinson Vice President
 State of the Industry OH&LA Hospitality 2010 It s not all BLACK & WHITE Duane Vinson Vice President For a copy of this presentation go to www.hotelnewsnow.com Click on Industry Presentation Supply Growth
Grain Monitoring Program
 Pr. Rupert Vancouver Grain Monitoring Program Weekly Performance Update.November, 1 For 1 (1-19 CY) Summary 1. Stocks in Store (' tonnes) Country Elevators % of Working T his Week Last Week Var. fro m
Board Box. October Item # Item Staff Page 1. Key Performance Indicators Sep 2018 M. Mungia Financial Report Aug 2018 H.
 Board Box October 2018 Item # Item Staff Page 1. Key Performance Indicators Sep 2018 M. Mungia 2-10 2. Financial Report Aug 2018 H. Rodriguez 11-15 ITEM 1 October 31, 2018 TO: FROM: RE: BOARD OF DIRECTORS
Raleigh Executive Jetport Master Plan Update MPAC MEETING #3 NOVEMBER 1, 2018
 Raleigh Executive Jetport Master Plan Update MPAC MEETING #3 NOVEMBER 1, 2018 Agenda» Website Update» Alternatives» Discussion» Evaluation» Schedule Agenda» Website Update» Alternatives» Discussion» Evaluation»
Argentina is returning to the world markets. Leandro Pierbattisti, BA September 25th
 Argentina is returning to the world markets Leandro Pierbattisti, BA September 25th Federation of Country Elevators: some figures The Federation is a second level organization, in charge of carrying out
SSP progress in Latvia. Overview
 SSP progress in Latvia CAA of Latvia: Ms. Ērika Neimane, Head of the ATM Section, ANS Division LGS: Mr. Jānis Lapiņš, Head of Safety, Quality, Security and Audit Management airbaltic: Mr. Lauris Miķelsons,
AMRES eduroam update, CAT alat za kreiranje instalera za korisničke uređaje. Marko Eremija Sastanak administratora, Beograd,
 AMRES eduroam update, CAT alat za kreiranje instalera za korisničke uređaje Marko Eremija Sastanak administratora, Beograd, 12.12.2013. Sadržaj eduroam - uvod AMRES eduroam statistika Novine u okviru eduroam
December 2013 Passenger and Cargo Traffic Statistics Reno-Tahoe International Airport
 December 2013 Passenger and Cargo Traffic Statistics Reno-Tahoe International Airport January 24, 2014 U.S. DOMESTIC INDUSTRY OVERVIEW FOR DECEMBER 2013 All RNO Carriers Domestic Systemwide year over year
Sound Transit Operations January 2017 Service Performance Report. Ridership. Total Boardings by Mode
 January 217 Service Performance Report Ridership ST Express Sounder Tacoma Link Link Paratransit Jan-16 Jan-17 % 1,433,7 1,3,33 4.9% 331,27 7,121 98,411 3,633 Total Boardings by Mode 363,6 74,823 1,76,914
Gerald R. Ford International Airport Authority Master Plan Update A World Class Gateway
 Gerald R. Ford International Airport Authority Master Plan Update A World Class Gateway Master Plan Advisory Committee (MPAC) Alternatives September 28, 2017 AGENDA Review of Previous Work Ultimate Land
Recommendations for Northbound Aircraft Departure Concerns over South Minneapolis
 Recommendations for Northbound Aircraft Departure Concerns over South Minneapolis March 21, 2012 Noise Oversight Committee Agenda Item #4 Minneapolis Council Member John Quincy Background Summer of 2011
Podešavanje za eduroam ios
 Copyright by AMRES Ovo uputstvo se odnosi na Apple mobilne uređaje: ipad, iphone, ipod Touch. Konfiguracija podrazumeva podešavanja koja se vrše na računaru i podešavanja na mobilnom uređaju. Podešavanja
Sound Transit Operations January 2018 Service Performance Report. Ridership
 January 218 Service Performance Report Ridership Total Boardings by Mode Jan-17 Jan-18 % YTD-17 YTD-18 % ST Express 1,3,33 1,7,91.3% 1,3,33 1,7,91.3% Sounder 367,33 416,8 13.3% 367,33 416,8 13.3% Tacoma
Report for Jan-Nov-2006 pdf. General Statistics
 Report for Jan-Nov-006 pdf Time range: /8/006 07:3:37 - /3/006 3:50:6 Generated on Mon Jan 0, 007-9:3:5 General Statistics Summary Summary Hits Total Hits 97,06 Average Hits per Day 89 Average Hits per
COURSE DATES & PRICES 2019 NORTH AMERICA
 COURSE DATES & PRICES 2019 NORTH AMERICA SANTA MONICA SHORT TERM - CUT DURATION DAYS OF THE WEEK START DATES ABC CUT 1 5 DAYS MONDAY - FRIDAY Jan 7, 14 Feb 4, 18 Mar 4, 11 Apr 1, 15, 22 May 6, 20 Jun 3,
March Domestic Exports Imports. Volume Tonnes SW. MAT Mar-17 5, ,880 36, , % Change 3.6% 4.9% 15.6% 10.0% -5.8% 2.
 March 2018 Overview Table 1.1 Overview trends for Domestic, Export and Import trade Domestic Exports Imports Month Slaughter Pigmeat (Tonnes) Volume Tonnes SW Value $AUD (Million) Volume Tonnes SW Value
tourism in figures 2010
 tourism in figures 2010 the Russian market in Flanders Sept. 2011 toerisme vlaanderen TABLE OF CONTENT A. THE RUSSIAN MARKET IN FLANDERS 5 1. Key figures 5 2. Distribution within Flanders 5 3. Trends
Sound Transit Operations February 2018 Service Performance Report. Ridership
 February 218 Service Performance Report Ridership Total Boardings by Mode Feb-17 Feb-18 % YTD-17 YTD-18 % ST Express 1,373,96 1,372,88 -.1% 2,877,294 2,88,719.1% Sounder 314,96 32,187 11.9% 681,923 768,69
Passenger and Cargo Statistics Report
 Passenger and Cargo Statistics Report Reno-Tahoe International Airport December 2014 U.S. DOMESTIC INDUSTRY OVERVIEW FOR DECEMBER 2014 All RNO Carriers Domestic Systemwide year over year comparison Average
UPRAVLJANJE INDIVIDUALNIM PERFORMANSAMA - UPRAVLJANJE POMOĆU CILJEVA U STRATEGIJSKOM MENADŽMENTU ZASNOVANOM NA BSC
 UPRAVLJANJE INDIVIDUALNIM PERFORMANSAMA - UPRAVLJANJE POMOĆU CILJEVA U STRATEGIJSKOM MENADŽMENTU ZASNOVANOM NA BSC Prof dr Nebojša Janićijević Univerzitet u Beorgadu Ekonomski fakultet jnebojsa@eunet.rs
February Domestic Exports Imports. Volume Tonnes SW. MAT Feb-17 5, ,167 36, ,
 February 2018 Overview Table 1.1 Overview trends for Domestic, Export and Import trade Domestic Exports Imports Month Slaughter Pigmeat (Tonnes) Volume Tonnes SW Value $AUD (Million) Volume Tonnes SW Value
LOUIS ARMSTRONG NEW ORLEANS INTERNATIONAL AIRPORT For the Period Ending September 30, Enplaned Passengers by Airline
 Domestic Scheduled Enplaned Passengers by Airline Alaska Airlines 7,070 4,331 63.2% 59,552 42,265 40.9% 1.2% 1.0% Virgin America 0 803-100.0% 12,231 803 1423.2% 0.3% 0.0% Allegiant Air 1,333 2,063-35.4%
Visit Phoenix Market Update January Eric Kerr Director of Research & Business Analysis
 Visit Phoenix Market Update January 2019 Eric Kerr Director of Research & Business Analysis Visitation totals 2012-2017 & Spending trends Hotel Market Overview YTD - November Chain scales, Submarkets,
Performance Metrics for Oceanic Air Traffic Management. Moving Metrics Conference Pacific Grove, California January 29, 2004 Oceanic Metrics Team
 Performance Metrics for Oceanic Air Traffic Management Moving Metrics Conference Pacific Grove, California January 29, 2004 Oceanic Metrics Team Agenda Metrics Team Michele Merkle, FAA AUA-600 Lynne Hamrick,
Finding Rationality in an Irrational World: The Economics of Successful Hotel Negotiations
 Finding Rationality in an Irrational World: The Economics of Successful Hotel Negotiations Isaac Collazo, Vice President, Performance Strategy & Planning, InterContinental Hotels Group (IHG) Maria Lowry,
Hotel Association of North Texas. Karrie Keen Director, Destination and Trend Operations
 Hotel Association of North Texas Karrie Keen Director, Destination and Trend Operations To view this presentation, go to HotelNewsNow.com and click on Industry Analysis then Hotel data presentations. Agenda
WWF. Jahorina
 WWF For an introduction Jahorina 23.2.2009 What WWF is World Wide Fund for Nature (formerly World Wildlife Fund) In the US still World Wildlife Fund The World s leading independent conservation organisation
mep MEP: Feeder Primary Project, Year 2 LP 141/1 CIMT, University of Exeter
 O 70 56 G 35 B 28 R P 1 B 21 7 63 1 49 P B 42 14 B O B LP 141/1 LP 141/2 3 parts of 12 6 parts of 12 4 parts of 12 12 parts of 12 2 parts of 12 1 third 1 quarter 1 half 1 whole 1 sixth LP 141/6 2 thirds
The Canadian Retail Real Estate Market Real Estate Forum. Presented to:
 The Canadian Retail Real Estate Market Presented to: 2012 Real Estate Forum Presented by John G. Crombie National Retail Director Cushman & Wakefield Ltd. 416-756-5448 Retail Real Estate Canadian Retail
Passenger and Cargo Statistics Report
 Passenger and Cargo Statistics Report RenoTahoe International Airport July 2018 U.S. DOMESTIC INDUSTRY OVERVIEW FOR JULY 2018 Systemwide RNO Carriers Domestic Flights year over year comparison Average
Passenger and Cargo Statistics Report
 Passenger and Cargo Statistics Report RenoTahoe International Airport June 2018 U.S. DOMESTIC INDUSTRY OVERVIEW FOR JUNE 2018 Systemwide RNO Carriers Domestic Flights year over year comparison Average
Annual Performance Report. easier, faster, safer
 Annual Performance Report 2017 Content Introduction Choosing performance indicators Update on Corridor Traffic KPI 01: Traffic Volume (Total) KPI 02: Corridor Punctuality OM 01: Traffic Volume (Per Corridor
Passenger and Cargo Statistics Report
 Passenger and Cargo Statistics Report RenoTahoe International Airport April 2018 U.S. DOMESTIC INDUSTRY OVERVIEW FOR APRIL 2018 Systemwide RNO Carriers Domestic Flights year over year comparison Average
MONTROSE REGIONAL AIRPORT APRIL 12, 2016
 MONTROSE REGIONAL AIRPORT APRIL 12, 2016 AGENDA READY FOR TAKE OFF WHAT ARE WE GOING TO DO TODAY? Introductions Why conduct an airport master plan? Master Plan Process Deliverables Schedule Identify Goals
4 Days 3 Nights Koh Lipe Package(Ex-Langkawi)** MIN 8 PERSON TO GO
** MIN 8 PERSON TO GO") 4 Days 3 Nights Koh Lipe Package(Ex-Langkawi)** MIN 8 PERSON TO GO 1 St Day Langkawi KohLipe 08.00a.m or 13.00pm (Malay Time) Check in the Ferry ticket @ Kouh Jetty 09.30 a.m(01-15 Nov 15 &20 Apr-19 May
4 Days 3 Nights Koh Lipe Package(Ex-Langkawi)** MIN 8 PERSON TO GO 1 St Day Langkawi KohLipe 08.00a.m or 13.00pm (Malay Time) Check in the Ferry ticket @ Kouh Jetty 09.30 a.m(01-15 Nov 15 &20 Apr-19 May
Passenger and Cargo Statistics Report
 Passenger and Cargo Statistics Report RenoTahoe International Airport May 2018 U.S. DOMESTIC INDUSTRY OVERVIEW FOR MAY 2018 Systemwide RNO Carriers Domestic Flights year over year comparison Average Load
Passenger and Cargo Statistics Report
 Passenger and Cargo Statistics Report RenoTahoe International Airport September 2015 U.S. DOMESTIC INDUSTRY OVERVIEW FOR SEPTEMBER 2015 All RNO Carriers Domestic Systemwide year over year comparison Average
Passenger and Cargo Statistics Report
 Passenger and Cargo Statistics Report RenoTahoe International Airport August 2015 U.S. DOMESTIC INDUSTRY OVERVIEW FOR AUGUST 2015 All RNO Carriers Domestic Systemwide year over year comparison Average
Noise Oversight Committee
 Noise Oversight Committee July 22, 2015 Audio recordings are made of this meeting 1 Noise Oversight Committee July 22, 2015 Item 1 Review and Approve Draft Meeting Minutes Minutes from May 20, 2015 Noise
November 2013 Passenger and Cargo Traffic Statistics Reno-Tahoe International Airport
 November 2013 Passenger and Cargo Traffic Statistics Reno-Tahoe International Airport December 26, 2013 U.S. DOMESTIC INDUSTRY OVERVIEW FOR NOVEMBER 2013 All RNO Carriers Domestic Systemwide year over
October 2013 Passenger and Cargo Traffic Statistics Reno-Tahoe International Airport
 October 2013 Passenger and Cargo Traffic Statistics Reno-Tahoe International Airport December 4, 2013 U.S. DOMESTIC INDUSTRY OVERVIEW FOR OCTOBER 2013 All RNO Carriers Systemwide year over year comparison
CAPACITY PLANNING. CALENDAR OF MILESTONE DATES DECEMBER 2019 and MAY 2020 TIMETABLES (PRODUCTION SCHEDULE)
") CAPACITY PLANNING CALENDAR OF MILESTONE DATES DECEMBER 2019 and MAY 2020 TIMETABLES (PRODUCTION SCHEDULE) Published on behalf of:- Capacity Planning Quadrant: MK Elder Gate Milton Keynes Central MK9 1EN
CAPACITY PLANNING CALENDAR OF MILESTONE DATES DECEMBER 2019 and MAY 2020 TIMETABLES (PRODUCTION SCHEDULE) Published on behalf of:- Capacity Planning Quadrant: MK Elder Gate Milton Keynes Central MK9 1EN
Supreme Court records, (bulk , )
") Supreme Court records, 1793 1974 (bulk 1847 1862, 1870 1966) Ontario County Records and Archives Center Overview of the Records: Creator: Ontario County Court Clerk Extent: 48 volumes, 8 indexes, 25.53
Supreme Court records, 1793 1974 (bulk 1847 1862, 1870 1966) Ontario County Records and Archives Center Overview of the Records: Creator: Ontario County Court Clerk Extent: 48 volumes, 8 indexes, 25.53
WELCOME TO MICE CONNECT 22 November 2016
 WELCOME TO MICE CONNECT 22 November 2016 No part of this publication may be reproduced, distributed, stored in a retrieval system, or transmitted in AGENDA 1) Tourism Sector Performance 2) Business Development
Manual vs. Automatic Operation and Operational Restrictions
 Customer Services, Operations, and Safety Committee Board Information Item IV-B March 11, 2010 Manual vs. Automatic Operation and Operational Restrictions Page 81 of 91 Washington Metropolitan Area Transit
Chattanooga & Hamilton Co. Tourism Trends & Economic Outlook
 Chattanooga & Hamilton Co. Tourism Trends & Economic Outlook How Tourism Works for Chattanooga, TN January 21, 2010 Presentation by: Steve Morse, Ph.D. Director & Economist, Tourism Institute University
Passenger and Cargo Statistics Report
 Passenger and Cargo Statistics Report RenoTahoe International Airport September 2018 U.S. DOMESTIC INDUSTRY OVERVIEW FOR SEPTEMBER 2018 Systemwide RNO Carriers Domestic Flights year over year comparison
Passenger and Cargo Statistics Report
 Passenger and Cargo Statistics Report RenoTahoe International Airport January 2018 U.S. DOMESTIC INDUSTRY OVERVIEW FOR JANUARY 2018 Systemwide RNO Carriers Domestic Flights year over year comparison Average
Passenger and Cargo Statistics Report
 Passenger and Cargo Statistics Report RenoTahoe International Airport February 2018 U.S. DOMESTIC INDUSTRY OVERVIEW FOR FEBRUARY 2018 Systemwide RNO Carriers Domestic Flights year over year comparison
CAPACITY PLANNING. CALENDAR OF MILESTONE DATES DECEMBER 2018 and MAY 2019 TIMETABLES (PRODUCTION SCHEDULE)
") CAPACITY PLANNING CALENDAR OF MILESTONE DATES DECEMBER 2018 and MAY 2019 TIMETABLES (PRODUCTION SCHEDULE) Published on behalf of:- Capacity Planning Quadrant: MK Elder Gate Milton Keynes Central MK9 1EN
CAPACITY PLANNING CALENDAR OF MILESTONE DATES DECEMBER 2018 and MAY 2019 TIMETABLES (PRODUCTION SCHEDULE) Published on behalf of:- Capacity Planning Quadrant: MK Elder Gate Milton Keynes Central MK9 1EN
Industry Update. ACI-NA Winter Board of Directors Meeting February 3, 2016 Orlando, FL
 Industry Update ACI-NA Winter Board of Directors Meeting February 3, 2016 Orlando, FL U.S. & Canadian GDP 8% 6% 4% U.S.* Canada** Estimate by BEA as of 02/11/16 2% 0% -2% -4% -6% -8% -10% The U.S. economy
December 2011 Passenger and Cargo Traffic Statistics Reno-Tahoe International Airport
 December 2011 Passenger and Cargo Traffic Statistics Reno-Tahoe International Airport January 27, 2012 U.S. DOMESTIC INDUSTRY OVERVIEW FOR DECEMBER 2011 All RNO Carriers Systemwide year over year comparison
SAS Group Presentation Carnegie, May 22, 2012 Sture Stölen, Head of IR
 SAS Group Presentation Carnegie, May 22, 2012 Sture Stölen, Head of IR 1 This is the SAS Group 128 destinations 27,2 million passengers 28 new routes to be launched 2012 1,085 daily flights Revenues 2011,
Passenger and Cargo Statistics Report
 Passenger and Cargo Statistics Report RenoTahoe International Airport December 2015 U.S. DOMESTIC INDUSTRY OVERVIEW FOR DECEMBER 2015 All RNO Carriers Domestic Systemwide year over year comparison Average
$1910 $2310 n/a $530 n/a
 Price Includes : Round trip economy class air ticket on CX (Marriott Marquis Queen s Park ) 0.15% TIC Levy & HK security charge 0.15% Modena by Fraser Bangkok Modena by Fraser Bangkok http://bangkok.modenabyfraser.com/default-zh.html
СТРУКТУРА СТАНДАРДА СИСТЕМАМЕНАЏМЕНТАКВАЛИТЕТОМ
 1 СТРУКТУРА СТАНДАРДА СИСТЕМАМЕНАЏМЕНТАКВАЛИТЕТОМ 2 ПРИНЦИПИ МЕНАЏМЕНТА КВАЛИТЕТОМ 3 ПРИНЦИПИ МЕНАЏМЕНТА КВАЛИТЕТОМ 4 ПРИНЦИПИ МЕНАЏМЕНТА КВАЛИТЕТОМ Edwards Deming Не морате то чинити, преживљавање фирми
AirportInfo. Economic Indicators & Traffic
 AirportInfo Economic Indicators & Traffic March 2012 U.S. & Canadian GDP Economic Focus 6% 4% US Canada 2% 0% -2% -4% -6% -8% -10% GDP growth improved slightly for both the U.S. and Canada in the third
Damon Hylton Vice President
 ACI-NA Commissioners Conference Air Service Development in a Tough Market Damon Hylton Vice President May 19, 2008 Today s Agenda Background Now What? Questions and Answers 2 Background 3 Current Industry
AUCKLAND DESTINATION OVERVIEW
 AUCKLAND DESTINATION OVERVIEW JULY 218 An in-depth overview of Auckland s visitor economy from the latest arrival, accommodation, spend and cruise data through to past five-year commentary. Prepared August
2014 Colorado River Annual Operating Plan Colorado River Management Work Group (CRMWG) Final Consultation September 5, 2013
 Final Consultation September 5, 2013") 2014 Colorado River Annual Operating Plan Colorado River Management Work Group (CRMWG) Final Consultation September 5, 2013 2014 Colorado River AOP Final Consultation Meeting Welcome and Introductions
2014 Colorado River Annual Operating Plan Colorado River Management Work Group (CRMWG) Final Consultation September 5, 2013 2014 Colorado River AOP Final Consultation Meeting Welcome and Introductions
August 2014 Passenger and Cargo Traffic Statistics Reno-Tahoe International Airport
 August 2014 Passenger and Cargo Traffic Statistics Reno-Tahoe International Airport October 8, 2014 U.S. DOMESTIC INDUSTRY OVERVIEW FOR AUGUST 2014 All RNO Carriers Domestic Systemwide year over year comparison