Measuring economic effects of cruise tourism - Port of Tallinn perspective
|
|
|
- Gervase Smith
- 6 years ago
- Views:
Transcription
1 Measuring economic effects of cruise tourism - Port of Tallinn perspective Sirle Arro, Port of Tallinn at the Workshop Measurement of regional economic effects caused by cruise tourism, Gdansk Gdansk / Poland, June 26th-27th 2017

2 Port of Tallinn: Economic Impact of Cruise Tourism Sirle Arro


3 Business Fields Passengers Shipping 10 mil passengers a year Cargo 20 mil tons a year Real Estate Industrial parks 86 ha Old City Harbour 50 ha Ferry shipping - 2 mil passengers a year; Ice-breaker Botnica


4 HARBOURS FROM CARGO TO CRUISE Tallinn Muuga Harbour Old City Harbour Paljassaare Harbour Paldiski South Harbour Saaremaa Harbour

, Ro-Ro")


5 Old City Harbour Esto ia s Biggest Touris Gateway Passengers (ferries, cruises, yachts), Ro-Ro TERRITORY AQUATORY TOTAL LENGTH OF BERTHS NUMBER OF BERTHS MAX. DEPTH MAX. LENGTH OF A VESSEL 54.2 ha 75.9 ha 5 km m 340+ m


6 Cruise piers
 600 500 400 300 200 100 0 passengers calls 519")

7 Cruise ships & passengers Tallinn Number of cruise calls, passengers (,000) passengers calls

8 Cruise passengers by citizenship (2015) 2010 Russia 2% Finland 2% rest % Germany 28% France 3% Australia 3% Spain 5% Kanada 5% Italy 5% Great Brittain 13% USA 18% Source: Borderguard Board

9 TALLINN OLD TOWN: Nordic jewel


10 Tallinn The highlight of Baltic cruise UNESCO World Heritage site Harbour located in the city center Close to the Old Town and main tourist attractions Dedicated cruise quays and cruise vessel service area Berthing places for 4-7 cruise ships Attractive discount system on port dues Memorable welcome Highly rated by cruise companies and cruise passengers
11 Impact of Cruise Business

12 Number of passengers 100% 90% 80% 70% 60% 50% 40% 30% 20% 10% 0% 5% 6% 5% 5% 5% 11% 10% 10% 10% 9% 82% 82% 83% 84% 84% Other Cruise passengers Paldiski-Kapellskär Tallinn-St. Petersburg Tallinn-Stockholm Tallinn-Helsinki


13 Port of Tallinn Total Income ( 2016) cruise 6% Shipping 16% other 6% cargo [PERCENTAGE] ferry 32%

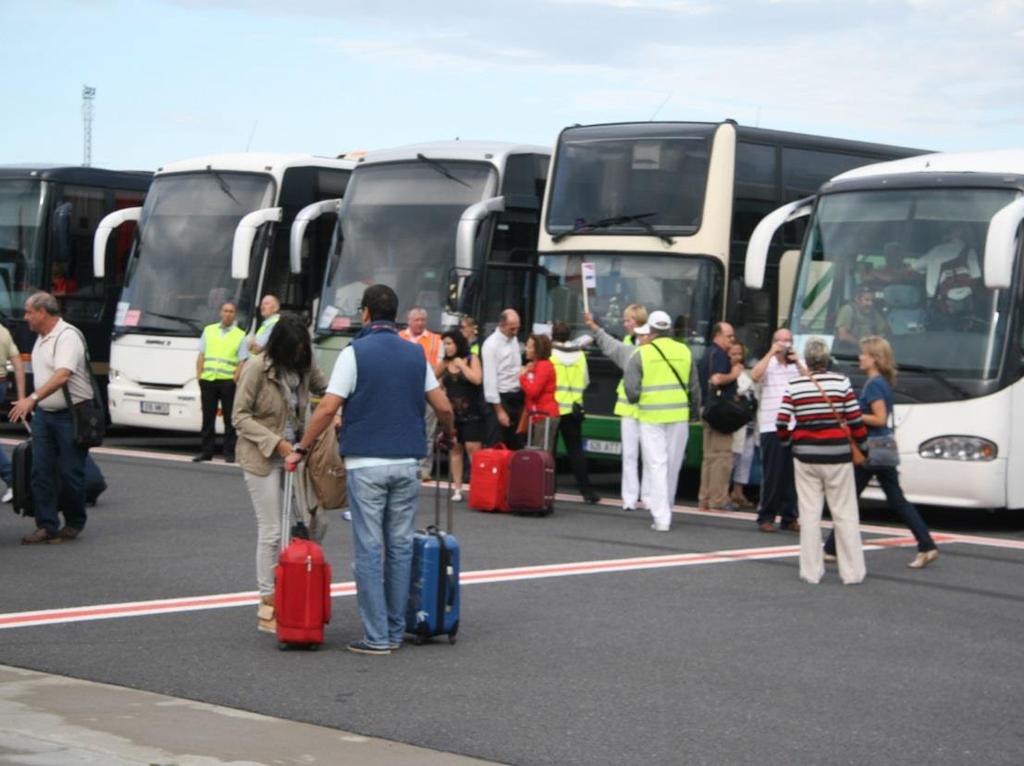
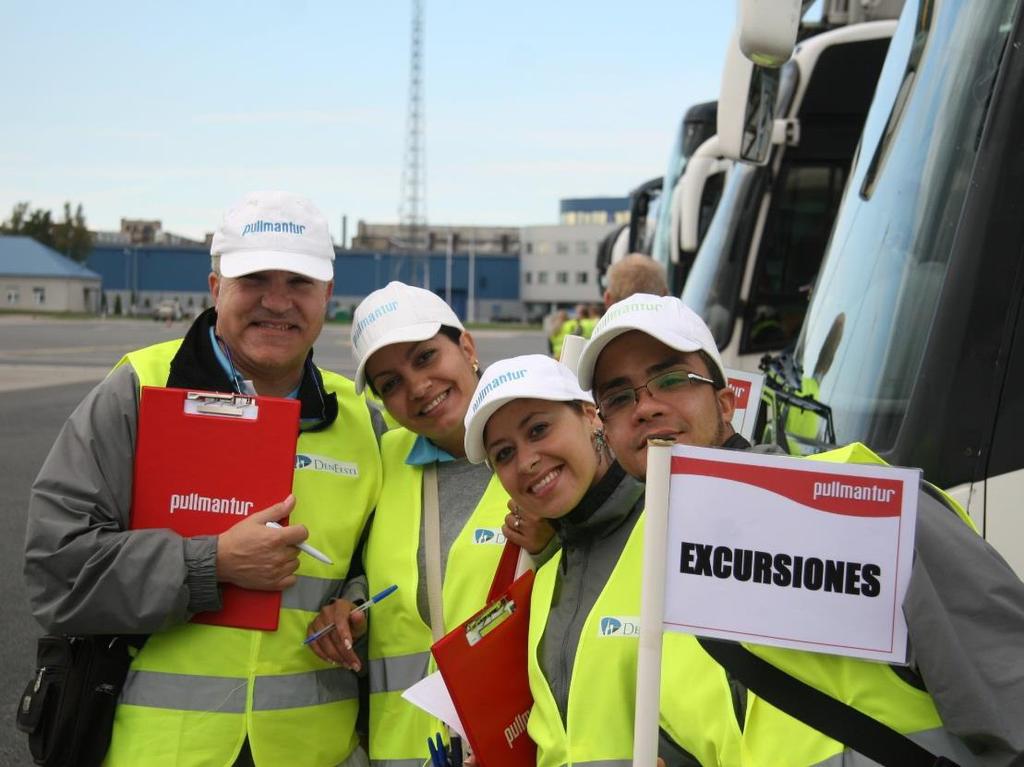
14 Desti atio s Income from Cruise Tourism Port fees, Airport fees Navigation and pilotage fees Agency fees Ship supply Shore excursions Passenger spendings Crew spendings Crew changes Etc. Indirect impact
15 Port dues 2017 Tonnage charge 0,48 EUR/GT Mooring charge 88/114/134 EUR/ per operation Passenger fee 1,46 EUR/passenger Discounts: 2nd & 3rd call 35% 4th & 5th call 55% from 6th call 65% Special agreements for turnarounds

16 Economic Impact Surveys Passenger and crew spendings survey Ordered by Cruise Baltic and Port of Tallinn in 2015 and in 2012 Conducted by G.P.Wild Survey Period: May October Number of Surveys Returned 2015: Passengers: 937 Crew: 239


17 Number of hours spent ashore Passengers 97% of the survey respondents reported that they went ashore in Tallinn. The typical passenger spent an average of 5.0 hours ashore. The average length of a purchased onshore tour was 4.0 hours. Five or More Hours 53% Four Hours 28% One Hour or Less 2% Two Hours 3% Three Hours 14%

18 Spendings on tours About 54% of the cruise passengers that went ashore purchased a shore excursion. 151 to % 101 to % More than 200 4% Less than 50 37% Passengers visiting Tallinn who purchased a tour spent an average of 93 per party or per passenger for their tour. 76 to % 51 to 75 19% Cost of Shore Excursion Per Party


19 New museums Tallinn Estonian Food Museum Tallinn Museum of Orders of Knighthood Carved Stone Museum

20 Other individual spendings Passengers reported spending another per passenger while ashore for other goods. 70% of passengers purchased local crafts and souvenirs at an average price of per purchase and a weighted average of per passenger visit. Another 60% of the passengers made purchases of food and beverages with an average expenditure of per purchase and a weighted average of 6.94 per passenger visit 25% of the passengers made purchases of clothing with an average expenditure of per purchase and a weighted average of 6.27 per passenger visit. Purchase Categories Share of All Onshore Purchasers Average Spend per Purchase Weighted Average Spend per Passenger Food and Beverages at Restaurants & Bars 59.8% Taxis/Ground Transportation 12.7% Watches & Jewelry 10.9% Clothing 24.8% Local Crafts & Souvenirs 69.7% Entertainment/Night Clubs/Casinos 0.6% Museums & Galleries 11.0% Other Purchases 15.6% Total Other Expenditures per Passenger Ashore

21 Survey 2015 Attributes of Crew Visits 56% of the crew respondents reported going ashore during the current cruise call in Tallinn. Another 40% who did not go ashore during the current call did so at least once in the previous month. The typical crew member spent an average of 2.3 hours ashore. Four Hours 9% Three Hours 22% Five or More Hours 6% Two Hours 38% One Hour 25% Number of Hours Ashore
22 Survey Crew Onshore Expenditures 2015 Crew visiting Tallinn reported spending an average of while ashore. Purchases of food and beverages accounted for 36% of average spending by crew. Purchases of clothing accounted for another 31% of their average expenditures. Purchases of local crafts and souvenirs accounted for 13% of their average expenditures. The top three expenditure categories (food and beverages, clothing and local crafts) accounted for 80% of crew average onshore expenditures. Purchase Categories Average Spend per Purchase Share of All Ashore Weighted Average Spend per Crew Food & Beverages at Restaurants & Bars % 7.38 Taxis/Ground Transportation % 0.39 Watches & Jewelry % 1.36 Clothing % 6.42 Local Crafts & Souvenirs % 2.75 Museums & Galleries % 0.07 All Other Purchases % 2.20 Total Expenditures per Crew Ashore 20.57


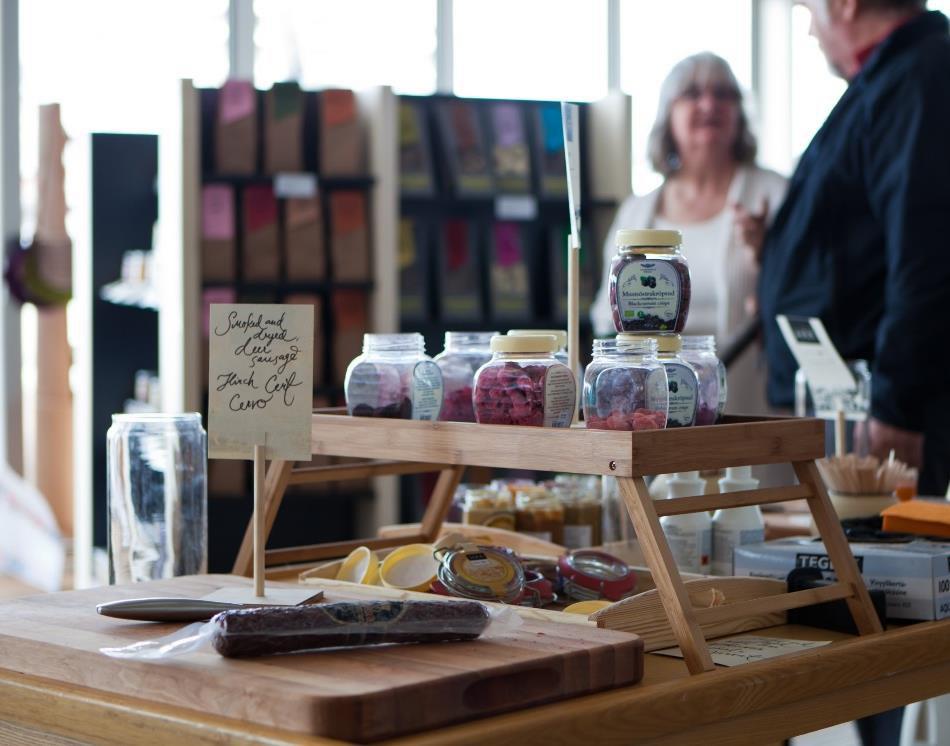
23 Cruise port village Authentic souvenirs & Best selection

24 Estimated Passenger and Crew Spending 2012 Transit passengers visiting Tallinn spent an average of on tours and retail shopping accounting for 86% of their expenditures. Crew visiting Tallinn spent an average of on food and beverages, entertainment and retail goods accounting for 72% of their expenditures. Average Expenditure per Passenger/Crew Category Transit Crew F&B & Entertainment Tours & Ground Transportation Retail Goods Other Purchases Total
25 Total Expenditures Survey 2012 Passengers and crew spent an estimated 26.4 million during 2012 Transit passengers accounted for 95% of the total with crew accounting for the remaining 5%. Passengers and crew spent 12.1 million on tours and other ground transportation, accounting for just over 45% of their total expenditures. Passengers and crew spent another $10 million on retail items, accounting for 38% of their total expenditures. Total Expenditures Category Transit Crew Total F&B & Entertainment Tours & Ground Transportation Retail Goods Other Purchases Total 2,123,229 12,038,974 9,462,026 1,352,347 24,976, ,295 96, , ,507 1,397,785 2,540,525 12,135,416 10,050,567 1,647,854 26,374,363
 had the highest direct employment impact with 63 jobs The")
26 Economic Impact Passenger and Crew Spending 2012 The 26.4 million in passenger and crew spending generated an estimated 177 direct jobs The transportation sector (primarily tour operators) had the highest direct employment impact with 63 jobs The wholesale and retail sector had the second highest direct impact with 32 jobs The hospitality sector (primarily restaurants and entertainment venues) benefitted from 23 jobs Industry Wholesale & Retail Trade Transportation & Utilities Direct Expenditures Millions Direct Employment Direct Compensation Millions Hospitality All Others Total
27 Economic Impact Passenger and Crew Spending 2012 The 26.4 million in passenger and crew spending generated an estimated 50.6 million in total (direct + indirect) output throughout Estonia. This output resulted in the employment of 365 residents of Estonia paying 9.07 million in compensation. Because the direct impacts account for about 45% of the total impacts, the total impacts remain concentrated in the trade and transportation sectors. However, the indirect impacts do spread into other sectors, including manufacturing, business and financial services to name a few. Industry Total Output Millions Total Employment Total Compensation Millions Manufacturing Wholesale & Retail Trade Transportation & Utilities Hospitality Financial & Business Services All Others Total


28 Economic Impact Passenger and Crew Spending 2012 Other major highlights of the total economic impacts include: Every 1 million in passenger and crew spending generated 14 jobs in Estonia. On average each of these jobs paid 24,800 in employee compensation. The trade, transportation and hospitality sectors accounted for about 67% of the direct impacts. Financial & Business Services 19% Hospitality 8% Personal Services & Govt 6% All Other Sectors 4% Manufacturi ng 10% Wholesale & Retail Trade 29% The manufacturing, financial, business and personal services sectors accounted for nearly 55% of the indirect impacts. Every 10 direct jobs generated by passenger and crew spending resulted in about another 11 jobs elsewhere in the economy of Estonia. Transportati on & Utilities 24% Total Employment Impact
29 Survey: Foreign vistors in Tallinn Cruise Passengers Survey ordered by City of Tallinn and conducted by TNS Emor in 2014 : On average, cruise passengers spend 4,2 hours in Tallinn. The main activities are sightseeing, walking around the city, shopping and going to cafes/restaurants. 75 % of cruise passengers spent money during their visit to Tallinn. Average total spending per person during one day was 71 EUR. Total direct impact 25,56 mln EUR The majority of cruise passengers spent money on souvenirs and gifts as well as food and drink.
")
30 Average spending per person per day Average spending per person per day (in EURO)
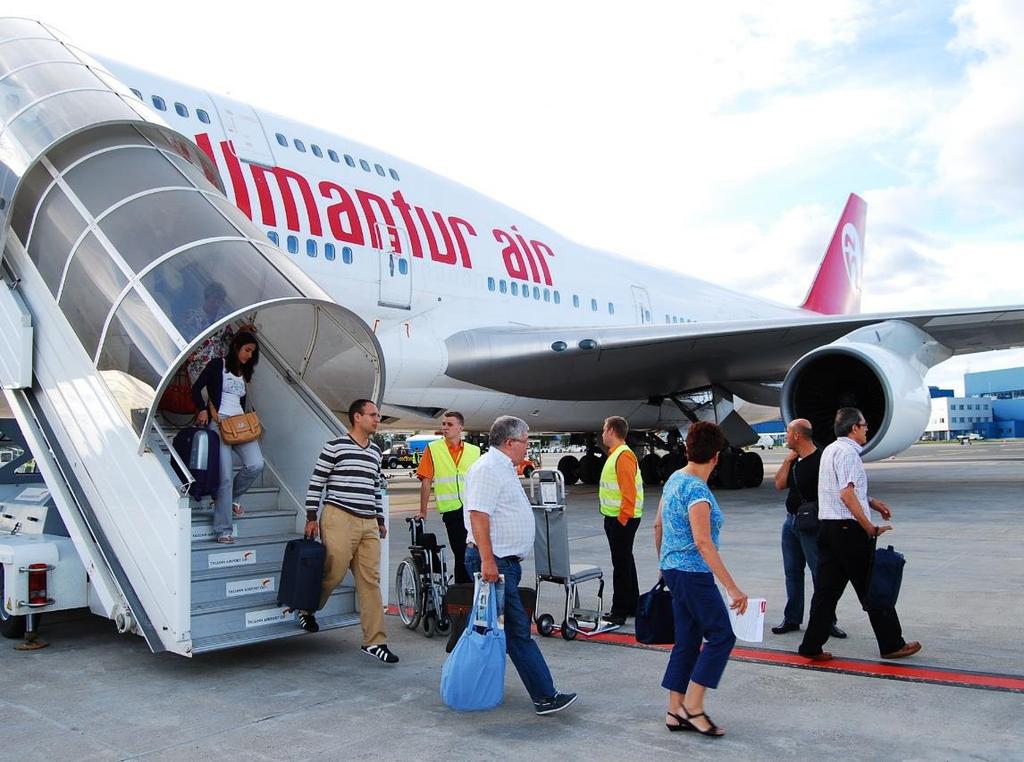
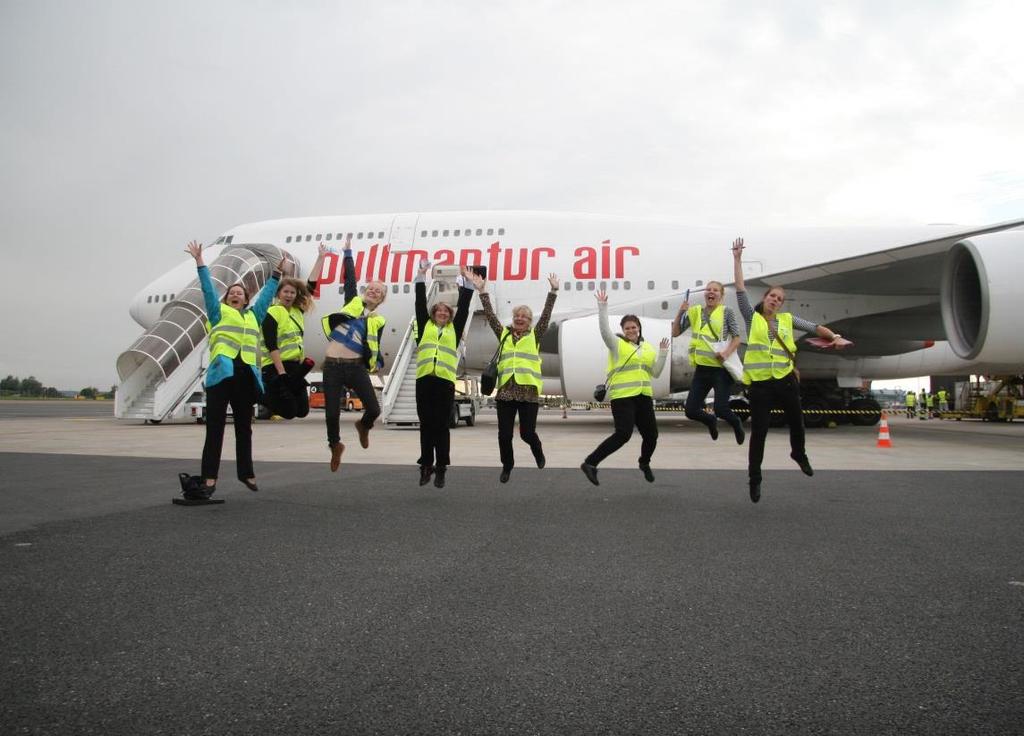
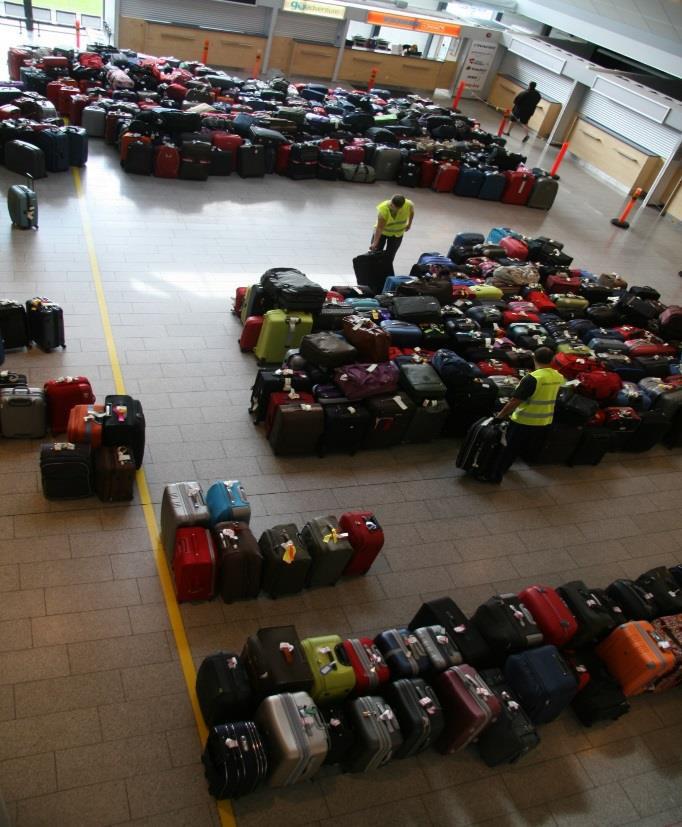
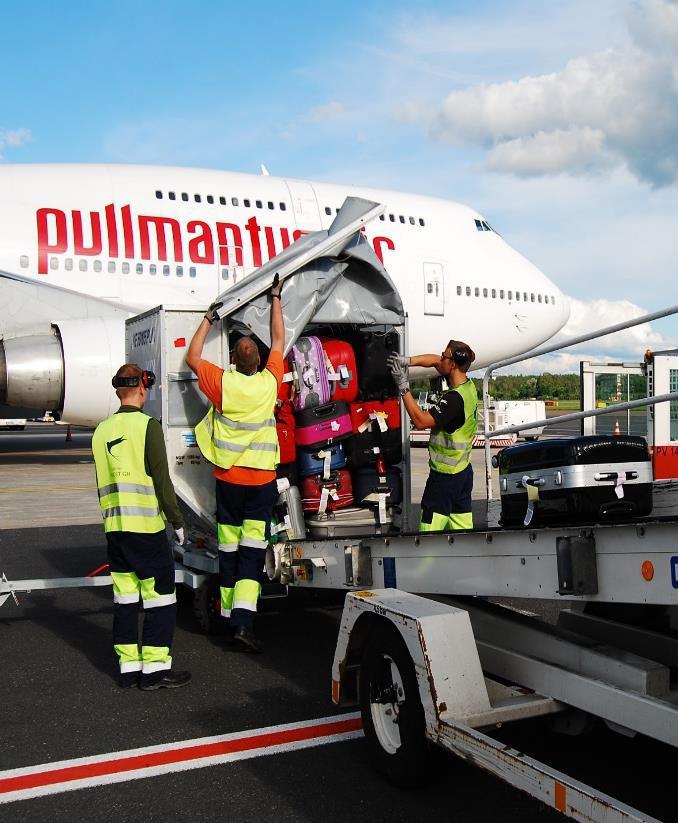
31 Turnarounds
 Turnaround 7204 pax Pax spendings [PERCENTAGE] Port")
![[PERCENTAGE] Transport + tours 12% Airport [PERCENTAGE ]](/docs-images/71/65776887/images/32-3.jpg "Port [PERCENTAGE ] Transport + tours 11% Supply 2%")

![Pax spendings [PERCENTAGE ] Agency fees 1% fees 9% Transit](/docs-images/71/65776887/images/32-5.jpg "3367 pax Total turnover of turnarounds was 2,3 times")
32 Economic impact: 5 turnarounds vs 5 transit calls (Tallinn 2012) Turnaround 7204 pax Pax spendings [PERCENTAGE] Port [PERCENTAGE] Transport + tours 12% Airport [PERCENTAGE ] Port [PERCENTAGE ] Transport + tours 11% Supply 2% Pilotage, fairways Pilotage, fairways 4% Agency fees+luggage 7% Supply [PERCENTAGE] Airport [PERCENTAGE] Pax spendings [PERCENTAGE ] Agency fees 1% fees 9% Transit 3367 pax Total turnover of turnarounds was 2,3 times higher than of transit calls
33

34 Other impacts Image: Positive spread of word of Tallinn & Estonia 98% of all cruise passengers would very likely or quite likely recommend a trip to Tallinn to their friends or acquaintances. Returning visitors: ca 47% will very likely or quite likely return for land based vacation 52% of the crew respondents reported that they were either very or extremely likely to return to Tallinn for a land-based vacation.

35 Likelihood of visiting Tallinn again % of all visitors belonging to the target group
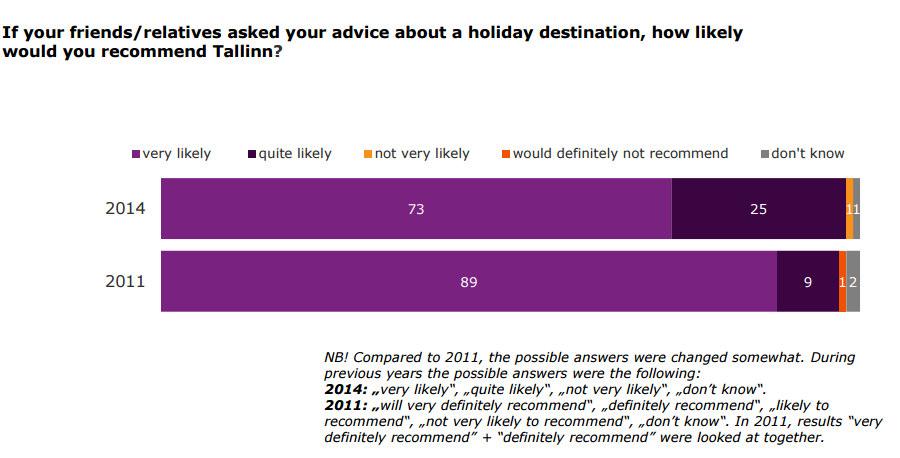
36 Recommendation to visit


37 Other spendings Medical sector Flowers Local food products Spare parts, consulate fees, bycycle repair, glasses,.. whatever product or service you might think has been ordered.
38 In conclusion We have reliable data about passenger spendings We have more or less reliable data about crew spendings We have reliable data about port dues We have some knowledge about the products and services order by cruise lines, but there is lack of information about cruise line spendings and orders New possible study??
39
, cargo TERRITORY AQUATORY TOTAL LENGTH OF BERTHS NUMBER OF BERTHS MAX. DEPTH MAX.")
40 SAAREMAA HARBOUR Enjoy the most beautiful and purest nature on the Baltic Sea! Passengers (yachts & cruises), cargo TERRITORY AQUATORY TOTAL LENGTH OF BERTHS NUMBER OF BERTHS MAX. DEPTH MAX. LENGTH OF A VESSEL ha 44.3 ha 460 m 3 + floating drydock 10 m m


41 Cruise ship calls & passengers Saaremaa Passengers Calls Cruise calls, passengers , ,581 1, , ,683 5, , ,456 7, , , ,525 0

42 SAAREMAA Different Estonian experience A magical island in the middle of the Baltic Sea Folklore, heritage and history Traditional lifestyle with a modern twist Attractive and suprising green break from cities Dedicated cruise quays Beloved holiday destination for Estonians


43 Kuressaare castle from the 14th century: Among the medieval castles in the Baltic countries this is the one that has survived best.
Port of Tallinn Estonia s Biggest Maritime Gateway
 Port of Tallinn Estonia s Biggest Maritime Gateway Margus Vihman Chief Commercial Officer/ Member of the Management Board Organization The company in a nutshell State-owned limited liability company Port
Best practices for attracting cruise tourists
 Best practices for attracting cruise tourists Ingrid Berezin ORGANIZATION COMPANY IN A NUTSHELL State-owned limited liability company Port of Tallinn is a landlord port We provide infrastructure land,
The Economic Contribution of Cruise Tourism to the Southeast Asia Region in Prepared for: CLIA SE Asia. September 2015
 BREA Business Research & Economic Advisors The Economic Contribution of Cruise Tourism to the Southeast Asia Region in 2014 Prepared for: CLIA SE Asia September 2015 Business Research & Economic Advisors
ECONOMIC CONTRIBUTION OF CRUISE TOURISM TO THE DESTINATION ECONOMIES
 BREA 201 Strykers Rd Suite 19-132 Phillipsburg, NJ 08865 Phone: (908) 213-1971 Fax: (908) 777-3521 Website: www.breanet.com ECONOMIC CONTRIBUTION OF CRUISE TOURISM TO THE DESTINATION ECONOMIES A Survey-based
total - foreign overnights - domestic overnights
 TOURISM IN ESTONIA IN 214 TOURISM IN ESTONIA IN 214 (updated in Sept. 216) 1 In 214, 3.1 million foreign and domestic tourists stayed overnight in the accommodation establishments of Estonia (3.6% more
BREA. PO Box 955 Exton, PA ECONOMIC CONTRIBUTION OF CRUISE TOURISM TO THE DESTINATION ECONOMIES
 BREA BREA PO Box 955 Exton, PA 19341 Phone: (610) 524-5973 Fax: (610) 363-9273 Website: www.breanet.com Business Research & Economic Advisors ECONOMIC CONTRIBUTION OF CRUISE TOURISM TO THE DESTINATION
Survey into foreign visitors to Tallinn Target market: Cruise voyagers. TNS Emor March 2012
 Survey into foreign visitors to Tallinn 2008 2011 Target market: Cruise voyagers TNS Emor March 2012 Table of contents 1 Introduction 3 2 Planning a trip to Tallinn 9 3 Visiting Tallinn and impressions
Overview of tourism trends in Tallinn. First quarter report in 2018
 Overview of tourism trends in Tallinn First quarter report in 2018 Visits of foreign residents to Tallinn, January - March 2018 Residents of foreign countries made 780 338 visits to Tallinn, which means
BREA. Contribution of Cruise Tourism to the Economies of Europe Country Report Italy. The European Cruise Council Euroyards. Business Research &
 BREA Business Research Contribution of Cruise Tourism to the Economies of Europe 2011 Country Report Prepared for The European Cruise Council Euroyards July 2012 continues to be the major centre for cruise
The Economic Contribution of the International Cruise Industry in Canada
 THE ECONOMIC CONTRIBUTION OF THE I N T E R N AT I O N A L C R U I S E I N D U S T RY I N C A N A D A C R U I S E L I N E S I N T E R N AT I O N A L A S S O C I AT I O N // BREA Business Research & Economic
An overview of Tallinn tourism trends
 An overview of Tallinn tourism trends August 2015 The data is collected from Statistics Estonia, Tallinn Airport and Port of Tallinn. In August 2015, 179,338 stayed overnight in Tallinn s accommodation
Estonian Air ja muutuv majanduskeskkond Uued väljakutsed ja võimalused. Joakim Helenius,
 Estonian Air ja muutuv majanduskeskkond Uued väljakutsed ja võimalused Joakim Helenius, 29.09.2011 Global Trends Income inequalitly increasing in the West Source: OECD Income Distribution and Poverty Database
HELSINKI TOURISM IN 2008
 Record year 2008 in brief 3.1 million bednights at accommodation establishments domestic visitors 41% of nights foreign visitors 59% of nights top markets Russia, Germany, Britain, Sweden, the United States
BREA. Contribution of Cruise Tourism to the Economies of Europe 2011 Country Report France. The European Cruise Council.
 BREA Business Research Economic Advisors Contribution of Cruise Tourism to the Economies of Europe 2011 Country Report Prepared for The European Cruise Council July 2012 receives significant economic benefits
BREA. Contribution of Cruise Tourism to the Economies of Europe 2011 Country Report Germany. The European Cruise Council.
 BREA Business Research Economic Advisors Contribution of Cruise Tourism to the Economies of Europe 2011 Country Report Prepared for The European Cruise Council July 2012 participates in all aspects of
Port of Helsinki the Main Port for the Finnish Foreign Trade
 Port of Helsinki Port of Helsinki the Main Port for the Finnish Foreign Trade 2014 Total traffic 10.8 million tonnes Unitized cargo 10.0 million tonnes Market share 25 % (amount) Market share 40 % (value)
Contribution of Cruise Tourism to the Economies of Europe 2017
 Contribution of Cruise Tourism to the Economies of Europe 2017 PUBLISHED 2018 CLIA CRUISE LINES GLOBAL THE MOST INCLUSIVE LUXURY EXPERIENCE REGIONAL FOREWARD The cruise industry contributed a record 47.86
WORKING THE CRUISE MARKET IN THE NT
 WORKING THE CRUISE MARKET IN THE NT Darwin Cruise Ship Terminal 20 November 2012 Richard Schoonraad Manager, Cruise Sector Development AGENDA Tourism NT Market Overview Cruise Lines who s who? Getting
DEVELOPMENT OF TRAFFIC VOLUMES IN BALTIC SEA
 DEVELOPMENT OF TRAFFIC VOLUMES IN BALTIC SEA Tõnis Segerkrantz WINTER PERIOD PORT CALL DATA Real port call statistics were acquired from Finnish, Estonian and Russian maritime administrations and port
CRUISE ACTIVITY IN BARCELONA. Impact on the Catalan economy and socioeconomic profile of cruise passengers (2014)
") CRUISE ACTIVITY IN BARCELONA Impact on the Catalan economy and socioeconomic profile of cruise passengers (2014) 2 CRUISE ACTIVITY IN BARCELONA 2014 Impact on the Catalan economy and socioeconomic profile
CRUISE ACTIVITY IN BARCELONA Impact on the Catalan economy and socioeconomic profile of cruise passengers (2014) 2 CRUISE ACTIVITY IN BARCELONA 2014 Impact on the Catalan economy and socioeconomic profile
The Economic Impact of the 2015 ASICS Los Angeles Marathon. September 2015
 The Economic Impact of the 2015 ASICS Los Angeles Marathon September 2015 Introduction and definitions This study measures the economic impact of the 2015 ASICS Los Angeles Marathon held in March 2015.
CLIA Global and European Member Cruise Lines
 L I N A T C R N I N T E IA T I O N S C E R U E I S IO N A L S A S O Contribution of Cruise Tourism to the Economies of Europe 2015 Published 2016 CLIA EUROPE CLIA Global and European Member Cruise Lines
Visit Finland Visitor Survey 2017
 Visit Finland Visitor Survey 2017 Visit Finland Studies 9 Business Finland, Visit Finland Helsinki 2018 Foreign visitors in Finland in 2017 Contents Abstract 5 Introduction 7 Trips to Finland 10 Day and
SHIP-GENERATED WASTE MANAGEMENT
 SHIP-GENERATED WASTE MANAGEMENT Ellen Kaasik, Head of Quality and Environmental Management Department, Port of Tallinn at the Workshop Green Cruise Port Innovative Waste Management and Reception Facilities
AAPA CRUISE SEMINAR Cayman Islands January 10, 2007
 AAPA CRUISE SEMINAR Cayman Islands January 10, 2007 MICHELE M. PAIGE PRESIDENT 1 I AM TRULY PLEASED TO HAVE BEEN ASKED TO BE WITH YOU HERE TODAY - BUT BEFORE I START - I D LIKE TO TELL YOU A LITTLE ABOUT
France. French Visitors in Finland Statistical Trends and Profile
 France M A R K E T R E V I E W 2 0 1 5 French Visitors in Finland Statistical Trends and Profile 14.10.2016 STATISTICS ON FRENCH TOURISM IN FINLAND STATISTICAL TRENDS 3 Registered overnights 4 Number of
Nearly 2.5 million nights recorded in Foreigners' share of nights over 60% Record set in 2000 HELSINKI TOURISM STATISTICS
 Year HELSINKI TOURISM STATISTICS FIGURE 1. Monthly overnights in Helsinki Nearly 2.5 million nights recorded in Nights spent at registered accommodation establishments in Helsinki totalled nearly 2.5 million
Japan 3% Foreign overnight stays 31% Domestic overnight stays 69% 8.3 MILLION FOREIGN VISITORS IN FINLAND IN 2017
 TOURISM IS A GROWING SOURCE OF EXPORT REVENUE AND A SIGNIFICANT EMPLOYMENT PROVIDER IN FINLAND TOURISM HAS A MULTIPLIER EFFECT ON OTHER SECTORS. 1 EURO IN TOURISM ADDS 56 CENTS VALUE TO THE OTHER SECTORS.
Overview of Industrial Holding BLRT Grupp
 Overview of Industrial Holding BLRT Grupp On June 12, 1912 was decided to establish Russo-Baltic Shipbuilding Yard in Tallinn. Year 1916 manufacturing area of Russo-Baltic Shipbuilding Yard in Tallinn,
Economic Impact of Tourism in Hillsborough County September 2016
 Economic Impact of Tourism in Hillsborough County - 2015 September 2016 Key findings for 2015 Almost 22 million people visited Hillsborough County in 2015. Visits to Hillsborough County increased 4.5%
THE M/S MEGASTAR BUNKERING EXPERIENCE. Tallinn
 THE M/S MEGASTAR BUNKERING EXPERIENCE Tallinn 16.05.2018 CONTENTS 1. Eesti Gaas in brief. 2. Bunkering of M/S Megastar. 3. Lessons learned. 4. First year bunkering results 5. Conclusion. 6. Development
Information about the trip on the cruise ship Princess Anastasia May, 14-18, 2017
 Information about the trip on the cruise ship Princess Anastasia May, 4-8, 07 Comfortable cruise ship St Peter Line "Princess Anastasia" is a present-day passenger ferry, with a capacity of 380000 registered
PORT CHARGES AND FEES
 PORT CHARGES AND FEES Valid from 29.03.2018 CONTENTS 1 GENERAL PROVISIONS 3 2 TERMS 4 3 PORT CHARGES AND FEES 5 3.1 General provisions 5 3.2 Tonnage charge 6 3.3 Waste fee 7 3.4 Mooring charge 8 3.5 Passenger
PORT OF HELSINKI ALL OF FINLAND WITHIN YOUR REACH
 PORT OF HELSINKI ALL OF FINLAND WITHIN YOUR REACH PORT OF THE ENTIRE FINLAND One of the strengths of the Port of Helsinki is its excellent location at the heart of Finnish production, population and consumption.
RIGA FACTS & FIGURES 2018 RIGA FACTS & FIGURES 2018
 RIGA FACTS & FIGURES 2018 1 WHY RIGA? Riga in 2030 will be internationally recognizable Northern European metropolis. The full membership of the Riga in the Northern European Metropolises family based
Tourism in Tallinn 2008
 Tourism in Tallinn 28 In 28, 2.38 million tourists stayed in Estonian accommodation establishments, 5% of whom stayed in Tallinn. Arrivals in Tallinn: 1,189, (+4%)1 Bednights in Tallinn: 2,97, (%) Total
Estonia. Tourism in the economy. Tourism governance and funding
 Estonia Tourism in the economy Tourism contributes directly around 4.6% of Estonia s GDP, rising to 6.6% if indirect impacts are also included. Export revenues from tourism amount to approximately EUR
Russia 12% Russia 24% Foreign overnight stays 31% Domestic overnight stays 69% 8.3 MILLION FOREIGN VISITORS IN FINLAND IN 2017
 TOURISM IS A GROWING SOURCE OF EXPORT REVENUE AND A SIGNIFICANT EMPLOYMENT PROVIDER IN FINLAND TOURISM HAS A MULTIPLIER EFFECT ON OTHER SECTORS. 1 EURO IN TOURISM ADDS 56 CENTS VALUE TO THE OTHER SECTORS.
Baltic Marine Environment Protection Commission
 Baltic Marine Environment Protection Commission Maritime Working Group St. Petersburg, Russia, 10-12 October 2017 MARITIME 17-2017 Document title 2017 HELCOM Overview on Port Reception Facilities (PRF)
America 6% Russia 12%
 TOURISM IS A GROWING SOURCE OF EXPORT REVENUE AND A SIGNIFICANT EMPLOYMENT PROVIDER IN FINLAND TOURISM HAS A MULTIPLIER EFFECT ON OTHER SECTORS. 1 EURO IN TOURISM ADDS 56 CENTS VALUE TO THE OTHER SECTORS.
CRUISE TOURISM S CONTRIBUTION TO THE NEW ZEALAND ECONOMY 2017
 CRUISE TOURISM S CONTRIBUTION TO THE NEW ZEALAND ECONOMY 2017 21 August 2017 CRUISE TOURISM S CONTRIBUTION TO THE NEW ZEALAND ECONOMY 2017 Prepared for New Zealand Cruise Association Document reference:
The Travel and Tourism Industry in Vermont. A Benchmark Study of the Economic Impact of Visitor Expenditures on the Vermont Economy 2005
 The Travel and Tourism Industry in Vermont A Benchmark Study of the Economic Impact of Visitor Expenditures on the Vermont Economy 2005 INTRODUCTION GENERAL November, 2006 This 2005 update of the original
Prof. Dr. Alexis Papathanassis
 Prof. Dr. Alexis Institut für Maritimen Tourismus Papathanassis E-Tourism Cruise Management & Prof. Dr. Alexis Papathanassis TASH Fachtagung Kreuzfahrt - Kiel 9 th September 2011 The Potential of German
Role of Aviation Sector in Latvia Development of Riga International Airport
 Role of Aviation Sector in Latvia Development of Riga International Airport Riga International Airport Built in 1974 1% owned by the Republic of Latvia Operated by SJSC RIGA International Airport Occupies
60 26 N E. Bergen Oslo Stockholm. Helsinki Tallinn. St. Petersburg. Gothenburg Riga. Copenhagen. Klaipèda. Gdansk.
 60 26 N 22 13 E Bergen Oslo Stockholm Helsinki Tallinn St. Petersburg Gothenburg Riga Copenhagen Klaipèda Rostock Hamburg Gdansk ANCHOR AT THE PORT OF GOOD SERVICES The Port of Turku is Finland s gateway
Construction of the cruise terminal in Pionersky
 Construction of the cruise terminal in Pionersky Nikolay Mamenko, Head of commercial department, Kaliningrad Authority of Rosmorport at the Workshop Maritime and Landside Traffic Challenges of Cruise Terminals,
Mexico. How does Travel & Tourism compare to other sectors? GDP. Size. Share. Mexico GDP Impact by Industry. Mexico GDP Impact by Industry
 Mexico Chapultepec Castle in Mexico City Agriculture Automotive Manufacturing Banking Chemicals Manufacturing Communications Education Financial Services Mining Other Service Exports Retail (without wholesale)
Development of Sochi transport node envisaged by items of Program of Olympic venues construction and Sochi development as an alpine resort
 Development of Sochi transport node envisaged by items 55-60 of Program of Olympic venues construction and Sochi development as an alpine resort approved by the Regulation of the Government 991 of December
United Kingdom. How does Travel & Tourism compare to other sectors? GDP. Size. Share. UK GDP Impact by Industry. UK GDP Impact by Industry
 United Kingdom Stonehenge in Wiltshire Agriculture Automotive Banking Chemicals Communications Education Financial Mining Other Service Manufacturing Manufacturing Services Exports Retail (without wholesale)
Prof. Dr. Olga Hadžić Former Rector of the University of Novi Sad Faculty of Sciences, University of Novi Sad, Serbia Dr. Aleksandra Dragin Faculty
 Prof. Dr. Olga Hadžić Former Rector of the University of Novi Sad Faculty of Sciences, University of Novi Sad, Serbia Dr. Aleksandra Dragin Faculty of Sciences, University of Novi Sad, Serbia Cruising
The Economic Impact of Tourism on Galveston Island, Texas Analysis
 The Economic Impact of Tourism on Galveston Island, Texas 2012 Analysis Headline Results Headline results Tourism is a significant contributor to business sales, employment, and taxes on Galveston Island.
Foreign overnight stays 31% Domestic overnight stays 69% 8.3 MILLION FOREIGN VISITORS IN FINLAND IN 2017
 TOURISM IS A GROWING SOURCE OF EXPORT REVENUE AND A SIGNIFICANT EMPLOYMENT PROVIDER IN FINLAND TOURISM HAS A MULTIPLIER EFFECT ON OTHER SECTORS. 1 EURO IN TOURISM ADDS 56 CENTS VALUE TO THE OTHER SECTORS.
Annual General Meeting. 13 June 2017
 Annual General Meeting 13 June 2017 Agenda 1. Approval of the Annual Report of the financial year 2016 of AS Tallink Grupp 2. Proposal on distribution of profits 3. Extension of authorities of the members
Economical Impact on. Container Transport Market. Erik Ringmaa, Chief Commercial Officer Port of Tallinn
 Economical Impact on Container Transport Market Erik Ringmaa, Chief Commercial Officer Port of Tallinn 2008 1 Background Since the beginning of 2000's container logistic companies have enjoyed rapid growth
Malta Tourism Authority Research Unit Market Support & Development
 Evaluating Tourist Expenditure Year 2013 Malta Tourism Authority Research Unit Market Support & Development Introduction The MTA carries out a survey on tourists expenditure patterns on a continuous basis.
The Baltic States. Estonia, Lithuania and Latvia
 The Baltic States 25 th June 23 rd July 2019 Estonia, Lithuania and Latvia Positioned in the north east corner of Europe the Baltic States provide one destination with 3 countries, each having a unique
EXPERIENCE THE BUNKERING OF M/S MEGASTAR. Bergen
 EXPERIENCE THE BUNKERING OF M/S MEGASTAR Bergen 10.04.2018 CONTENTS 1. Eesti Gaas in brief. 2. Bunkering of M/S Megastar. 3. Lessons learned. 4. Results of the first year of bunkering 5. Conclusion. EESTI
The Economic Impact of Tourism in Buncombe County, North Carolina
 The Economic Impact of Tourism in Buncombe County, North Carolina 2017 Analysis September 2018 Introduction and definitions This study measures the economic impact of tourism in Buncombe County, North
FEES OF THE PORT OF PÄRNU
 FEES OF THE PORT OF PÄRNU Valid from 8 May 2015 TABLE OF CONTENTS 1. GENERAL PROVISIONS... 3 2. PORT FEES... 4 2.1 Channel fee... 4 2.2 Visiting fee... 5 2.3 Mooring fee... 5 2.4 Passenger fee... 6 2.5
THE 2006 ECONOMIC IMPACT OF TRAVEL & TOURISM IN INDIANA
 THE 2006 ECONOMIC IMPACT OF TRAVEL & TOURISM IN INDIANA A Comprehensive Analysis Prepared by: In Partnership with: PREPARED FOR: Carrie Lambert Marketing Director Indiana Office of Tourism Development
The Contribution of the International Cruise Industry to the U.S. Economy in Prepared for: Cruise Lines International Association
 BREA Business Research & Economic Advisors The Contribution of the International Cruise Industry to the U.S. Economy in 2014 Prepared for: Cruise Lines International Association September 2014 Business
Policy Research Corporation
 Policy Research Corporation SOUND SOLUTIONS BASED ON SCIENTIFIC RESEARCH The role of Maritime Clusters to enhance the strength and development of maritime sectors Country report Malta INTRODUCTION TO COUNTRY
TRAVEL DIFFERENTLY TRAVEL DIFFERENTLY! January 26-28, 2018 LITEXPO International Exhibition on Tourism and Active Leisure
 January 26-28, 2018 LITEXPO 1 January 26-28, 2018 LITEXPO International Exhibition on Tourism and Active Leisure TRAVEL DIFFERENTLY 2 Over the last five years, the international exhibition ADVENTUR has
China 17% Foreign overnight stays 31% Domestic overnight stays 69% 8.3 MILLION FOREIGN VISITORS IN FINLAND IN 2017
 TOURISM IS A GROWING SOURCE OF EXPORT REVENUE AND A SIGNIFICANT EMPLOYMENT PROVIDER IN FINLAND TOURISM HAS A MULTIPLIER EFFECT ON OTHER SECTORS. 1 EURO IN TOURISM ADDS 56 CENTS VALUE TO THE OTHER SECTORS.
Baltic Port Market. BPO Conference Riga, RECIENT FACTS & FIGURES. dr Maciej Matczak
 Baltic Port Market RECIENT FACTS & FIGURES BPO Conference Riga, 3-4.09.2015 Schedule TOTAL CARGO TURNOVER Trends of the last decade 2005-2014 First half of 2015 preliminary results MAIN TYPES OF CARGO
The Economic Impact of Tourism on Galveston Island, Texas
 The Economic Impact of Tourism on Galveston Island, Texas 2017 Analysis Prepared for: Headline Results Headline results Tourism is an integral part of the Galveston Island economy and continues to be a
Tourism Satellite Account Calendar Year 2010
 The Economic Impact of Tourism in Georgia Tourism Satellite Account Calendar Year 2010 Highlights The Georgia visitor economy rebounded in 2010, recovering 98% of the losses experienced during the recession
Spain. Spanish Visitors in Finland Statistical Trends and Profile
 Spain M A R K E T R E V I E W 2 0 1 5 Spanish Visitors in Finland Statistical Trends and Profile 25.10.2016 STATISTICS ON SPANISH TOURISM IN FINLAND STATISTICAL TRENDS 3 Registered overnights 4 Number
Benchmarking Travel & Tourism in Russia
 Benchmarking Travel & Tourism in Russia How does Travel & Tourism compare to other sectors? Sponsored by: Summary of Findings, November 2013 Outline Introduction... 3 Russia summary..... 8 Data sources
Benchmarking Travel & Tourism in Colombia
 Benchmarking Travel & Tourism in Colombia How does Travel & Tourism compare to other sectors? Summary of Findings, November 2013 Sponsored by: Outline Introduction... 3 Colombia summary..... 8 Data sources
Plan of the cruise ship Princess Anastasia
 Plan of the cruise ship Princess Anastasia Forthetouriststhereare 742cabins of different classes: Class «Suit» - 6 Class «Deluxe» - 14 Class «Commodore» - 35 Class «А» - 219 Class «В» - 468 «Suit» CABIN
TENDENCIES, PERSPECTIVES AND INVESTMENT POSSIBILITIES IN THE HUNGARIAN TOURISM
 TENDENCIES, PERSPECTIVES AND INVESTMENT POSSIBILITIES IN THE HUNGARIAN TOURISM Brussels, 6th June 2007 Dr. Ujhelyi István State Secretary Ministry of Local Government and Regional Development OPERATIONAL
Foreign Overnights in Finland 2016
 Foreign Overnights in Finland 2016 June 14, 2017 First name Last name 2 Positive outlook for Finland growing flows of visitors from several markets FOREIGN OVERNIGHTS 2016 5.8 million +4.7% growth 2016
Polish Ports in 2017 February 2018
 Polish Ports in 2017 February 2018 Summary and future outlook Summary: Polish port sector with another record-breaking result of cargo handling. Annual cargo turnover amounted 87.3 million tones, what
Tourism In The World
 HALAL TOURISM Tourism In The World The fourth largest Industry in the world 1,4 1,2 1 0,8 0,6 0,4 0,2 0 Annual Tourism Statistic 1,245 1,159 1,078 1,087 1,135 1,001 2012 2013 2014 Tourism Revenue (trilion
Aktiengesellschaft The potential of nature tourism in the Baltics view of a large European tour operator
 The potential of nature tourism in the Baltics view of a large European tour operator Dieter Semmelroth, TUI AG, Germany TUI AG Group presentation January 2011 page 30 TUI Group: Key figures financial
Accommodation statistics 2016
 Transport and Tourism 2017 Accommodation statistics 2016 Demand for accommodation services grew by 3 per cent in 2016 In 2016, accommodation in Finland recorded 203 million overnight stays, of which domestic
Norway MARKET REVIEW Norwegian Visitors in Finland Statistical Trends and Profile
 Norway MARKET REVIEW 2015 Norwegian Visitors in Finland Statistical Trends and Profile 24.11.2016 STATISTICS ON NORWEGIAN TOURISM IN FINLAND STATISTICAL TRENDS 3 Registered overnights 4 Number of visitors
Cruise Tourism White Paper
 University of Massachusetts Amherst ScholarWorks@UMass Amherst Tourism Travel and Research Association: Advancing Tourism Research Globally 2014 Marketing Outlook Forum - Outlook for 2015 Cruise Tourism
Survey on Employment in European Shipbuilding Countries. - Selected Results -
 AgS-Monitoring Shipbuilding Survey on Employment in European Shipbuilding Countries - Selected Results - Sector Committee Shipbuilding 04.05.2015 - Brussels Thorsten Ludwig Industry Related Developments
SUPERYACHTS - WORLDWIDE OVERVIEW ORDER BOOK TOTAL & by LOA
 ORDER BOOK TOTAL & by LOA Superyachts contributed 24bn to the W/W economy in 2010 Direct Contribution - 13.76bn Indirect Contribution - 10.24bn > 6.000 companies operate in the industry Jobs created are
CHL Consulting Company Ltd.
 INCOMING TOUR OPERATORS ASSOCIATION Survey of Membership Business, 2017 prepared for the by CHL Consulting Company Ltd. February, 2018 INCOMING TOUR OPERATORS ASSOCIATION Survey of Membership Business,
Economic Impact of Tourism in South Dakota, December 2018
 Economic Impact of Tourism in South Dakota, 2018 December 2018 1) Key Findings Growth rebounds in 2018 as a strong hunting season drives tourism growth Key facts about South Dakota s tourism sector Key
Baltic Sea MIRG Project
 Baltic Sea MIRG Project 1 BALTIC SEA MIRG PROJECT (2014-2016) Baltic Sea Maritime Incident Response Group (Baltic Sea MIRG) project The project will create joint MIRG coordination models and standard operating
Viking Homelands At-A-Glance
 At-A-Glance This is a one-of-a-kind itinerary where guests will have a chance to explore the entire Scandinavia and Baltic regions. Personally designed by Viking Cruises Chairman Torstein Hagen, is unique
Travel & Tourism Sector Ranking United Kingdom. Summary of Findings, November 2013
 Travel & Tourism Sector Ranking United Kingdom Summary of Findings, November 2013 Introduction Sector Ranking Analysis In order to better understand the importance of the Travel & Tourism industry in a
Port dues strategies and incentives for cruise line companies for using green port features Jakub Piotrowicz, Maritime Institute in Gdańsk
 Port dues strategies and incentives for cruise line companies for using green Jakub Piotrowicz, Maritime Institute in Gdańsk at the Green Cruise Port Workshop Measurement of regional economic effects caused
Virginia Beach Tourism Industry. Frequently Asked Questions. January, 2018
 Virginia Beach Tourism Industry Frequently Asked Questions January, 2018 Virginia Beach Convention & Visitors Bureau 2101 Parks Avenue, Suite 500 I Virginia Beach, VA 23451 I ph (757) 385-4700 I fx (757)
The Economic Impact of Tourism on Oxfordshire Estimates for 2013
 The Economic Impact of Tourism on Oxfordshire Estimates for 2013 County and District Results September 2014 Prepared by: Tourism South East Research Unit 40 Chamberlayne Road Eastleigh Hampshire SO50 5JH
FSUE ROSMORPORT CONSTRUCTION OF THE INTERNATIONAL MARINE TERMINAL WITH YACHT MARINA IN THE CITY OF PIONERSKY, KALININGRAD REGION
 FSUE ROSMORPORT CONSTRUCTION OF THE INTERNATIONAL MARINE TERMINAL WITH YACHT MARINA IN THE CITY OF PIONERSKY, KALININGRAD REGION Situated in the Northern part of the Kaliningrad peninsula, in the middle
Tour of Finland s Maritime Community
 Tour of Finland s Maritime Community Ports of Vuosaari, Kotka, and Turku Saimaa Canal Tallinn, Estonia September 7-12, 2008 Tour Participants Dr. Richard Stewart, Co-Director Stacey Carlson, Associate
2. Industry and Business
 72 Statistical Yearbook of Abu Dhabi 2016 2. Industry and Business Business Enviroment Manufacturing Oil and Gas Petrochemicals Electricity and Water Construction Transport Information and Communication
UNWTO World Tourism Conference Cruise Tourism Global Perspective
 UNWTO World Tourism Conference Cruise Tourism Global Perspective William Harber, VP Market Development, Carnival Asia Melaka, Malaysia, 21 23 October 2013 Cruising is A relatively new vacation product
The Economic Impact of Tourism in North Carolina. Tourism Satellite Account Calendar Year 2015
 The Economic Impact of Tourism in North Carolina Tourism Satellite Account Calendar Year 2015 Key results 2 Total tourism demand tallied $28.3 billion in 2015, expanding 3.6%. This marks another new high
Sweden. Swedish Visitors in Finland Statistical Trends and Profile
 Sweden M A R K E T R E V I E W 2 0 1 5 Swedish Visitors in Finland Statistical Trends and Profile 26.10.2016 STATISTICS ON SWEDISH TOURISM IN FINLAND STATISTICAL TRENDS 3 Registered overnights 4 Number
Cruise Passenger Survey and Economic Impact Study. Fll2013 Fall Report of Findings prepared for Visit Santa Barbara by Destination Analysts, Inc.
 Visit Santa Barbara Cruise Passenger Survey and Economic Impact Study Fll2013 Fall Report of Findings prepared for Visit Santa Barbara by Destination Analysts, Inc. Project Overview This report presents
PRESS RELEASE SURVEY ON QUALITATIVE CHARACTERISTICS OF RESIDENT TOURISTS: 2016 (provisional data)
") Thousands HELLENIC REPUBLIC HELLENIC STATISTICAL AUTHORITY Piraeus, 8 September 217 PRESS RELEASE SURVEY ON QUALITATIVE CHARACTERISTICS OF RESIDENT TOURISTS: 216 (provisional data) The Hellenic Statistical
Thousands HELLENIC REPUBLIC HELLENIC STATISTICAL AUTHORITY Piraeus, 8 September 217 PRESS RELEASE SURVEY ON QUALITATIVE CHARACTERISTICS OF RESIDENT TOURISTS: 216 (provisional data) The Hellenic Statistical
Republic of Turkey - Ministry of Economy,
 Republic of Turkey - Ministry of Economy, 2012 0 SHIPBUILDING INDUSTRY Turkey is surrounded by sea on three sides, is a natural bridge between Asia and Europe. Turkey borders the Black Sea, the Mediterranean,
Self Catering Holidays in England Economic Impact 2015
 Self Catering Holidays in England Economic Impact 2015 An overview of the economic impact of self catering holidays in England Published by The South West Research Company Ltd March 2017 Contents Page
South Korea. South-Korean Visitors in Finland Statistical Trends and Profile
 South Korea M A R K E T R E V I E W 2 0 1 5 South-Korean Visitors in Finland Statistical Trends and Profile 14.10.2016 STATISTICS ON KOREAN TOURISM IN FINLAND STATISTICAL TRENDS 3 Registered overnights