Moderator: Greg Guatto, President & CEO, Aspen Properties
|
|
|
- Isabella Jennings
- 5 years ago
- Views:
Transcription

1 Session C2 2:10pm ONE SIZE DOES NOT FIT ALL: UNDERSTANDING THE FACTS & FALLACIES BETWEEN EDMONTON & CALGARY AND HOW THEY ARE PERFORMING IN TODAY S ECONOMY Moderator: Greg Guatto, President & CEO, Aspen Properties Speakers: Craig Dickie, President, Walton Development and Management LP Deana Haley, Vice President, Business Development & Workforce Innovation, Calgary Economic Development Glen Scott, Senior Vice President, Real Estate, Katz Group Cory Wosnack, Principal, Avison Young

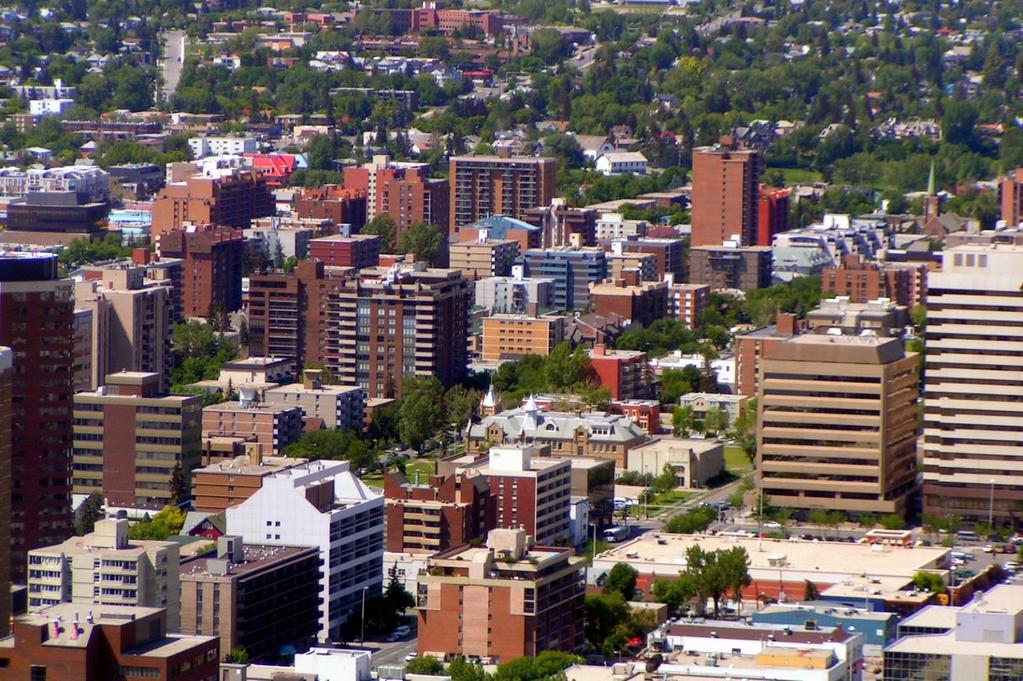
2 Calgary Real Estate Forum October 25, 2016 Calgary Economic Development s collaborative energy makes us a conduit, connector and catalyst Calgary.
3 economy
4 Major Canadian Cities Comparison Vancouver Edmonton Calgary Saskatoon Toronto Ottawa Montreal Canada 2016 Forecasted GDP Growth 4.0% -1.4% -2.1% 1.7% 3.4% 1.7% 1.6% 1.5% CMA Population 2,504,340 1,363,277 1,439, ,975 6,129,934 1,332,001 4,060,692 35,851,774 (July 1, 2015) 2015 Population Growth 1.2% 2.4% 2.4% 2.0% 1.3% 1.2% 0.8% 0.9% Unemployment Rate 4.9% 7.7% 9.5% 5.2% 7.1% 6.4% 7.6% 7.0% (September 2016) Participation Rate (September 2016) Employment Growth 80,800-6,700-17, ,900 8,600 7, ,800 (12 months ending September 2016) 6.3% -0.9% -2.2% -0.4% 0.2% 1.2% 0.3% 0.8% Full-Time Employment Growth (12 months ending September 2016) Part-Time Employment Growth (12 months ending September 2016) 66.6% 72.3% 73.3% 72.8% 66.3% 68.9% 66.1% 9.4% 8.4% 13.1% 3.3% 4.6% 8.6% -0.3% 65.7% 5.5% -3.1% -4.7% -1.5% -0.4% 0.0% 0.3% 0.3% 2.6% Provincial Average Weekly Earnings (July 2016) $ $1, $1, $ $ $ $ $ Source: Conference Board of Canada, Statistics Canada
5 Annual Forecasted Real GDP Growth Rates Across Canada 4.5% 3.5% 2.9% 3.3% 3.1% GDP Annual Growth Rate 2.5% 1.5% 0.5% -0.5% 2.0% 2.6% 2.2% -1.5% -2.1% -2.5% 2016F 2017F 2018F 2019F 2020F Edmonton Calgary Canada Source: Conference Board of Canada
6 Calgary Forecast GDP by Industry 2016 (2007 $ Millions) 2020 (2007 $ Millions) Total change (%) Goods-Producing Industries 50,095 57, % Manufacturing 5,533 6, % Construction 8,297 9, % Primary and utilities 36,266 41, % Services-Producing Industries 62,704 68, % Transportation and warehousing 5,152 5, % Information and cultural industries 3,133 3, % Wholesale and retail trade 9,038 9, % Finance, insurance and real estate and leasing 18,290 19, % Business services 10,732 11, % Personal services 4,354 4, % Non-commercial services 8,849 9, % Public administration and defence 3,157 3, % All Industries 112, , % Source: The Conference Board of Canada
7 Small Businesses per Capita Across Canada Vancouver Edmonton Calgary Saskatoon Toronto Ottawa Montreal Canada Source: Statistics Canada, June 2016, Less Than 50 Employees (Per 1,000 Population)
8 Business Bankruptcy Rates Across Canada Vancouver Edmonton Calgary Saskatoon Toronto Ottawa Montreal Canada Source: Office of the Superintendent of Bankruptcy Canada, 2015, (Per 1,000 Businesses)
9 Labour Supply & Demand
10 10% 9% Unemployment Rate Across Canada 9.5% 8.7% 8% 7.7% 7.6% 7% 6% 5.8% 6.0% 7.0% 7.1% 6.9% 6.3% 6.4% 5.9% 7.1% 6.9% 7.0% 5% 4.9% 4% 3% 2% 1% 0% Vancouver Edmonton Calgary Toronto Ottawa Montreal Saskatoon Canada September 2015 September 2016 Source: Statistics Canada
11 76% 74% 72% Labour Force Participation Rate Across Canada 74.1% 73.3% 73.3% 72.6% 71.3% 70% 69.1% 69.7% 69.1% 68% 66% 66.8% 67.2% 66.6% 66.8% 65.9% 65.6% 65.7% 64% 64.2% 62% 60% 58% Vancouver Edmonton Calgary Saskatoon Toronto Ottawa Montreal Canada September 2015 September 2016 Source: Statistics Canada
12 Annual Employment Growth 14.0% 13.1% 12.0% 10.0% 8.0% 9.4% 8.4% 8.6% 6.0% 6.3% 5.5% 4.6% 4.0% 3.3% 2.6% 2.0% 0.0% -2.0% -4.0% -0.9% -3.1% -2.2% -0.4% -1.5% 0.2% -0.4% 1.2% 0.0% 0.3% 0.3% 0.8% 0.3% -0.3% -6.0% -4.7% Vancouver Edmonton Calgary Saskatoon Toronto Ottawa Montreal Canada Total Employment Growth Rate Full-Time Employment Growth Rate Part-Time Employment Growth Rate Source: Statistics Canada, September September 2016

13 80,000 70,000 Components of Population Growth Across Canada 66,697 60,000 50,000 40,000 30,000 28,988 35,311 34,666 20,000 10, ,000-20,000-30,000 8,599 15,224 12,732 10,069 11,834 9,893 8,545 5,385 6,185 2,596 4,377 5,206 2,619 1, ,395-2,729-3,616-10,683-22,751 Vancouver Edmonton Calgary Toronto Ottawa Montreal Natural Increase Net Interprovincial Migration Net Intraprovincial Migration Net International Migration Source: Statistics Canada, July 2015
14 Changing Employment Picture 3,000 2,000 Calgary CMA Monthly Net Jobs Gained or Lost by Industry (August September 2016) 2,100 1,500 1,600 1,900 1, ,000-2, , ,100-3,000-4,000-5,000-4,600 Agriculture Forestry, Fishing, Mining, Quarrying, Oil and Gas Utilities Construction Manufacturing Trade Transportation and Warehousing Finance, Insurance, Real Estate and Leasing Professional, Scientific and Technical Services Business, Building and Other Support Services Educational Services Health Care and Social Assistance Information, Culture and Recreation Accommodation and Food Services Other Services Public Administration Source: Statistics Canada
15 Changing Employment Picture 5,000 4,000 Edmonton CMA Monthly Net Jobs Gained or Lost by Industry (August September 2016) 4,300 3,000 2,000 1, ,000-2,000-3, ,200 1, , ,000-1, , , ,000 Agriculture Forestry, Fishing, Mining, Quarrying, Oil and Gas Utilities Construction Manufacturing Trade Transportation and Warehousing Finance, Insurance, Real Estate and Leasing Professional, Scientific and Technical Services Business, Building and Other Support Services Educational Services Health Care and Social Assistance Information, Culture and Recreation Accommodation and Food Services Other Services Public Administration Source: Statistics Canada

16 LabourSupply Available occupations anticipated to grow in demand nationally over the next 5 years Financial Auditors Accounting Clerks Information Systems Analysts Lawyers Business Management Consultants Computer Programmers Civil Engineers Mechanical Engineers Purchasing Agents Electrical Engineers Power Engineers Geoscientists Architects Natural and Applied Scientists Geological Technologists Petroleum Engineers Financial Analysts Biologists Investment Brokers Land Surveyors Database Analysts
17 Labour Demand ICT is outpacing all job growth by 4:1. Canada will need to fill 182,000 ICT professional positions by 2019 (17,300 for Alberta). - ICTC, 2015
18 Labour Demand Finance, Insurance, Real Estate and Leasing will grow by 1.6% annually, reaching 4.8% of total employment in 2019 and gain 68,100 jobs by Government of Alberta, 2016; Statistics Canada, 2016
19 Labour Demand The Logistics sector in Alberta will grow by about 7,470 workers from 2016 to APGC, 2016
20 Labour Demand Manufacturing accounts for 6.1% of total employment in Alberta, employment will grow by 1.1% annually and account for 6.5% of total employment by Government of Alberta, 2016
21 Labour Demand The Oil and Gas sector will have 28,025 to 36,240 net hiring requirements in Canada from 2017 to PETROLMI/ENFORM, 2016
22 Labour Demand Clean Tech (including Renewables) will employ anywhere from 76,000 to 100,000 Canadians directly by 2022, up from 55,600 jobs in Analytica Advisors, 2016
23 Areas of focus Sector Opportunities Transportation & Logistics Agribusiness Renewables Clean Technologies Manufacturing Information, Communication & Technology Creative Industries Digital Media Financial Services
24 Tax Advantages British Columbia Alberta Saskatchewan Ontario Quebec Provincial Sales Tax 7% 0% 5% 8% 9.975% 2015 Provincial Personal Income Tax 5.06% % 10% - 15% 11% - 15% 5.05% % 16% % 2016 Provincial Corporate Income Tax (General) 11.0% 12.0% 12.0% 11.5% 11.9% 2016 Provincial Corporate Income Tax (Small Business) 2.5% 2.0% 2.0% 4.5% 8.0% 2015 Provincial Payroll Tax (Employer Health Premiums) 0% 0% 0% 0.98% % 2.7% % 2015 Local, Provincial & Federal Gasoline Tax /L 23 /L 25 /L 24.7 /L 33.2 /L 2015 Land Transfer Tax 1% - 2% 0% 0% - 0.3% 1% - 4% 0.5% - 1.5% 2016 Health Care Premiums $0 - $150 $0 $0 $0 - $900 $0 - $ Total Effective Tax Rates 35.3% 30% 31.9% 34.1% 41.3%

25 Thank you Deana Haley, VP Business Development & Workforce Innovation calgaryeconomicdevelopment.com st St. SE Calgary, AB T2G 2G9 Facebook.com/calgaryeconomic Twitter.com/calgaryeconomic Youtube.com/calgaryeconomic LinkedIn.com/calgaryeconomic


26 The Real Estate Markets How do they Differ? How are they Performing?
27 Comparing CBD Office Space Available vs Occupied Space Square Feet 45M 40M 35M 30M 25M 20M 15M 10M 5M 0M 3.12M 15.33M Edmonton 9.47M 32.36M Calgary Occupied Available Source: Colliers International/CBRE Note: New supply being delivered: Edmonton: 1.7M sq.ft Calgary: 2.3M sq.ft
28 Calgary Downtown Absorption & Vacancy since 2004 Absorption Vacancy 2,700, % 2,200,000 1,700,000 1,200, % 700, , % 300, (YTD) 800, % 1,300,000 1,800, % Source: Colliers International/CBRE YTD Absorption Calgary (1.89M) sq.ft
29 Edmonton Financial Absorption & Vacancy since ,000 Absorption Vacancy 12.00% 300, % 200, % Absorption 100, % YTD 4.00% 100, % 200, % Source: Colliers International/CBRE YTD Absorption Edmonton (239K) sq.ft
30 Comparing Overall Industrial Space Available vs Occupied Space 140M 120M 100M 5.76M 9.40M Square Feet 80M 60M 40M M M 20M 0M Edmonton Calgary Occupied Available Source: Colliers International/CBRE Note: New supply being delivered: Edmonton: 2.2M sq.ft Calgary: 1.4M sq.ft
31 Comparing Overall Industrial Space % Vacant Historical Vacancy Rates Edmonton Calgary YTD Absorption Edmonton 1.08M sq.ft Calgary (887K) sq.ft Source: Colliers International/CBRE


32 Retail
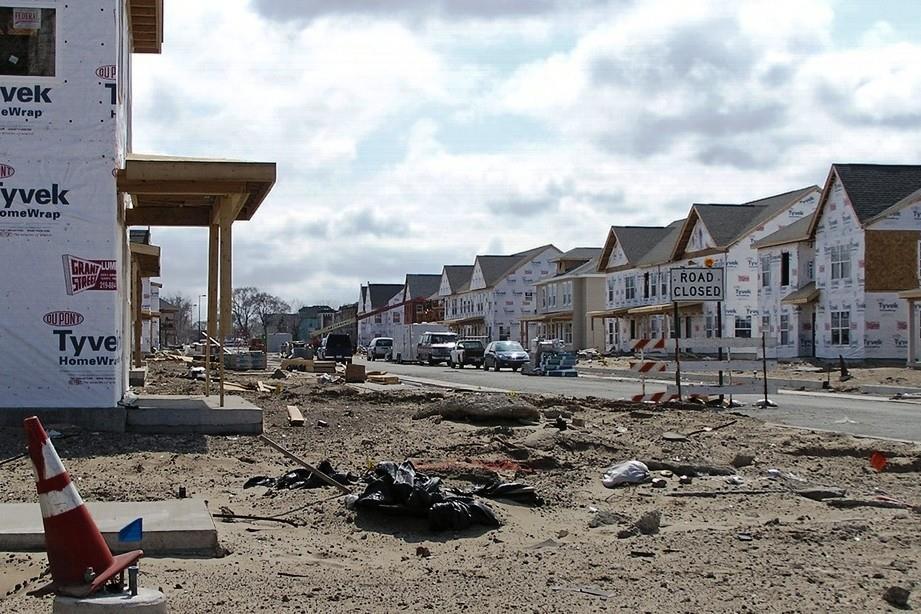
33 Land Development / Residential

34

35 WEST EDMONTON MALL Completion Time: 20 years Phase 1: September, 1981 Phase 2: September, 1983 Phase 3: September, 1985 Phase 4: 1999 Age: 35 years Parking for 20,000 vehicles plus 10,000 overflow Most recent upgrade completed in 2014 Features: Amusement Park Waterpark Indoor Pool Ice Rink Hotel Recreation Centre Three radio stations Restaurants and Eateries


36 DOWNTOWN EDMONTON JASPER AVENUE Population grows from 77,500 in 1930 to 606,000 in 2009
37 DOWNTOWN EDMONTON CONSTRUCTION Downtown Edmonton 1971 to Construction Projects 2.40% 4.80% Downtown Edmonton 1991 to Construction Projects 0.02% 34% 56% 0.08% Residential Office Hotel Sports Residential Office

38 2011 Live - Work - Play Construction completed on the EPCOR building Increased migration to the inner city with less reliance on cars People want to live where they work Decrease in household size resulting in a significant increase in lone person or 2 person households Resources to attract people and people to attract resources Movement towards more eclectic and unique collection of businesses and services Core communities attracting a younger population (median age is years) Population in the downtown core has doubled since the turn of the century and projected to triple by 2030
 Royal Alberta Museum - $400M Hotel - $400M Stantec Tower $700M Edmonton Tower $400M Art")
39 LRT Expansion 1.4B University Expansion $200M Arena $600M Block K $100M EPCOR $300M (Est.) Royal Alberta Museum - $400M Hotel - $400M Stantec Tower $700M Edmonton Tower $400M Art Gallery $50M
40 DOWNTOWN EDMONTON VALUE OF BUILDING PERMITS ISSUED


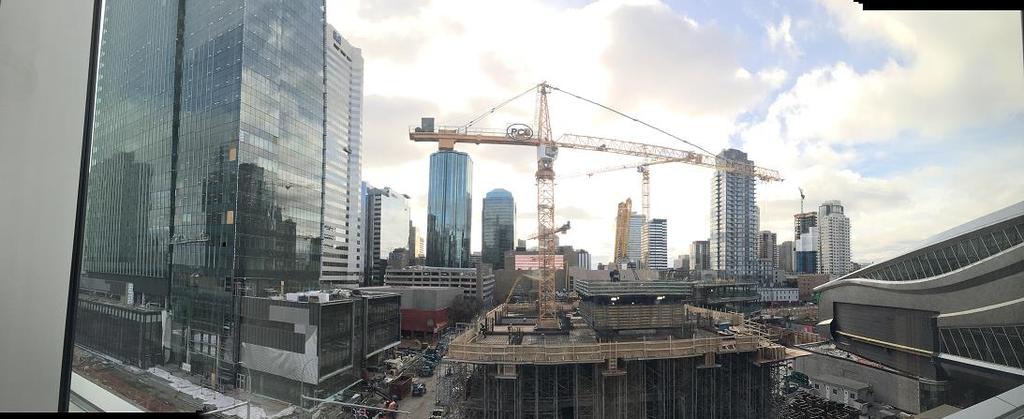
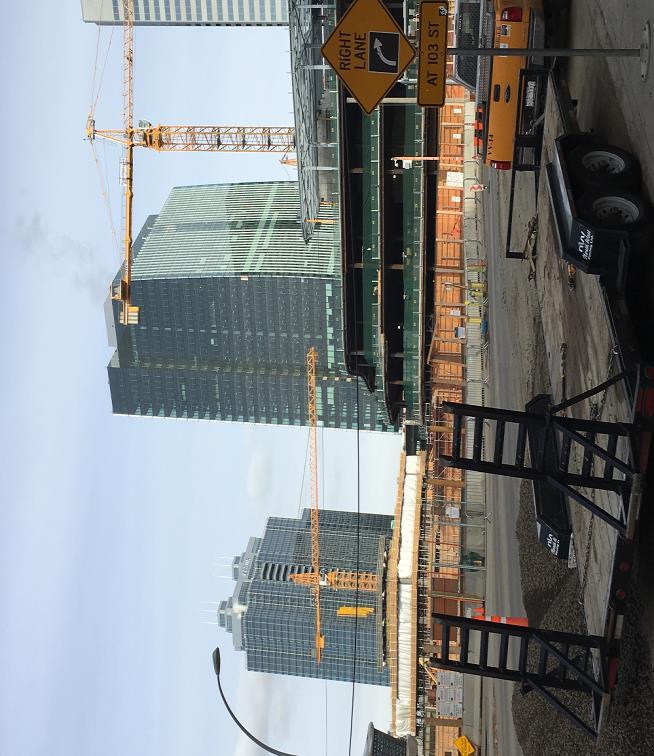
41 ICE DISTRICT EDMONTON EAST VILLAGE CALGARY 49 Acres of Community Space 2.4 Billion in development attracted to the community 6.8 million square feet of development 2 hotels Over 30 contiguous acres in downtown Edmonton 2.65 Billion in investment 1.3 Million sq. ft. of office space 320,000 sq. ft. of retail space JW Marriott hotel tower with 344 Guest Rooms and 24 floors of premium Condos above Rogers Place Arena Ford Hall with 24,000 sq ft space for public/private events 73 acres of Park Space Phase I Residential Units 3,900 condos and townhouses Total 11,000 new residents over 10 years Phase II Residential Units Total 10,600 new residents over 4 years
42
Key Stats. Of 11 peer cities assessed, Calgary has the second highest level of economic power comparing GDP per capita
 economy 20 Key Stats Of 11 peer cities assessed, Calgary has the second highest level of economic power comparing GDP per capita - Deloitte, Benchmarking Calgary s Competitiveness, 2015 Of 11 peer cities
The Saskatchewan Economic Outlook: On Solid Footing
 The Saskatchewan Economic Outlook: On Solid Footing Saskatchewan Real Estate Forum Mario Lefebvre Director, Centre for Municipal Studies The Conference Board of Canada April 30, 2013 www.conferenceboard.ca
Real Estate Indicators Summary
 real estate 103 Real Estate Indicators Summary Housing Starts Date Value Change/Rate (%) Year-to-Date Year-Over-Year C hange October 2017 Geography 9,347 24.2% Calgary CMA Total Value of Building Permits
Why Calgary? Our Economy in Depth
 Why Calgary? Our Economy in Depth January 2018 Calgary Economic Development s collaborative energy makes us a conduit, connector and catalyst Calgary. 1 Table of Contents 01 Location Where is Calgary 02
Real Estate Indicators Summary
 real estate 110 Real Estate Indicators Summary Housing Starts Date Value Change/Rate (%) Year-to-Date Year-Over-Year C hange; YTD September 2018 Geography 8,919 6.3% Calgary CMA Total Monthly Value of
State of the Economy St. John's Metro
 State of the Economy St. John's Metro Published by: Department of Economic Development, Tourism & Culture City of St. John's Email: business@stjohns.ca Although every effort has been made to ensure the
Economy at a glance: Calgary s advantages
 Economy at a glance: Calgary s advantages Slide 1 Where is Calgary? Strategic location Western Canada s business centre 136 head offices in Calgary Western Canada s distribution hub Highway 1 and Canamex
Calgary, Heart of the New West Western Canada's business centre. August 2012
 Calgary, Heart of the New West Western Canada's business centre August 2012 Where is Calgary? Strategic Location Western Canada s business centre 123 head offices in Calgary Western Canada s distribution
Edmonton Real Estate Forum
 Edmonton Real Estate Forum On Solid Footing Shaw Conference Centre May 10, 2012 Mario Lefebvre Director, Centre for Municipal Studies lefebvre@conferenceboard.ca Uneven Growth in Global Economy (per cent
Consider Canada s large cities for global trade and investment
 Consider Canada s large cities for global trade and investment October 2013 Consider Canada City Alliance mission: a unified voice for Canada s large cities 11 cities working together to promote Canada
2016 Commercial Real Estate. Review and Forecast
 2016 Commercial Real Estate Review and Forecast February 4, 2016 Colliers International Saskatchewan Economic Overview Real GDP Growth 6.0% 2014 2015 2016f 5.0% 4.0% 3.0% 2.0% 1.0% 0.0% -1.0% Vancouver
Dufferin County Housing Market Update Orangeville November 24, 2015
 Dufferin County Housing Market Update Orangeville November 24, 2015 Housing market intelligence you can count on Dufferin County Core Housing Need 25% 2006 2011 20% 19.8% 20.1% 18.1% 15% 15.2% 10% 10.5%
Presentation to Brampton Real Estate Board
 Presentation to Brampton Real Estate Board City of Brampton October 217 Economic Development and Cultural Department Economic Development Cultural Services Advance Manufacturing Human Health & Sciences
Ottawa-Gatineau s Economic Outlook
 Ottawa-Gatineau s Economic Outlook Slow Growth, but Growth Nonetheless Mario Lefebvre Director, Centre for Municipal Studies The Ottawa Real Estate Forum October 11, 2012 Canadian Outlook The Canadian
State of the Economy St. John's Metro
 State of the Economy St. John's Metro September 2017 Published by: Economic Development, Culture & Partnerships Division Department of Community Services City of St. John's Email: business@stjohns.ca Economic
State of the Economy St. John's Metro
 State of the Economy St. John's Metro May 2017 Published by: Economic Development, Culture & Partnerships Department of Community Services City of St. John's Email: business@stjohns.ca Economic Updates
Indicator Highlights - Annual
 Economic Overview 2012 Economic Development March 5, 2013 Indicator Highlights - Annual Geography 2010 2011 2012 % Change Status Unemployment Rate Toronto 9.9% 9.2% 9.6% Canada 8.0% 7.5% 7.3% Participation
BC JOBS PLAN ECONOMY BACKGROUNDER. Current statistics show that the BC Jobs Plan is working: The economy is growing and creating jobs.
 We know that uncertainty continues to remain in the global economy and we expect to see some monthly fluctuations in jobs numbers. That is why we will continue to create an environment that is welcoming
Westbrook Station. Transit Oriented Development Opportunity
 DEVELOPM Westbrook Station Transit Oriented Development Opportunity OPPOR Table of Contents Prime Real Estate Development Opportunity page 1 Calgary City of Opportunity page 3 What is Transit Oriented
DISCLAIMER. Please contact with any questions. Altus Group Limited altusgroup.com/datasolutions
 DISCLAIMER This presentation, or any part thereof, may not be reproduced or transmitted in any form by any means, without the express written permission of Altus Group in each instance. The material in
The Canadian Retail Real Estate Market Overview
 The Canadian Retail Real Estate Market Overview Presented for: Toronto Real Estate Forum 2013 Presented by: John G. Crombie, National Retail Director Cushman & Wakefield Ltd. john.crombie@ca.cushwake.com
2016 CENSUS BULLETIN #1 POPULATION & DWELLING COUNTS
 CENSUS BULLETIN #1 POPULATION & DWELLING COUNTS February 8 th, 2017 Bulletin Highlights: Brampton s : Brampton is 9 th largest City in Canada Brampton is 4 th largest City in Ontario Brampton is 3 rd largest
Halifax Economic Report
 Halifax Economic Report JANUARY 2017 J.K. MacAdam Economist and Project Development Specialist Highlights 2016 was another positive year for the Halifax economy, with growth in shipbuilding, the health
The Canadian Retail Real Estate Market Real Estate Forum. Presented to:
 The Canadian Retail Real Estate Market Presented to: 2012 Real Estate Forum Presented by John G. Crombie National Retail Director Cushman & Wakefield Ltd. 416-756-5448 Retail Real Estate Canadian Retail
Demographic Rankings
 demographics 82 Demographic Rankings Second highest level of educational attainment of major Canadian cities Calgary ranked #3 in Top 10 Places to Raise Kids Calgary ranked #19 in Overall Ranking MoneySense
ALBERTA ACCOMMODATION OUTLOOK 2018
 ALBERTA ACCOMMODATION OUTLOOK 2018 ALBERTA HOTEL & LODGING ASSOCIATION APRIL 17, 2018 PRESENTATION OUTLINE National Western Canada Alberta Calgary & Edmonton Investment Trends Key Takeaways Questions NATIONAL
Economic Dashboard March 30, 2015
 Attachment 2 Economic Dashboard March 30, 2015 toronto.ca/business toronto.ca/culture Note: Top symbol compares how Toronto s position has changed; bottom symbol compares Toronto s performance to Canada
transportation + demographics = opportunity
 transportation + demographics = opportunity the big picture rollin stanley urban strategy City of Calgary Rollin Stanley hamilton chamber of commerce June 2017 Rollin Stanley Title goes here hamilton has
STANTEC TOWER. FOR LEASE Avenue NW Edmonton, AB
 STANTEC TOWER FOR LEASE 10220-103 Avenue NW Edmonton, AB 14 19 6 5 8 7 11 10 3 12 9 13 15 18 17 16 OPEN 1 MACEWAN LRT STATION 2 3 4 5 6 7 2018 9 PUBLIC PLAZA 10 ROGERS PLACE FORD HALL EDMONTON DOWNTOWN
1 st Quarter Report City of Chandler - Economic Development Division
 Fiscal Year 26-27 1 st Quarter Assisted Projects Locates Sites Industrial Ticer Technologies Frye Rd Industrial Park Air Products 54th St & Detroit Craftco Arizona Ave & Riggs Audi of Chandler Ray Rd.
The Yorke & Mid North (State Govt) Region. Workforce Wizard Region Report
 Region. Workforce Wizard Region Report") The Yorke & Mid North (State Govt) Region Workforce Wizard Region Report Table of Contents Executive Summary 3 Population and Social Characteristics 4 Current Population 4 Age Groups 4 Key Populations
The Yorke & Mid North (State Govt) Region Workforce Wizard Region Report Table of Contents Executive Summary 3 Population and Social Characteristics 4 Current Population 4 Age Groups 4 Key Populations
Brampton Economic and Market Snapshot 2013
 D4-1 prepared by the Brampton Economic Development Office Business Attraction and Retention Committee February 18, 214 Business Attraction and Retention Advisory Committee Date: February 18, 214 Brampton
Why Calgary? Our Economy in Depth
 Why Calgary? Our Economy in Depth October 2018 Calgary Economic Development s collaborative energy makes us a conduit, connector and catalyst Calgary. 1 Table of Contents 01 Location Where is Calgary 02
Move Up Prince George. Local Government Management Association June 17, 2015
 Move Up Prince George Local Government Management Association June 17, 2015 Initiatives Prince George (IPG) Economic development corporation for the City of Prince George Facilitate current business retention
MINING IN TASMANIA: DINOSAUR OR DELIVERER?
 MINING IN TASMANIA: DINOSAUR OR DELIVERER? PRESENTATION TO A FORUM HOSTED BY THE ACADEMY OF TECHNOLOGICAL SCIENCES AND ENGINEERING (ATSE) FOR NATIONAL SCIENCE WEEK RACV APARTMENT HOTEL, HOBART 3 RD AUGUST
Tough Times: Coming to Terms with Recession
 1 Tough Times: Coming to Terms with Recession presented to: Vancouver Real Estate Forum April 23, 2009 Vancouver, BC Business Council of British Columbia Jock Finlayson EXECUTIVE VICE PRESIDENT - POLICY
Shantz Village. Development Summary November Steve Seiler, Senior Associate. Daniel Goldstrom, Partner
 A D U L T C O M M U N I T Y November 2017 45 Acre Mixed Use Development Staged Closing to 2021 35.55 Acres Net 10 Lots Zoned Fully Serviced Curb & Gutter 8.18 Acres 75 Adult Villas 7.87 Acres Supportive
Agenda. Introduction YYC. Looking Ahead in 2014
 Agenda Introduction 2013 @ YYC Looking Ahead in 2014 Introduction The Airport Transfer Process in Canada From coast to coast: A Canadian success story $20 billion infrastructure investment Canadian airports
Figure 1.1 St. John s Location. 2.0 Overview/Structure
 St. John s Region 1.0 Introduction Newfoundland and Labrador s most dominant service centre, St. John s (population = 100,645) is also the province s capital and largest community (Government of Newfoundland
ISRAEL- COUNTRY FACTS
 ISRAEL- COUNTRY FACTS ISRAEL-NEIGHBOURING COUNTRIES AND POLITICAL MAP Area: 22,072 sq. km Land area: 21,643 sq. km. Fast Facts Area of lakes: 429 sq. km. (Sea of Galilee 164 sq. km., the Dead Sea - 265
The Economic Impact of Tourism in North Carolina. Tourism Satellite Account Calendar Year 2013
 The Economic Impact of Tourism in North Carolina Tourism Satellite Account Calendar Year 2013 Key results 2 Total tourism demand tallied $26 billion in 2013, expanding 3.9%. This marks another new high
Canadian Metropolis 1
 Canadian Metropolis 1 The Importance of Cities in Canada 80%+ of the population is urban Most of the urban population lives in large cities Cities of vital economic importance The 10 largest Canadian cities
TRANSAT TUESDAY. Ontario departures Riviera Maya, Mexico. Catalonia Playa Maroma 4H. Garden View Room. Toronto Jan 15, 22 $ 1599 Was $ 1909
 Ontario departures Riviera Maya, Mexico Toronto Jan 15, 22 1599 Was 1909 Flights are from Toronto via Air Transat in Economy Class. Prices valid for 48 hours, no exceptions. Prices include applicable taxes
Business Profile. oakville
 Business Profile oakville Location and Transportation When you locate in Oakville, you re connected to the world. Situated at the epicentre of Canada s golden horseshoe, Oakville is a dynamic community
Annual General Meeting. April 15, 2010
 Annual General Meeting April 15, 2010 AGENDA 2009 In Review Activity Levels Financial Overview Performance Measures Key Activities Moving Forward Activity Levels Passenger Activity (2009) Total Passengers
Manawatu District Economic Profile
 Manawatu District Economic Profile Our community Population has grown by 1,000 residents since 2014 to reach 29,800. Population is 86.4% European, with Maori 14.3% of the population. This compares with
Charterhouse Salary Guide UAE
 Banking - Asset Management and Investment INVESTMENT BANKING / PRIVATE EQUITY - ORIGINATION ROLES Analyst 20,000 15,000 25,000 Associate 33,000 25,000 45,000 Vice President 50,000 35,000 65,000 Director
FOR SALE FOR SALE SINGLE-TENANT INVESTMENT OPPORTUNITY 2601 HIGHWAY 6 VERNON, BC SINGLE-TENANT INVESTMENT OPPORTUNITY 2601 HIGHWAY 6 VERNON, BC
 FOR SALE CO-LISTED BY: *Personal Real Estate Corporation BOE IRAVANI* 604 640 5837 boe.iravani@ca.cushwake.com JOE GENEST* 604 398 4341 jgenest@form.ca JON BUCKLEY* 604 630 0215 PROPERTY HIGHLIGHTS INVESTMENT
The Economic Impact of Tourism in Maryland. Tourism Satellite Account Calendar Year 2015
 The Economic Impact of Tourism in Maryland Tourism Satellite Account Calendar Year 2015 MD tourism economy reaches new peaks The Maryland visitor economy continued to grow in 2015; tourism industry sales
Contents Manningham at a Glance... 6 Location and Area... 6 Manningham Activity Centres... 6 Manningham Suburbs... 6 Population... 8 Forecast... 9 For
 Contents Manningham at a Glance... 6 Location and Area... 6 Manningham Activity Centres... 6 Manningham Suburbs... 6 Population... 8 Forecast... 9 Forecast 2011 2036... 9 Population Forecast... 9 Gross
Brand New Prestigious Main Floor Retail Space
 Brand New Prestigious Main Floor Retail Space Downtown Edmonton s best location on the corner of 104 St. and 102 Ave. Occupancy August 2017 Marino Padoan B.Ed., L.Aud.Eng., Ph.D Direct +1 780 917 8340
Economic Dashboard September 4, toronto.ca/business toronto.ca/culture
 Economic Dashboard September 4, 2015 toronto.ca/business toronto.ca/culture Note: Top symbol compares how Toronto s position has changed; bottom symbol compares Toronto s performance to Canada Indicator
THE 2006 ECONOMIC IMPACT OF TRAVEL & TOURISM IN INDIANA
 THE 2006 ECONOMIC IMPACT OF TRAVEL & TOURISM IN INDIANA A Comprehensive Analysis Prepared by: In Partnership with: PREPARED FOR: Carrie Lambert Marketing Director Indiana Office of Tourism Development
North Carolina (Statewide) 2016 Prosperity Zone Data Books
 2016 Prosperity Zone Data Books") North Carolina (Statewide) 2016 Prosperity Zone Data Books 2 North Carolina Prosperity Zones Western North Carolina Prosperity Zones Northwest Region Piedmont-Triad Region Western Region Southwest Region
North Carolina (Statewide) 2016 Prosperity Zone Data Books 2 North Carolina Prosperity Zones Western North Carolina Prosperity Zones Northwest Region Piedmont-Triad Region Western Region Southwest Region
VALUE OF TOURISM. Trends from
 VALUE OF TOURISM Trends from 2005-2015 March 2017 TABLE OF CONTENTS 1. Overview... 2 Key highlights in 2015... 2 2. Contributions to the economy... 4 TOURISM REVENUE... 5 Total revenue... 5 Tourism revenue
Kern County: Last Redoubt of the California Dream?
 Kern County: Last Redoubt of the California Dream? Speech to Kern County EDC Economic Summit Bakersfield, CA March 15, 2017 By Joel Kotkin, Presidential Fellow in Urban Futures, Chapman University and
NUNAVIK'S LABOUR MARKET AND EDUCATIONAL ATTAINMENT PARADOX
 NUNAVIK'S LABOUR MARKET AND EDUCATIONAL ATTAINMENT PARADOX Andrew Sharpe and Jasmin Thomas Presentation prepared for Mapping the Road Together to Sustainable Employment; Celebrating 25 Years. Katittavik
WOOD BUFFALO REGIONAL MAP
 REGIONAL DATA WOOD BUFFALO REGIONAL MAP TOTAL: 66,361 KM 2 Regional Communities: 1. Fort Fitzgerald 2. Fort Chipewyan 3. Fort McKay 4. Fort McMurray 5. Draper 6. Saprae Creek Estates 7. Gregoire Lake
Lodging Outlook. Canadian August What Does a Franchise Cost? computers and reservation personnel.
 Canadian August 2005 Lodging Outlook SMITH TRAVEL RESEARCH What Does a Franchise Cost? By: Stephen Rushmore, MAI, CHA - HVS International - New York T he selection of an appropriate hotel franchise affiliation
CITY MAP. Real Estate Market
 Saskatoon, also known as the Hub City refers to its favourable central location in the province of Saskatchewan. The City of Saskatoon indicates the city s population to be 253,000 as of March 2014, and
Ontario A Strategic Location & Innovation Corridor A Strategic location With just-in-time delivery the standard, location is critical and Ontario s is
 Ontario A Strategic Location & Innovation Corridor A Strategic location With just-in-time delivery the standard, location is critical and Ontario s is ideal. In fact, for advanced manufacturers eager to
The Economic Impact of Tourism in Maryland. Tourism Satellite Account Calendar Year 2016
 The Economic Impact of Tourism in Maryland Tourism Satellite Account Calendar Year 2016 County Results Washington County, Visitors Washington County Visitors (thousands) Year Overnight Day Total Growth
Industry Update. ACI-NA Winter Board of Directors Meeting February 7, 2018 Palm Beach Gardens, FL
 Industry Update ACI-NA Winter Board of Directors Meeting February 7, 2018 Palm Beach Gardens, FL 1Q2007 2Q2007 3Q2007 4Q2007 1Q2008 2Q2008 3Q2008 4Q2008 1Q2009 2Q2009 3Q2009 4Q2009 1Q2010 2Q2010 3Q2010
Fastest Growing Industries: Aviation & Aerospace. A guide for newcomers to British Columbia
 Fastest Growing Industries: Aviation & Aerospace Contents 1. Overview of the Aviation & Aerospace Industry... 2 2. Occupations in the Aviation & Aerospace Sector... 5 3. Hiring Forecast by Region... 7
FOR SALE FOR SALE PRICE REDUCED SUBJECT SITE
 STAND ALONE SHOPPERS DRUG MART INVESTMENT OPPORTUNITY WITH FUTURE DRIVE-THRU PAD POTENTIAL PRICE REDUCED SUBJECT SITE Parkwood Place Highway 16 Spruceland Mall PRINCE GEORGE To Alberta Pine Centre Mall
HEALTH SECTOR ECONOMIC INDICATORS REPORT
 HEALTH SECTOR ECONOMIC INDICATORS REPORT For: Mid North Coast Local Health District Report prepared by: April 2013 Table of Contents Introduction 3 Executive Summary 4 Output 5 Value-Added 7 Workforce
The Benefits of Tourism
 The Benefits of Tourism The Benefits of Tourism Diversification of tourism industry infrastructure Contributions to the balance of payments Increase in tax revenues Improved job opportunities Improved
CALGARY, ALBERTA, CANADA
 photo credit: Travel Alberta GEOGRAPHY CALGARY, ALBERTA, CANADA Calgary is 848 square kilometres (327.4 square miles), elevation: 1,048 metres / 3,438 feet above sea level Calgary lies at the intersection
Photo: Robb Thompson. City of Vernon December 2016 Update
 Photo: Robb Thompson City of Vernon December 2016 Update Name 2012 2013 2014 2015 2014-15 North Okanagan 81,956 82,038 83,011 84,587 1.9% Vernon 38,573 38,672 39,167 40,497 3.4% Unincorporated Areas 18,438
Economic Impact of Tourism in Hillsborough County September 2016
 Economic Impact of Tourism in Hillsborough County - 2015 September 2016 Key findings for 2015 Almost 22 million people visited Hillsborough County in 2015. Visits to Hillsborough County increased 4.5%
Queensland Economic Update
 Queensland Economic Update Chamber of Commerce & Industry March 2018 cciq.com.au Queensland Economic Update: Summary National Accounts GDP expanded 2.3% during calendar year 2017. QLD state final demand
The Economic Base of Colfax County, NM. PREPARED BY: The Office of Policy Analysis at Arrowhead Center, New Mexico State University.
 The Economic Base of Colfax County, NM PREPARED BY: The Office of Policy Analysis at Arrowhead Center, New Mexico State University DATE: July 2016 The Economic Base of Colfax County, New Mexico Introduction
The Economic Impact of Tourism in Jacksonville, FL. June 2016
 The Economic Impact of Tourism in Jacksonville, FL June 2016 Highlights Visitor spending surpassed $2.0 billion in 2015, growing 4.4%. As this money flowed through Duval County, the $2.0 billion in visitor
2nd Quarter. AEDC is pleased to present the Anchorage Quarterly Economic Indicators Report for the second quarter of 2010.
 2010 AEDC is pleased to present the Anchorage Quarterly Economic Indicators Report for the second quarter of 2010. This report summarizes recently updated data from the Anchorage Economic Indicators Database,
County of Grande Prairie Economic Development COUNTY OF GRANDE PRAIRIE AND CLAIRMONT
 County of Grande Prairie Economic Development COUNTY OF GRANDE PRAIRIE AND CLAIRMONT County of Grande Prairie The Opportunity Clairmont, one of nine districts within the County of Grande Prairie, has seen
The Benefits of Tourism
 The Benefits of Tourism The Benefits of Tourism Diversification of tourism industry infrastructure Contributions to the balance of payments Increase in tax revenues Improved job opportunities Improved
LITERACY IN NOVA SCOTIA Implications of Findings from IALSS 2003
 LITERACY IN NOVA SCOTIA Implications of Findings from IALSS 03 Presented by Satya Brink, Ph.D. Director, National Learning Policy Research Learning Policy Directorate, HRSDC January 06 1 Key Questions
Subject Property Schuster St Las Vegas, NV SW Las Vegas Ind. LOCATION Distance to Seaport:
 Subject Property 6615 Schuster St Las Vegas, NV 89118 - SW Las Vegas Ind LOCATION Distance to Airport: 6.2 mi Distance to Seaport: 232.5 mi Distance to Rail Terminal: 6.7 mi Population 500 Mile Radius:
The Value of Tourism in British Columbia. Measuring the value of tourism in BC 1999 to Trends from 1998 to 2008
 The Value of Tourism in British Columbia Measuring the value of tourism in BC 1999 to 2009 Trends from 1998 to 2008 Tourism British Columbia November 2009 MAP OF BRITISH COLUMBIA TOURISM REGIONS Measuring
Annual Gross Domestic Product (Production Measure)
") June 2017 Executive Summary Page 2 Latest Quarter Economic Trends page 3 Economic Outlook page 4 Labour Force page 5 Retail Activity page 6 Building Activity page 7 Tourism Trends page 8 Local Authorities
June 2017 Executive Summary Page 2 Latest Quarter Economic Trends page 3 Economic Outlook page 4 Labour Force page 5 Retail Activity page 6 Building Activity page 7 Tourism Trends page 8 Local Authorities
The Benefits of Tourism
 The Benefits of Tourism The Benefits of Tourism Diversification of tourism industry infrastructure Contributions to the balance of payments Increase in tax revenues Improved job opportunities Improved
Pre-Leasing New Retail Development
 Pre-Leasing New Retail Development Commons on Regal - Retail Shopping Center 5415 South Regal Road Spokane, WA 99223 Lease Overview Available SF: Larger Users Lease Rate: Lot Size: Building Pads: 1,500
National Market Report
 National Market Report November 2015 In November 2015, the national hotel sample experienced a 2.8 point decrease in occupancy from November 2014 to 57.8%. The November 2015 average daily room rate for
2011 CATALYST CENSUS: FINANCIAL POST 500 WOMEN BOARD DIRECTORS
 2011 CATALYST CENSUS: FINANCIAL POST 500 WOMEN BOARD DIRECTORS 1 2 247 Kia Canada, Inc. 2 3 66.7% Wholesale Trade 356 Vancouver City Savings Credit Union 6 9 66.7% 238 Xerox Canada Inc. 2 3 66.7% Manufacturing
The Benefits of Tourism
 The Benefits of Tourism The Benefits of Tourism Diversification of tourism industry infrastructure Contributions to the balance of payments Increase in tax revenues Improved job opportunities Improved
ROSS AVENUE WINNIPEG, MANITOBA RETAIL / OFFICE FOR LEASE
 310 ROSS AVENUE WINNIPEG, MANITOBA RETAIL / OFFICE FOR LEASE Partnership. Performance. Wes Schollenberg Managing Director, Broker 204.947.3423 ext. 101 wes.schollenberg@avisonyoung.com Steven Paulus Senior
BUT, WHY ALTOONA? WHY NOW? HERE S WHY: NOW. NOW. NOW. ALTOONA ALTOONA IS WHERE IOWA PLAYS. IS THE PLACE TO BUILD YOUR BUSINESS.
 We re extending a hand, welcoming you to a new day in Altoona. Our Mayor, City Council and community leaders are inviting you to join a movement a movement where businesses are breaking ground and families
FOR SALE. Opportunity to own a brand new, high quality industrial unit in the core of Metro Vancouver. DELTA LINK BUSINESS CENTRE PHASE II
 FOR SALE DELTA LINK BUSINESS CENTRE PHASE II 7727 BEEDIE WAY, DELTA, BC DeltaLinkBusinessCentre.com EACH UNIT COMES EQUIPPED WITH MEZZANINE Opportunity to own a brand new, high quality industrial unit
The Economic Impact of Tourism in North Carolina. Tourism Satellite Account Calendar Year 2015
 The Economic Impact of Tourism in North Carolina Tourism Satellite Account Calendar Year 2015 Key results 2 Total tourism demand tallied $28.3 billion in 2015, expanding 3.6%. This marks another new high
The Outlook for the Residential Construction Industry Hunter and the Central Coast
 The Outlook for the Residential Construction Industry Hunter and the Central Coast Graham Wolfe HIA Chief Executive Industry Policy and Media HIA Industry Outlook Breakfast Newcastle February 2013 Backdrop:
DEVELOPMENT OPPORTUNITY 630 Central Park Yonkers, NY 10704
 DEVELOPMENT OPPORTUNITY 630 Central Park Yonkers, NY 10704 1 Offering Memorandum 630 Central Park, Yonkers, NY 10704 +/-200,000 Square Feet Industrial Building Redevelopment Opportunity 630 Central Park
West Perth COMMUNITY PROFILE
 West Perth COMMUNITY PROFILE WELCOME TO WEST PERTH TABLE OF CONTENTS LOCATION...3 Transportation OUR COMMUNITY... 4-5 Map OUR PEOPLE... 6-7 Population & Demographics Education Household Income Housing
DEVELOPMENT OPPORTUNITY 630 Central Park Yonkers, NY 10704
 DEVELOPMENT OPPORTUNITY 630 Central Park Yonkers, NY 10704 Cross County Shopping Mall 630 Central Park Empire City Casino and Race Track Yonkers 630 Central Park, Yonkers, NY 10704 2 Yonkers is located
Economic & Real Estate Outlook
 Economic & Real Estate Outlook By Lawrence Yun, Ph.D. Chief Economist, National Association of REALTORS Presentations at NAR Legislative Meetings Washington, DC May 17, 2018 Very Long Economic Expansion
County of Dufferin Economic Development Strategy and Action Plan
 County of Dufferin Economic Development Strategy and Action Plan Strategic Plan Background Report Information for Those Involved in Stakeholder Consultations About the Dufferin County Economic Development
MOBILE FINANCIAL SERVICES IN CANADA
 MOBILE FINANCIAL SERVICES IN CANADA FINTECH ACTIVITY IN CANADA ALASKA (USA) YUKON BRITISH COLUMBIA NORTHWEST TERRITORIES NUNAVUT ALBERTA MANITOBA SASKATCHEWAN QUEBEC NEW BRUNSWICK NEWFOUNDLAND & LABRADOR
THE SENSIBLE ROCKY MOUNTAIN INVESTMENT CHOICE.
 THE SENSIBLE ROCKY MOUNTAIN INVESTMENT CHOICE 1 2 THE SENSIBLE ROCKY MOUNTAIN INVESTMENT CHOICE BIG MOUNTAINS. BIG BUSINESS. BIG OPPORTUNITY. Sparwood, BC is yours and mine. We may be known as that town
Economic Impact Analysis. Tourism on Tasmania s King Island
 Economic Impact Analysis Tourism on Tasmania s King Island i Economic Impact Analysis Tourism on Tasmania s King Island This project has been conducted by REMPLAN Project Team Matthew Nichol Principal
The Economic Impact of Tourism on Guam. Tourism Satellite Account Calendar Year 2016
 The Economic Impact of Tourism on Guam Tourism Satellite Account Calendar Year 2016 Highlights! 2016 was a banner year for tourism on Guam, with visitation to Guam surpassing 1.5 million and visitor spending
Calgary Downtown/Beltline Markets
 October 24, 2007 Calgary Downtown/Beltline Markets Prepared for: Prepared by: Calgary Real Estate Forum Kevin McCann, Associate Broker Barclay Street Real Estate Ltd. Calgary s Urban Retail Renaissance