Freeway Volume-Crash Summary
|
|
|
- Lorraine Crawford
- 5 years ago
- Views:
Transcription


1 Freeway Volume-Crash Summary Twin Cities Metropolitan Area Continuation Report 22 Data Minnesota Department of Transportation Office of Traffic, Security and Operations Freeway Operations Section Regional Transportation Management Center March 24 i
2 TABLE OF CONTENTS FREEWAY CRASH SUMMARY....1 Purpose and Need Study Methodology... 3 Segment Definition... 4 Study Corridors... 5 Summary of Results... 6 Summary of Crash Data Twin Cities Metro Area Freeways Metro Freeway Map Peak Period Crashes... 9 SELECTED INTERSTATES AND STATE ROADS How to Read This Section Interstate 35E...12 Interstate 35W...14 Interstate Interstate Interstate Interstate US Minnesota Minnesota Minnesota Minnesota Other Roads: MN 28, MN 5, MN 61, US 1, US 212, and US APPENDIX A: 22 AM Congestion Map APPENDIX B: 22 PM Congestion Map ii
3 Freeway Volume-Crash Summary Twin Cities Metropolitan Area Purpose and Need The purpose of this report is to identify segments on the metro area freeway system that experience high numbers of crashes. This information is then used for: identification of locations that experience higher crash rates due to recurring congestion. project planning resource allocation (Traffic Management Systems, FIRST routes, incident management, etc.) This report is typically published on an annual basis. Data within this report represents 22 peak periods and 24-hour volume levels, crashes, and crash rates for each freeway segment. Introduction This report is a summary of the metro area freeway system s crash data and volume data in 22. The report has been developed by the Traffic Management Center since 1975 and was primarily used by TMC personnel to help establish priorities for future traffic management systems. This year the report has been reformatted to help broaden the audience of the report. Graphical representations of the data where added to make the report more user friendly and to show the connection between congestion and freeway crashes. Congestion and Freeway Crashes Freeway congestion and freeway crashes are related. Freeway congestion can be defined as either recurring congestion or incident related congestion. Recurring congestion is congestion that occurs at the same location on a daily basis due to some type of roadway characteristic that affects traffic flow such as a major interchange, lane drop, or weaving traffic. Incident related congestion can be caused by a crash, a stalled vehicle, debris on the roadway, adverse weather, or a special event. According to the FHWA, incident congestion accounts for up to 5% of the total congestion. 1


4 Crashes by Peak Period AM Peak 16% Off Peak 53% PM Peak 31% Increased congestion increases the potential for crashes to occur on the freeway. In 22, there were 9,439 crashes on metro area freeways. As the chart entitled Crashes by Peak Period shows, 47% of the crashes occurred during the peak travel hours. The peak hours consist of 6: am to 8:59 am during the AM Peak and 3: pm to 6:59 pm during the PM Peak, Monday through Friday. Weekends and non-peak weekday hours make up the Off Peak crashes. While peak hours consist of only seven hours a day or 2% of hours in a week, Monday through Friday, they represent almost half the number of freeway crashes. Freeway crashes are attributed to shock wave activity, merging traffic, and weaving traffic on congested roadways. These types of crashes are typically side-swipe or rear-end type collisions. The potential for more severe crashes typically occurs where free flow traffic and congested traffic converge. Examples include when free flow traffic meets slower moving congested traffic around a horizontal or vertical curve where the congested traffic may be unexpected. Another situation is where one or two lanes of traffic are congested due to a high volume entrance or exit ramp and adjacent lanes are free flowing traffic. Incident-related congestion is unexpected since it can occur during peak or non-peak hours and in areas where motorists may not expect slow moving traffic. A study done by the Traffic Management Center in 1982 found that 13% of traffic crashes were secondary crashes from incident-related congestion. An example of how incident congestion can cause secondary crashes occurred on February 1, 22. One crash on I-35W during the mid-day hours caused congestion on I-35W and Highway 62 over a two hour period, which led to six additional crashes. Most of these crashes occurred at the boundary where free flow traffic meets congested traffic. Incident from Feb 1 st, 22. One non-rush hour crash led to 6 others (including one injury crash) over a 2-hour period. 2
5 Study Methodology The freeways studied in this report are shown in the map on page 5. Each interstate and trunk highway is divided into sections with breaks based on changes in traffic volumes and other freeway characteristics. The study uses crash data from the Department of Public Safety's crash record database. Mn/DOT s Office of Transportation Data and Analysis processes the data with a crash analysis routine applied to the Transportation Information System (TIS). Crash data include only vehicular crashes on the mainline; interchange-related data is not included. Traffic volume data was obtained from the RTMC and the Office of Transportation Data Analysis. Each freeway link between entrance and/or exit ramps was assigned an annual average daily traffic volume (AADT). For even years (1998, 2, and 22), the AADT is based on actual traffic counts. For odd years (1999 and 21) AADT is based on actual counts recorded from the previous even year and projected to the next year s levels. Averages of link volumes, weighted for link distances, on each part of a freeway section were used to determine the average volume for each freeway section. Individuals using data from this report should be aware that weather, construction, and maintenance activities were not analyzed with respect to crash rates shown. Crash rates are expressed in units of crashes per million vehicle miles traveled (Crash/MVM) and calculated as follows: Annual Rate = Total Annual Crashes x 1,, Section Length (Miles) x AADT x 365 Peak Period Rate = Total Annual Peak Period Crashes x 1,, Section Length (Miles) x Average Period Volume x 26 Peak periods for this study are from 6:-8:59 A.M. and 3:-6:59 P.M. weekdays. 3
6 Segment Definition For purposes of this report, freeway segments are generally defined from the lowest logpoint listing number to the highest logpoint listing number of a particular section of roadway. The limits of the first study segment for each corridor includes two interchanges. The next segment of that roadway starts just past the previous interchange and ends just past the next interchange. Segment definitions continue in this manner to the end of the reported roadway. NOTE: Only crashes occurring on the mainline are included no interchange ramps or overpass crash data is included in this study. Example: SECTION OF I-94 CORRIDOR Segment 1: MN 11 to I-494 This is the first segment reported on this roadway in this study. The logpoints used includes the crashes that occurred just prior to the Hwy 11 interchange to just past the I-494 interchange. Segment 2: I-494 to CR 81 This segment includes crashes that occurred from just past the I-494 interchange to just past the CR 81 interchange. Segment 3: CR 81 to I-694 This segment contains crashes that occurred from just past the CR 81 interchange to just past the I-694 interchange. Hwy 11 I-494 CR 81 I-694 Segment 1 Segment 2 Segment 3 4


7 STUDY CORRIDORS MINNEAPOLIS ST. PAUL METRO AREA 5
8 Summary of Results The table below summarizes yearly crash totals and crash rates for 1996 through 22. There were 9,439 crashes in 22, resulting in an urban freeway crash rate of.96 Crashes/MVM. Crashes rose slightly from the year 21 when there were 9,395 crashes, or.92 crashes per million vehicle miles in a 24 hour, 7 days per week period. During the AM peak periods, there were 1,556 crashes in 22, resulting in a crash rate of 1.64 Crashes/MVM. During PM peak periods, there were 2,886 crashes in 22, or 2.27 Crashes/MVM. As seen in the line graph, crash rates during the peak periods have continued to increase since 1996, due mainly to increased levels of congestion. 24 Hr AM (6:-8:59) PM (3:-6:59) Year # of Crashes Crash Rate # of Crashes Crash Rate # of Crashes Crash Rate , , , , , , , , , , , , , , , , , , , , , Crash Rates Trends Crash Rate Year 24 Hr AM (6:-8:59) PM (3:-6:59) 6
9 Summary of Crash Data - Twin Cities Metro Area Freeways The following table displays the total crashes and crash rates for Twin Cities Metro Area freeways, both interstates and non-interstates, for calendar year 22. This summary table includes the 24- hour, AM peak period and PM peak for Twin Cities freeways. LENGTH 24 HR AM PM INTERSTATES (MILES) CRASHES RATE CRASHES RATE CRASHES RATE I-35E I-35W , I , I , I I INTERSTATE TOTALS , , , LENGTH 24 HR AM PM NON-INTERSTATES (MILES) CRASHES RATE CRASHES RATE CRASHES RATE US US US US US MN MN MN MN MN MN MN NON-INTERSTATE TOTALS , GRAND TOTALS 3.8 9, , , Ten Highest Crash Rate Segments The tables on the following page provide a snapshot of the ten highest crash segments for 22. Once again, the section of I-94 from W. I-35W to E. I-35W had the highest overall crash rate on the urban freeway network. This section had a 24-hour rate of 4.81 Crashes/MVM, a PM rate of Crashes/MVM, and an AM rate of 5.73 Crashes 7
10 AM Peak Period (6:-8:59 AM) Crash Rank Rank Freeway Segment Rate 1 I-94 I-394 to W. I-35W I-94 W. I-35W to E. I-35W I-35W S. I-35E to MN River I-35W E. I-94 to University Ave MN 62 E. I-35W to MN I-35E W. I-94 to MN I-94 W. I-494 to CR I-35W I-694 to US I-94 Mounds to E. US MN 62 I-494 to Gleason Rd PM Peak Period (3:-6:59 PM) Crash Rank Rank Freeway Segment Rate 1 I-94 W. I-35W to E. I-35W I-94 I-394 to W. I-35W I-94 E. I-35W to MN I-394 MN 1 to I I-35W W. I-94 to E. I I-35W E. MN 62 to W. I I-35W E. I-94 to University Ave I-94 MN 28 to MN I-94 W. I-494 to CR I-494 I-35W to MN Ten Highest Crash Segments Compared with 22 Twin Cities Average of.96 Crashes Per MVM 24 Hour/ 7 Days Per Week 6 5 I Crash Rate I MN I-35W 2.6 I I I-35W MN 62 I-35W US W. I-35W to E. I-35W I-394 to W. I-35W 36th Ave N. to Brklyn Blvd E. I-94 to University Ave W. I-494 to CR-81 E. I-35W to MN 28 E. MN 62 to W. I-94 MN 1 to W. I-35W W. I-94 to E. I-94 I-494 to MN 62 8
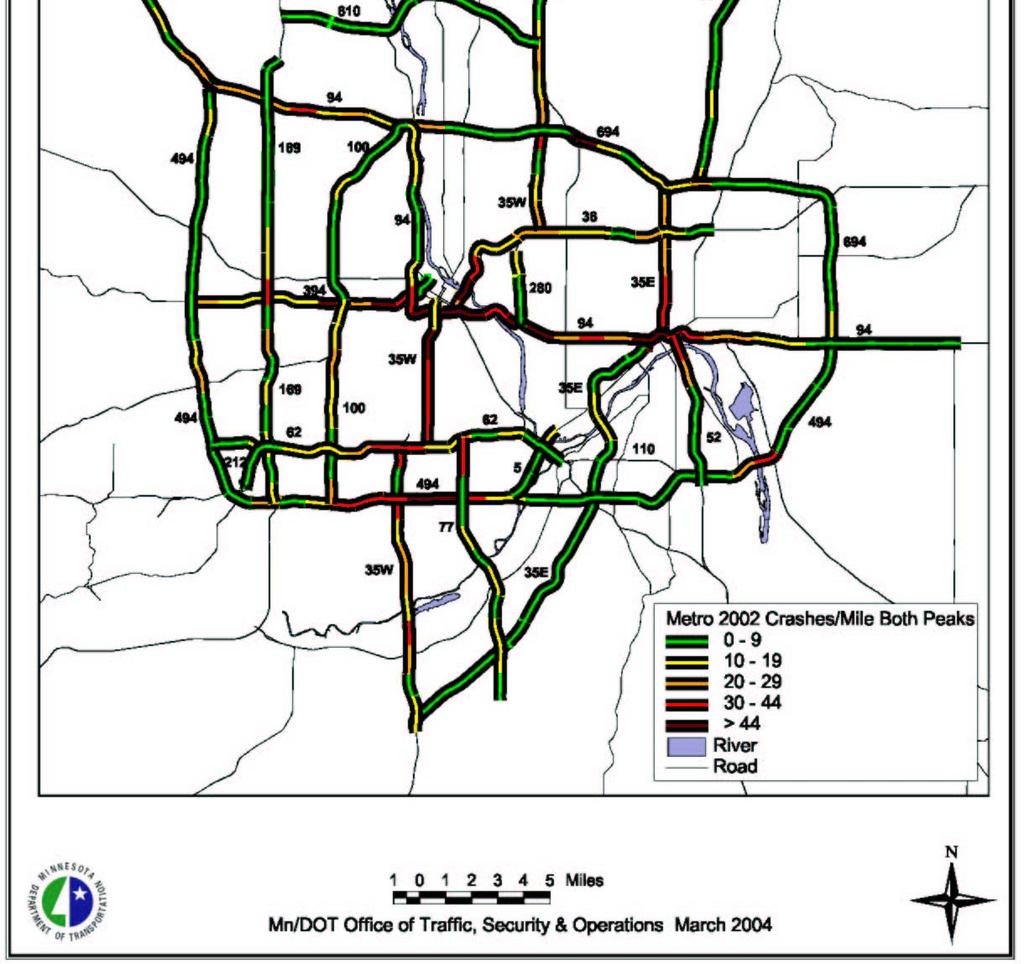
11 Crash Map The following map graphical shows the frequency of crashes on metro area freeways for both the AM Peak Period and the PM Peak Period combined. Crashes were plotted as the number of crashes per reference point. Since reference points on metro area freeways are approximately one mile apart, this map represents the frequency of crash as the number of crashes per mile. Approximately half of the segments on the map were in the category of to 9 crashes per mile. The remaining 5% had greater than 1 crashes per mile with 5% of the segments having greater that 44 crashes per mile. The maximum number of crashes per mile for both peaks was 137, which was on I-94 in the I-35W commons. Comparing the following crash map with the congestion maps from the 22 congestion report, the correlation between congestion and crashes can be seen. Areas experiencing heavy congestion also show a high frequency of crashes. The congestion maps are included in the appendix of this report for reference. 9
12 1

13 SELECTED INTERSTATE AND STATE ROADS How To Read This Section The following pages provide more detailed information on selected metro area freeways. The first page for each metro area freeway has a bar graph that shows the trends in crash rates from 1996 to 22. Each grouping of bars in the graph represents a specific segment of that freeway. Individual bars within the grouping then represent the crash rate for a given year. The table below the bar chart represents 22 volume and crash data for that freeway. The second page for each freeway contains two bar charts that show the number of crashes per reference point during the AM and PM peak periods. Reference points on metro area freeways are about one mile in length. The purpose of these charts is to show locations where there are a high number of crashes. These locations are typically at major interchanges, bottlenecks, and area experiencing high levels of congestion. Bar chart showing trends in crash rates for each segment. Table summarizing 22 volume and crash data for each freeway segment. Number of crashes per year by reference 11
14 Heaviest levels of congestion on I-35E are on the segment from I-94 to MN 36 during both the AM and PM peak periods. The 24-hour crash rate for this section is the highest segment for I-35E with a rate of 1.35 Crashes/MVM. Crash rates during the AM and PM peak periods are 3.28 Crashes/MVM and 3.22 Crashes/MVM. Referring to the I-35E Crashes per Reference Point chart for the PM peak period, a high number of crashes occur on I-35E from I-94 to Maryland Ave due to increased levels of congestion and merging traffic. Shockwave activity traveling back into the commons of I-94 and weaving traffic contributes to crashes in this area. 6 I-35E 24 Hour Crash Rate Trends 5 Annual Crash Rate Per MVM S. I-35W to MN 77 MN 77 to I- 494 I-494 to MN 5 MN 5 to W. W. I-94 to MN 36 to W. I-94 MN 36 I-694 Freeway Segments W. I-694 to E. I-694 E. I-694 to CR J CR J to N. I- 35W Interstate 35E Length Number of Crashes Volume Crash Rate Segments of I-35E (Miles) 24 Hr AM PM 24 Hr AM PM 24 Hr AM PM S. I-35W to MN ,7 6,6 8, MN 77 to I ,4 9,6 12, I-494 to MN ,1 1,8 14, MN 5 to W. I ,6 9,7 12, W. I-94 to MN ,1 17,8 23, MN 36 to W. I ,2 14,3 19, W. I-694 to E. I , 15, 2, E. I-694 to CR J ,7 8,8 11, CR J to N. I-35W ,3 5,3 7, TOTAL: S. I-35W to N. I-35W ,2 9,7 12,
15 6 I-35E Crashes Per Reference Point AM Peak January 1, 22 through December 31, Maryland Ave. CR 42 Portland Ave CR 11 RP 91 TH 77/Cedar Ave Cliff Rd Diffley Rd Deerwood Dr RP 96 Pilot Knob Rd Lone Oak Rd I-494 Wagon Wheel Tr TH 11 TH 13 TH 5/ West 7th St Randolph Ave St Clair Ave Grand Ave I-94/TH 52 Pennsylvania Maryland Ave Larpenteur Ave TH 36 Little Canada Rd I-694 I-694 East CR E RP 116 CR 96 RP 118 CR H2 RP 12 RP 121 RP 122 County J RP 124 RP 125 RP 126 I I-35E Crashes Per Reference Point PM Peak January 1, 22 through December 31, I-94/ TH CR 42 Portland Ave CR 11 RP 91 TH 77/Cedar Ave Cliff Rd Diffley Rd Deerwood Dr RP 96 Pilot Knob Rd Lone Oak Rd I-494 Wagon Wheel Tr TH 11 TH 13 TH 5/ West 7th St Randolph Ave St Clair Ave Grand Ave I-94/TH 52 Pennsylvania Maryland Ave Larpenteur Ave TH 36 Little Canada Rd I-694 I-694 East CR E RP 116 CR 96 RP 118 CR H2 RP 12 RP 121 RP 122 County J RP 124 RP 125 RP 126 I-35 13
16 In 22, the 24-hour crash rates increased substantially along the I-35W segments from the east junction of MN 62 to the east junction of I-94 in Hennepin County. The number of crashes accounted for about one-third of the total number of crashes along I-35W for the 24-hour period. Congestion on this segment is heavy in both directions during both the AM and PM peaks periods. The highest number of crashes per reference point for the AM peak period occurs at Cliff Rd. This area is heavily congested in the morning from the Minnesota River Bridge back to MN 13. The PM peak period sees the highest number of crashes per reference point between MN 65 and Lake St. Crashes occur here in the southbound lanes of I-35W due to shock waves, merging traffic from downtown, and weaving traffic as motorists switch lanes for the MN 62 junction downstream. Annual Crash Rate Per MVM I-35W: 24 Hour Crash Rate Trends Interstate 35W S. I-35E to MN River I-494 to W. MN 62 E. MN 62 to W. I-94 E. I-94 to University Ave MN 28 to MN 36 I-694 to US 1 N. Jct. Lake Dr to N. I-35E Length Number of Crashes Volume Crash Rate Segments of I-35W (Miles) 24 Hr AM PM 24 Hr AM PM 24 Hr AM PM S. I-35E to MN River ,3 9,9 13, MN River to I ,8 13,7 18, I-494 to W. MN ,9 12,9 17, W. MN 62 to E. MN ,7 17,5 23, E. MN 62 to W. I ,7 21,2 28, W. I-94 to E. I ,7 12,8 17, E. I-94 to University Ave ,8 15,5 2, University Ave to MN ,8 14,1 18, MN 28 to MN ,4 17,2 22, MN 36 to I ,9 13,6 18, I-694 to US ,5 13,9 18, US 1 to N. Jct. Lake Dr ,6 5,7 7, N. Jct. Lake Dr to N. I-35E ,5 4,4 5, TOTAL: S. I-35E to N. I-35E ,1 12,1 16,
17 6 I-35W Crashes Per Reference Point AM Peak January 1, 22 through December 31, Cliff Road Diamond Lake Road Mississippi River 1 McAndrews Dr Cliff Rd 16th St 86th St 76th St Nicollet Ave 46th St Lake St TH 55 / Hiawatha Ave Hennepin Ave Industrial Blvd CR C TH 96 CR I Lexington Ave County 14 RP 39 I-35 6 I-35W Crashes Per Reference Point PM Peak January 1, 22 through December 31, Lake Street Franklin Avenue 1 McAndrews Dr Cliff Rd 16th St 86th St 76th St Nicollet Ave 46th St Lake St TH 55 / Hiawatha Ave Hennepin Ave Industrial Blvd CR C TH 96 CR I Lexington Ave County 14 RP 39 I-35 15
18 The I-394 to West I-35W segment of I-94 had the most crashes, 355 crashes in a 24 hour period. While there were 86 more crashes at this location than the 24 hour period in 21, the AM peak increased more than 7% from 29 to 5 crashes. In 22, the greatest number of crashes during any peak period at any reference point along Twin Cities metro freeways occurred at MN 65/I-35W. There were 17 crashes during the PM peak period at this location. Crashes on westbound I-94 at MN 65/I-35W during the PM peak period are attributed to heavy congestion, merging traffic from I-35W and Hiawatha Ave., and weaving traffic as motorists switch lanes for the I-394 junction downstream. The segment of I-94 that showed the greatest increase in the number of crashes was MN 11 to West I-494 where total crashes increased from 192 in 21 to 292 in 22 over a 24 hour period, a 5+% surge. Annual Crash Rate per MVM I-94: 24 Hour Crash Rate Trends Interstate 94 MN 11 to W. I- 494 W. I-494 to CR-81 CR-81 to W. I-694 W. I-694 to I-394 I-394 to W. I-35W W. I-35W to E. I- 35W E. I-35W to MN 28 MN 28 to MN 51 Freeway Segments MN 51 to Marion Marion to Mounds Mounds to E. US 61 E. US 61 to E. I- 494 E. I-494 to Manning Ave Length Number of Crashes Volume Crash Rate Segments of I-94 (Miles) 24 Hr AM PM 24 Hr AM PM 24 Hr AM PM MN 11 to W. I ,7 1,5 14, W. I-494 to CR ,2 11,8 15, CR-81 to W. I , 12,6 16, W. I-694 to I ,3 15,4 2, I-394 to W. I-35W ,7 22,5 3, W. I-35W to E. I-35W , 17,5 23, E. I-35W to MN ,4 19,4 25, MN 28 to MN ,9 2,4 27, MN 51 to Marion ,2 2,4 27, Marion to Mounds ,5 24,3 32, Mounds to E. US ,7 15,8 21, E. US 61 to E. I ,7 11,2 14, E. I-494 to Manning Ave ,5 11,1 14, TOTAL: MN 11 to Manning , ,3 14,5 19,
19 12 I-94 Crashes Per Reference Point AM Peak January 1, 22 through December 31, I-394 MN 65/ I-35W TH 11 Weaver Lake Rd Hemlock Ln Boone Ave Zane Ave Shingle Ck / I rd Ave N Dowling Ave N Washington Ave N I-394 TH 55 / Hiawatha Ave Franklin Ave Fairview Victoria St I-35E Mounds Blvd White Bear Ave TH 12 / Century Ave Radio Dr Woodbury Dr /CR I-94 Crashes Per Reference Point PM Peak January 1, 22 through December 31, TH 65/ I-35W I-394 MN 55/ Hiawatha Avenue 2 TH 11 Weaver Lake Rd Hemlock Ln Boone Ave Zane Ave Shingle Ck / I rd Ave N Dowling Ave N Washington Ave N I-394 TH 55 / Hiawatha Ave Franklin Ave Fairview Victoria St I-35E Mounds Blvd White Bear Ave TH 12 / Century Ave Radio Dr Woodbury Dr /CR 19 17
20 The number of crashes declined overall on I-494 from 1,36 in 21 to 1,184 in 22, based on the 24-hour, 7 days per week. The highest number of crashes per reference point occurred on I-494 from Hwy 77 to Hwy 212. The segment of I-494 from MN 77 to I-35W had the highest 24-crash rate on I-494 with a rate of 1.53 Crashes/MVM. Another peak in the number of crashes per reference point is in the area of the Wakota Bridge. I-494: 24 Hour Crash Rate Trends 5 Annual Crash Rate per MVM E. I-94 to US 61 US 61 to MN 52 MN 52 to I-35E I-35E to E. MN 5 E. MN 5 MN 77 to to MN 77 I-35W I-35W to MN 1 MN 1 to W. MN 5 W. MN 5 to MN 7 MN 7 to I- 394 I-394 to W. MN 55 W. MN 55 to W. I-94 Interstate 494 Freeway Segments Length Number of Crashes Volume Crash Rate Segments of I-494 (Miles) 24 Hr AM PM 24 Hr AM PM 24 Hr AM PM E. I-94 to US ,1 7,6 1, US 61 to MN , 11,1 14, MN 52 to I-35E ,5 1,4 13, I-35E to MN Rvr ,8 11,5 15, MN Rvr to E. MN ,2 14, 18, E. MN 5 to MN ,6 19,1 25, MN 77 to I-35W ,7 18,7 24, I-35W to MN , 18,5 24, MN 1 to W. MN ,8 11,1 14, W. MN 5 to MN ,2 9,4 12, MN 7 to I ,5 11,4 15, I-394 to W. MN ,3 11,9 15, W. MN 55 to W. I ,4 9,7 12, TOTAL: E. I-94 to W. I , ,8 11,7 15,
21 6 I-494 Crashes Per Reference Point AM Peak January 1, 22 through December 31, Concurrent with I Nicollet Ave Maxwell Ave 1 Minnesota River TH 5 East / 34th Ave TH 77 CR 35 Nicollet Ave I-35W Xerxes Ave TH 1 North E. Bush Lake Rd W. Bush Lake Rd TH 169 TH 212 Valley View Rd TH 62 Baker Rd TH 7 Minnetonka Blvd Stone Rd I-394 Carlson Pkwy CR 6 TH 55 Rockford Rd 49th Ave TH 47 Bass Lk Rd Fish Lake Rd I-94 Valley Creek Road Lake Rd Century Ave TH 61 North Maxwell Ave Concord St 5th Ave/ 7th Ave Babcock Tr Robert St / TH 11 Delaware Rd Dodd Rd / TH 149 Pilot Knob Rd TH 13 6 I-494 Crashes Per Reference Point PM Peak January 1, 22 through December 31, CR 35 TH 7 Concurrent with I Concord St 1 Minnesota River TH 5 East / 34th Ave TH 77 CR 35 Nicollet Ave I-35W Xerxes Ave TH 1 North E. Bush Lake Rd W. Bush Lake Rd TH 169 TH 212 Valley View Rd TH 62 Baker Rd TH 7 Minnetonka Blvd Stone Rd I-394 Carlson Pkwy CR 6 TH 55 Rockford Rd 49th Ave TH 47 Bass Lk Rd Fish Lake Rd I-94 Valley Creek Road Lake Rd Century Ave TH 61 North Maxwell Ave Concord St 5th Ave/ 7th Ave Babcock Tr Robert St / TH 11 Delaware Rd Dodd Rd / TH 149 Pilot Knob Rd TH 13 19
22 Along I-694, the number of crashes decreased by 12% from 61 crashes in 21 to 538 in 22. This is based on the 24 hour period. The hot spot for crashes occurred at MN 51/ Snelling Avenue where there were 43 crashes during the PM peak and 8 crashes over a 24 hour period. 5 I-694: 24 Hour Crash Rate Trends Annual Crash Rate per MVM MN 1 to MN 65 MN 65 to I-35W I-35W to W. I-35E E. I-35E to MN 36 MN 36 to E. I-94 Freeway Segments Interstate 694 Length Number of Crashes Volume Crash Rate Segments of I-694 (Miles) 24 Hr AM PM 24 Hr AM PM 24 Hr AM PM MN 1 to MN ,4 15,6 2, MN 65 to I-35W ,5 13,4 17, I-35W to W. I-35E ,8 11,9 15, E. I-35E to MN ,6 9,3 12, MN 36 to E. I ,8 8,2 11, TOTAL: MN 1 to E. I ,8 11, 14,
23 6 I-694 Crashes Per Reference Point AM Peak January 1, 22 through December 31, I-35E North I-94 / TH 252 Main St Central Ave Matterhorn Dr Silver Lake Rd I-35W TH 1 West TH 51 Victoria St CR 49 I-35E South I-35E North TH 61 White Bear Ave McKnight Rd TH 12 TH 36 5th St I-694 Crashes Per Reference Point PM Peak January 1, 22 through December 31, 22 TH 5 Stillwater Rd 15th St CR TH I-94 / TH 252 Main St Central Ave Matterhorn Dr Silver Lake Rd I-35W TH 1 West TH 51 Victoria St CR 49 I-35E South I-35E North TH 61 McKnight Rd TH 12 TH 36 5th St White Bear Ave TH 5 Stillwater Rd 15th St CR 1 21
24 The segment of I-394 between MN 1 and I-94, experiences the highest levels of congestion and the highest 24-hour crash rate with a rate of Penn Avenue accounted for the most number of crashes at any reference point with 95 crashes over a 24-hour period. This was nearly 25% of the total crashes that took place on I-394. I-394: 24 Hour Crash Rate Trends 5. Annual Crash Rate per MVM CR 15 to I-494 (US 12) I-494 to US 169 US 169 to MN 1 MN 1 to I-94 Freeway Segments Interstate Length Number of Crashes Volume Crash Rate Segments of US 12 (Miles) 24 Hr AM PM 24 Hr AM PM 24 Hr AM PM CR 15 to I ,6 7,1 9, Length Number of Crashes Volume Crash Rate Segments of I-394 (Miles) 24 Hr AM PM 24 Hr AM PM 24 Hr AM PM I-494 to US , 13,5 18, US 169 to MN ,7 16,6 22, MN 1 to I , 17,2 23,
25 6 I-394 Crashes Per Reference Point AM Peak January 1, 22 through December 31, I-494 Ridgedale / CR 73 TH 169 General Mills Blvd Louisiana Ave TH 1 France Ave Penn Ave I-94 6 I-394 Crashes Per Reference Point PM Peak January 1, 22 through December 31, 22 5 Penn Ave MN 1 1 I-494 Ridgedale / CR 73 TH 169 General Mills Blvd Louisiana Ave TH 1 France Ave Penn Ave I-94 23
26 Congestion levels on US 169 during the PM peak period are heaviest northbound from I-394 to Medicine Lake Road. Medicine Lake Road, which is along the stretch from I-394 to Rockford Road, showed the greatest number of crashes per reference point in a 24 hour period with 71 crashes. 5 US 169: 24 Hour Crash Rate Trends Annual Crash Rate per MVM US 169 I-494 to MN 62 MN 62 to MN 7 MN 7 to I-394 I-394 to Rockford Rd Freeway Segments Rockford Rd to I- 94 I-94 to CR Length Number of Crashes Volume Crash Rate Segments of US 169 (Miles) 24 Hr AM PM 24 Hr AM PM 24 Hr AM PM I-494 to MN ,2 7,5 1, MN 62 to MN ,2 1,6 14, MN 7 to I ,8 12,3 16, I-394 to Rockford Rd ,6 11,5 15, Rockford Rd to I ,5 1,1 13, I-94 to CR ,4 7,9 1, TOTAL: I-494 to CR ,6 1,3 13,
27 6 US 169 Crashes Per Reference Point AM Peak January 1, 22 through December 31, Medicine Lake Rd TH 62 7th St Excelsior Blvd TH 7 / W 36th St Minnetonka Blvd 16th St TH 55 Plymouth Ave Medicine Lk Rd 36th Ave 49th Ave Bass Lk Rd 63rd Ave N I-94 / I-694 Brooklyn Blvd CR 81 CR 3 11st Ave 6 US 169 Crashes Per Reference Point PM Peak January 1, 22 through December 31, Medicine Lake Rd 1 TH 62 7th St Excelsior Blvd TH 7 / W 36th St Minnetonka Blvd 16th St TH 55 Plymouth Ave Medicine Lk Rd 36th Ave 49th Ave Bass Lk Rd 63rd Ave N I-94 / I-694 Brooklyn Blvd CR 81 CR 3 11st Ave 25
28 The number of crashes on MN 36 over a 24-hour period varied little between 21 and 22. Congestion on MN 36 during the AM peak is heavy westbound from I-35W to I-35E with the highest number of crashes per reference point occurring at Rice Street. 5 MN 36: 24 Hour Crash Rate Trends Annual Crash Rate per MVM MN 36 I-35W to Snelling Snelling to I-35E I-35E to US 61 Freeway Segments Length Number of Crashes Volume Crash Rate Segments of MN 36 (Miles) 24 Hr AM PM 24 Hr AM PM 24 Hr AM PM I-35W to Snelling ,1 1, 13, Snelling to I-35E ,2 1,3 13, I-35E to US ,2 8,1 1, TOTAL: I-35W to US ,7 9,7 13,
29 6 MN 36 Crashes Per Reference Point AM Peak January 1, 22 through December 31, Rice St 1 I-35W Snelling Ave Lexington Ave Dale St Rice St I-35E TH 61 6 MN 36 Crashes Per Reference Point PM Peak January 1, 22 through December 31, I-35W Snelling Ave Lexington Ave Dale St Rice St I-35E TH 61 27
30 MN 62 has the highest crash rates of state highways in the Twin Cities Metro area with a 1.2 crash rate for the 24-hour period. This rate exceeds the 21 rate of 1.8 for the same time frame. The highest crash rate occurred on the highway segment of MN 1 to I-35W with a crash rate of 1.74 for the 24-hour period. Specifically, more than a quarter of the crashes happened at Penn Avenue (98), the majority during the off-peak period (61). Congestion levels are high in this area as traffic westbound approaches the I-35W commons. 5 MN 62: 24 Hour Crash Rate Trends Annual Crash Rate per MVM MN 62 I-494 to Gleason Rd. Gleason Rd. to MN 1 MN 1 to W. I-35W E. I-35W to MN 77 MN 77 to MN 55 Freeway Segments Length Number of Crashes Volume Crash Rate Segments of MN 62 (Miles) 24 Hr AM PM 24 Hr AM PM 24 Hr AM PM I-494 to Gleason Rd ,3 5,4 7, Gleason Rd. to MN , 11,6 15, MN 1 to W. I-35W ,9 11,6 15, E. I-35W to MN , 11,8 15, MN 77 to MN ,2 6,6 8, TOTAL: I-494 to MN ,5 9,2 12,
31 6 MN 62 Crashes Per Reference Point AM Peak January 1, 22 through December 31, I-494 Shady Oak Rd / TH 61 TH 212 West Gleason Rd Tracy Ave TH 1 France Ave Penn Ave I-35W Portland Ave TH 77/ Cedar Av 28th Ave 43rd Ave 6 MN 62 Crashes by Reference Point PM Peak January 1, 22 through December 31, Penn Ave 1 I-494 Shady Oak Rd / TH 6 TH 212 West Gleason Rd Tracy Ave TH 1 France Ave Penn Ave I-35W Portland Ave TH 77/ Cedar A 28th Ave 43rd Ave 29
32 MN 77 experienced an 8% increase in the number of crashes in 22 (25) compared with 21 (189) over a 24-hour period. The crash rate was the highest at I-494 to MN 62 (1.) over a 24-hour period. The most crashes per reference point occurred at MN 62 (31) and Old Shakopee Road (31) over a 24-hour period. 5. MN 77: 24 Hour Crash Rate Trends Annual Crash Rate per MVM MN 77. CR-23 to I-35E I-35E to I-494 I-494 to MN 62 Freeway Segments Length Number of Crashes Volume Crash Rate Segments of MN 77 (Miles) 24 Hr AM PM 24 Hr AM PM 24 Hr AM PM CR-23 to I-35E ,9 7,8 1, I-35E to I ,7 1, 13, I-494 to MN ,9 8,6 12, TOTAL: CR-23 to MN ,1 9,4 12,
33 6 MN 77 Crashes Per Reference Point AM Peak January 1, 22 through December 31, CR 38 I-35E Cliff Rd Diffley Rd TH 13 Minnesota River Old Shakopee Rd 84th St I-494 / TH 5 66th St TH 62 6 MN 77 Crashes Per Reference Point PM Peak January 1, 22 through December 31, MN 62 CR 38 I-35E Cliff Rd Diffley Rd TH 13 Minnesota River Old Shakopee Rd 84th St I-494 / TH 5 66th St TH 62 31
34 The segment of MN 1 from 36 th Avenue North to Brooklyn Boulevard was added to this report for 22. This segment of MN 1 is undergoing construction that will remove signalized intersections making this segment of roadway freeway status. This additional 2.43 miles of roadway in 22 brings the overall crash rate for MN 1 up to.93 per MVM relative to the crash rate in 21 of.87 over a 24 hour period. The 35 th Avenue North to Brooklyn Boulevard segment accounted for 91 crashes in a 24-hour period. The West 36 th Street reference point accounted for the most crashes per reference point in the PM peak period (17) due to heavy congestion on northbound MN 1. 5 MN 1: 24 Hour Crash Rate Trends Annual Crash Rate per MVM MN 1 1 I-494 to MN 62 MN 62 to MN 7 MN 7 to I-394 I-394 to 36th Ave N. Freeway Segments 36th Ave N. to Brooklyn Blvd Brooklyn Blvd to I Length Number of Crashes Volume Crash Rate Segments of MN 1 (Miles) 24 Hr AM PM 24 Hr AM PM 24 Hr AM PM I-494 to MN ,8 9,2 12, MN 62 to MN ,9 12,2 16, MN 7 to I ,2 12,4 16, I-394 to 36th Ave N ,9 8,5 11, th Ave N. to Brooklyn Blvd ,2 6,2 8, Brooklyn Blvd to I ,2 5,8 7, TOTAL: I-494 to I ,5 9,2 12,
35 6 MN 1 Crashes by Reference Point AM Peak January 1, 22 through December 31, I th St Benton Ave W 5th St / Vernon Ave Excelsior Blvd W 36th St Minnetonka Blvd Cedar Lake Rd Glenwood Ave Duluth St 29th Ave 36th Ave Broadway (Mpls) 5th Ave Brooklyn Blvd / CR 152 Humboldt Ave I-694 MN 1 Crashes Per Reference Point PM Peak January 1, 22 through December 31, West 36th Street I th St Benton Ave W 5th St / Vernon Ave Excelsior Blvd W 36th St Minnetonka Blvd Cedar Lake Rd Glenwood Ave Duluth St 29th Ave 36th Ave Broadway (Mpls) 5th Ave Brooklyn Blvd / CR 152 Humboldt Ave I
36 Length Number of Crashes Volume Crash Rate Segments of MN 5 (Miles) 24 Hr AM PM 24 Hr AM PM 24 Hr AM PM I-494 to Wheeler ,9 7,9 1, Length Number of Crashes Volume Crash Rate Segments of US 1 (Miles) 24 Hr AM PM 24 Hr AM PM 24 Hr AM PM E. Jct. US 169 to MN , 9,6 12, MN 47 to I-35W ,2 8,5 11, TOTAL: E. Jct. 169 to I-35W ,9 9,2 12, Length Number of Crashes Volume Crash Rate Segments of US 52 (Miles) 24 Hr AM PM 24 Hr AM PM 24 Hr AM PM I-494 to I , 7,9 1, Length Number of Crashes Volume Crash Rate Segments of US 212 (Miles) 24 Hr AM PM 24 Hr AM PM 24 Hr AM PM Valley View to Gleason Rd , 5,6 7, Length Number of Crashes Volume Crash Rate Segments of MN 28 (Miles) 24 Hr AM PM 24 Hr AM PM 24 Hr AM PM I-94 to Summer St ,4 6,2 8, Other Roads Length Number of Crashes Volume Crash Rate Segments of MN 61 (Miles) 24 Hr AM PM 24 Hr AM PM 24 Hr AM PM US 169 to MN , 5,1 6, MN 252 to US ,8 7,3 9,
37 APPENDIX A: 22 AM Congestion Map 22 Metro Freeway Congestion 6: - 9: AM 6: am - 9: am 1 N 61 35W 94 35E W E W AM No Congestion < 1 Hour of Congestion 1-2 Hours of Congestion >2 Hours of Congestion River Roads 35W 77 35E Congestion Congestion WHERE ESTIMATED SPEEDS ARE < 45 MPH WHERE ESTIMATED SPEEDS ARE < 45 MPH Total Miles of Congestion Total Miles of Freeway Data collected and system observations made October
38 APPENDIX B: 22 PM Congestion Map Metro Metro Freeway Congestion 2: - 7: PM 2: pm - 7: pm 1 N 61 35W 94 35E W E W W 77 35E PM Congestion No Congestion 15 min - 1 Hour of Congestion 1-2 Hours of Congestion 2-3 Hours of Congestion >3 Hours of Congestion River Roads Congestion Congestion WHERE ESTIMATED SPEEDS ARE < 45 MPH Total ARE Miles < of 45 Congestion MPH Total Miles of Freeway WHERE ESTIMATED SPEEDS Data collected and observations made October
B. Congestion Trends. Congestion Trends
 B. Congestion Trends Congestion Trends There are two types of congestion that impact mobility: recurring and non-recurring congestion. Recurring congestion is related to segments of roadway that are over
2009 Regional Solicitation Selected Projects*
 2009 Regional Solicitation Selected Projects* Special Federal Allocation from the MPO Mn/DOT I-494/TH169 Interchange Reconstruction $34,000,000 Surface Transportation Program - Urban Guarantee AR-09-10
Hennepin County 2040 Bicycle Transportation Plan. Appendix D. Full list of planned bikeway system corridors
 Hennepin County 2040 Bicycle Transportation Plan Appendix D. Full list of planned bikeway system corridors Full Listing of Planned 2040 Bikeway System Segments Figure 1 Planned 2040 Bikeway System Corridors
Minnesota Department of Transportation 2011 Twin Cities Metro Area Construction Projects
 Minnesota Department of Transportation 2011 Twin Cities Metro Area Construction Projects 1 N 14 9 Chisago Interstate Highway 2011 Project Sites 8 12 6 Anoka 1 6 0 6 22 6 6 9 12 7 7 7 284 74 2 41 71 29
CHAPTER 1 TRANSIT MARKET AREAS AND EXISTING SERVICE
 CHAPTER 1 TRANSIT MARKET AREAS AND EXISTING SERVICE Transit Market Areas While several factors influence the propensity to use transit, the primary predictors of transit productivity are the density of
2006 WEEKDAY TRAFFIC PROFILE. June 15, 2007
 June 15, 2007 Mr. Gary Stobb, P.E. Director of Planning/Operations Harris County Toll Road Authority 330 Meadowfern, Suite 200 Houston, TX 77067 Re: Westpark Tollway Value Pricing Analysis Dear Mr. Stobb:
Interstate 90 and Mercer Island Mobility Study APRIL Commissioned by. Prepared by
 Interstate 90 and Mercer Island Mobility Study APRIL 2017 Commissioned by Prepared by Interstate 90 and Mercer Island Mobility Study Commissioned by: Sound Transit Prepared by: April 2017 Contents Section
DISTRICT EXPRESS LANES ANNUAL REPORT FISCAL YEAR 2017 JULY 1, 2016 JUNE 30, FloridaExpressLanes.com
 DISTRICT EXPRESS LANES ANNUAL REPORT FISCAL YEAR 2017 JULY 1, 2016 JUNE 30, 2017 FloridaExpressLanes.com This page intentionally left blank. TABLE OF CONTENTS List of Figures... ii List of Tables.... ii
I-94 East Corridor Performance
 Corridor Context The corridor runs 16 miles between downtown St. Paul and the Wisconsin state border. The corridor serves as an important East-West connection for the Metro area, serving the communities
HOV LANE PERFORMANCE MONITORING: 2000 REPORT EXECUTIVE SUMMARY
 Final Report Research Project Agreement No. T1803, Task 4 HOV Monitoring V HOV LANE PERFORMANCE MONITORING: 2000 REPORT EXECUTIVE SUMMARY by Jennifer Nee TRAC Research Engineer John Ishimaru TRAC Senior
1.2 Corridor History and Current Characteristics
 SECTION 1 Description and Background of Study Area 1.1 Introduction This preliminary engineering report was prepared for the Alaska Department of Transportation and Public Facilities (ADOT&PF). It is part
DEMOGRAPHICS AND EXISTING SERVICE
 EXECUTIVE SUMMARY The Central Corridor light-rail transit (LRT) project will open in 2014 and operate between downtown Minneapolis and downtown St. Paul, serving the University of Minnesota and University
5.1 Traffic and Transportation
 5.1 When it opens in 2009, the Bellevue Nickel Improvement Project will increase the number of vehicles able to travel through the study area, improve travel speeds, and improve safety by reducing the
MEMORANDUM. Lynn Hayes LSA Associates, Inc.
 MEMORANDUM To: Lynn Hayes LSA Associates, Inc. Date: May 5, 217 From: Zawwar Saiyed, P.E., Senior Transportation Engineer Justin Tucker, Transportation Engineer I Linscott, Law & Greenspan, Engineers LLG
SANTA CLARA COUNTY I-280 CORRIDOR STUDY
 SANTA CLARA COUNTY I-280 CORRIDOR STUDY Appendix B 2 Technical Memorandum Existing Transportation Condition Memo SANTA CLARA VALLEY TRANSPORTATION AUTHORITY (VTA) 1-1 Introduction The I-280 Corridor Study
APPENDIX J MODIFICATIONS PERFORMED TO THE TOR
 APPENDIX J MODIFICATIONS PERFORMED TO THE TOR This appendix summarizes the modifications that were performed in years 2012 and 2017 to rectify calculation errors that were observed in the data presented
Word Count: 3,565 Number of Tables: 4 Number of Figures: 6 Number of Photographs: 0. Word Limit: 7,500 Tables/Figures Word Count = 2,250
 Katherine F. Turnbull, Ken Buckeye, Nick Thompson 1 Corresponding Author Katherine F. Turnbull Executive Associate Director Texas Transportation Institute Texas A&M University System 3135 TAMU College
CONGESTION REPORT 1 st Quarter 2018
 CONGESTION REPORT 1 st Quarter 2018 A quarterly update of the National Capital Region s traffic congestion, travel time reliability, top-10 bottlenecks and featured spotlight Feburary 11, 2019 ABOUT TPB
TRANSPORTATION ELEMENT
 Transportation TRANSPORTATION ELEMENT Data, Inventory, and Analysis Prepared by Contents 1.0 INTRODUCTION... 1 2.0 EXISTING CONDITIONS... 1 2.1 Roadways... 1 2.1.1 Jurisdiction... 1 2.1.2 Functional Classification...
Project Deliverable 4.1.3f Individual City Report - City of San Dimas
 Pomona Valley ITS Project Project Deliverable 4.1.3f Individual City Report - City of San Dimas Prepared by: April 19, 2002 099017000.1 Copyright 2002, Kimley-Horn and Associates, Inc TABLE OF CONTENTS
Memorandum. Roger Millar, Secretary of Transportation. Date: April 5, Interstate 90 Operations and Mercer Island Mobility
 Memorandum To: From: The Honorable Dow Constantine, King County Executive; The Honorable Ed Murray, City of Seattle Mayor; The Honorable Bruce Bassett, City of Mercer Island Mayor; The Honorable John Stokes,
Section 106 Update Memo #1 Attachment D. Traffic Diversion & APE Expansion Methodology & Maps
 Section 106 Update Memo #1 Attachment D Traffic Diversion & APE Expansion Methodology & Maps I-65/I-70 North Split Interchange Reconstruction Project (Des. Nos. 1592385 & 1600808) Traffic Diversion and
Role of High-Occupancy-Vehicle Lanes Highway Construction Management
 TRANSPORTATION RESEARCH RECORD 1280 131 Role of High-Occupancy-Vehicle Lanes Highway Construction Management In ALLAN E. PINT, CHARLEEN A. ZIMMER, AND FRANCIS E. LOETTERLE The Minnesota Department of Transportation
A. CONCLUSIONS OF THE FGEIS
 Chapter 11: Traffic and Parking A. CONCLUSIONS OF THE FGEIS The FGEIS found that the Approved Plan will generate a substantial volume of vehicular and pedestrian activity, including an estimated 1,300
Southwest LRT Alignment Video Narration
 Southwest LRT Alignment Video Narration September 2015 Southwest Light Rail Transit, a proposed extension of the METRO Green Line, will serve Minneapolis, St. Louis Park, Hopkins, Minnetonka and Eden Prairie.
MEMORANDUM. for HOV Monitoring on I-93 North and the Southeast Expressway, Boston Region MPO, November, 2011.
 MEMORANDUM Date: January 12, 2012 To: Congestion Management Process Files From: Seth Asante, Ryan Hicks, and Efi Pagitsas MPO Staff Re: Historical Trends: Travel Times and Vehicle Occupancy Levels for
HDR itrans Consulting Inc. 100 York Blvd., Suite 300 Richmond Hill, ON L4B 1J8 Tel: (905) Fax: (905)
 Fax: (905)") !" # $ !" # $ Consulting Inc. 100 York Blvd., Suite 300 Richmond Hill, ON L4B 1J8 Tel: (905) 882-4100 Fax: (905) 882-1557 www.itransconsulting.com November 2009 %&'('$&$ 1. West Brampton Road Network...
!" # $ !" # $ Consulting Inc. 100 York Blvd., Suite 300 Richmond Hill, ON L4B 1J8 Tel: (905) 882-4100 Fax: (905) 882-1557 www.itransconsulting.com November 2009 %&'('$&$ 1. West Brampton Road Network...
MEMORANDUM. Open Section Background. I-66 Open Section Study Area. VDOT Northern Virginia District. I-66 Project Team. Date: November 5, 2015
 MEMORANDUM To: VDOT Northern Virginia District From: I-66 Project Team Date: November 5, 2015 Subject: Open Section Background The purpose of this technical memorandum is to provide narrative and technical
Research Report Agreement T4118, Task 24 HOV Action Plan HOV ACTION PLAN
 Research Report Agreement T4118, Task 24 HOV Action Plan HOV ACTION PLAN by John M. Ishimaru Senior Research Engineer Duane Wright Systems Analyst Programmer Mark E. Hallenbeck Director Jaime Kang Research
TABLE OF CONTENTS. Coral Springs Charter High School and Middle School Job No Page 2
 Job No. 15-019 Page 2 TABLE OF CONTENTS 1.0 INTRODUCTION... 4 2.0 EXISTING CONDITIONS... 5 3.0 TRAFFIC GENERATION... 7 4.0 TRIP DISTRIBUTION... 8 5.0 FUTURE CONDITIONS... 8 6.0 SITE ACCESS...13 7.0 CONCLUSION...13
What We ve Learned About Highway Congestion
 What We ve Learned About Highway Congestion BY PRAVIN VARAIYA THERE ARE 26,000 SENSORS buried under the pavements of California freeways. Every thirty seconds, those sensors send data to our computers
rtc transit Before and After Studies for RTC Transit Boulder highway UPWP TASK Before Conditions
 rtc transit Before and After Studies for RTC Transit UPWP TASK 3403-11-14 Before Conditions Report Boulder highway June 2011 Before and After Studies for RTC Transit BOULDER HIGHWAY BEFORE STUDY UPWP Task
10.0 Recommendations Methodology Assumptions
 10.0 Recommendations To accommodate the projected growth of the I-526 corridor, this report has summarized potential improvement strategies that were separated into four categories, TDM, Modal, Traffic
ROUTE 20 CORRIDOR STUDY ---- Orange County, Virginia
 ROUTE 20 CORRIDOR STUDY ---- Orange County, Virginia Prepared by PARSONS Fairfax, Virginia on behalf of the: Rappahannock-Rapidan Regional Commission in cooperation with Orange County, Virginia Virginia
Construction underway. STATUS: 229 5,190 5,419 5,305 STIP REFERENCE #FR /01/2013
 FREDERICK COUNTY STATE HIGHWAY ADMINISTRATION -- Frederick County -- Line 1 PROJECT: I-7, Baltimore National Pike INTERSTATE CONSTRUCTION PROGRAM DESCRIPTION: Widen I-7 east of MD 355 to east of MD 144
FINAL TERMINAL TRAFFIC MONITORING STUDY
 FINAL TERMINAL 91 216 TRAFFIC MONITORING STUDY Prepared for: Port of Seattle February 15, 217 Prepared by: 12131 113 th Avenue NE, Suite 23 Kirkland, WA 9834-712 Phone: 425-821-3665 www.transpogroup.com
Corridor Management Committee Meeting. April 2, 2014
 Corridor Management Committee Meeting April 2, 2014 1 Today s Topics Welcome Approval of Minutes Resolutions Response to March 26 CMC Questions Staff Recommendation on Project Scope and Budget Public Testimony
ROUTE 122 CORRIDOR STUDY ---- Bedford County and Bedford City, Virginia
 ROUTE 122 CORRIDOR STUDY ---- Bedford County and Bedford City, Virginia Developed by Region 2000 Regional Commission In cooperation with Bedford County, Virginia City of Bedford, Virginia Virginia Department
V. DATA COLLECTION PROGRAM
 V. DATA COLLECTION PROGRAM As discussed in Section IV, an extensive data assembly and data collection program was undertaken to develop the data necessary to calibrate the existing Portway Extensions model
Texas Transportation Institute The Texas A&M University System College Station, Texas
 1. Report No. FHWA/TX-05/0-4434-P1 2. Government Accession No. 3. Recipient's Catalog No. 4. Title and Subtitle GUIDANCE FOR FUTURE DESIGN OF FREEWAYS WITH HIGH- OCCUPANCY VEHICLE (HOV) LANES BASED ON
Mainline Description
 Mainline Description The Mainline component of Florida s Turnpike extends for 320 miles and consists of five distinct sections as shown in the figure above. These sections are the SR 821 (HEFT), Southern
Table 2 SIP Project Description Summary
 2 Urban Core 3 Urban Core 3 Urban Core 3 Urban Core 4 Urban Core Meet HFN criteria between Franklin Av and Wash/Oak, Marcy Holmes. Improve frequency between Franklin/Hennepin and Oak/Wash to 10" between
US 19 Sunset Point Rd to Countryside Blvd.
 Frontage Lanes Alternative Six-Lane Roadway Two-Lane, One-Way Frontage Lanes Close All Median Openings w/ Concrete Median Barrier Construct Within Existing Right-of-Way Status Update Construction started
APPENDIX A Route Maps and Schedules
 AENDIX A Route Maps and s Minnetonka Transit Study Existing Conditions Report Metropolitan Council This appendix includes maps and schedules for Metro Transit routes serving Minnetonka, supplementing information
Transportation Improvement District (TID) Exercise New Castle County Unified Development Code
 Exercise New Castle County Unified Development Code") Transportation Improvement District (TID) Exercise New Castle County Unified Development Code Churchmans Crossing TID How should New Castle County deploy Transportation Improvement Districts (TIDs)? Site
Transportation Improvement District (TID) Exercise New Castle County Unified Development Code Churchmans Crossing TID How should New Castle County deploy Transportation Improvement Districts (TIDs)? Site
2008 DEKALB COUNTY TRANSPORTATION PLAN (UPDATE)
") 2008 DEKALB COUNTY TRANSPORTATION PLAN (UPDATE) TABLE OF CONTENTS Introduction 1 Transportation Planning Activities 2 Identification of Problem Areas and Recommended Solutions 7 DeKalb County Projects
2008 DEKALB COUNTY TRANSPORTATION PLAN (UPDATE) TABLE OF CONTENTS Introduction 1 Transportation Planning Activities 2 Identification of Problem Areas and Recommended Solutions 7 DeKalb County Projects
McLean Citizens Association Transportation Committee Project Briefing
 McLean Citizens Association Transportation Committee Project Briefing November 10, 2015 Project Map 2 Project Context Only Interstate in the Country limited to HOV only traffic during rush hours Stoplight
TRAFFIC IMPACT STUDY REPORT FOR PROPOSED OFFICE PROJECT AT 959 SEWARD STREET IN HOLLYWOOD SNYDER PARTNERS
 DRAFT TRAFFIC IMPACT STUDY REPORT FOR PROPOSED OFFICE PROJECT AT 959 SEWARD STREET IN HOLLYWOOD Prepared for: SNYDER PARTNERS Prepared by: Crain & Associates 2007 Sawtelle Boulevard, Suite 4 Los Angeles,
PURPOSE AND NEED (CONCURRENCE POINT 1) NEW CANADA ROAD PROJECT FROM STATE ROUTE 1 (U.S. HIGHWAY 70) TO U.S. INTERSTATE 40
 NEW CANADA ROAD PROJECT FROM STATE ROUTE 1 (U.S. HIGHWAY 70) TO U.S. INTERSTATE 40") PURPOSE AND NEED (CONCURRENCE POINT 1) NEW CANADA ROAD PROJECT FROM STATE ROUTE 1 (U.S. HIGHWAY 70) TO U.S. INTERSTATE 40 Project Description The primary purpose of this project is to improve the major
PURPOSE AND NEED (CONCURRENCE POINT 1) NEW CANADA ROAD PROJECT FROM STATE ROUTE 1 (U.S. HIGHWAY 70) TO U.S. INTERSTATE 40 Project Description The primary purpose of this project is to improve the major
KING STREET TRANSIT PILOT
 KING STREET TRANSIT PILOT Update toronto.ca/kingstreetpilot #kingstreetpilot HIGHLIGHTS TRANSIT RIDERSHIP TRANSIT CAPACITY To respond to this growth in ridership, the TTC has increased the capacity of
Washington Metropolitan Area Transit Authority Services Utilization Study
 Washington Metropolitan Area Transit Authority Services Utilization Study Maryland House Bill 300 Table of Contents Page 2 Executive Summary Slide 3 Notes Slide 4 Metro Systemwide Fact Sheet Slide 5 How
Appendix 4.1 J. May 17, 2010 Memorandum from CTPS to the Inter Agency Coordinating Group
 Appendix 4.1 J May 17, 2010 Memorandum from CTPS to the Inter Agency Coordinating Group CTPS CENTRAL TRANSPORTATION PLANNING STAFF Staff to the Boston Region Metropolitan Planning Organization MEMORANDUM
Site Location and Setting
 Memorandum Date: To: From: Subject: Kristy Le, Gary Black Steve Orem Santa Teresa County Park Historic Area Traffic and Parking Study Hexagon Transportation Consultants, Inc. has completed a traffic and
Northeast Stoney Trail In Calgary, Alberta
 aci Acoustical Consultants Inc. 5031 210 Street Edmonton, Alberta, Canada T6M 0A8 Phone: (780) 414-6373, Fax: (780) 414-6376 www.aciacoustical.com Environmental Noise Computer Modelling For Northeast Stoney
MINNESOTA DEPARTMENT OF TRANSPORTATION BRIDGE MANAGEMENT UNIT BRIDGE ROSTER - SHOWING DEFICIENT T.H. BRIDGES STATEWIDE 08/02/2007 PAGE: 1 YEAR
 BRIDGE ROSTER - SHOWING ICIENT T.H. BRIDGES EWIDE 08/02/2007 PAGE: 1 AITKIN ANOKA ANOKA ANOKA ANOKA ANOKA BELTRAMI BLUE EARTH BROWN BROWN BROWN CARLTON CARVER CARVER CARVER CARVER CASS CHIPPEWA CHIPPEWA
Nashua Regional Planning Commission
 Nashua Regional Planning Commission Congestion Management Program Corridor Overview NH 111 is a major east-west arterial roadway that passes through 3 municipalities in the Nashua region. It enters the
7272 WISCONSIN AVENUE LOCAL AREA TRANSPORTATION REVIEW
 7272 LOCAL AREA TRANSPORTATION REVIEW AND TRANSPORTATION POLICY AREA REVIEW MONTGOMERY COUNTY, MARYLAND Submitted on behalf of Carr Properties Prepared by: Wells + Associates, Inc. Submission: July 1,
108 miles/1,427 Average ADT miles/613 Average ADT miles/1,851 Average ADT
 APPENDIX A: Sections of regionally significant roads and highways that are in need of reconstruction. All roadway segments are between 1-20 miles in length and carry at least 5,000 average daily traffic
Date: 11/6/15. Total Passengers
 Total San Diego Metropolitan Transit System POLICY 42 PERFORMANCE MONITORING REPORT Page 1 of 6 OBJECTIVE Develop a Customer-Focused and Competitive System The following measures of productivity and service
Strategic Signal Timing Changes = BIG Results. Barbara Jones, PE, PTOE DGL Consulting Engineers, LLC Senior Traffic Engineer
 Strategic Signal Timing Changes = BIG Results Barbara Jones, PE, PTOE DGL Consulting Engineers, LLC Senior Traffic Engineer Pre Signal Timing Updates Signal Timing Updates Average Retiming Interval Percent
Project Deliverable 4.1.3d Individual City Report - City of La Verne
 Pomona Valley ITS Project Project Deliverable 4.1.3d Individual City Report - City of La Verne Prepared by: April 19, 2002 099017000.1 Copyright 2002, Kimley-Horn and Associates, Inc TABLE OF CONTENTS
STUDY DESCRIPTION MEMORANDUM. DATE April 20, 2011
 DATE April 0, 0 TO FROM RE MEMORANDUM Congestion Management Program Files Ariel Godwin, CMP Manager Boston Region MPO Staff Limited-Access Highway Counts and Traffic Volumes, Summer 00 This memorandum
Rappahannock-Rapidan Regional Commission 2010 Travel Time Survey
 Rappahannock-Rapidan Regional Commission 2010 Travel Time Survey Rappahannock Rapidan Regional Commission 420 Southridge Pkwy. Suite 106 Culpeper, VA 22701 June 16, 2010 Introduction Travel time, or the
FHWA P/N Guidelines. Corridor Relationship. Highway 22 Segment 1 - US 169 to CSAH 2 Relevance / Documentation of Need
 Highway 22 Segment 1 - US 169 to CSAH 2 Vehicle Mobility Congestion Intersection Congestion Existing Conditions - Based on Highway Capacity Manual methodology, corridor level of service is currently LOS
ROUTE 630 DIVERGING DIAMOND INTERCHANGE
 ROUTE 630 DIVERGING DIAMOND INTERCHANGE Virginia Department of Transportation Contract Value and Dates Contract Value: $99,949,969.50 Start of Construction: Summer 2017 Final Completion Date: July 31,
APPENDIX H MILESTONE 2 TRAFFIC OPERATIONS ANALYSIS OF THE AT-GRADE CROSSINGS
 Draft Environmental Impact Statement/Environment Impact Report Appendix H Milestone 2 Traffic Operations Analysis of the At-Grade Crossings APPENDIX H MILESTONE 2 TRAFFIC OPERATIONS ANALYSIS OF THE AT-GRADE
CALIFORNIA HIGH-OCCUPANCY VEHICLE LANE DEGRADATION ACTION PLAN
 CALIFORNIA DEPARTMENT OF TRANSPORTATION CALIFORNIA HIGH-OCCUPANCY VEHICLE LANE DEGRADATION ACTION PLAN Prepared by Division of Traffic Operations Office of Traffic Management Submitted to Federal Highway
DULLES AREA HIGHLIGHTS. Gary Garczynski Commonwealth Transportation Board Northern Virginia District. Committee for Dulles August 4, 2016
 DULLES AREA HIGHLIGHTS Gary Garczynski Commonwealth Transportation Board Northern Virginia District Committee for Dulles August 4, 2016 Smart Scale (formerly HB2) Overview Round 1 completed with the adoption
LINK (5465) N. Robert St., St. Paul, MN 55101
 N. Robert St., St. Paul, MN 55101") 651-602-LINK (5465) www.transitlinktc.org 390 N. Robert St., St. Paul, MN 55101 Service Details Customer Guide Table of Contents Customer Guide... page 1 Service Details... page 2 Areas... page 2 Eligibility...
651-602-LINK (5465) www.transitlinktc.org 390 N. Robert St., St. Paul, MN 55101 Service Details Customer Guide Table of Contents Customer Guide... page 1 Service Details... page 2 Areas... page 2 Eligibility...
%g 109 %g 9. %g 99. %g 9. %g 4. %g 4 %g ,95 (/ 1. Route 109 Corridor Study. %g 35. Corridor Study Area Study Area. Sanford.
 %g 4A %g 109 %g 4 Sanford %g 4 %g 109 %g 99 North Berwick Wells 3 0 3 Miles Route 109 Corridor Study %g 9 %g 109 %g 9A %g9a %g 9 Kennebunk.-,95 W N S E EXIT 2 MEETING HOUSE RD BRAGDO N RD 20 2 %g1 1 (/
COMPLETE TRANSPORTATION GUIDE TO SUPER BOWL LII IN THE BOLD NORTH
 KNOW BEFORE YOU GO COMPLETE TRANSPORTATION GUIDE TO SUPER BOWL LII IN THE BOLD NORTH Travel Tips Minnesota is ready, prepared, and excited to welcome you to the Bold North! Clock Management: Experience
OREGON DEPARTMENT OF TRANSPORTATION STATEWIDE ROAD, WEATHER AND INCIDENT CONDITIONS 9/5/2018 2:12:06 PM
 OREGON DEPARTMENT OF TRANSPORTATION STATEWIDE ROAD, WEATHER AND INCIDENT CONDITIONS Incidents/: 9/5/2018 2:12:06 PM ROUTE ORE99EB 2 3 @ Salem, Hyacinth/Verda Hwy100 15 22 7 Mi W of Ainsworth St Park Southbound
Pedestrian Safety Review Spadina Avenue
 STAFF REPORT ACTION REQUIRED Pedestrian Safety Review Spadina Avenue Date: October 13, 2015 To: Toronto and East York Community Council From: Director, Transportation Services, Toronto and East York District
RETAIL / RESTAURANT EXPERIENCE
 PROJECT/LOCATION SIZE/SQUARE FOOT BUILDING TYPE 7th Place Building St. Paul, MN 20,000 Retail 7th Place Building - Phase 2B St. Paul, MN 10,000 Retail 1221 West Lake St. Minneapolis, MN 39,000 Office/Retail
Managed Lanes, Transit Access, and Economic Development: Implementing the Region s First Highway BRT Corridor
 Managed Lanes, Transit Access, and Economic Development: Implementing the Region s First Highway BRT Corridor Tim Burkhardt, AICP William Reynolds, AICP, PTP Matt Horton Who we are/astrological signs Tim
3 Level of Service Results: Freeways and Arterials
 3 Level of Service Results: Freeways and Arterials This section presents a summary of LOS results for the freeways, ramps and arterials (Tier 1 and Tier 2 CMP network). In general, the number of congested
Arlington County Board Meeting Project Briefing. October 20, 2015
 Arlington County Board Meeting Project Briefing October 20, 2015 Project Map 2 Project Context Only Interstate in the Country limited to HOV only traffic during rush hours Stoplight at the end of I-66
VCTC Transit Ridership and Performance Measures Quarterly Report
 VCTC Transit Ridership and Performance Measures Quarterly Report Overview Quarter 2 Fiscal Year 2018-2019 This report provides performance measures for VCTC Intercity Bus Service covering the FY 2018-19
CHAPTER ONE: SUMMARY OF EXISTING TRANSIT SERVICE NETWORK
 CHATER ONE: SUMMARY OF EXISTING TRANSIT SERVICE NETWORK CURRENT NETWORK STRUCTURE In the Northwest Metro Transit Study area, as in most of the Metro Transit network, there are two distinct route structures,
4. Safety Concerns Potential Short and Medium-Term Improvements
 NH Route 104 Access Management Study Page 19 4. Safety Concerns Potential Short and Medium-Term Improvements Potential safety improvement strategies are listed by priority based on field observations by
CONGESTION MONITORING THE NEW ZEALAND EXPERIENCE. By Mike Curran, Manager Strategic Policy, Transit New Zealand
 CONGESTION MONITORING THE NEW ZEALAND EXPERIENCE 26 th Australasian Transport Research Forum Wellington New Zealand 1-3 October 2003 By, Manager Strategic Policy, Transit New Zealand Abstract New Zealand
NORTH FRASER PERIMETER ROAD WEST CORRIDOR DEFINITION STUDY
 NORTH FRASER PERIMETER ROAD WEST CORRIDOR DEFINITION STUDY MAY 2011 SW1132SWD NORTH FRASER PERIMETER ROAD WEST CORRIDOR DEFINITION STUDY TABLE OF CONTENTS 1.0 INTRODUCTION... 1 2.0 CURRENT TRAVEL PATTERNS
Aviation, Rail, & Trucking 6-1
 6-1 This chapter describes the services, facilities, and condition of air, rail, and trucking as components of the transportation system. These three intermodal areas have an impact on the factors to be
*Note: This data is preliminary and subject to change*
 *Note: This data is preliminary and subject to change* This product is an objective analysis of NWS Cooperative Observer Program (COOP) and Community Collaborative Rain, Hail and Snow Network (CoCoRaHS)
Washington St. & Ash Coulee Dr./43 rd Ave Intersection Study
 430 IACC Building Fargo, ND 58105 Tel 701-231-8058 Fax 701-231-1945 www.ugpti.org www.atacenter.org Washington St. & Ash Coulee Dr./43 rd Ave Intersection Study Final Report April 2007 Prepared for: City
Att. A, AI 46, 11/9/17
 Total s San Diego Metropolitan Transit System POLICY 42 PERFORMANCE MONITORING REPORT Page 1 of 6 Date: 11/8/17 OBJECTIVE Develop a Customer-Focused and Competitive System The following measures of productivity
EXISTING CONDITIONS A. INTRODUCTION. Route 107 Corridor Study Report
 II. EXISTING CONDITIONS A. INTRODUCTION The Route 107 study area extends from the south at Chestnut Street in Lynn approximately 3.7 miles to the north to Boston Street in Salem. The study area has three
DRAGON DOOR PUBLICATIONS
 DRAGON DOOR PUBLICATIONS 5 East County Road B, Suite 3 Little Canada, MN 55117 Phone: 651-487-2180 FAX: 651-487-3840 E-mail: support@dragondoor.com Russian Kettlebell Challenge Certification Workout Location
A. From I-68 in Monongalia County, West Virginia to SR 6119 in Fayette County, Pennsylvania 1
 Mon-Fayette Transportation Project A. From I-68 in Monongalia County, West Virginia to SR 6119 in Fayette County, Pennsylvania 1 The Mon/Fayette Transportation Project (MFTP) from I-68 in West Virginia
3 ASSESSMENT OF THE CORRIDOR
 3 ASSESSMENT OF THE CORRIDOR 3.1 PHYSICAL CHARACTERISTICS OF THE CORRIDOR The 9-mile segment of I-66 from the Capital Beltway to the Theodore Roosevelt Memorial Bridge was opened to vehicular traffic in
October REGIONAL ROUTE PERFORMANCE ANALYSIS
 October 2018 2017 REGIONAL ROUTE PERFORMANCE ANALYSIS The Council s mission is to foster efficient and economic growth for a prosperous metropolitan region Metropolitan Council Members Alene Tchourumoff
MORE TIME PLACEMENT HIGH TRAFFIC LOCATIONS 10-SECOND AD SPOTS
 STATE OF THE ART BETTER TECHNOLOGY MORE TIME PLACEMENT HIGH TRAFFIC LOCATIONS 10-SECOND AD SPOTS REACH & FREQUENCY Las Vegas Billboards is dedicated to giving the reach and frequency needed for a successful
Abbott Rd Rehabilitation Phase II - Elmore Rd to Birch Rd
 Abbott Rd Rehabilitation Phase II - Elmore Rd to Birch Rd Project ID SOA07003 Department State of Alaska Project Type Improvement Start Date December 2017 Location Assembly: Section 4, Seats F & G, Assembly:
Executive Summary. Need for the Study FINAL REPORT
 FINL REPORT Executive Summary The transportation system of Dakota County, Minnesota, is built around a framework of Principal rterial P highways, which are well established to the north for example, the
BaltimoreLink Implementation Status Report
 BaltimoreLink Implementation Status Report February 218 Joint Chairmen s Report JH1 Executive Summary BaltimoreLink, implemented on June 18, 217, is the complete overhaul and rebranding of the core transit
For Immediate Release Christine Girardin January 19, 2018 SUMTER COUNTY FLORIDA S TURNPIKE AND I-75 INTERCHANGE IMPROVEMENTS
 TRAFFIC ADVISORY For Immediate Release Christine Girardin 407-264-3069 January 19, 2018 Central and West Central Florida Weekly Lane Closures and Work Zone Advisory OCOEE Florida s Turnpike announces lane
SACMETRO FREEWAY SERVICE PATROL: STATUS REPORT FOR 3RD QUARTER, FY
 JUNE 11, 2015 AGENDA ITEM # 9 SACMETRO FREEWAY SERVICE PATROL: STATUS REPORT FOR 3RD QUARTER, FY 2014-15 Action Requested: Receive and file Key Staff: Norman Hom, Administrative Services Officer III Recommendation
PUBLIC TRANSIT IN KENOSHA, RACINE, AND MILWAUKEE COUNTIES
 PUBLIC TRANSIT IN KENOSHA, RACINE, AND MILWAUKEE COUNTIES #118404v1 Regional Transit Authority June 19, 2006 1 Presentation Overview Existing Public Transit Transit System Peer Comparison Recent Transit
HEATHROW COMMUNITY NOISE FORUM
 HEATHROW COMMUNITY NOISE FORUM 3Villages flight path analysis report January 216 1 Contents 1. Executive summary 2. Introduction 3. Evolution of traffic from 25 to 215 4. Easterly departures 5. Westerly
Environmental Assessment and Final Section 4(f)
") Environmental Assessment and Final Section 4(f) South Pleasant View Road, City of Madison County Highway M Reconstruction Cross Country Road to Prairie Hill Road Project ID 5992-09-81 September 16, 2016
Environmental Assessment and Final Section 4(f) South Pleasant View Road, City of Madison County Highway M Reconstruction Cross Country Road to Prairie Hill Road Project ID 5992-09-81 September 16, 2016