New Mexico Tourism Department 2016 Annual Report
|
|
|
- Curtis Heath
- 6 years ago
- Views:
Transcription

1 New Mexico Tourism Department 2016 Annual Report April 2017
2 INTRODUCTION The New Mexico Tourism Department s (NMTD) marketing strategy is thoroughly research based, utilizing the highest quality data sources and analysis. The purpose of the NMTD Annual Report is to document and measure the state of New Mexico s tourism industry and NMTD s efforts to grow New Mexico s economy by growing the tourism industry in New Mexico. NMTD seeks to measure its impact by utilizing a variety of tourism indicators and vendor supplied datasets such as Longwoods Travel USA data and Tourism Economics Tourism Impact studies. The executive summary provides a high-level overview of 2016 s findings, and comprises three sections: 1. Annual Performance Highlights Performance Commentary 3. Overview of NMTD Research Findings: 2010 through 2016 which provides a review of some of NMTD s most significant and best documented research findings from 2011 to Further detailed information can be found in the five sections after the Executive Report, as shown in the index on page 3. This report contains data that was available as of January 10 th, With regard to terms used in this report, YOY means year over year, and New Mexico s competitive set of states includes Arizona, Colorado and Utah. The department s Annual Reports are living documents that will continue to evolve based on feedback and new information sources. All research reports are available on the NM Tourism Industry website under the research section. Comments are welcome and should be addressed to Victoria.gregg@state.nm.us Page 2
3 Table of Contents EXECUTIVE SUMMARY... 4 Annual Performance Highlights Performance Commentary NEW MEXICO BRAND PERFORMANCE 10 NMTD VISITOR RELATIONSHIPS 11 NEW MEXICO VISITOR PROFILE 12 VISIT CHARACTERISTICS (2 Objectives) 13 Overview of NMTD Research Findings: NEW MEXICO BRAND PERFORMANCE Tourism Visits Intent to Travel National Travel Intent, In-State Travel Intent, Repeat Visitation Rate ECONOMIC IMPACT OF TOURISM IN NEW MEXICO New Mexico Leisure and Hospitality Employment New Mexico Hotel & Motel Total Receipts NM Gross Receipts Accommodation Taxes & Food, Drink and Accommodation Gross Receipts NMTD VISITOR RELATIONSHIPS Social Media Presence YouTube Views Website Interaction Referrals from NewMexico.org to Industry Partners Vacation Guides NEW MEXICO VISITOR PROFILE Percent Primary Overnight Visitor Trips Regional Concentration of Visitor Trips Average Age of Visitors Fly Market Outdoor & Cultural Activity Indexes VISIT CHARACTERISTICS Airport Passenger Volume Albuquerque International Airport New Mexico National Park and Monuments Visits Page 3
4 EXECUTIVE SUMMARY The executive summary is composed of three sections. The Annual Performance Highlights section presents a quick overview of the major data highlights since the last annual report. Much of the data in this section comes from The Economic Impact of Tourism in New Mexico: 2015 Analysis which was released in July The full 2015 Economic Impact of Tourism report is available in the research section at and includes comprehensive economic impact information statewide and for the 33 counties in New Mexico. The 2015 Performance Commentary section presents a summary and commentary on other key metrics not already presented in the Annual Performance Highlights section. This section is organized under the following categories: New Mexico Brand Performance; NMTD Visitor Relationships; New Mexico Visitor Profile; and Visit Characteristics. Finally, the Overview of NMTD Research Findings: 2011 through 2016 provides a review of NMTD s most significant research findings over the last 5+ years. Page 4


5 Annual Performance Highlights As with last year, performance in the tourism sector has shown increasing growth. Tourism Spending Continues to Increase: As the charts below show, visitor spending has been steadily increasing across all tourism-related sectors, culminating in a total increase of 3.6% from Since 2011, tourism-related spending has increased by $782M, or 14.2%. Tourism spending totaled nearly $6.3 billion in 2015, an all-time high. Page 5
6 Other indicators of tourism-related spending also increased in Compared to 2014, taxable gross accommodation receipts increased 4.4% yoy (year over year), gross receipts accommodation taxes grew 6.2%, and New Mexico Rocky Mountain Lodging Report Accommodation Total Receipts increased 7% Visitation Increased: Tourism Economics adds international visitation estimates to Longwoods International domestic visitation numbers as seen in the following charts and table, and the total number of visitors (overnight and day-trips) increased by 2.1%--or 700,000--to 34.04M for these combined visits. The majority of visitors to New Mexico were from domestic markets (98.1%) and traveled to New Mexico for leisure purposes alone (87.1%). Page 6
.")
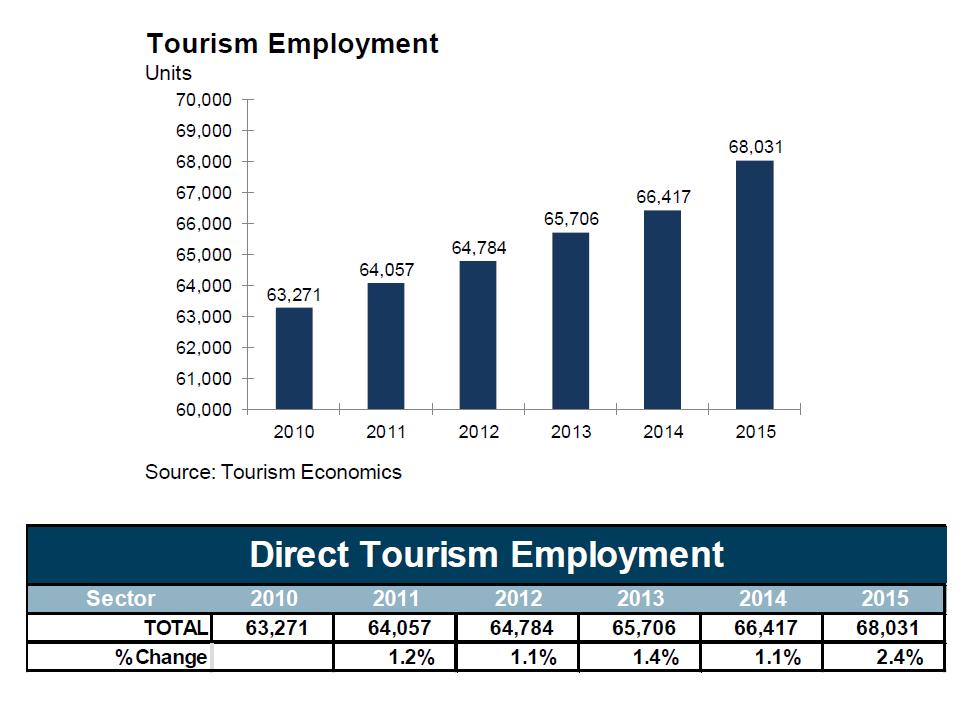
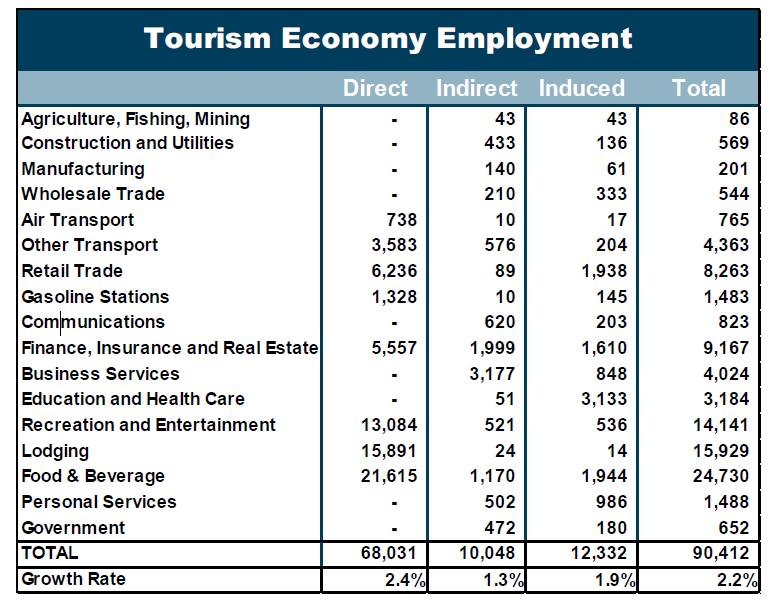
7 Tourism Jobs Continue to Grow: Tourism employment has been one of the best performing sectors in the New Mexico economy. As seen in the charts and tables on the following page, Tourism Economics data shows 6.2% growth in direct tourism employment since 2011 (or 3,974 additional jobs). Direct, Indirect and Induced employment totaled 90,412, or 8.3% of all jobs in New Mexico (up from 8.0% in 2011) refer to the 2011 and 2015 Economic Impact of Tourism reports, available at the research section. Important: Note that Tourism Economics analysis of employment provides a more precise and different accounting of tourism jobs than what NMTD has reported the past several years, in which we have reported Leisure and Hospitality employment numbers from the U.S. Bureau of Labor Statistics. Tourism Economics apportions tourism jobs in various job sectors or industries based on proportions that can be attributed to tourism activity as determined by research studies. So for example, on page 18 of the The Economic Impact of Tourism in New Mexico: 2014 Analysis, 51.9% of jobs in the Recreation employment sector are considered to be supported by visitor spending. In the Bureau of Labor Statistics Leisure and Hospitality category, 100% of recreation jobs are counted. This is true for other employment categories, and there are some sectors, such as retail, that are included in Tourism Economics Tourism job numbers but are not included in the Leisure and Hospitality sector. Therefore, NMTD gives preference to Tourism Economics employment data, although in the Economic Impact of Tourism in New Mexico section found later in this Annual report, we also report on Leisure and Hospitality employment for the sake of continuity with past reports. Page 7
8 Page 8
 between 2014 and 2015 (to $427.")

9 Personal Income Continues to Grow: Direct and Total tourism labor income stood at $1.575 and $2.427 billion in 2015, a 4.4% and 4.2% increase respectively, from Tourism-generated taxes increased: State taxes grew by 3.4% (or $14.2 million) between 2014 and 2015 (to $427.9 million) and Local taxes increased by 3.2% (or $6.3 million to $201 million). Visitor-driven state and local tax proceeds of $629 million helped offset the average household tax burden by $ per household. That is, visitors add tax value worth $ to every New Mexico household, up from $747 in 2011, an increase of 10.6%. Page 9
10 2015 Performance Commentary The 2015 Performance Commentary section presents a summary of the results for categories not already covered in the preceding section (Visitation, Spending, and Employment), focusing on New Mexico Brand Performance; NMTD Visitor Relationships; New Mexico Visitor Profile; and Visit Characteristics. Please refer to these sections, beginning on page 19 for more information. Overall, progress in meeting NMTD s objectives has been positive, exceptionally so in the case of some of the objectives. The following provides detailed information for each category: NEW MEXICO BRAND PERFORMANCE Objective #1: Increase the number of marketable overnight trips and total visitor numbers. Marketable trips are defined as travel that is influenced by marketing efforts and do not include visitors whose main purpose in taking a trip is to visit friends and family or for business trips. In 2011, based on an analysis of the visitation and spending patterns of New Mexico visitors, NMTD determined that increasing out-of-state marketable overnight trips would be key to driving economic impact. There were several reasons for developing this objective. First, while New Mexicans are the single largest group of visitors to New Mexico, out of state visitors spend much more per person in New Mexico than New Mexicans. Second, New Mexicans spend even less on in-state vacations than the average spend of in-state visitors in our competitive set of states (Arizona, Colorado and Utah). Finally, New Mexicans make up a much smaller percentage of total New Mexico visitors than in our competitive set of states, largely because New Mexico s population is much smaller. Therefore, New Mexico should be able to realize the largest spending lift by targeting out of state visitors, while at the same time encouraging in-state visitation. Note that the marketable data that follows is for domestic visitation only. In 2015, domestic marketable overnight visitation increased 3.3% and out of state visitation increased 2.6%. Marketable trips (trips other than visits to friends and family and business trips) are the focus of NMTD s advertising efforts, since, as the name indicates, they are trips that can be more readily influenced by advertising. The fact that marketable trips have increased over 45% since 2010 is quite remarkable, and a strong indicator that NMTD s True advertising is having an impact. An additional bonus of marketable trips is that people who take these trips spend more on food, lodging, and in all spending categories than the average visitor, thus bringing more money into New Mexico s economy. NMTD also currently has several initiatives to boost in-state visitation, such as New Mexico True Television, advertising targeted at New Mexico residents, and the regional ad program (which focuses on promoting fairs, festivals and events). Page 10
11 Objective: Improve perceptions of New Mexico as an attractive travel destination for both the national and in-state travel markets so they are more comparable to competitive set averages. Three measures (National Travel Intent, In-State Travel Intent, and the Repeat Visitation Rate), were selected in 2011 as indicators of key weaknesses in New Mexico s visitor market that NMTD has sought to improve (see page 20). New Mexico has lagged behind our competitive states in each of these measures: National Travel Intent (the % of respondents in the Longwoods Intl. national sample who intend to visit New Mexico and our competitive set of states in the next 12 months); In-State Travel Intent (the % of state residents who intend to take an overnight trip within their own state); and the Repeat Visitation Rate (the % of visitors who intend to return within the next 12 months to the state they previously visited and spent most of their time in). There was significant change in two of these three measures in 2015 from For New Mexico, there were increases in both In-State Travel Intent and the Repeat Visitation Rate and no change in National Travel Intent. Long term, both New Mexico (excepting 2015) and our competitive states have seen declines in in-state visitation and intent to return rates. These declines are believed to be related to an improving economy, which encourages more expensive, out of state trips. In 2015, the Repeat Visitation Rate rose in New Mexico, while it declined in our competitive states. NMTD VISITOR RELATIONSHIPS Objectives: #1: Grow active visitor relationships and interactions. #2: Increase awareness of New Mexico. NMTD s Social Media presence and YouTube views continued their solid growth in The department s Facebook PTAT and total reach have grown very rapidly as more department resources have been devoted to Facebook, with especially strong growth in The number of likes continues to grow strongly, increasing over 100% in 2015 and surpassing 157,000. Views of the department s YouTube page were 164% higher in 2015 compared to 2014, which had itself increased 111% over New Mexico True videos have been very well received by the public and have exposed many more people to NMTD produced videos. In addition, all New Mexico True TV episodes and segments are housed in NMTD for future use. These short video segments are well suited for use with other social media channels such as Facebook. Visits to all department websites decreased slightly in Site content and features have been continuously updated and expanded over the last year. A new website launch in early 2017 should generate growth moving forward. Referrals from newmexico.org to New Mexico business partner sites increased 66.3% in These referrals (an average of 516 every day in 2015) represent a significant source of leads for over 2,000 New Mexico businesses. Long-term trends show that requests for the traditional printed vacation guide have been in decline since 2001 as consumers increasingly turn to websites, user content generated travel websites (such as Tripadvisor.com), mobile devices and apps and social media for travel information. The department will continue to monitor vacation guide use and make adjustments accordingly. Despite the long-term decline in vacation guides, 2015 deviated from this trend, as requested mailed vacation guides increased 13.7%. Page 11
12 NMTD E-newsletters are sent each month highlighting upcoming events and specific New Mexico attractions. The number of E-newsletters sent increased 6% to million in The open rate averaged 17.1% in NEW MEXICO VISITOR PROFILE Objectives: #1: Increase the percentage of Primary Overnight visits and decrease the percentage of passthrough visits. #2: Broaden New Mexico s visitor market from a regional to a more national market by reducing the concentration of visitors from the top 5 states of origin. #3: Decrease the average age of visitors so that it aligns with our competitive set. #4: Grow the fly market as a percentage of total overnight visits. #5: Increase visitor Outdoor activity levels and maintain high Cultural activity levels. In 2015, New Mexico s and the Competitive set s average share of Primary overnight visitors changed slightly from 2014, showing a decrease in both NM and our competitive set of states. However, longer term (from 2010 to 2014), New Mexico gained on our Competitive set as the gap between New Mexico and our Competitive set of states narrowed significantly, from a 16.3 percentage point gap in 2010 to an 13.5 percentage point gap in The geographic diversity objective and measure was developed because in 2010, New Mexico had a greater geographic concentration of visitors and a smaller fly market than our competitive set. NMTD has since sought to broaden New Mexico s appeal to more markets. New Mexico s percent of visitor trips from its top five states of origin (New Mexico, Texas, Arizona, Colorado and California) stayed relatively stable in 2015 while the Competitive set average declined 2 points. New Mexico s geographic concentration (top 5 states) is now on par with our Competitive set of states, a very significant change in the last four years. The primary reason geographic diversity has increased is due to of an increase in fly market visitors. The average age of New Mexico s overnight visitors has declined since 2010, while the competitive set average age has changed little. In 2010 New Mexico s visitors were older than the U.S. and Competitive set average (especially for non-primary overnight visitors), however, since then the average age of New Mexico s visitors has been steadily declining, while the average age for our competitive set has been increasing. For overnight visitors, the average age visiting New Mexico has fallen from 48.1 in 2010 to 45.5 in The percentage of New Mexico primary overnight visitors who traveled by air reached declined slightly from an all time high in In 2010 and 2011, New Mexico was more reliant on the drive market than our competitive set. Since then, the percent of Primary overnight visitors who travelled by plane has increased to levels closer to our competitive set s average, and between 2010 and 2015, New Mexico s fly market has grown twice as fast as our competitive set. Analyses of fly market visitors show they spend about twice as much in nearly all spending categories as drive market visitors. Therefore, it is believed a more balanced fly/drive visit profile (more similar to our competitive set) benefits New Mexico. New Mexico s rich culture, combined with numerous opportunities for outdoor activities is a unique strength of New Mexico. The Outdoor and Cultural indexes are the cumulative totals of the Outdoor and Cultural activities primary overnight visitors to New Mexico and other states engage in during their 1 Primary visitors are overnight visitors who spent most of their time in that state. Page 12
13 trips. When New Mexico s scores were compared in 2010 to regional and national averages, New Mexico had high activity levels for Cultural activities, but lagged compared to our competitive set for Outdoor activities. (Note that only Primary overnight visitors were measured as non-primary overnight visitors spent most of their trip outside each respective state.) In 2015 the percentage of Primary overnight visitors who engaged in Outdoor activities decreased in New Mexico, our competitive set, and the U.S. in general. This indicates that New Mexico is susceptible to overall national trends in this regard. Despite the decrease in 2015, however, the long term trend demonstrates that visitor participation in New Mexico Outdoor activities have increased greatly since New Mexico has always led in participation in Cultural activities, and in 2015 was nearly 25 points higher than both the U.S. and our competitive set. VISIT CHARACTERISTICS (2 Objectives) Objectives: #1: Grow visitation to New Mexico s unique natural and cultural attractions. #2: Grow visitation to New Mexico s outdoor recreational attractions. There was a 2.6% decrease in passenger volume through the Albuquerque International Airport (Sunport) in 2015 over This continues a pattern of declining passenger volume since at least These declines have been attributed by Sunport spokesman to airlines cutting back flights at medium size non-hub airports like Albuquerque. The Albuquerque Sunport is attempting to ameliorate this trend by adding additional airlines, such as JetBlue Airways, which began service in April However, at the time of this report, 2016 saw the first increase in passenger volume at the Sunport since Additional detail about this increase will be included in the 2017 Annual Report. National Park visits were up 13.6% in 2015 compared to White Sands and Carlsbad have continue to gain market share, accounting for 55% of all visits to New Mexico s 13 National Parks and Monuments in 2014, compared to just 53.2% in Page 13
14 Overview of NMTD Research Findings: The following is a brief outline of seven key, foundational research findings for which the Tourism Department has multiple sources of supporting evidence. Please contact Victoria Gregg (Victoria.Gregg@state.nm.us) for more information about these findings. 1) Often, the American public either does not have a clear idea, or has misperceptions of what New Mexico has to offer and what it is like as a destination. There was a very high increase (lift) in favorable ratings for New Mexico s tourism & socioeconomic related attributes among those who were exposed to NM True advertising or who recently visited New Mexico (see charts on page 15). These results suggest unfamiliarity with New Mexico, and a highly favorable response when exposed to New Mexico s attributes. Supporting studies: 2011 multi-state focus groups, which demonstrated a lack of knowledge of and/or misperceptions of New Mexico among in-state and out of state participants 2011 & 2014 Longwoods International multi-state Image studies 2015 Longwoods International ROI study & Longwoods International multi-state Halo Effect study of out of state residents. 2) New Mexico has a higher overnight pass through rate and lower intent to return than our competitive set of states. From 2012 through 2015, New Mexico s pass through rate (pass-through overnight visitors are those who spent at least one night in a state, but indicated that the state was not their primary destination) has averaged 30% of all overnight visitors, while the C.S. average is 18%. New Mexico s intent to repeat an overnight trip within 12 months rate is around 40% compared to a 46% average for our Competitive set of states. There are several reasons for these disparities, including a lower visiting friends and family (VFR) rate for New Mexico (those who visit friends and family have a higher intent to return rate). However, it is also hypothesized that one of the more significant factors is related to the geographic distribution and lower quantity of New Mexico s tourist attractions. An analysis of the geographic distribution of TripAdvisor s things to do listings for New Mexico and our three competitive states (Arizona, Colorado and Utah), shows that the attractions in our competitive states are more widely distributed within each state as compared to New Mexico. 74% of New Mexico s things to do occur within the Albuquerque to Taos corridor (broadly defined), and this corridor coincides with where the majority of New Mexicans live. This geographic concentration of attractions and New Mexico residents likely suppresses in-state overnight trips, and favors day trips. The geographic concentration and overall number of New Mexico attractions also suggests out of state visitors would be less likely to return within 12 months, despite having highly favorable opinions of New Mexico (see #3 below). Supporting studies: 2010 through 2015 Longwoods TravelUSA data TripAdvisor 2015 analysis of of Things to do listings by state 3) Exposure to NM True advertising and/or visiting New Mexico greatly improves New Mexico s image, for both tourism related and socio-economic attributes. New Mexico does not have an image problem among out of state visitors who are exposed to what our state has to offer. Exposure to NM True advertising and/or visiting New Mexico is associated with much higher tourism and socioeconomic related attribute ratings. Supporting studies: The 2011 Longwoods International Image Study and the 2015 ROI study demonstrated a lift in Tourism related attributes for those who visited NM. Page 14
, in fact, NM s overall lift was higher than the 6 other states in the Longwoods study.")
15 The 2015 Longwoods International ROI study & Longwoods multi-state Halo Effect study of out of state residents showed that exposure to NM True advertising and visiting NM had a pronounced lift on opinions regarding six socioeconomic attributes (such as NM is a good place to live or start a business), in fact, NM s overall lift was higher than the 6 other states in the Longwoods study. Sample charts from the Longwoods International 2015 ROI study, demonstrating a strong lift in the % who strongly agree New Mexico exhibits the following attributes among those exposed to NM True advertising and among those who visited NM in the past year: Page 15
.")
16 4) Research has allowed NMTD to identify, and successfully target and attract Venturesome travelers, a highly desirable subgroup that is an excellent fit for what New Mexico has to offer (the Venturesome are defined as those who seek authentic, unusual & adventurous travel experiences, are opinion leaders, have higher than average household income & education and travel more frequently). Supporting studies: 2011 multi-state focus groups, 2011 TNS data analysis, & Besttripchoices.com state profiles (key sources that helped NMTD identify the Venturesome as NM s primary target) 2014 Longwoods International Advertising Effectiveness study (the Venturesome were found to be much more likely than the non-venturesome to have seen NM True advertising and say they intend to visit NM as a result of having seen NM True advertising) 2015 Longwoods International ROI study (the Venturesome were found to be much more likely than the non-venturesome to visit NM as a result of having seen NM True advertising) Sample chart from the Longwoods International 2015 ROI study, demonstrating increased awareness of NM True advertising among the Venturesome: 5) NM True advertising is working and Tourism in New Mexico is growing. Those exposed to NM True advertising are much more likely to subsequently visit New Mexico, in addition, multiple unique data sources show strong growth in the tourism industry. Page 16

17 Supporting studies: 2012 & 2015 Longwoods International ROI studies. In the 2015 study, every $1 invested in the New Mexico ad campaign in 5 targeted markets generated $72 in visitor spending and $7 in tax revenue for the benefit of New Mexico residents. In the 2012 ROI study (over a shorter period and with a smaller budget), the equivalent returns were $30 in visitor spending and $3 in tax revenue. In addition, multiple data sources show strong growth in tourism over time: % Annual Change CY2010 CY2011 CY2012 CY2013 CY2014 CY > 2015 All Domestic Visitors 1.0% 4.7% 2.6% 0.6% 1.6% 2.1% 12.1% Source: Longwood's International Travel USA dataset Accommodation sector taxable gross receipts 5.9% 2.3% 3.8% 4.9% 5.4% 6.3% 24.8% Source: NM tax & Revenue Dept. Accommodation sector gross receipts taxes 6.6% 4.2% 3.8% 5.7% 5.6% 41.3% 70.5% Source: NM tax & Revenue Dept. Hotel/Motel Lodging receipts (RMLR) 0.2% 0.4% 2.6% 5.8% 5.7% 7.0% 16.6% Source: Rocky Mountain Lodging Association Report Leisure & Hospitality jobs -0.6% 1.1% 1.8% 2.6% 2.5% 2.4% 8.4% Source: U.S. Bureau of Labor Statistics (seasonally adjusted) 6) More NM True advertising would result in more visitors. Supporting studies: Both the Longwoods International 2014 Advertising Effectiveness study and Longwoods International 2015 ROI study showed that the level of NM True advertising in our target markets is well below saturation levels, and so greater spending would result in significantly more trips to New Mexico. Sample chart from the 2015 ROI study: Page 17
18 7) Tourism is a major contributor to the growth of economic base jobs in New Mexico. Supporting studies: Tourism related economic base jobs are jobs that result from new money being brought into and spent in New Mexico by out of state visitors. Analysis of Longwoods TravelUSA data shows that in 2015, out of state visitors accounted for 84% of all tourism spending in New Mexico (overnight and day trip spending combined). Thus higher levels of tourism spending help grow New Mexico economic base jobs and are an important contributor to New Mexico s wealth creating exports. Page 18
19 NEW MEXICO BRAND PERFORMANCE Tourism Visits Objective: Increase the number of marketable visitors and total visitors numbers. Note that the data on this page is for domestic visitation only. Refer to pages 6 and 7 in this report for domestic and international visitation totals. This data is reported to maintain continuity with previous annual reports. In 2015, Longwoods International Travel USA data shows that total domestic visitation increased 2.1% over 2014 for a combined total of 33.4 million visits, while Tourism Economics 2015 data showed domestic and international visitation increased 1.9% to 34 million. Overnight domestic visitation increased by 1.3% and daytrip visitation increased by 2.8%. Domestic marketable overnight visitation increased 3.3% and out of state visitation also increased 2.6%. Marketable trips (trips other than visits to friends and family and business trips) are the focus of NMTD s advertising efforts, since, as the name indicates, they are trips that can be more readily influenced by advertising. The fact that marketable trips have increased over 45% since 2010 is quite remarkable, and a strong indicator that NMTD s True advertising is having an impact. An additional bonus of marketable trips is that people who take these trips spend more on food, lodging, and in all spending categories than the average visitor, thus bringing more money into New Mexico s economy. New Mexico s share of adult overnight marketable trips in the U.S. has changed little from 2011 to 2015, though Longwoods International has provided us with data showing New Mexico s overnight market share ranking has increased since 2012: th, th, th, rd, nd, th This market share rank increase has occurred because some states market share has declined during this period, so New Mexico, by maintaining its market share has moved up. New Mexico Total Person Visits* & U.S. Market Share (% market share of overnight & day trip visits) CY2010 CY2011 CY2012 CY2013 CY2014 CY2015 NM All Domestic Visitors Y/Y Change 1.0% 4.7% 2.6% 0.6% 1.6% 2.1% NM Overnight Visitors Y/Y Change -1.4% 5.8% 0.0% 0.7% 2.1% 1.3% NM Overnight Marketable Visitors Y/Y Change NA 11.0% 11.6% 11.2% 2.1% 3.8% NM Day Visitors Y/Y Change 3.2% 3.7% 4.8% 0.6% 1.1% 2.8% U.S. Share of Adult Overnight Marketable Trips NA 1.11% 1.15% 1.15% 1.12% 1.10% * In Millions Source: Longwoods International Travel USA 2010 through 2015 data sets and Tourism Economics 2015 data Interval of Measurement: Annual by Calendar Year Page 19
20 Intent to Travel National Travel Intent, In-State Travel Intent, Repeat Visitation Rate Objective: Improve perceptions of New Mexico as an attractive travel destination for both the national and instate travel markets so that it is more in line with competitive set averages. In two of the three measures, there was considerable positive change for New Mexico in 2015 compared to While National Travel Intent remained the same for New Mexico, our competitive set saw a slight decline. Both In-State Travel Intent and Repeat Visitation Rate saw a significant increase in Of note, the Repeat Visitation Rate climbed by nearly 30% from 2014 to 2015, while the same metric decreased slightly in the competitive set. Percent of Respondents in the Longwoods Intl. National Sample Intending to Visit New Mexico or Competitive Set* states in the next 12 months CY2011 CY2012 CY2013 CY2014 CY2015 New Mexico 1.9% 1.7% 1.9% 1.9% 1.9% National Travel Intent Competitive Set Average* 4.2% 4.1% 4.5% 4.7% 4.4% Percent of State Residents Intending to Take an Overnight Trip within their Own State CY2011 CY2012 CY2013 CY2014 CY2015 New Mexicans 27.7% 24.8% 26.9% 26.3% 30.6% In-State Travel Intent Competitive Set Average* 33.1% 32.3% 29.6% 29.9% 31.8% Percent of Visitors Intending to Return to the State They Previously Visited and Spent Most of their Time In CY2011 CY2012 CY2013 CY2014 CY2015 New Mexico 39.2% 29.8% 30.4% 29.8% 38.4% Repeat Visitation Rate Competitive Set Average* 51.2% 47.8% 45.2% 47.4% 46.4% *The competitive set average is the weighted average of scores for Arizona, Colorado & Utah Source: Longwoods International Travel USA 2010 through 2015 data sets Interval of Measurement: Annual by Calendar Year Page 20

21 ECONOMIC IMPACT OF TOURISM IN NEW MEXICO Objective: Make tourism the economic growth engine for New Mexico. New Mexico Leisure and Hospitality Employment Objective: Increase tourism related employment. The U.S. Bureau of Labor Statistics Leisure and Hospitality sector is an indicator of tourism-related employment, although not as precise as the tourism employment numbers in Tourism Economics 2015 Economic Impact study, as it omits indirect and induced employment (see pages 7 & 8 of this report). Leisure and Hospitality Employment began growing in New Mexico in 2011 and has continued to grow steadily in 2015 and the first three quarters of L&H employment grew 2.8%, in 2015 which represented an additional 2,567 jobs over Another 3,100 jobs (3.3% yoy growth) were added in the first 6 months of 2016, over the first 6 months of 2015 (averaged over the two quarters). Note that in the interest of reporting continuity, L&H employment numbers are reported, however, more comprehensive information about employment, visitor spending and tourism tax revenue can be found in the 2014 Economic Impact of Tourism in New Mexico, available for download under the Research section at New Mexico Leisure and Hospitality Employment (in thousands) 2014Q1 2014Q2 2014Q3 2014Q4 2015Q1 2015Q2 2015Q3 2015Q4 2016Q1 2016Q2 CY2010 CY2011 CY2012 CY2013 CY2014 CY2015 Number of Jobs Y/Y # Change 2,333 2,700 2,333 1,600 1,833 2,700 2,700 4,000 3,400 2, ,550 2,258 2,242 2,567 Y/Y % Change 2.7% 3.1% 2.6% 1.8% 2.0% 3.0% 2.9% 4.4% 3.7% 3.0% -0.6% 1.1% 1.8% 2.6% 2.5% 2.8% Source: U.S. Bureau of Labor Statistics - seasonally adjusted job #s Source: U.S. Bureau of Labor Statistics Interval of Measurement: Quarterly Page 21

22 New Mexico Hotel & Motel Total Receipts Objective: Increase lodging revenue. In 2015, accommodation total receipts increased 7%, even though the average room rate fell slightly (-0.5%) to $ from The first two quarters of 2016 continued to show growth in total receipts, as they increased 9.4% over the first half of Lodging Receipts (No. of occupied rooms * Average Room Rate) 2014Q3 2014Q4 2015Q1 2015Q2 2015Q3 2015Q4 2016Q1 2016Q2 CY2012 CY2013 CY2014 CY2015 Total Receipts* $103.5 $81.3 $71.1 $91.4 $111.5 $91.4 $76.9 $101.0 $305.5 $323.2 $324.2 $365.4 Y/Y Change 6.1% 6.0% 6.2% 1.7% 7.7% 12.5% 8.2% 10.6% 2.6% 5.8% 5.7% 7.0% * in millions $ *Total Receipts = (Number of occupied rooms * Average Room Rate) Source: Rocky Mountain Lodging Report Interval of Measurement: Quarterly Page 22

23 NM Gross Receipts Accommodation Taxes & Food, Drink and Accommodation Gross Receipts Objective: Increase tourism related tax revenue. New Mexico gross receipts accommodation taxes increased by 7.1% during calendar year 2015, continuing the steady increases seen since Total taxable receipts for food & drink and accommodations also continued to grow in 2015, increasing 6.3% over Gross Receipts Accommodation Taxes and Total New Mexico Food & Drink and Accommodation Taxable Gross Receipts (in millions $) 2013Q2 2013Q3 2013Q4 2014Q1 2014Q2 2014Q3 2014Q4 CY2011 CY2012 CY2013 CY2015 Gross Receipts Accommodat $ $ $ $ $ $ $ $ $ $ $ Y/Y Change 1.5% 3.3% 19.0% 5.4% 3.5% 13.0% -0.5% 3.8% 5.7% 5.6% 7.1% Total Receipts $ $ $ $ $ $1, $ $3, $3, $3, $4, Y/Y Change 1.6% 6.0% 8.0% 2.7% 5.0% 3.9% 6.8% 3.2% 4.4% 4.6% 6.3% Food & Drink Receipts* $ $ $ $ $ $ $ $2, $2, $2, $3, Y/Y Change 1.7% 7.0% 4.9% 1.8% 5.4% 1.4% 9.1% 3.1% 4.2% 4.4% 6.3% Accommodation Receipts* $ $ $ $ $ $ $ $ $ $ $ Y/Y Change 0.9% 2.7% 19.0% 6.4% 3.4% 12.2% -1.0% 3.8% 4.9% 5.4% 6.3% WITHOUT Medical Source: BBER & New Mexico Tax & Revenue Department Interval of Measurement: Quarterly Page 23
24 NMTD VISITOR RELATIONSHIPS Social Media Presence Objective: Grow active visitor relationships and interactions. Measurement of the department s Facebook activities began in the 3 rd quarter of calendar year 2010, but over time, NMTD s Facebook metrics have changed in response to changes Facebook has made in the available measures. For example, new measures: PTAT or People Talking About This and Weekly Reach were introduced in August, PTAT is a comprehensive engagement metric that measures the overall health of a Facebook brand Page. It analyzes the conversation happening around a Page across Facebook and provides a numerical score. It includes activities such as liking a page; commenting on, or sharing a page post, answering a question, responding to an event, mentioning a page and tagging a photo. Weekly total reach is a measure of the awareness of NMTD s Facebook content. This is the number of people who have been exposed to any content associated with NMTD s Facebook presence over a 7 day period. The department s PTAT and total reach continue recent trends and have grown very rapidly as more department resources have been devoted to Facebook, with especially strong growth in CY2015. The number of Facebook fans continues to grow strongly, increasing 100.9% in 2015 and surpassing 175,000 by the end of New Mexico Department of Tourism Facebook Statistics 2014Q1 2014Q2 2014Q3 2014Q4 2015Q1 2015Q2 2015Q3 2015Q4 CY2012 CY2013 CY2014 CY2015 # of fans of NMTD facebook site (quarterly/avg) 66,010 73,072 83,337 91, , , , ,148 41,531 52,809 78, ,638 Y/Y Change 35.4% 42.7% 56.9% 57.3% 84.6% 116.8% 106.6% 94.8% 18.3% 27.2% 48.6% 100.9% NMTD Facebook PTAT (weekly/ave) 5,731 4,968 8,212 12,328 13,136 13,788 16,230 31,350 4,344 4,195 7,810 18,626 Y/Y Change 18% 82% 118% 127% 129% 178% 98% 154% NA -3.4% 86.2% 138.5% NMTD Total Reach (weekly/ave) 135, , , , , , , ,818 77,765 80, , ,043 Y/Y Change 94% 61% 85% 122% 142% 415% 191% 69% NA 3.3% 96.2% 165.3% Source: Facebook Insights Interval of Measurement: Quarterly by Calendar Year YouTube Views Objective: Increase awareness of New Mexico. Views of the department s YouTube page were 164.1% higher in 2015 compared to 2014, which was up 111% from Views nearly tripled, from 357,371 to 943,823 in This is substantial evidence that New Mexico True videos have been very well received by the public and have exposed many more people to NMTD produced videos. In addition, all New Mexico True TV episodes and segments are housed in NMTD for future use. These short video segments are well suited for use with other social media channels such as Facebook. YouTube: # of Views of NMTD Videos 2014Q1 2014Q2 2014Q3 2014Q4 2015Q1 2015Q2 2015Q Q4 CY 2012 CY 2013 CY 2014 CY 2015 # of views 18, ,385 86,104 90, , ,895 9, , , , , ,823 Y/Y Change 261.7% 111.6% 171.2% 22.1% 78.1% 514.4% -89.0% 51.0% 24.5% 36.5% 111.0% 164.1% Source: YouTube Interval of Measurement: Quarterly by Calendar Year Page 24
25 Website Interaction Objective: Grow visitor relationships and increase awareness of New Mexico. Visits* to all department websites decreased 12.3% in However, visits to all department websites still demonstrate growth from 2012, where it has increased 61.28%. Department Website Data & Statistics 2014Q1 2014Q2 2014Q3 2014Q4 2015Q1 2015Q2 2015Q3 2015Q4 CY 2012 CY 2013 CY 2014 CY 2015 Newmexico.org Visits 156, , , , , , , , , , , ,738 Y/Y Growth -10.8% 10.5% -13.8% 117.2% 72.4% -27.9% -16.4% -54.6% -28.8% 49.0% 17.5% -16.2% Pages per visit Y/Y Growth -24.4% -22.1% -24.1% -18.5% -9.4% -5.5% -16.9% -11.0% -10.3% 4.0% -22.5% -10.7% Ave time on site (minutes) Y/Y Growth -29.5% -30.0% -31.4% -5.9% -1.8% -6.3% -19.5% -25.7% 2.9% 33.5% -25.8% -15.3% Visits to all Department websites 234, , , , , , , , , ,286 1,159,155 1,016,452 Y/Y Growth 14.0% 27.8% -11.0% 73.7% 46.1% -24.3% -8.5% -42.7% -22.6% 49.2% 23.3% -12.3% *A new metric for website visits (the number of visits over 10 seconds) has been used by NMTD since February This metric more accurately measures both web visits and bounce rates. We have reported raw web visits for some time; however, NMTD now report visits that last more than 10 seconds. This is considered to be a more accurate measure of both bounce rates and visits since web visits that last 10 seconds or less are of poor information dissemination value. There are also issues with the conventional bounce rate metric that the greater than 10 second visitation metric addresses (see Source: Google Analytics Interval of Measurement: Quarterly by Calendar Year Referrals from NewMexico.org to Industry Partners Objective: Grow visitor relationships and increase awareness of New Mexico. Referrals from newmexico.org to New Mexico business partner sites increased 66.3% in These referrals (an average of each day in 2015) represent a significant source of leads for many businesses in New Mexico. Referrals from NewMexico.org to Industry Partners 2014Q2 2014Q3 2014Q4 2015Q1 2015Q2 2015Q3 2015Q4 CY 2012 CY2013 CY2014 CY2015 # of Referrals 23,413 33,787 35,086 49,297 54,813 49,677 34,730 15,761 92, , ,517 Y/Y Growth -15.0% 66.4% 99.6% 134.2% 134.1% 47.0% -1.0% 486.4% 22.6% 66.3% Source: Google Analytics Interval of Measurement: Quarterly by Calendar Year Page 25
26 Vacation Guides Objective: Increase awareness of New Mexico. Requests for the traditional printed vacation guide have been in decline since 2001 as consumers increasingly turn to websites, user content generated travel websites (such as Tripadvisor.com), mobile apps and social media for travel information. However, requests for mailed vacation guides saw a significant increase in 2015 over 2014, climbing 13.7%. Mailed Vacation Guides 2014Q1 2014Q2 2014Q3 2014Q4 2015Q1 2015Q2 2015Q3 2015Q4 CY 2012 CY 2013 CY 2014 CY2015 Requested Mailed Vacation Guides 10,272 12,944 8,681 6,288 12,968 10,734 9,369 10,350 52,225 52,469 38,185 43,421 Y/Y Change -59.0% 2.4% -1.9% 6.6% 26.2% -17.1% 7.9% 64.6% -25.9% 0.5% -27.2% 13.7% Sources: Adelante Mailing Services (for data on mailed guides). Interval of Measurement: Quarterly by Calendar Year E-newsletter Performance Objective: Grow visitor interactions and disseminate information. NMTD E-newsletters are sent each month highlighting upcoming events and specific New Mexico attractions. The number of E-newsletters sent increased 6% to million in The open rate averaged 17.1% in 2015, an improvement of 7.6% over E-newsletters Sent & Open Rate 2014Q1 2014Q2 2014Q3 2014Q4 2015Q1 2015Q2 2015Q3 2015Q4 CY 2012 CY 2013 CY 2014 CY 2015 # of e-newsletters sent 358, , , , , , , ,029 1,517,467 1,438,767 1,466,543 1,554,466 Y/Y Change -2.8% 1.2% 4.4% 1.2% 4.4% 5.3% 6.5% 11.3% 22.6% -5.2% 1.9% 6.0% % e-newsletter open rate (average) 18.3% 14.7% 13.9% 14.7% 13.9% 16.7% 17.3% 15.9% 18.6% 16.3% 15.9% 17.1% Y/Y Change 2.0% -13.2% -7.8% -13.2% -7.8% -1.4% 24.8% 8.1% 6.4% -12.6% -2.2% 7.6% Source: Mailchimp Interval of Measurement: Quarterly by Calendar Year Page 26
27 NEW MEXICO VISITOR PROFILE Percent Primary Overnight Visitor Trips Objective: Increase the percentage of Primary Overnight visits and decrease the percentage of passthrough visits. New Mexico and the Competitive set s average share of Primary overnight visitors declined slightly from 2014, and both years showed a small decrease from 2011 and 2012, as did our competitive set of states. However, longer term (from 2010 to 2015), the gap between New Mexico and our Competitive set of states narrowed significantly, from a 16.3 percentage point gap in 2010 to a 13.5 percentage point gap in The trend for both New Mexico and the competitive set has been to decrease in percent of primary overnight visitor share since % of Primary* Overnight Visitors CY2010 CY2011 CY2012 CY2013 CY2014 CY2015 New Mexico 68.0% 72.0% 70.7% 70.3% 70.2% 67.2% Competitive Set Average** 84.3% 83.9% 82.7% 82.6% 82.1% 80.7% *Primary visitors are overnight visitors who spent most of their time in that state **Competitive set it weighted average of Arizona, Colorado, and Utah Regional Concentration of Visitor Trips Objective: Broaden New Mexico s visitor market from a regional to a more national market by reducing the concentration of visitors from the top 5 states of origin. New Mexico s percent of visitor trips from the top five states of origin (New Mexico, Texas, Arizona, Colorado and California) stayed fairly consistent from 2014 while the Competitive set average declined 2.1 points. New Mexico s geographic concentration (top 5 states) is now on par with our Competitive set of states, a very significant change in the last four years. This measure was introduced in 2011 because New Mexico s narrower geographic concentration of visitors and smaller fly market created dependence on a geographically limited group of visitors. The primary reason geographic diversity has increased is believed to be due to an increase in fly market visitors (as seen on page 28). More fly market visitors are desirable as they spend nearly twice as much in all spending categories (even accounting for higher transportation costs) as non-fly market visitors. % of Primary* Overnight Visitors from Top 5 States CY2010 CY2011 CY2012 CY2013 CY2014 CY2015 New Mexico 78.2% 77.3% 68.0% 65.5% 62.6% 62.9% Competitive Set Average** 67.8% 66.9% 66.9% 65.5% 64.5% 62.4% *Primary visitors are overnight visitors who spent most of their time in that state **Competitive set it weighted average of Arizona, Colorado, and Utah For the two tables on this page: Source: Longwoods International Travel USA 2010 through 2015 data sets Interval of Measurement: Annual by Calendar Year Page 27
28 Average Age of Visitors Objective: Decrease the average age of visitors so that it aligns with our competitive set. The average age of New Mexico s overnight visitors has declined since 2010 while the competitive set average age has changed little. In 2010 New Mexico s visitors were older than the U.S. and Competitive set average (for non-primary overnight visitors), however, since then the average age of New Mexico s visitors has declined to below the U.S. and Competitive set averages, a significant and positive shift in New Mexico s overnight visitor profile. It is worth noting that, for all overnight visitors, average age has been increasing steadily for the U.S. and competitive set since Primary Overnight Visitors* All Overnight Visitors Average Age of Overnight Visitors CY2010 CY2011 CY2012 CY2013 CY2014 CY2015 New Mexico Competitive Set** New Mexico Competitive Set** U.S * Primary visitors are overnight visitors who spent most of their time in that state. There is no U.S. equivalent. ** Competitive Set is the weighted average of Arizona, Colorado, Utah. Fly Market Objective: Grow the fly market as a percent of total visits. The percentage of New Mexico primary overnight visitors who traveled by air declined slightly from an all-time high of 23.9% in 2014 to 21.9% in New Mexico was more reliant on the drive market than our competitive set in 2010 and Since then, the percent of Primary overnight visitors who travelled by plane increased to levels closer to our competitive set s average, and between 2010 and 2015, New Mexico s fly market has grown twice as fast as our competitive set. Analyses of fly market visitors show they spend about twice as much in nearly all spending categories as drive market visitors. Therefore, it is believed a more balanced fly/drive visit profile (more similar to our competitive set) would benefit New Mexico. Traveled by Air - Percent of Primary Overnight Visits CY2010 CY2011 CY2012 CY2013 CY2014 CY2015 New Mexico 14.9% 16.7% 22.4% 20.7% 23.9% 21.9% Competitive set weighted average* 23.8% 23.7% 24.9% 27.3% 30.3% 29.4% * Competitive set is Arizona, Colorado, Utah Source for both tables on this page: Longwoods International Travel USA 2010 through 2015 data sets Interval of Measurement: Annual by Calendar Year Page 28
29 Outdoor & Cultural Activity Indexes Objective: Increase visitor Outdoor activity levels and maintain high Cultural activity levels. New Mexico s rich culture, combined with numerous opportunities for outdoor activities is a unique strength of New Mexico. These indexes are the cumulative totals of the Outdoor and Cultural activities Primary overnight visitors engaged in during their trips. When New Mexico s scores were compared in 2010 to regional and national averages, New Mexico had high activity levels for Cultural activities, but lagged compared to our competitive set for Outdoor activities. (Note that only Primary overnight visitors were measured as nonprimary overnight visitors spent most of their trip outside each respective state.) For 2015, the percentage of Primary overnight visitors who engaged in Outdoor activities decreased across New Mexico, our competitive set, and the U.S. as a whole. Visitor participation in New Mexico Outdoor activities have increased greatly since 2010, even with the decrease in New Mexico has always led in participation in Cultural activities, but in 2015 fell from an all-time high of 90 to a still-significant score of 75.1, well above the Competitive set or U.S. averages. Outdoor Activities Index* Cultural Activities Index** Outdoor and Cultural Activity Indexes (for primary overnight visitors) CY2010 CY2011 CY2012 CY2013 CY2014 CY2015 New Mexico Competitive Set U.S New Mexico Competitive Set U.S *The Outdoor Activities Index is the cumulative total of the % of Primary overnight visitors who engaged in Hiking/backpacking, Camping, Fishing, Mountain Climbing, Golf, Skiing/snowboarding, Hunting, Biking or Rafting. **The Cultural Activities Index is the cumulative total of the % of Primary overnight visitors who attended either a Museum, Landmark/historic site, Art gallery, Winery, Theater, Fair/exhibition/festival, Rock/pop concert, Symphony, Opera or Rodeo. Source: Longwoods International Travel USA 2010 through 2015 data sets Interval of Measurement: Annual by Calendar Year Page 29

30 VISIT CHARACTERISTICS Airport Passenger Volume Albuquerque International Airport There was a 2.6% decrease in passenger volume through the Albuquerque International Airport in 2015 from This continues a pattern of declining passenger volume since at least These declines have been attributed by SunPort spokesman to airlines cutting back flights at medium size non-hub airports like Albuquerque. The Albuquerque SunPort is attempting to ameliorate this trend by adding additional airlines, such as JetBlue Airways, which began service in April Albuquerque International Airport Total Enplaned & Deplaned (in millions) 2014Q1 2014Q2 2014Q3 2014Q4 2015Q1 2015Q2 2015Q3 2015Q4 CY2012 CY2013 CY2014 CY2015 ABQ Rider Count Y/Y Change -4.6% -3.5% -2.0% -5.0% -6.5% -5.0% -2.9% 5.8% -5.4% -6.1% -3.7% -2.6% Source: City of Albuquerque Website, Airport Fact and Figures, Interval of Measurement: Quarterly Page 30
New Mexico Tourism Department 2014 Annual Report
 New Mexico Tourism Department 2014 Annual Report September 2014 James Orr New Mexico Tourism Department Research Director INTRODUCTION The purpose of the New Mexico Tourism Department s Annual Report is
New Mexico Tourism Department Quarterly Report
 New Mexico Tourism Department Quarterly Report Issue # 2012-3 July 2012 James Orr New Mexico Tourism Department Research Coordinator INTRODUCTION The purpose of the New Mexico Tourism Department s Quarterly
The Economic Impact of Tourism in Hillsborough County. July 2017
 The Economic Impact of Tourism in Hillsborough County July 2017 Table of contents 1) Key Findings for 2016 3 2) Local Tourism Trends 7 3) Trends in Visits and Spending 12 4) The Domestic Market 19 5) The
The Economic Impact of Tourism in Hillsborough County, June 2018
 The Economic Impact of Tourism in Hillsborough County, 2017 June 2018 Table of contents 1) Key Findings for 2017 3 2) Local Tourism Trends 7 3) Trends in Visits and Spending 12 4) The Domestic Market 19
Economic Impact of Tourism in Hillsborough County September 2016
 Economic Impact of Tourism in Hillsborough County - 2015 September 2016 Key findings for 2015 Almost 22 million people visited Hillsborough County in 2015. Visits to Hillsborough County increased 4.5%
The Economic Impact of Tourism in Buncombe County, North Carolina
 The Economic Impact of Tourism in Buncombe County, North Carolina 2017 Analysis September 2018 Introduction and definitions This study measures the economic impact of tourism in Buncombe County, North
Greene County Tourism Economic Impact Analysis and Strategic Goals
 Greene County Tourism Economic Impact Analysis and Strategic Goals Summary of Findings and Recommendations October 2010 Prepared by: Tourism Economics 121, St Aldates, Oxford, OX1 1HB UK 303 W Lancaster
Oregon 2011 Visitor Final Report
 Oregon 0 Visitor Final Report Table of Contents Introduction...... 3 Methodology.. U.S. Travel Market Size & Structure..... 5 Oregon Travel Market Size & Structure... Overnight Trip Detail............
NAPA VALLEY VISITOR INDUSTRY 2014 Economic Impact Report
 NAPA VALLEY VISITOR INDUSTRY 2014 Economic Impact Report Research prepared for Visit Napa Valley by Destination Analysts, Inc. Table of Contents SECTION 1 Introduction 2 SECTION 2 Executive Summary 5 SECTION
The Economic Impact of Tourism in Walworth County, Wisconsin. July 2013
 The Economic Impact of Tourism in Walworth County, Wisconsin July 2013 Key themes for 2012 The Walworth County, Wisconsin visitor economy continued its brisk growth in 2012. Visitor spending rose 11% after
NAPA VALLEY VISITOR INDUSTRY 2012 Economic Impact Report
 Join Visit Napa Valley NAPA VALLEY VISITOR INDUSTRY 2012 Economic Impact Report Research prepared for Visit Napa Valley by Destination Analysts, Inc. Table of Contents SECTION 1 Introduction 2 SECTION
Oregon 2009 Visitor Report June, 2010
 Oregon 2009 Visitor Report June, 200 Table of Contents Introduction...... 3 Methodology.. 4 U.S. Travel Market Size & Structure.. 5 Oregon s Travel Market Size & Structure...... Overnight Trip Detail............
NAPA VALLEY VISITOR INDUSTRY 2016 Economic Impact Report
 NAPA VALLEY VISITOR INDUSTRY 2016 Economic Impact Report Research prepared for Visit Napa Valley by Destination Analysts, Inc. Table of Contents S E C T I O N 1 Introduction 2 S E C T I O N 2 Executive
The Economic Impact of Tourism in North Carolina. Tourism Satellite Account Calendar Year 2015
 The Economic Impact of Tourism in North Carolina Tourism Satellite Account Calendar Year 2015 Key results 2 Total tourism demand tallied $28.3 billion in 2015, expanding 3.6%. This marks another new high
2015 SAN DIEGO VISITOR PROFILE
 2015 SAN DIEGO VISITOR PROFILE (UPDATED SEPTEMBER 2016) SAN DIEGO VISITOR PROFILE 6 THE SAN DIEGO VISITOR INDUSTRY In San Diego, the visitor industry is the second largest traded economy behind the research
LOCAL AREA TOURISM IMPACT MODEL. Wandsworth borough report
 LOCAL AREA TOURISM IMPACT MODEL Wandsworth borough report London Development Agency May 2008 CONTENTS 1. Introduction... 3 2. Tourism in London and the UK: recent trends... 4 3. The LATI model: a brief
TOURISM AS AN ECONOMIC ENGINE FOR GREATER PHILADELPHIA
 TOURISM AS AN ECONOMIC ENGINE FOR GREATER PHILADELPHIA 2015 Visitation and Economic Impact Report FINAL REPORT SUBMITTED TO: VISIT PHILADELPHIA 30 S. 17 th St, Suite 2010 Philadelphia, PA 19103 FINAL REPORT
The Economic Impact of Tourism in Jacksonville, FL. June 2016
 The Economic Impact of Tourism in Jacksonville, FL June 2016 Highlights Visitor spending surpassed $2.0 billion in 2015, growing 4.4%. As this money flowed through Duval County, the $2.0 billion in visitor
The Economic Impact of Tourism in Maryland. Tourism Satellite Account Calendar Year 2015
 The Economic Impact of Tourism in Maryland Tourism Satellite Account Calendar Year 2015 MD tourism economy reaches new peaks The Maryland visitor economy continued to grow in 2015; tourism industry sales
The Economic Impact of Tourism on Galveston Island, Texas Analysis
 The Economic Impact of Tourism on Galveston Island, Texas 2012 Analysis Headline Results Headline results Tourism is a significant contributor to business sales, employment, and taxes on Galveston Island.
The Economic Impact of Tourism in North Carolina. Tourism Satellite Account Calendar Year 2013
 The Economic Impact of Tourism in North Carolina Tourism Satellite Account Calendar Year 2013 Key results 2 Total tourism demand tallied $26 billion in 2013, expanding 3.9%. This marks another new high
The Economic Impact of Travel in Kansas. Tourism Satellite Account Calendar Year 2013
 The Economic Impact of Travel in Kansas Tourism Satellite Account Calendar Year 2013 Who we are Tourism Economics Union of industry expertise and economic disciplines Real world insights based on quantitative
The Economic Impact of Tourism on Calderdale Prepared by: Tourism South East Research Unit 40 Chamberlayne Road Eastleigh Hampshire SO50 5JH
 The Economic Impact of Tourism on Calderdale 2015 Prepared by: Tourism South East Research Unit 40 Chamberlayne Road Eastleigh Hampshire SO50 5JH CONTENTS 1. Summary of Results 1 2. Table of Results Table
The Economic Impact of Tourism on Galveston Island, Texas
 The Economic Impact of Tourism on Galveston Island, Texas 2017 Analysis Prepared for: Headline Results Headline results Tourism is an integral part of the Galveston Island economy and continues to be a
The Travel and Tourism Industry in Vermont. A Benchmark Study of the Economic Impact of Visitor Expenditures on the Vermont Economy 2005
 The Travel and Tourism Industry in Vermont A Benchmark Study of the Economic Impact of Visitor Expenditures on the Vermont Economy 2005 INTRODUCTION GENERAL November, 2006 This 2005 update of the original
Economic Impact of Tourism in South Dakota, December 2018
 Economic Impact of Tourism in South Dakota, 2018 December 2018 1) Key Findings Growth rebounds in 2018 as a strong hunting season drives tourism growth Key facts about South Dakota s tourism sector Key
Economic Impact of Tourism in South Dakota, December 2017
 Economic Impact of Tourism in South Dakota, 2017 December 2017 1) Key findings 1) Growth continues in 2017 but pales against the event driven years of 2015 and 2016 in South Dakota Key facts about South
The Economic Impact of Tourism Brighton & Hove Prepared by: Tourism South East Research Unit 40 Chamberlayne Road Eastleigh Hampshire SO50 5JH
 The Economic Impact of Tourism Brighton & Hove 2013 Prepared by: Tourism South East Research Unit 40 Chamberlayne Road Eastleigh Hampshire SO50 5JH CONTENTS 1. Summary of Results 1 1.1 Introduction 1 1.2
2014 West Virginia Image & Advertising Accountability Research
 2014 West Virginia Image & Advertising Accountability Research November 2014 Table of Contents Introduction....... 3 Purpose... 4 Methodology.. 5 Executive Summary...... 7 Conclusions and Recommendations.....
The Economic Impact of Tourism in: Dane County & Madison, Wisconsin. April 2017
 The Economic Impact of Tourism in: Dane County & Madison, Wisconsin April 2017 Key themes for 2016 Visitor spending continued growing in Dane County, Wisconsin in 2016, growing 5.2% to surpass $1.2 billion.
Oregon 2013 Regional Visitor Report The Southern Region
 Oregon 01 Regional Visitor Report The Southern Region Introduction Longwoods International began tracking American travelers in 1985, and has conducted large-scale syndicated visitor research quarterly
Oregon 2013 Visitor Report
 Oregon 0 Visitor Report Table of Contents Introduction...... Methodology.. 4 U.S. Travel Market Size & Structure..... 5 Oregon Travel Market Size & Structure... 9 Overnight Trip Detail............ 7 Overnight
The Economic Impact of Tourism Brighton & Hove Prepared by: Tourism South East Research Unit 40 Chamberlayne Road Eastleigh Hampshire SO50 5JH
 The Economic Impact of Tourism Brighton & Hove 2014 Prepared by: Tourism South East Research Unit 40 Chamberlayne Road Eastleigh Hampshire SO50 5JH CONTENTS 1. Summary of Results 1 1.1 Introduction 1 1.2
VALUE OF TOURISM. Trends from
 VALUE OF TOURISM Trends from 2005-2015 March 2017 TABLE OF CONTENTS 1. Overview... 2 Key highlights in 2015... 2 2. Contributions to the economy... 4 TOURISM REVENUE... 5 Total revenue... 5 Tourism revenue
IATA ECONOMICS BRIEFING AIRLINE BUSINESS CONFIDENCE INDEX OCTOBER 2010 SURVEY
 IATA ECONOMICS BRIEFING AIRLINE BUSINESS CONFIDENCE INDEX OCTOBER SURVEY KEY POINTS Results from IATA s quarterly survey conducted in October show business conditions continued to improve during the third
48 Oct-15. Nov-15. Travel is expected to grow over the coming 6 months; at a slower rate
 Analysis provided by TRAVEL TRENDS INDE OCTOBER 2016 CTI shows travel grew in October 2016. LTI predicts easing travel growth through the first four months of 2017, with some momentum sustained by domestic
Tourism Satellite Account Calendar Year 2010
 The Economic Impact of Tourism in Georgia Tourism Satellite Account Calendar Year 2010 Highlights The Georgia visitor economy rebounded in 2010, recovering 98% of the losses experienced during the recession
The Economic Impact of Tourism in Maryland. Tourism Satellite Account Calendar Year 2016
 The Economic Impact of Tourism in Maryland Tourism Satellite Account Calendar Year 2016 County Results Washington County, Visitors Washington County Visitors (thousands) Year Overnight Day Total Growth
Cedar Rapids Area Convention and Visitors Bureau Visitor Study
 Cedar Rapids Area Convention and Visitors Bureau Visitor Study 2003-2004 University of Northern Iowa Sustainable Tourism & The Environment Program www.uni.edu/step Project Directors: Sam Lankford, Ph.D.
Tourism Satellite Account Calendar Year 2016
 Tourism Satellite Account Calendar Year 2016 Key Definitions 1. Tourism/Tourist: Refers to the leisure travel/traveler segment. 2. Travel/Traveler: Includes both leisure and business travel/travelers.
The Travel & Tourism Industry in Vermont
 The Travel & Tourism Industry in Vermont A Benchmark Study of the Economic Impact of Visitor Expenditures on the Vermont Economy 2003 Prepared by: Introduction In 2003 Establishing clear and useful performance
The Economic Impact of Tourism on Scarborough District 2014
 The Economic Impact of Tourism on Scarborough District 2014 Prepared by: Tourism South East Research Unit 40 Chamberlayne Road Eastleigh Hampshire SO50 5JH CONTENTS 1. Summary of Results 1 2. Table of
West Virginia 2013 Visitor Report
 West Virginia 013 Visitor Report Table of Contents Introduction...... 3 Research Objectives 4 Research Method. 5 Travel Market Size & Structure.... Overnight Expenditures.. 11 Overnight Trip Characteristics...
West Virginia 2011 Overnight Visitor Final Report
 West Virginia 011 Overnight Visitor Final Report June, 01 Table of Contents Introduction...... Methodology.. Travel Market Size & Structure... 5 Overnight Expenditures.. 11 Overnight Trip Characteristics...
Report on Palm Beach County Tourism Fiscal Year 2007/2008 (October 2007 September 2008)
") Report on Palm Beach County Tourism Fiscal Year 2007/2008 (October 2007 September 2008) Prepared for: Tourist Development Council of Palm Beach County Prepared by: 4020 S. 57 th Avenue Lake Worth, FL 33463
Report on Palm Beach County Tourism Fiscal Year 2007/2008 (October 2007 September 2008) Prepared for: Tourist Development Council of Palm Beach County Prepared by: 4020 S. 57 th Avenue Lake Worth, FL 33463
Denver 2015 Travel Year
 Denver 2015 Travel Year Longwoods Travel Clients 2 Background and Purpose Longwoods engaged to conduct visitor research for 2015 travel year Purposes: Estimate visitor volume and expenditures Provide intelligence
Oct-17 Nov-17. Sep-17. Travel is expected to grow over the coming 6 months; at a slightly faster rate
 Analysis provided by TRAVEL TRENDS INDEX SEPTEMBER 2018 CTI reading of.8 in September 2018 indicates that travel to or within the U.S. grew 1.6% in September 2018 compared to September 2017. LTI predicts
The Economic Impact of Tourism on the District of Thanet 2011
 The Economic Impact of Tourism on the District of Thanet 2011 Prepared by: Tourism South East Research Unit 40 Chamberlayne Road Eastleigh Hampshire SO50 5JH CONTENTS 1. Summary of Results 1 2. Table of
The Economic Benefits of Agritourism in Missouri Farms
 The Economic Benefits of Agritourism in Missouri Farms Presented to: Missouri Department of Agriculture Prepared by: Carla Barbieri, Ph.D. Christine Tew, M.S. September 2010 University of Missouri Department
Making Cooperation Work COMCEC STRATEGY. For Building an Interdependent Islamic World COMCEC TOURISM OUTLOOK 2015
 COMCEC TOURISM OUTLOOK 2015 Aslı TAŞMAZ DADAKOĞLU COMCEC Coordination Office September 2015 OUTLINE The Importance of Tourism for Development Overview of International Tourism in the World International
Tampa Bay 2014 Visitor Report
 Tampa Bay 2014 Visitor Report Table of Contents Introduction...... Research Objectives 4 Methodology. 5 Size & Structure of the U.S. Travel Market.. 6 Size & Structure of Tampa Bay s Domestic Travel Market..
EXECUTIVE SUMMARY. hospitality compensation as a share of total compensation at. Page 1
 EXECUTIVE SUMMARY Applied Analysis was retained by the Las Vegas Convention and Visitors Authority (the LVCVA ) to review and analyze the economic impacts associated with its various operations and southern
Jan-18. Dec-17. Travel is expected to grow over the coming 6 months; at a slower rate
 Analysis provided by TRAVEL TRENDS INDEX DECEMBER 2018 CTI reading of 51.8 in December 2018 indicates that travel to or within the U.S. grew 3.6% in December 2018 compared to December 2017. LTI predicts
Mar-16. Apr-16. Travel is expected to grow over the coming 6 months; at a slower rate
 Analysis provided by TRAVEL TRENDS INDE MARCH 2017 CTI reading of.8 in March 2017 shows that travel to and within the U.S. grew by 3.6% from March 2016 to March 2017. LTI predicts overall positive travel
Oregon 2011 Regional Visitor Report The Central Region
 Oregon 2011 Regional Visitor Report The Central Region Introduction Longwoods International began tracking American travelers in 1985, and has conducted large-scale syndicated visitor research quarterly
2009 Muskoka Airport Economic Impact Study
 2009 Muskoka Airport Economic Impact Study November 4, 2009 Prepared by The District of Muskoka Planning and Economic Development Department BACKGROUND The Muskoka Airport is situated at the north end
Oregon 2011 Regional Visitor Report The Eastern Region
 Oregon 2011 Regional Visitor Report The Eastern Region Introduction Longwoods International began tracking American travelers in 1985, and has conducted large-scale syndicated visitor research quarterly
49 May-17. Jun-17. Travel is expected to grow over the coming 6 months; at a slower rate
 Analysis provided by TRAVEL TRENDS INDEX MAY 2018 CTI reading of 51.7 in May 2018 shows that travel to or within the U.S. grew 3.4% in May 2018 compared to May 2017. LTI predicts moderating travel growth
Economic Impact of Tourism. Cambridgeshire 2010 Results
 Economic Impact of Tourism Cambridgeshire 2010 Results Produced by: Tourism South East Research Department 40 Chamberlayne Road, Eastleigh, Hampshire, SO50 5JH sjarques@tourismse.com http://www.tourismsoutheast.com
Ontario Arts and Culture Tourism Profile Executive Summary
 Ontario Arts and Culture Tourism Profile Executive Summary Prepared by for Ontario Arts Council November 2012 ONTARIO ARTS AND CULTURE TOURISM PROFILE EXECUTIVE SUMMARY The Ontario Arts Council (OAC) commissioned
BUSINESS BAROMETER December 2018
 Credit: Chris Orange BUSINESS BAROMETER December Credit: Nigel Moore 1 Contents Summary of findings 3 Annual monthly performance: visitor attractions..4 Visit Herts Team update 5 National context.8 Visitor
2006 RENO-SPARKS VISITOR PROFILE STUDY
 2006 RENO-SPARKS VISITOR PROFILE STUDY PREPARED FOR RENO-SPARKS CONVENTION & VISITOR AUTHORITY Study Conducted and Reported by 475 Hill Street, Suite 2 Reno, Nevada 89501 (775) 323-7677 www.infosearchintl.com
Estimates of the Economic Importance of Tourism
 Estimates of the Economic Importance of Tourism 2008-2013 Coverage: UK Date: 03 December 2014 Geographical Area: UK Theme: People and Places Theme: Economy Theme: Travel and Transport Key Points This article
ECONOMIC PROFILE. Tourism
 ECONOMIC PROFILE Tourism Park City & Summit County Utah Prepared by Park City Chamber of Commerce Convention & Visitors Bureau P.O. Box 1630 ~ Park City, UT 84060-1630 800.453.1360 ~ 435.649.6100 ~ fax
Tourism Report Spring A Report Prepared by the Sonoma County Economic Development Board. Ben Stone, Director
 Tourism Report Spring A Report Prepared by the Sonoma County Economic Development Board Ben Stone, Director Though long renowned for its picturesque scenery, Sonoma County has steadily gained recognition
2014 NOVEMBER ECONOMIC IMPACTS AND VISITOR PROFILE. Prepared By:
 2014 NOVEMBER ECONOMIC IMPACTS AND VISITOR PROFILE Prepared By: Sisters Folk Festival Economic Impacts and Visitor Profile September 5-7, 2014 November 2014 Prepared for Sisters Folk Festival, Inc. Sisters,
Consumer Travel Insights by STR
 Consumer Travel Insights by STR Traveller Journey Overview Report 2019 STR, Inc. All Rights Reserved. Any reprint, use or republication of all or a part of this presentation without the prior written approval
Tourist Traffic in the City of Rijeka For the Period Between 2004 and 2014
 Tourist Traffic in the City of Rijeka For the Period Between 2004 and 2014 Rijeka, February 2015. Table of Contents Pg No. 1. Introduction 3 2. Physical indicators on an annual level 4 2.1. Structure and
2013 IRVING HOTEL GUEST SURVEY Final Project Report
 2013 IRVING HOTEL GUEST SURVEY Final Project Report Research prepared for the Irving Convention & Visitors Bureau by Destination Analysts, Inc. Table of Contents SECTION 1 Introduction 2 SECTION 2 Executive
The Economic Impact of Travel in Minnesota Analysis
 The Economic Impact of Travel in Minnesota 2013 Analysis Overview 2013 Highlights Traveler Spending Traveler spending of $10.3 billion generated $17.6 billion in total business sales in 2013 as travel
Economic Contribution of Tourism to NSW
 Economic Contribution of Tourism to NSW 2013-14 Tourism is a significant part of the NSW economy. In 2013-14, tourism contributed $34.9 billion (Tourism Consumption) to the NSW economy and employed 272,000
West Virginia 2009 Visitor Report December, 2010
 West Virginia 009 Visitor Report December, 010 Table of Contents Introduction...... Methodology.. 4 Travel Market Size & Structure... 6 Overnight Expenditures.. 1 Overnight Trip Characteristics... 16 Demographic
MARKETING OPPORTUNITIES OFFICIAL STATE TRAVEL GUIDE OFFICIAL STATE VISITOR S MAP
 MARKETING OPPORTUNITIES OFFICIAL STATE TRAVEL GUIDE OFFICIAL STATE VISITOR S MAP TOURISM IS BIG BUSINESS TO ARIZONA ANNUAL VISITATION 43.8 MILLION $22.7 BILLION SPENT IN STATE TOP 6 U.S. MARKETS 1. Arizona
CUSTOMER SATISFACTION INDEX OF SINGAPORE 2018 Q2 RESULTS OVERVIEW AIR TRANSPORT AND LAND TRANSPORT
 CUSTOMER SATISFACTION INDEX OF SINGAPORE 2018 Q2 RESULTS OVERVIEW AIR TRANSPORT AND LAND TRANSPORT 2018 Q2 SCORES AIR TRANSPORT AND LAND TRANSPORT 75.4 Air Transport 78.0 Airport* 78.0 Changi Airport 74.5
Minnesota 2014 Visitor Report June 2015
 Minnesota 04 Visitor Report June 0 Table of Contents Introduction Methodology 4 U.S. Travel Market Trends Size and Structure of Minnesota s Travel Market 9 Overnight Trip Detail 6 Overnight Trip Characteristics
Economic Impacts of Campgrounds in New York State
 Economic Impacts of Campgrounds in New York State June 2017 Report Submitted to: Executive Summary Executive Summary New York State is home to approximately 350 privately owned campgrounds with 30,000
Produced by: Destination Research Sergi Jarques, Director
 Produced by: Destination Research Sergi Jarques, Director Economic Impact of Tourism Oxfordshire - 2015 Economic Impact of Tourism Headline Figures Oxfordshire - 2015 Total number of trips (day & staying)
SLOW GROWTH OF SOUTHERN NEVADA ECONOMY
 NEVADA S ECONOMY A monthly report produced for Commerce Real Estate Solutions by Stephen P. A. Brown, PhD, Center for Business & Economic Research, University of Nevada, Las Vegas To receive an electronic
South Australian Tourism Industry Council SA Tourism Barometer March Quarter 2015
 South Australian Tourism Industry Council SA Tourism Barometer March Quarter 2015 Headline: Events Season Provides a Lift In the March quarter 2015 survey the business activity index increased by 6% -
How does my local economy function? What would the economic consequences of a project or action be?
 June 5th,2012 Client: City of Cortez Shane Hale Report Prepared for SBDC Ft. Lewis Report Prepared by Donna K. Graves Information Services Executive Summary - At the request of Joe Keck at the Small Business
BRAZIL INTERNATIONAL INBOUND TRAVEL MARKET PROFILE (2011) Copyright 2012 by the U.S. Travel Association. All Rights Reserved.
 Copyright 2012 by the U.S. Travel Association. All Rights Reserved.") BRAZIL INTERNATIONAL INBOUND TRAVEL MARKET PROFILE (211) Copyright 212 by the U.S. Travel Association. All Rights Reserved. EXECUTIVE SUMMARY With a population of nearly 2 million and a GDP exceeding $2
BRAZIL INTERNATIONAL INBOUND TRAVEL MARKET PROFILE (211) Copyright 212 by the U.S. Travel Association. All Rights Reserved. EXECUTIVE SUMMARY With a population of nearly 2 million and a GDP exceeding $2
Produced by: Destination Research Sergi Jarques, Director
 Produced by: Destination Research Sergi Jarques, Director Economic Impact of Tourism North Norfolk District - 2016 Contents Page Summary Results 2 Contextual analysis 4 Volume of Tourism 7 Staying Visitors
Produced by: Destination Research Sergi Jarques, Director
 Produced by: Destination Research Sergi Jarques, Director Economic Impact of Tourism Norfolk - 2016 Contents Page Summary Results 2 Contextual analysis 4 Volume of Tourism 7 Staying Visitors - Accommodation
Tourism Kelowna Visitor Intercept Survey Findings FINAL DRAFT REPORT
 Tourism Kelowna Visitor Intercept Survey Findings FINAL DRAFT REPORT January 17, 2017 1 Table of Contents Executive Summary... 3 Methodology.. 7 Visitor Intercept Survey Findings.. 9 Visitor Profile. 9
Louisiana Travel Pulse May 2007
 Louisiana Travel Pulse May 2007 Produced by the Louisiana Office of Tourism Monthly Analysis/Highlights: Although nationwide airport activity was stagnant for the first quarter, New Orleans, Alexandria,
Compustat. Data Navigator. White Paper: Lodging Industry-Specific Data
 Compustat Data Navigator White Paper: Lodging Industry-Specific Data November 2008 Data Navigator: Lodging Industry-Specific Data There are several important lodging metrics to that are unavailable on
Airport Profile. St. Pete Clearwater International BY THE NUMBERS 818, ,754 $ Enplanements. Passengers. Average Fare. U.S.
 Airport Profile St. Pete Clearwater International St. Pete-Clearwater International Airport (PIE) is located in Pinellas County, Florida about nine miles north of downwn St. Petersburg, seven miles southeast
Tourism in Alberta. A Summary Of Visitor Numbers, Revenue & Characteristics Research Resolutions & Consulting Ltd.
 Tourism in Alberta A Summary Of Visitor Numbers, Revenue & Characteristics 2001 Alberta North Canadian Rockies Edmonton & Area Alberta Central Calgary & Area Policy & Economic Analysis Alberta South March
Netherlands. Tourism in the economy. Tourism governance and funding
 Netherlands Tourism in the economy The importance of domestic and inbound tourism for the Dutch economy is increasing, with tourism growth exceeding the growth of the total economy in the last five years.
Sizing Worldwide Tourism Spending (or GTP ) & TripAdvisor s Economic Impact. TripAdvisor Strategic Insights & Oxford Economics
 & TripAdvisor s Economic Impact. TripAdvisor Strategic Insights & Oxford Economics") Sizing Worldwide Tourism Spending (or GTP ) & TripAdvisor s Economic Impact TripAdvisor Strategic Insights & Oxford Economics The value of global tourism has reached $US 5.29 trillion, with international
Sizing Worldwide Tourism Spending (or GTP ) & TripAdvisor s Economic Impact TripAdvisor Strategic Insights & Oxford Economics The value of global tourism has reached $US 5.29 trillion, with international
Tourism Snapshot Year-in-review. Facts & Figures 5th edition.
 Tourism Snapshot 2010 Year-in-review Facts & Figures 5th edition www.canada.travel/corporate Tourism highlights In 2010, international visitors made15.9 million overnight trips to Canada, up 1.8% compared
THEPEGASUS VIEW. second quarter Global Online Hotel Bookings and Rates Experience Highest Year-on-year Growth in Last 12 Months
 THEPEGASUS VIEW second quarter 2014 Global Online Hotel Bookings and Rates Experience Highest Year-on-year Growth in Last 12 Months The second quarter ended on a high note for both the business and leisure
TRANSPORT AFFORDABILITY INDEX
 TRANSPORT AFFORDABILITY INDEX Report - December 2016 AAA 1 AAA 2 Table of contents Foreword 4 Section One Overview 6 Section Two Summary of Results 7 Section Three Detailed Results 9 Section Four City
Produced by: Destination Research Sergi Jarques, Director
 Produced by: Destination Research Sergi Jarques, Director Economic Impact of Tourism Oxfordshire - 2016 Economic Impact of Tourism Headline Figures Oxfordshire - 2016 number of trips (day & staying) 27,592,106
CHAPTER THREE Profile of, and Direct Economic Impacts from, Florida Heritage Tourism
 CHAPTER THREE Profile of, and Direct Economic Impacts from, Florida Heritage Tourism III-1 III-2 INTRODUCTION Giant and growing, the U.S. travel and tourism industry has captured the attention of state
T O U R I S M P L A N 2020
 T O U R I S M P L A N 2020 2 CITY OF HOLDFAST BAY TOURISM PLAN 2020 CONTENTS Executive Summary 4 Introduction 7 Tourism at a State and National Level 7 Tourism in the City of Holdfast Bay 7 Our Focus 8
REPORT ON THE ECONOMIC IMPACT OF TOURISM. Raleigh, North Carolina
 2016 REPORT ON THE ECONOMIC IMPACT OF TOURISM Raleigh, North Carolina Table of Contents 2 OVERVIEW 3 HEADLINE RESULTS 5 KEY TRENDS 8 VISITORS & SPENDING Visitor details in 2016 Composition of tourism spending
THE 2006 ECONOMIC IMPACT OF TRAVEL & TOURISM IN INDIANA
 THE 2006 ECONOMIC IMPACT OF TRAVEL & TOURISM IN INDIANA A Comprehensive Analysis Prepared by: In Partnership with: PREPARED FOR: Carrie Lambert Marketing Director Indiana Office of Tourism Development
INDUSTRY BAROMETER THROUGH DECEMBER 2014
 Lead an efficient, high-performing organization July December 2014 source: travel portland ORGANIZATIONAL PERFORMANCE To increase organizational efficiency, Travel Portland has focused on continuously
Ontario Tourism Facts & Figures
 IN THIS ISSUE Economic Outlook Ontario and Canada Tourism Statistics International Border Crossings International Travel Account Accommodations Tourism Related Employment Visitor Inquiries Travel Price