Ontario s Overnight Cultural Tourist Market, 2004 and Its Economic Impact in Ontario
|
|
|
- Gwendoline Barnett
- 5 years ago
- Views:
Transcription
1 Ministry of Tourism The Tourism Monographs N o 58, April 2006 Ontario s Overnight Cultural Tourist Market, 2004 and Its Economic Impact in Ontario Published by the Ministry of Tourism Printed by the Queen s Printer for Ontario Province of Ontario, Canada 2006, Queen s Printer for Ontario ISBN Tourism Research Unit
2 Table of Contents Page Number Highlights...ii Introduction...iii ONTARIO S OVERNIGHT CULTURAL TOURIST MARKET, How many cultural tourists visited Ontario and where did they come from?... 1 When did they visit Ontario?... 3 How long did they stay in Ontario?... 4 Where did they stay in Ontario?... 6 How big were their travel parties? Who were in their travel parties?... 7 What activities did they participate in?... 9 Which Ontario regions did they visit? How much money did they spend in Ontario? What was the economic impact of overnight cultural visitors in Ontario? Glossary Map of Ontario Travel Regions i
3 Highlights This report focuses on overnight cultural visitors to Ontario in 2004 visitors from Canada or abroad who: participated in cultural activities; visited a zoo, museum, art gallery, historic site or natural history display; attended festivals, fairs, cultural events, or aboriginal/native cultural activities. Ontario s overnight cultural visitors increased by 12% in 2004 to 10.6 million. Overnight cultural visits accounted for 23% of Ontario s total overnight visits in Spending by overnight cultural visitors increased to $4.5 billion (from $3.9 billion in 2003), and accounted for 36% of total overnight visitor spending in Overnight visitor spending generated $4.6 billion in Gross Domestic Product (GDP) and supported 75,000 jobs in Ontario. Overnight cultural visitors spent $423 per person visit; this is 57% higher than spending by total overnight visitors. Canadians made up 62% of overnight cultural visitors; 29% were Americans and 9% from overseas. 53% of overnight cultural visitors were Ontario residents. The summer months are peak for overnight cultural visitors: 50% came to Ontario during July, August and September. Overnight cultural visitors stayed 31% longer than other total overnight visitors, an average of 4.2 nights. Accommodation in private homes or cottages accounted for 49% of person nights for overnight cultural visitors. 82% of overnight cultural visitors were in adults-only parties, compared to 86% of total overnight visitors. Average party sizes ranged from 1.4 to 2.5. The top leisure activities for overnight cultural visitors included shopping, sightseeing, visiting friends and/or relatives, and visiting historic sites, museums or art galleries. Toronto and Region was Ontario s top destination for overnight cultural visitors in ii
4 Introduction Definition: In this report an overnight cultural tourist is defined as: 1. an international visitor to Ontario who stayed in the province for at least one night and: a. attended festivals or fairs, or b. attended cultural events, or c. visited a zoo, museum or natural display 2. a domestic visitor who stayed in the province for at least one night and: a. attended festivals or fairs, or b. attended cultural performances, or c. attended an aboriginal/native cultural activity, or d. visited a museum or art gallery, or e. visited a historic site The foundation for this report on cultural visitors to Ontario in 2004 is data created by the Canadian Travel Survey (CTS) and the International Travel Survey (ITS). The Canadian Travel Survey (CTS) is conducted by Statistics Canada annually as a supplement to the Labour Force Survey. Co-sponsored by the provincial and the federal governments, the CTS telephone interview captures the incidence and detail of travel by Canadians. A total of 201,560 Canadian households including 57,570 Ontario households were surveyed during The response rates for Canadian and Ontario respondents were 83.1% and 80.4% respectively. There have been a number of significant changes in the CTS in the past decade. Up to 1994 the CTS provided only the name of a trip s destination and the name of the province where an overnight stop might have occurred en route to the trip s destination. Starting in 1996, the CTS collected the complete trip itinerary. As such, at the sub-provincial level, only visits with a destination in a specific region are comparable pre and post 1996 and not total domestic visits. In addition to the change in the location question, starting in 1996, the CTS captured the interview data on a Computer Assisted Interview (CAI) system, rather than on paper. Research Resolutions & Consulting Ltd., a private consulting firm, used the data in the CTS and ITS to develop the information contained in this report for the Ontario Ministry of Tourism. The domestic data contained in this report differ from data reported in print or supplied in electronic format by Statistics Canada in the following ways: 1. Statistics Canada reports only trips of 80 kms and over, but this report includes all overnight trips, regardless of the distance travelled, as well as same-day trips with a minimum one-way distance from a respondent s home of at least 40 kms. 2. Overnight trips with an Ontario destination, but no nights spent in the province, are treated in this report as same-day trips to Ontario. iii
5 3. Domestic data contained in this report include visits in Ontario by Canadians while on trips to any destination, not just Canadian destinations. This report excludes the following: travel as a member of an operating crew of a bus, plane, truck, etc.; commuting to and from work or school; one-way travel involving a change of residence; travel in an ambulance to a hospital or clinic; trips that did not originate in Canada; and trips longer than one year. Domestic trips must also meet the following distance requirements: Length of Place of Residence Stay Ontario Other Canada Same Day 40 Kms oneway from home way from home 80 Kms one- Overnight No minimum No minimum distance distance The International Travel Survey (ITS) is also conducted by Statistics Canada with the help of Canada Customs and Immigration authorities who distribute questionnaires to a sample of travellers at border crossings. Travellers self-complete the questionnaires and mail them back to Statistics Canada. Questionnaires completed by same-day visitors from the United States who enter Canada by car do not contain any questions regarding the activities that these visitors engage in during their trip. For that reason, this report deals with overnight visitors only and does not capture outdoor activity by same-day car visitors from the United States. Most of the remaining trip characteristics were obtained from 23,833 completed questionnaires by US visitors (out of 41,032 usable questionnaires of US visitors to Canada) and 5,447 completed questionnaires by overseas visitors (out of 10,740 usable questionnaires of overseas visitors to Canada). The data contained in this report differ from those reported in the Touriscope, or supplied electronically by Statistics Canada, primarily due to the following: 1. Statistics Canada does not allocate Canadian carrier fares to the provinces. Ontario does so based on the mode of transport and the port of entry/exit. 2. The Ontario Ministry of Tourism made imputations for some fields for which the respondents did not provide any information. 3. Statistics Canada allocates expenditures to the provinces based on the number of nights a visitor spends in each place. Ontario distinguishes between accommodation expenditures and other expenditures. Accommodation expenditures are distributed according to the number of nights a visitor spent in various places and according to whether or not commercial accommodation was used in each overnight stop. For more details on how Ontario manipulates the database, please contact us and request the technical appendix. iv
6 A glossary of key terms used throughout this report is included. For more information on this publication please contact: Ontario Ministry of Tourism Tourism Policy and Research Branch 700 Bay Street, 15th Floor Toronto, Ontario, Canada M5G 1Z6 Telephone : (416) Fax : (416) v
7 ONTARIO S OVERNIGHT CULTURAL TOURIST MARKET, 2004 How many cultural tourists visited Ontario and where did they come from? 10.6 million (23%) of Ontario s 46.7 million overnight visitors participated in cultural activities in million overnight visitors participated in cultural activities during their trips in or to Ontario in 2004, a 12% increase over This increase, however, did not offset the sharp drop in the visitation levels in 2003 over 2002 (Chart 1). Canadians accounted for 62% of overnight cultural visitors, Americans for 29%, and overseas visitors for 9% (Table 1, next page). Ontario residents made up 53% of total overnight cultural visitors, accounting for 87% of Canadian overnight cultural visitors. Overseas overnight visitors had the highest incidence (57%) of participating in cultural activities during their trips to Ontario, followed by American overnight visitors (41%) and Canadian overnight visitors (17%) (Table 1). Ontario residents had the lowest incidence of participating in cultural activities (17%) while travelling in their home province. Overnight visitors from European countries had higher incidence of participating in cultural activities than visitors from Asian countries. (000s) 12,000 11,000 10,000 9,000 8,000 7,000 6,000 5,000 4,000 3,000 2,000 60% 50% 40% 30% 20% 10% 0% Chart 1: Overnight Cultural Visits to Ontario ,113 3,414 4,662 1,010 3,363 7, ,689 6, ,085 6, Canada US Overseas Chart 2: Percentage of Total Overnight Visitors, 2004 Who participated in cultural activities vs. outdoor activities 17% 40% Overnight Cultural Visitors Overnight Outdoor Visitors 17% 42% 41% 36% 39% 38% Canada Ontario USA Border States 57% 30% Overseas 1
8 Overseas visitors were about twice as likely to engage in cultural activities (57%) as outdoor activities (30%) 1 (Chart 2). Canadians visitors had higher participation rates in outdoor activities (40%) as compared to cultural activities (17%). Ontario residents had the highest participation rate in outdoor activities. Table 1: Overnight Person Visits in Ontario, 2004 Origin Overnight Cultural Visitors (000s) % Share Total Overnight Visitors (000s) % Share Incidence* TOTAL 10, % 46, % 23% Canada 6,524 62% 37,496 80% 17% Ontario 5,648 53% 33,284 71% 17% Quebec 467 4% 2,545 5% 18% Manitoba 96 1% 438 1% 22% Western Canada 162 2% 758 2% 21% Atlantic Canada 150 1% 471 1% 32% USA 3,085 29% 7,434 16% 41% New York 568 5% 1,428 3% 40% Michigan 643 6% 1,564 3% 41% Pennsylvania 178 2% 457 1% 39% Minnesota 58 1% 296 1% 20% Ohio 298 3% 649 1% 46% Illinois 147 1% 357 1% 41% Wisconsin 72 1% 258 1% 28% Other USA 1,122 11% 2,425 5% 46% Overseas 987 9% 1,742 4% 57% UK 241 2% 382 1% 63% France 75 1% 101 ** 74% Germany 73 1% 115 ** 63% Japan 75 1% 175 ** 43% Other Europe 201 2% 331 1% 61% Other Asia 146 1% 310 1% 47% * Incidence refers to the percentage of total overnight visitors that participated in cultural activities. ** Less than 1% 1 Overnight outdoor visitors are defined as those who stayed in Ontario for at least one night and participated in any outdoor/sports activities (such as, but not limited to, fishing, boating, swimming, hunting, skiing, etc), visited any national or provincial park or historic site, or stayed at campgrounds, trailer parks, or at private or commercial cottages or cabins. An outdoor market report, Ontario s Overnight Visitors with Outdoors Interest, 2004 is available at 2
9 When did they visit Ontario? 50% of overnight cultural visitors came to Ontario during the summer months in 2004, compared to 39% of the province s total overnight visitors. 60% Chart 3: Overnight Visits by Calendar Quarters, 2004 Cultural Visitors vs. Outdoor Visitors and Total Overnight Visitors 50% 40% Overnight Cultural Visitors Overnight Outdoor Visitors Total Overnight Visitors 30% 20% 55% 50% 39% 10% 0% 23% 24% 21% 21% 16% 13% 16% 13% 9% QI QII QIII QIV Overnight cultural visitors had a higher incidence of travelling during the summer than any other season. Cultural visitors had a slightly higher incidence of travelling during fall and winter than overnight outdoor visitors. Ontario received four times as many cultural visitors during the summer as it did during the winter. The province received six times as many outdoor visitors during the summer as it did in the winter. One of Ontario s tourism challenges continues to be establishing the province as a winter travel destination. Table 2: Overnight Cultural Visits in Ontario By Calendar Quarter, 2004 Q1 Q2 Q3 Q4 Total 1,352 2,277 5,265 1,703 CANADA (000) 1,032 1,213 3,264 1,015 Share (%) 76% 53% 62% 60% USA (000) Share (%) 19% 34% 29% 31% OVERSEAS (000) Share (%) 5% 12% 9% 10% 3
10 How long did they stay in Ontario? On average, overnight cultural visitors stayed in Ontario for 4.2 nights in 2004, one night longer than total overnight visitors. Overnight cultural visitors spent 44.8 million nights in Ontario. This is 30% of total person nights in 2004 and represents a 10% increase over Overseas cultural visitors stayed the longest (averaging 12.1 days), followed by American (3.5 nights) and Canadian (3.4 nights) visitors. Visitors from Michigan stayed the shortest (2.4 nights). Overnight cultural visitors from everywhere except France and some U.S. border states tended to stay longer than other overnight visitors (4.2 nights vs. 3.2 nights). Table 3: Person Nights in Ontario, 2004 Total Cultural Visitors Overnight Visitors Average Length of Stay (nights) Origin Nights (000s) % Share Nights (000s) % Share Incidence * Cultural Total TOTAL 44, % 149, % 30% CANADA 22,114 49% 104,307 70% 21% Ontario 16,368 37% 83,108 55% 20% Quebec 2,078 5% 10,267 7% 20% Manitoba 638 1% 2,099 1% 30% Western Canada 1,633 4% 5,656 4% 29% Atlantic Canada 1,396 3% 3,177 2% 44% USA 10,764 24% 25,588 17% 42% New York 1,827 4% 4,212 3% 43% Michigan 1,543 3% 3,861 3% 40% Pennsylvania 657 1% 1,768 1% 37% Minnesota 253 1% 1,147 1% 22% Ohio 840 2% 2,028 1% 41% Illinois 559 1% 1,429 1% 39% Wisconsin 261 1% 1,164 1% 22% Other USA 4,823 11% 9,980 7% 48% OVERSEAS 11,895 27% 19,997 13% 59% UK 2,448 5% 3,628 2% 67% France 518 1% 705 0% 73% Germany 905 2% 1,299 1% 70% Japan 703 2% 1,196 1% 59% * Percentage of total person nights spent by overnight cultural visitors 4
11 69% of total overnight cultural visitors took short getaway trips (1 to 3 nights). 80% of Ontario resident cultural visitors took short getaways while 76% of overseas cultural visitors stayed four or more nights. (Chart 4A). The length of stay of U.S. overnight visitors was correlated to the types of activities that they participated in. For example, U.S. overnight cultural visitors had a higher incidence of taking short getaway trips than overnight outdoor visitors 69% of US cultural visitors versus 51% of US outdoor visitors stayed 1 to 3 nights in Ontario. (Chart 4A & 4B). On the other hand, the length of stay for overseas overnight visitors was not correlated to the types of activities they participated in. Chart 4A: Length of Stay for Overnight Cultural Visitors, 2004 Chart 4B: Length of Stay for Overnight Outdoor Visitors, % 75% Getaway trips (1-3 nights) Vacations (4 or more nights) 85% 75% 65% 65% Getaway trips (1-3 nights) Vacations (4 or more nights) 55% 55% 45% 69% 75% 80% 69% 77% 76% 45% 69% 74% 76% 76% 35% 25% 15% 31% 25% 20% 31% 23% Total Canada Ontario USA Border States 24% Overseas 35% 25% 15% 31% 26% 24% 51% 49% 53% 47% Total Canada Ontario USA Border States 24% Overseas While the length of stay of Canadian cultural visitors decreased between 2004 and 2001, it increased for American and overseas cultural visitors (Table 4). Table 4: Average Stay in Nights by Cultural Visitors, TOTAL CANADA Ontario Quebec US Border States Other States OVERSEAS UK France Germany Japan
12 Where did they stay in Ontario? Non-commercial accommodation was the top choice for cultural visitors in 2004, accounting for 49% of total person nights spent in Ontario. 90% 80% 70% Chart 5: Percentage of Person Nights Spent in Ontario, 2004 By Accommodation Type Overnight Cultural Visitors vs. Outdoor and Total Overnight Visitors 60% 50% 40% Cultural Visitors Outdoor Visitors Total Overnight Visitors 30% 20% 10% 0% 23% 17% 7% 5% 3% 4% Hotel Motel Other Roofed Commerical 17% 11% 6% 5% 7% 8% 58% 54% 49% Camping/Trailer Park Homes of Friends/Relatives/Other Non-commercial 9% 8% 8% Other Ontario overnight cultural visitors spent 49% of their person nights at private homes of friends or relatives or at private cottages 22.1 million out of a total of 44.8 million nights. However, cultural visitors were less inclined to stay at private homes/cottages than other overnight visitors. Cultural visitors had the highest incidence of staying at hotels of all overnight visitors. Hotels accounted for 23% of the total person nights of cultural visitors compared to 17% of other overnight visitors and 7% of outdoor overnight visitors. Cultural visitors from overseas had the highest incidence of staying at private homes or non-commercial accommodation. Cultural visitors from the U.S. had the highest incidence of spending nights in hotels. Table 5: Cultural Visitors Accommodation Use by Person Nights and Origin, 2004 Canada % USA % Overseas Type of Accommodation (000s) Share (000s) Share (000s) % Share Total Person Nights 22, % 10, % 11, % Hotel 3,893 18% % % Motel 1,043 5% % 273 2% Other Roofed Commercial 1,551 7% 703 7% 251 2% Camping/Trailer Park 2,524 11% 560 5% 119 1% Homes of Friends/Relatives/other non-commercial 12,165 55% % % Other 938 4% % % 6
13 How big were their travel parties? Who were in their travel parties 2? 82% of overnight cultural visitors travelled in parties of adults only. Average party sizes ranged from 1.4 to 2.5. Overnight cultural visitors from Ontario s border states had the largest average party size (2.5), while Japanese visitors had the smallest (1.4). All cultural visitors, regardless of their origin, travelled in smaller groups than overnight outdoor visitors of the same origins (Chart 6). Chart 6: Average Party Size, 2004 Overnight Cultural Visitors vs. Outdoor and Total Overnight Visitors Cultural visitors Outdoor visitors Total overnight visitors Canada Ontario USA Border States Overseas UK France Germany Japan Overnight cultural visitors travelled primarily in adults-only groups (Table 6). U.S. overnight cultural visitors had the lowest incidence of travelling in adults-only groups (76%), while visitors from overseas countries had the highest (86%). Overnight cultural visitors from the U.S. and overseas had a higher incidence of travelling with children than overnight outdoor visitors from the same origin. 2 The International Travel Survey (ITS) defines "travel party" as everyone who travels together, regardless of whether they are members of the same household. In the Canadian Travel Survey (CTS) the "travel party" contains only household members. As such, a person who is travelling with the respondent, but is not a member of that household, will not be included in the CTS party-size measurement. 7
14 Table 6: Party Composition by Travel Purpose, 2004 Cultural Visitors Outdoor Visitors Total Overnight Visitors Origin Adults Only Adults w/ Kids Adults Only Adults w/ Kids Adults Only Adults w/ Kids Total 82% 18% 81% 19% 86% 14% Canada 84% 16% 81% 19% 86% 14% USA 76% 24% 82% 18% 88% 12% Overseas 86% 14% 90% 10% 93% 7% U.S. overnight cultural and outdoor visitors had a higher frequency of travelling in groups of two people (58%) or three-or-more people (16%) than overnight visitors from other origins. Cultural visitors, regardless of their origin, had a higher incidence of travelling alone than outdoor visitors (Chart 7). Chart 7: Party Size (Adults Only), 2004 Overnight Cultural Visitors vs. Outdoor Visitors 100% 1 adult 2 adults 3 or more adults 80% Percentage of Cultural Visitors Percentage of Outdoor Visitors 60% 40% 20% 0% 71% 64% 58% 52% 56% 50% 42% 43% 27% 32% 27% 22% 23% 16% 2% 6% 4% 7% Canada USA Overseas Canada USA Overseas 8
15 What activities did they participate in? The top activities for overnight cultural visitors in 2004 were shopping, sightseeing, visiting friends/relatives, and touring historic sites, museums or art galleries.. All overnight cultural visitors participated in cultural activities, including visiting historic sites, museums and art galleries, attending festivals, fairs, and cultural performances. 69% went shopping. 65% went sightseeing. 55% visited friends/relatives. 35% took part in outdoor/sports activities (Chart 8). Overnight cultural visitors were more active than overnight outdoor visitors and more likely to participate in all activity categories, except sports/outdoor activity and visiting national/provincial parks. Chart 8: Activities Participated in During Trip in Ontario, 2004 Overnight Cultural Visitors vs. Overnight Outdoor Visitors VFR 55% Festival/fair Cultural performance 29% 31% Museum/art gallery 36% Historic site 44% Zoo/aquarium/botanical garden Sports event 9% 11% Shopping Sightseeing 67% 69% Bar/night club Casino Theme/amusement park National/provincial park 9% 11% 27% 25% Cultural Visitors Outdoor visitors Sports/outdoor activity 35% 0% 10% 20% 30% 40% 50% 60% 70% 80% Overnight cultural visitors participated, on average, in 4.6 activities, compared with 53% more than overnight outdoor visitors, who participated in 3.0 activities (Chart 9, next page). Overseas cultural visitors participated in more activities (6.2 activities per person visit), than Americans (4.4 activities) or Canadians (4.4 activities), partly because visitors from overseas stay longer and have greater opportunity to participate in activities. 9
16 Chart 9: Average Number of Activities per Visit, 2004 Overnight Cultural Visitors vs. Overnight Outdoor Visitors Activities cultural Visitors Outdoor Visitors Total Canada Ontario US Border States Overseas Cultural visitors, regardless of their origins, had the highest incidence of shopping and sightseeing in Ontario (Table 7). Cultural visitors from Canada and overseas had higher incidence of visiting friends/relatives than cultural visitors from U.S.. Table 7: Overnight Cultural Visitors in Ontario Percent of Visitors who Participated in Selected Activities, 2004 Activity Canada Ontario USA Border States Overseas VFR 65% 65% 29% 24% 66% Festival/fair 35% 36% 19% 19% 24% Cultural performance 32% 33% 31% 37% 26% Museum/art gallery 31% 27% 41% 36% 62% Historic site 35% 34% 56% 51% 68% Zoo/aquarium/botanical garden 9% 8% 10% 8% 34% Sports event 10% 9% 7% 6% 13% Shopping 62% 61% 77% 75% 93% Sightseeing 61% 59% 73% 69% 88% Bar/night club 26% 25% 28% 28% 35% Casino 11% 12% 8% 8% 14% Theme/amusement park 9% 8% 7% 6% 20% National/provincial park 19% 19% 29% 26% 56% Sports/outdoor activity 40% 41% 25% 25% 26% 10
17 Which Ontario regions 3 did they visit? 34% of Ontario s overnight cultural visitors chose Toronto and Region in % of overnight cultural visitors went to Toronto and Region, which is ranked as Ontario s top cultural tourism destination (Chart 10). Niagara Region (22%) and Central Ontario (18%) were in second and third place. Overnight cultural visitors tended to travel in Ontario s urban areas for cultural experience and had a higher incidence of visiting Southern Ontario than overnight outdoor visitors, who had a higher incidence of visiting Central Ontario and Northern Ontario. Chart 10: Distribution of Ontario Travel Regions Visited by Overnight Cultural Visitors vs. Overnight Outdoor Visitors, 2004 Essex Southwestern Niagara Region South-Central Ontario Toronto and Region Central Ontario St. Lawrence River Corridor Ottawa Region Eastern Ontario North-Central Cultural Visitors Outdoor Visitors North-East North-West 0% 5% 10% 15% 20% 25% 30% 35% 40% 3 Please see page 18 for a map of Ontario s Travel Regions. 11
18 Overseas cultural visitors had the highest incidence of visiting Toronto and Region (81%), Niagara Region (52%) and Ottawa Region (30%). Cultural visitors from Ontario s border states had the highest incidence of visiting the Niagara Region (35%). Ontario cultural visitors had the highest incidence of visiting Central Ontario (47%). This is cottage country for many Ontario residents. Table 8: Overnight Cultural Visitors in Ontario, 2004 Percent of Overnight cultural Visitors, by Origin, Visiting each Ontario Travel Region* Border Region Visited Canada Ontario USA States Overseas Total overnight cultural visits (000s) 6,524 3,085 3,085 1, Essex 1% 3% 3% 4% 2% Southwestern 10% 20% 14% 17% 6% Niagara Region 11% 21% 36% 35% 52% South-Central Ontario 6% 12% 6% 5% 13% Toronto and Region 25% 39% 38% 34% 81% Central Ontario 23% 47% 7% 6% 13% St. Lawrence River Corridor 5% 9% 7% 6% 10% Ottawa Region 12% 17% 8% 6% 30% Eastern Ontario 2% 3% 3% 3% 3% North-Central 2% 5% 1% 1% 1% North-East 7% 13% 5% 5% 3% North-West 3% 4% 4% 3% 1% *The percentages are based on the total number of visitors with a known regional destination in Ontario. Note: The sum of each column is greater than 100% because multiple locations may be visited in a given trip. 12
19 How much money did they spend in Ontario? Visitor spending by overnight cultural visitors in Ontario reached $4.5 billion, representing 36% of the total spending by overnight visitors in Total visitor spending in Ontario by overnight cultural visitors increased by 16% in 2004, from $3.9 billion to $4.5 billion. This is a partial recovery from a 20% decrease in spending from 2002 to Canadian overnight cultural visitors accounted for 40% of total spending; Americans for 32% and overseas cultural visitors for 28% (Table 9). The average amount spent per person visit in 2004 was $423. Overnight Ontario resident cultural visitors had the lowest average spending per person visit ($241); visitors from Japan had the highest ($1,421) (Table 10). Overseas visitors spent more because, on average, they travelled longer distances, stayed longer and engaged in more activities than visitors from Canada and the U.S. Table 9: Overnight cultural Visitors Spending by Origin, 2004 Total Spending (000) Share (%) Origin TOTAL $4,479, % CANADA $1,781,608 40% Ontario $1,362,381 30% USA $1,449,901 32% Border States $778,174 17% Other U.S. $671,727 15% OVERSEAS $1,248,052 28% UK $330,780 7% France $65,328 1% Germany $98,467 2% Japan $106,558 2% Table 10: Overnight Cultural Visitors Average Expenditures in Ontario, 2004 Average Per Person Visit Average Per Person Night Average Per Party TOTAL $423 $100 $778 CANADA $273 $81 $461 Ontario $241 $83 $412 USA $470 $135 $1,089 Border States $396 $131 $975 Other US $599 $139 $1,258 OVERSEAS $1,264 $105 $2,217 UK $1,373 $135 $2,564 France $871 $126 $1,593 Germany $1,349 $109 $2,462 Japan $1,421 $152 $2,011 Accommodation, transportation, and food/beverage at restaurants led the spending list for overnight cultural visitors (Table 11, next page). Overnight cultural visitors from the U.S. tended to spend more on accommodation than visitors of other origins; overseas cultural visitors spent more on transportation and retail/other; Canadian cultural visitors spent more eating at restaurants. Cultural visitors had a slightly different spending pattern from their outdoor visitors of the same origins. For example, overseas cultural visitors tended to spend more on transportation and less on accommodation than overseas outdoor visitors. Meanwhile, 13
20 Canadian cultural visitors tended to spend more on eating at restaurants and less on buying food at stores than their outdoor visitors. Table 11: Visitors' Spending by Expenditure Categories, 2004 Overnight Cultural Visitors Overnight Outdoor Visitors Overseas Overseas Total Canada U.S. Total Canada U.S. Total Spending (000,000s) $4,480 $1,782 $1,450 $1,248 $4,101 $2,503 $1,122 $476 Transportation related* 23% 21% 13% 39% 20% 25% 11% 15% Accommodation 27% 25% 36% 20% 28% 23% 39% 29% Food/Beverage at Stores 5% 7% 4% 3% 9% 11% 5% 5% Food/Beverage at Restaurants 18% 22% 18% 12% 17% 18% 16% 17% Recreation/Entertainment 11% 11% 15% 7% 11% 10% 16% 10% Retail/Other (Total) 15% 14% 14% 26% 14% 13% 13% 24% * includes public/local transport and private/auto (including vehicle rental) Overnight cultural visitors, regardless of their origins, had higher average spending per person visit than overnight outdoor or other overnight visitors (Chart 11). In 2004, the average spending per cultural visitor was 87% more than overnight outdoor visitors, and 57% more than other overnight visitors. Their higher activity participation rates contribute to this higher average spending. $ 1,300 1,200 1,100 1, Chart 11: Average Spending per Visit, 2004 Overnight Cultural Visitors vs. Outdoor and Other Visitors 270 Cultural Visitors Outdoor Visitors Total Overnight Visitors TOTAL CANADA Ontario USA Border States OVERSEAS 359 1, ,261 14
21 What was the economic impact 4 of overnight cultural visitors in Ontario? In 2004, the $4.5 billion spent by overnight cultural tourists generated $4.6 billion in Gross Domestic Product (GDP) for Ontario and supported 75,000 jobs. Overnight cultural tourists spent $4.5 billion in Ontario during This expenditure generated $2.5 billion in direct tourism Gross Domestic Product 5 (GDP) for the province from tourism frontline businesses 6. This represented a 19% increase over The visitor spending generated an additional $2.1 billion in GDP through indirect 7 and induced 8 impact. Overnight cultural visitor spending supported about 50,000 (direct) jobs in tourism-related businesses and 25,000 (indirect and induced) jobs in other businesses in Ontario. Overnight cultural visitors generated $2.1 billion in total taxes, of which $1.1 billion were federal tax revenues 9, $844 million were provincial 10 and $171 million were municipal tax revenues 11. Table 12: Economic Impact of Overnight Cultural Tourists in Ontario* 2004 Visitor Expenditures (million $): $4,480 Gross Domestic Product (million $): Total $4,591 Tourism Front-line Businesses $2,521 Labour Income (million $): Total $2,534 Tourism Front-line Businesses $1,342 Employment Number of Jobs Total 74,925 Tourism Front-line Businesses 49,871 Taxes (Total) (million $): Federal $1,078 Provincial $844 Municipal $171 Taxes (Tourism Front-line Businesses) (million $) : Federal $655 Provincial $578 Municipal $48 * Preliminary and subject to change. 4 These estimates of economic impact are based on MTR s Tourism Regional Economic Impact Model. 5 Gross Domestic Product (GDP): Value of goods and services produced by labour and capital within a country (or region), regardless of nationality of labour or ownership. This GDP is measured at market prices. Tourism GDP refers to the GDP generated in those businesses that directly produce or provide goods and services for travelers. 6 Tourism front-line businesses: refer to the businesses or sectors that sell products and services directly to travellers, e.g. accommodations, restaurants, recreations, travel agents, transportation and retail enterprises etc. Although these sectors or businesses supply the goods and services consumed by travellers, they also supply goods and services consumed by non-travellers. As such, not all of these businesses or sectors revenues and jobs are attributable to tourism expenditures. 7 Indirect impact: refers to the impact resulting from the expansion of demand from tourism front-line businesses or tourism-related sectors, to other businesses or sectors. 8 Induced impact: refers to the impact associated with the re-spending of labour income and /or profits earned in the industries that serve travellers directly and indirectly. 9 Federal tax revenues: refers to personal income tax, corporate income tax, commodity tax (GST) and payroll deduction that collected by the federal government. 10 Provincial tax revenues: refers to personal income tax, corporate income tax, commodity tax (PST, gasoline tax, fuel tax and tobacco tax), and employer health tax that collected by Ontario provincial government. 11 Municipal tax revenues: refers to business and personal property taxes that collected by the municipalities. 15
22 Glossary ACCOMMODATION TYPE refers to the type(s) of accommodation used during the trip. Other accommodation is a separate category in the CTS and ITS questionnaires, and includes dormitories, hostels, sleeping berths on trains and boats, etc. In many of the tabulations contained in this report, accommodation type "not stated" records have been combined with other. ACTIVITIES ON TRIP. For each trip, respondents were asked to indicate whether they participated in any of a number of activities (aided measure). The activity could have occurred at any location on the trip (destination, location of overnight stop) since activity data are not captured on a location-specific basis. EXPENDITURES ON TRIP. All dollars spent by all household members or party members who went on the trip and paid for by individuals, government or private sector business. Only expenditures incurred by visitors to Ontario are contained in this report. It excludes spending by Ontarians on (Canadian) public fares for trips outside the province that did not involve a visit in Ontario. The following items of expenditures are excluded: food and beverage purchased prior to the trip to be used while on the trip; items purchased to be resold or used in a business; vehicles, such as cars, boats and caravans; capital investment, such as real estate, works of art, rare articles and financial stocks; cash given to friends or relatives during a trip which does not represent payment for goods and services received, as well as donations to institutions. EXPENDITURES IN ONTARIO. Canadian residents expenditures on the trip are assigned by Statistics Canada to provinces of origin, destination, and location of overnight stops according to pre-set rules. Expenditures from the ITS were assigned to Ontario according to MTR rules. HOUSEHOLD/PARTY TRIP. A trip involving one or more persons from the same household/party leaving and returning together. If four persons from the same household take a trip, it counts as one household-trip. The CTS captures household-based information, while the ITS captures party-based (not necessarily belonging to the same household) information. MODE OF TRANSPORT. Mode of transport refers to the transportation in Canada. It does not refer to the transport mode used by international visitors to come to Ontario. PERSON NIGHT. A night spent away from home by a person taking a trip. If two persons take a trip involving three nights away from home, that counts for six person nights. 16
23 PERSON TRIP. A trip taken by one person. If two persons from the same household go on a trip, it counts for two person trips. If the same person takes two trips, it also counts for two person trips. PURPOSE OF TRIP (MAIN). The main purpose categories include visiting friends/relatives, pleasure, personal, business, convention. In this report, business convention has been combined with business and pleasure has been combined with non-business convention. QUALIFYING TRIP. A qualifying trip in the CTS is defined as travel from the usual place of residence to a location any distance away if an overnight trip and at least 40 km (one-way) if a same-day trip for any purpose other than as a member of an operating crew of a bus, plane, truck, etc; commuting to work or school; moving to a new residence; travel in an ambulance to a hospital or clinic; trips that did not originate in Canada and trips longer than one year. The distance minimum of 40 km applies only to same-day trips that originate in Ontario. In all other provinces, the minimum distance for a same-day trip is 80 km. In the ITS it includes all nonresidents crossing the Canadian border (excludes crews of transportation firms). REPORTING PERIOD. A one month reporting period has been used by the CTS since the second quarter of All fieldwork takes place approximately three weeks after the end of the reporting period. For example, during the third week in July respondents would be asked to report on trips that ended in the preceding June. In the ITS, a respondent is given a questionnaire which he/she is asked to fill out when his/her trip is completed. RESPONDENT. In the CTS, a randomly selected individual in the sampled household (from the Statistics Canada Labour Force Survey sampling frame) who is at least 15 years of age. Specifically excluded from the LFS coverage are residents of Yukon and Northwest Territories, persons living on Indian Reserves, full-time members of the Canadian Armed Forces and persons living in institutions (inmates of penal institutions and patients in hospitals or nursing homes who have resided in the institution for more than six months). VISIT. Place of overnight stay or for same day trips, the location of the trip s destination. If the respondent travelled twice to the same location during the same trip, only one visit is recorded at that location. In this report there are three types of visits at the sub-provincial level: visits that were destined to region x; visits that were destined to Ontario region y, but took an excursion to region x, and visits that were destined outside Ontario, but had an overnight stop in region x. A small number of CTS respondents with overnight trips indicated that they had as their destination Ontario region x, but they spent no night in region x. These trips have been treated in this report as same day trips to region x. 17


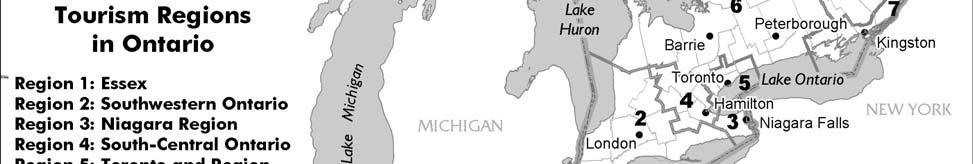
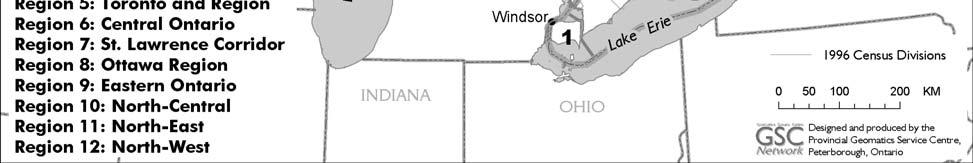
24 Map of Ontario Travel Regions 18
Tourism in Alberta. A Summary Of Visitor Numbers, Revenue & Characteristics Research Resolutions & Consulting Ltd.
 Tourism in Alberta A Summary Of Visitor Numbers, Revenue & Characteristics 2001 Alberta North Canadian Rockies Edmonton & Area Alberta Central Calgary & Area Policy & Economic Analysis Alberta South March
Tourism in Alberta. A Summary Of Visitor Numbers, Revenue & Characteristics 2004
 Tourism in Alberta A Summary Of Visitor Numbers, Revenue & Characteristics 2004 Alberta North Based on the 2004 Canadian & International Travel Surveys (Statistics Canada) Canadian Rockies Edmonton & Area
Tourism Statistics RTO 1
 Tourism Statistics RTO 1 Tourism Research Unit Spring 2012 1 1 Ontario Tourism 2 2 Ontario Tourism Indicators 2011* Visits increased by 1.3% to 104.4 million. Visits from Ontario and overseas countries
Tourism Statistics Region 1
 Tourism Statistics Region 1 Tourism Research Unit Winter 2011 1 Summary In 2008, there were 101.0 million visits in and visitors spent $17.6 billion residents account for the majority of visits and spending
Tourism Statistics RTO 11
 Tourism Statistics RTO 11 Tourism Research Unit Spring 2012 1 1 Tourism 2 2 Tourism Indicators 2011* Visits increased by 1.3% to 104.4 million. Visits from and overseas countries increased, while visits
The Economic Impacts of Cultural and Sport Tourism in Canada 2007
 The Economic Impacts of Cultural and Sport Tourism in Canada 2007 The Outspan Group Inc. The Economic Impacts of Cultural and Sport Tourism in Canada 2007 March 2009 ISBN: 978-1-100-13917-3 Catalogue number:
Region 2: Tourism Partnership of Niagara. Visitor Statistics Visitor Spending Statistics Hotel Statistics Tourism Related Establishments
 Region 2: Tourism Partnership of Niagara Visitor Statistics Visitor Spending Statistics Hotel Statistics Tourism Related Establishments http://www.mtc.gov.on.ca/en/research/rtp/rtp.shtml tourism.research@ontario.ca
Domestic Tourism in Alberta 2016
 A Summary of 2016 Domestic Visitor Numbers, Expenditures and Characteristics July 2018 tourism.alberta.ca July 2018 Introduction Whether to see their friends and relatives, for business, or for pleasure,
Tourism in Alberta 2013
 2013 A Summary of 2013 Visitor Numbers, Expenditures and Characteristics September 2016 tourism.alberta.ca September 2016 Introduction Whether to see their friends and relatives, for business, or for pleasure,
2014 Tourism Statistics Region 12
 2014 Tourism Statistics Region 12 Tourism Research Unit Fall 2016 Economic Indicators Source: Oxford Economics; Ontario Ministry of Tourism, Culture and Sport 2 2014 Notable Events February 7 23 The XXII
Ontario Sport Tourism Statistics 2014
 Ontario Sport Tourism Statistics 2014 Tourism Research Unit Winter 2017 This report summarizes key characteristics of visitors and visitor spending of trips in Ontario which included: Attend a sports event
2014 Tourism Statistics Region 8
 2014 Tourism Statistics Region 8 Tourism Research Unit Fall 2016 Economic Indicators Source: Oxford Economics; Ministry of Tourism, Culture and Sport 2 2014 Notable Events February 7 23 The XXII Olympic
Tourism Statistics Parry Sound District
 Tourism Statistics Parry Sound District Tourism Research Unit Spring 2014 Note: due to changes in Statistics Canada s survey methodology, 2011 domestic data is not comparable to prior years 2 Ontario Tourism
Concepts and Definitions. June 2014
 Concepts and Definitions June 2014 Definitions: Border Crossings The total number of non-residents entering Canada or residents returning to Canada through Ontario s international ports of entry. The international
Destination: CD14 Year: 2012
 Destination: CD14 Year: 2012 Origin Other Canada US Border States Total Canada Ontario US Overseas Total Visits Total Unweighted 441 164 155 9 175 131 44 102 Total Household/Party Visits (Weighted) 1,271,307
Tourism in Alberta. A Summary of 2012 Visitor Numbers and Characteristics. June 2014
 Tourism in Alberta 2012 A Summary of 2012 Visitor Numbers and Characteristics June 2014 Introduction Whether to see their friends and relatives, for business, or for pleasure, 33.1 million total visits
Tourism in Alberta. A Summary of 2011 Visitor Numbers and Characteristics. June 2013
 Tourism in Alberta 2011 A Summary of 2011 Visitor Numbers and Characteristics June 2013 Due to methodological changes to the 2011 Travel Survey of Residents of Canada, there is a historical break in the
The Benefits of Tourism
 The Benefits of Tourism The Benefits of Tourism Diversification of tourism industry infrastructure Contributions to the balance of payments Increase in tax revenues Improved job opportunities Improved
Ontario Tourism Facts & Figures
 Winter 2006 Vol. 5, No. 4 Ontario Tourism Facts & Figures In This Issue Economic Outlook Canada and Ontario Tourism Statistics International Travel Account International Border Crossings Accommodations
Destination: CD14 Year: 2011
 Destination: CD14 Year: 2011 Other Canada US Border States US Non-Border States Total Canada Ontario US Overseas Total Visits Total Unweighted 349 149 140 9 113 72 41 87 Total Household/Party Visits (Weighted)
Domestic Tourism in Edmonton and Area Tourism Region A Summary of 2015 Domestic Visitor Numbers, Expenditures and Characteristics August 2017
 Domestic Tourism in Edmonton and Area Tourism A Summary of 2015 Domestic Visitor Numbers, Expenditures and Characteristics August 2017 tourism.alberta.ca August 2017 Introduction Whether it was to see
Tourism in Calgary and Area Tourism Region A Summary of 2014 Visitor Numbers, Expenditures and Characteristics July 2016
 Tourism in Calgary and Area Tourism Region 2014 A Summary of 2014 Visitor Numbers, Expenditures and Characteristics July 2016 Tourism.alberta.ca July 2016 Introduction Whether to see their friends and
Ontario Arts and Culture Tourism Profile Executive Summary
 Ontario Arts and Culture Tourism Profile Executive Summary Prepared by for Ontario Arts Council November 2012 ONTARIO ARTS AND CULTURE TOURISM PROFILE EXECUTIVE SUMMARY The Ontario Arts Council (OAC) commissioned
Tourism Snapshot Year-in-review. Facts & Figures 5th edition.
 Tourism Snapshot 2010 Year-in-review Facts & Figures 5th edition www.canada.travel/corporate Tourism highlights In 2010, international visitors made15.9 million overnight trips to Canada, up 1.8% compared
2012 Canadian Visitation to North Carolina
 2012 Canadian Visitation to North Carolina July 2013 North Carolina Division of Tourism, Film and Sports Development Volume & Spending ($millions) +29.7% +3.6% +0.1% +4.6% +12.0% -0.1% +17.0% -6.7% $78,523
Ontario Tourism Facts & Figures
 IN THIS ISSUE Economic Outlook Ontario and Canada Tourism Statistics International Border Crossings International Travel Account Accommodations Tourism Related Employment Visitor Inquiries Travel Price
Domestic Tourism in Alberta North Tourism Region 2016
 Domestic Tourism in Alberta North Tourism Region A Summary of Domestic Visitor Numbers, Expenditures and Characteristics July 2018 Tourism.alberta.ca July 2018 Introduction Whether it was to see friends
Domestic Tourism in Calgary and Area Tourism Region 2016
 Domestic Tourism in Calgary and Area Tourism A Summary of 2016 Domestic Visitor Numbers, Expenditures and Characteristics July 2018 Tourism.alberta.ca July 2018 Introduction Whether it was to see friends
The Benefits of Tourism
 The Benefits of Tourism The Benefits of Tourism Diversification of tourism industry infrastructure Contributions to the balance of payments Increase in tax revenues Improved job opportunities Improved
VALUE OF TOURISM. Trends from
 VALUE OF TOURISM Trends from 2005-2015 March 2017 TABLE OF CONTENTS 1. Overview... 2 Key highlights in 2015... 2 2. Contributions to the economy... 4 TOURISM REVENUE... 5 Total revenue... 5 Tourism revenue
Tourism Satellite Accounts : The Demand Perspective Concepts and Definitions Tourism Expenditure and Tourism Consumption
 Tourism Satellite Accounts : The Demand Perspective Concepts and Definitions Tourism Expenditure and Tourism Consumption Demi Kotsovos Satellite Accounts and Special Studies National Economic Accounts
Ontario Tourism Facts & Figures
 IN THIS ISSUE Economic Outlook Ontario and Canada Tourism Statistics International Travel Account International Border Crossings Accommodations Travel Price Index Tourism-Related Employment Food Service
The Benefits of Tourism
 The Benefits of Tourism The Benefits of Tourism Diversification of tourism industry infrastructure Contributions to the balance of payments Increase in tax revenues Improved job opportunities Improved
2010 Nova Scotia Visitor Exit Survey Regional Report
 2010 Nova Scotia Visitor Exit Survey Regional Report A Look at Visitors Who Included Cape Breton in their Trip to Nova Scotia Reproduction in whole or in part is not permitted without the express permission
Tourism Snapshot Year-in-review. Facts & Figures 6th edition.
 Tourism Snapshot 2011 Year-in-review www.canada.travel/corporate Facts & Figures 6th edition Tourism in the Canadian Economy Tourism Demand (2011) $ billions 11/10 % Total demand 78.8 7.5 Domestic 63.7
NAPA VALLEY VISITOR INDUSTRY 2016 Economic Impact Report
 NAPA VALLEY VISITOR INDUSTRY 2016 Economic Impact Report Research prepared for Visit Napa Valley by Destination Analysts, Inc. Table of Contents S E C T I O N 1 Introduction 2 S E C T I O N 2 Executive
The Economic Impact of Tourism on the District of Thanet 2011
 The Economic Impact of Tourism on the District of Thanet 2011 Prepared by: Tourism South East Research Unit 40 Chamberlayne Road Eastleigh Hampshire SO50 5JH CONTENTS 1. Summary of Results 1 2. Table of
2017 NOVA SCOTIA VISITOR EXIT SURVEY. Overall Results
 2017 NOVA SCOTIA VISITOR EXIT SURVEY Overall Results TABLE OF CONTENTS Introduction... 1 Visitor Profile... 3 Visitor Expenditures... 28 Accommodations... 37 Visitor Activities... 49 Satisfaction... 60
The Economic Impact of Tourism on Scarborough District 2014
 The Economic Impact of Tourism on Scarborough District 2014 Prepared by: Tourism South East Research Unit 40 Chamberlayne Road Eastleigh Hampshire SO50 5JH CONTENTS 1. Summary of Results 1 2. Table of
The Travel and Tourism Industry in Vermont. A Benchmark Study of the Economic Impact of Visitor Expenditures on the Vermont Economy 2005
 The Travel and Tourism Industry in Vermont A Benchmark Study of the Economic Impact of Visitor Expenditures on the Vermont Economy 2005 INTRODUCTION GENERAL November, 2006 This 2005 update of the original
The Economic Impact of Tourism in Maryland. Tourism Satellite Account Calendar Year 2015
 The Economic Impact of Tourism in Maryland Tourism Satellite Account Calendar Year 2015 MD tourism economy reaches new peaks The Maryland visitor economy continued to grow in 2015; tourism industry sales
Presented by: Ms. Kanageswary Ramasamy Department of Statistics, Malaysia February 2017
 Presented by: Ms. Kanageswary Ramasamy Department of Statistics, Malaysia 14-16 February 2017 1 INTRODUCTION 2 INTERNATIONAL RECOMMENDATIONS ON TOURISM STATISTICS (IRTS) 2008 3 RECOMMENDED METHODOLOGICAL
2001 PACKAGED TRAVEL IN NORTH AMERICA TRAVELER PROFILE AND ECONOMIC IMPACTS
 00 PACKAGED TRAVEL IN NORTH AMERICA TRAVELER PROFILE AND ECONOMIC IMPACTS November 00 Prepared for National Tour Association PACKAGED TRAVEL IN NORTH AMERICA TRAVELER PROFILE AND ECONOMIC IMPACTS, 00
Tourism Satellite Account: Demand-Supply Reconciliation
 Tourism Satellite Account: Demand-Supply Reconciliation www.statcan.gc.ca Telling Canada s story in numbers Demi Kotsovos National Economic Accounts Division Statistics Canada Regional Workshop on the
NAPA VALLEY VISITOR INDUSTRY 2014 Economic Impact Report
 NAPA VALLEY VISITOR INDUSTRY 2014 Economic Impact Report Research prepared for Visit Napa Valley by Destination Analysts, Inc. Table of Contents SECTION 1 Introduction 2 SECTION 2 Executive Summary 5 SECTION
The Benefits of Tourism
 The Benefits of Tourism The Benefits of Tourism Diversification of tourism industry infrastructure Contributions to the balance of payments Increase in tax revenues Improved job opportunities Improved
Chris Jones. Director - Strategic Initiatives Department of Economic Development and Tourism October 25, 2018
 Chris Jones Director - Strategic Initiatives Department of Economic Development and Tourism October 25, 2018 World Tourism Economy - 2017 1.33 Billion Intl Tourist Arrivals (+7%) highest increase since
Canadian Travel Survey
 Catalogue no. 87-212-XIE Canadian Travel Survey Domestic Travel, 2002 How to obtain more information Specific inquiries about this product and related statistics or services should be directed to: Client
Tourism Satellite Account Calendar Year 2016
 Tourism Satellite Account Calendar Year 2016 Key Definitions 1. Tourism/Tourist: Refers to the leisure travel/traveler segment. 2. Travel/Traveler: Includes both leisure and business travel/travelers.
The Economic Impact of Tourism New Forest Prepared by: Tourism South East Research Unit 40 Chamberlayne Road Eastleigh Hampshire SO50 5JH
 The Economic Impact of Tourism New Forest 2008 Prepared by: Tourism South East Research Unit 40 Chamberlayne Road Eastleigh Hampshire SO50 5JH CONTENTS Glossary of terms 1 1. Summary of Results 4 2. Table
Tourism in Canadian Rockies Tourism Destination Region. A Summary of 2006 Visitor Numbers and Characteristics
 Tourism in Canadian Rockies Tourism Destination Region A Summary of 2006 Visitor Numbers and Characteristics November 2009 Introduction Whether to see their friends and relatives, for business, or for
Tourism Kelowna Visitor Intercept Survey Findings by Season FINAL DRAFT REPORT
 Tourism Kelowna Visitor Intercept Survey Findings by Season FINAL DRAFT REPORT January 17, 2017 1 Table of Contents Executive Summary... 3 Methodology.. 7 Visitor Intercept Survey Findings.. 9 Visitor
The Economic Impact of Tourism Brighton & Hove Prepared by: Tourism South East Research Unit 40 Chamberlayne Road Eastleigh Hampshire SO50 5JH
 The Economic Impact of Tourism Brighton & Hove 2013 Prepared by: Tourism South East Research Unit 40 Chamberlayne Road Eastleigh Hampshire SO50 5JH CONTENTS 1. Summary of Results 1 1.1 Introduction 1 1.2
NAPA VALLEY VISITOR INDUSTRY 2012 Economic Impact Report
 Join Visit Napa Valley NAPA VALLEY VISITOR INDUSTRY 2012 Economic Impact Report Research prepared for Visit Napa Valley by Destination Analysts, Inc. Table of Contents SECTION 1 Introduction 2 SECTION
Economic Impact of Tourism in Hillsborough County September 2016
 Economic Impact of Tourism in Hillsborough County - 2015 September 2016 Key findings for 2015 Almost 22 million people visited Hillsborough County in 2015. Visits to Hillsborough County increased 4.5%
The Economic Impact of Tourism on Calderdale Prepared by: Tourism South East Research Unit 40 Chamberlayne Road Eastleigh Hampshire SO50 5JH
 The Economic Impact of Tourism on Calderdale 2015 Prepared by: Tourism South East Research Unit 40 Chamberlayne Road Eastleigh Hampshire SO50 5JH CONTENTS 1. Summary of Results 1 2. Table of Results Table
The Economic Impact of Tourism in: Dane County & Madison, Wisconsin. April 2017
 The Economic Impact of Tourism in: Dane County & Madison, Wisconsin April 2017 Key themes for 2016 Visitor spending continued growing in Dane County, Wisconsin in 2016, growing 5.2% to surpass $1.2 billion.
Tourism snapshot Canadian Tourism Commission
 Canadian Tourism Commission Commission canadienne du tourisme Tourism snapshot www.canada.travel A focus on the markets that the CTC and its partners are active in Volume 5, Issue 04 Key highlights Following
Yukon Tourism Indicators Year-End Report Yukon Tourism Indicators Year-End Report 2015
 Yukon Tourism Indicators Overview The Yukon Tourism Indicators is published by the Department of Tourism and Culture as a companion to the monthly Yukon Tourism Visitation Report. This document is intended
The Travel & Tourism Industry in Vermont
 The Travel & Tourism Industry in Vermont A Benchmark Study of the Economic Impact of Visitor Expenditures on the Vermont Economy 2003 Prepared by: Introduction In 2003 Establishing clear and useful performance
The Economic Impact of Tourism in North Carolina. Tourism Satellite Account Calendar Year 2015
 The Economic Impact of Tourism in North Carolina Tourism Satellite Account Calendar Year 2015 Key results 2 Total tourism demand tallied $28.3 billion in 2015, expanding 3.6%. This marks another new high
Northern Ontario Passenger Vehicle Travel Profile
 TRANSPORTATION Final Report The Preparation of a Northern Ontario Passenger and Commercial Vehicle Origin-Destination Survey Northern Ontario Passenger Vehicle Travel Profile Submitted to Ministry of Transportation,
2016 ANNUAL REPORT. Report Data
 Massachuset ts Office of Travel & Tourism 2016 ANNUAL REPORT Published May 2017 Charlie Baker Governor Karyn Polito Lt. Governor Jay Ash Secretary Executive Office of Housing and Economic Development Report
Tourism in Alberta South Tourism Destination Region. A Summary of 2006 Visitor Numbers and Characteristics
 Tourism in South Tourism Destination Region A Summary of 2006 Visitor Numbers and Characteristics November 2009 Introduction Whether to see their friends and relatives, for business, or for pleasure, 2.76
For some years, tourism industry stakeholders have
 Catalogue no. 87-003-XPB Volume 16, Number 1 National Tourism Indicators: A New Tool for Analysing Tourism in Canada Winter 1997 by Lise Beaulieu-Caron For some years, tourism industry stakeholders have
The Economic Impact of Tourism in Buncombe County, North Carolina
 The Economic Impact of Tourism in Buncombe County, North Carolina 2017 Analysis September 2018 Introduction and definitions This study measures the economic impact of tourism in Buncombe County, North
Impacts of Visitor Spending on the Local Economy: George Washington Birthplace National Monument, 2004
 Impacts of Visitor Spending on the Local Economy: George Washington Birthplace National Monument, 2004 Daniel J. Stynes Department of Community, Agriculture, Recreation and Resource Studies Michigan State
2017 VISITOR STATISTICS WASHINGTON, DC
 2017 VISITOR STATISTICS WASHINGTON, DC TOTAL VISITATION TO WASHINGTON, DC WASHINGTON, DC (DISTRICT OF COLUMBIA) VISITORS (IN MILLIONS) 20 15 10 5 Overseas Domestic 14.9 1.0 13.9 15.9 1.1 16.6 16.3 1.4
The Economic Impact of Tourism Brighton & Hove Prepared by: Tourism South East Research Unit 40 Chamberlayne Road Eastleigh Hampshire SO50 5JH
 The Economic Impact of Tourism Brighton & Hove 2014 Prepared by: Tourism South East Research Unit 40 Chamberlayne Road Eastleigh Hampshire SO50 5JH CONTENTS 1. Summary of Results 1 1.1 Introduction 1 1.2
The Economic Impact of Tourism Eastbourne Prepared by: Tourism South East Research Unit 40 Chamberlayne Road Eastleigh Hampshire SO50 5JH
 The Economic Impact of Tourism Eastbourne 2016 Prepared by: Tourism South East Research Unit 40 Chamberlayne Road Eastleigh Hampshire SO50 5JH CONTENTS Page 1. Summary of Results 1 1.1 Introduction 1 1.2
Temecula Valley Travel Impacts p
 Temecula Valley Travel Impacts 2000-2017p photo courtesy of Temecula Valley Convention and Visitors Bureau May 2018 Prepared for the Temecula Valley Convention and Visitors Bureau Temecula, California
Wyoming Travel Impacts
 Wyoming Travel Impacts 2000-2013 Wyoming Office of Tourism April 2014 Prepared for the Wyoming Office of Tourism Cheyenne, Wyoming The Economic Impact of Travel on Wyoming 2000-2013 Detailed State and
Report on Palm Beach County Tourism Fiscal Year 2007/2008 (October 2007 September 2008)
") Report on Palm Beach County Tourism Fiscal Year 2007/2008 (October 2007 September 2008) Prepared for: Tourist Development Council of Palm Beach County Prepared by: 4020 S. 57 th Avenue Lake Worth, FL 33463
Report on Palm Beach County Tourism Fiscal Year 2007/2008 (October 2007 September 2008) Prepared for: Tourist Development Council of Palm Beach County Prepared by: 4020 S. 57 th Avenue Lake Worth, FL 33463
The Economic Impact of Tourism on Galveston Island, Texas
 The Economic Impact of Tourism on Galveston Island, Texas 2017 Analysis Prepared for: Headline Results Headline results Tourism is an integral part of the Galveston Island economy and continues to be a
TOURISM AS AN ECONOMIC ENGINE FOR GREATER PHILADELPHIA
 TOURISM AS AN ECONOMIC ENGINE FOR GREATER PHILADELPHIA 2015 Visitation and Economic Impact Report FINAL REPORT SUBMITTED TO: VISIT PHILADELPHIA 30 S. 17 th St, Suite 2010 Philadelphia, PA 19103 FINAL REPORT
Tourism in Alberta Central Tourism Destination Region. A Summary of 2006 Visitor Numbers and Characteristics
 Tourism in Central Tourism Destination Region A Summary of 2006 Visitor Numbers and Characteristics November 2009 Introduction Whether to see their friends and relatives, for business, or for pleasure,
Temecula Valley Travel Impacts
 Temecula Valley Travel Impacts 2000-2013p photo courtesy of Temecula Valley Convention and Visitors Bureau June 2014 Prepared for the Temecula Valley Convention and Visitors Bureau Temecula, California
2009 Muskoka Airport Economic Impact Study
 2009 Muskoka Airport Economic Impact Study November 4, 2009 Prepared by The District of Muskoka Planning and Economic Development Department BACKGROUND The Muskoka Airport is situated at the north end
Tourism Snapshot A focus on the markets that the CTC and its partners are active in Ontario June 2011 Volume 7, Issue 6
 Tourism Snapshot Ontario A focus on the markets that the CTC and its partners are active in www.canada.travel/corporate June 2011 Volume 7, Issue 6 Key highlights In June 2011, overnight travel to Canada
Tourism Snapshot. A focus on the markets in which the CTC and its partners are active. October 2012 Volume 8, Issue 10.
 Tourism Snapshot Niagara Helicopters Tour A focus on the markets in which the CTC and its partners are active www.canada.travel/corporate October 2012 Volume 8, Issue 10 Total arrivals from CTC s international
Canadian Tourism Satellite Account Demystified
 Canadian Tourism Satellite Account Demystified Charles Morissette R & D Projects and Analysis Section Income and Expenditure Division Presentation for TTRA Conference October, 2010 Outline The economic
2010 Nova Scotia Visitor Exit Survey Regional Report
 2010 Nova Scotia Visitor Exit Survey Regional Report A Look at Visitors Who Included Yarmouth and Acadian Shores in their Trip to Nova Scotia Reproduction in whole or in part is not permitted without the
RESEARCH AND PLANNING FORT STEELE HERITAGE TOWN VISITOR STUDY 2007 RESULTS. May 2008
 RESEARCH AND PLANNING FORT STEELE HERITAGE TOWN VISITOR STUDY 2007 RESULTS May 2008 Research and Planning Tourism British Columbia 300-1803 Douglas St. Box 9830 Stn. Prov. Gov t. Victoria, BC V8W 9W5 Web:
The Economic Impact of Travel in Minnesota Analysis
 The Economic Impact of Travel in Minnesota 2013 Analysis Overview 2013 Highlights Traveler Spending Traveler spending of $10.3 billion generated $17.6 billion in total business sales in 2013 as travel
Wyoming Travel Impacts
 Wyoming Travel Impacts 2000-2014 Wyoming Office of Tourism April 2015 Prepared for the Wyoming Office of Tourism Cheyenne, Wyoming The Economic Impact of Travel on Wyoming 2000-2014 Detailed State and
Tourism Kelowna Visitor Intercept Survey Findings FINAL DRAFT REPORT
 Tourism Kelowna Visitor Intercept Survey Findings FINAL DRAFT REPORT January 17, 2017 1 Table of Contents Executive Summary... 3 Methodology.. 7 Visitor Intercept Survey Findings.. 9 Visitor Profile. 9
The Economic Impact of Tourism in North Carolina. Tourism Satellite Account Calendar Year 2013
 The Economic Impact of Tourism in North Carolina Tourism Satellite Account Calendar Year 2013 Key results 2 Total tourism demand tallied $26 billion in 2013, expanding 3.9%. This marks another new high
Tourism Statistics
 Tourism Statistics 2006-2010 TABLE OF CONTENTS FOREWORD 4 DEFINITIONS 5 STATISTICAL SUMMARY FOR 2010 6 INTERNATIONAL TOURIST ARRIVALS 7 International Tourist Arrivals: 1994-2010 7 International Tourist
The Economic Impact of ATV Tourism in New Brunswick by NBATVF Trail Permit Holders
 The Economic Impact of ATV Tourism in New Brunswick by NBATVF Trail Permit Holders 2010 2011 New Brunswick Department of Culture, Tourism and Healthy Living May 17, 2012 Table of Contents Table of Contents...
Tourism Snapshot A Monthly Monitor of the Performance of Canada s Tourism Industry
 Tourism Snapshot A Monthly Monitor of the Performance of Canada s Tourism Industry September Volume 14, Issue 8 Tourism Toronto www.destinationcanada.com Tourism Snapshot September 1 KEY HIGHLIGHTS IMPORTANT
Innovations Days April 24, 2012
 Innovations Days April 24, 2012 Learn about our visitors 10 visitor segments similarities & differences what they do while here The reasons visitors come to NS Business Other Pleasure Visit Friends & Relatives
The Economic Impact of Tourism in Hillsborough County, June 2018
 The Economic Impact of Tourism in Hillsborough County, 2017 June 2018 Table of contents 1) Key Findings for 2017 3 2) Local Tourism Trends 7 3) Trends in Visits and Spending 12 4) The Domestic Market 19
2017 ANNUAL REPORT. Report Data
 Massachuset ts Office of Travel & Tourism 2017 ANNUAL REPORT Published April 2018 Charlie Baker Governor Karyn Polito Lt. Governor Jay Ash Secretary Executive Office of Housing and Economic Development
2016 VISITOR STATISTICS WASHINGTON, DC
 2016 VISITOR STATISTICS WASHINGTON, DC TOTAL VISITATION TO WASHINGTON, DC WASHINGTON, DC (DISTRICT OF COLUMBIA) VISITORS (IN MILLIONS) 20 15 10 Overseas Domestic 15.1 14.9 1.0 1.0 14.1 13.9 18.3 19.0 17.8
LOCAL AREA TOURISM IMPACT MODEL. Wandsworth borough report
 LOCAL AREA TOURISM IMPACT MODEL Wandsworth borough report London Development Agency May 2008 CONTENTS 1. Introduction... 3 2. Tourism in London and the UK: recent trends... 4 3. The LATI model: a brief
Maine Office of Tourism Visitor Tracking Research 2015 Calendar Year Annual Report Canadian Visitors
 Maine Office of Tourism Visitor Tracking Research 2015 Calendar Year Annual Report Prepared by May 2016 1 1 Table of Contents Research Objectives and Methodology 4 Canadian Overnight Visitors: Traveler
Domestic Tourism to South West Wales in 2006, 2007 and 2008 Factsheet
 Domestic Tourism to South West Wales in 2006, 2007 and 2008 Factsheet Introduction Published June 2009 This factsheet provides summary tables of key tourism figures to South West Wales in 2006, 2007 and
Cedar Rapids Area Convention and Visitors Bureau Visitor Study
 Cedar Rapids Area Convention and Visitors Bureau Visitor Study 2003-2004 University of Northern Iowa Sustainable Tourism & The Environment Program www.uni.edu/step Project Directors: Sam Lankford, Ph.D.
Northern Rockies District Value of Tourism Research Project December 2007
 Northern Rockies District Value of Tourism Research Project December 2007 Project Partners: Northern Rockies Regional District, Tourism British Columbia, Northern Rockies Alaska Highway Tourism Association,
Economic Impact of Tourism in South Dakota, December 2018
 Economic Impact of Tourism in South Dakota, 2018 December 2018 1) Key Findings Growth rebounds in 2018 as a strong hunting season drives tourism growth Key facts about South Dakota s tourism sector Key