Foreign overnight stays 31% Domestic overnight stays 69% 8.3 MILLION FOREIGN VISITORS IN FINLAND IN 2017
|
|
|
- Priscilla Booth
- 5 years ago
- Views:
Transcription

1
 OF FOREIGN VISITORS IN 217: 21.")


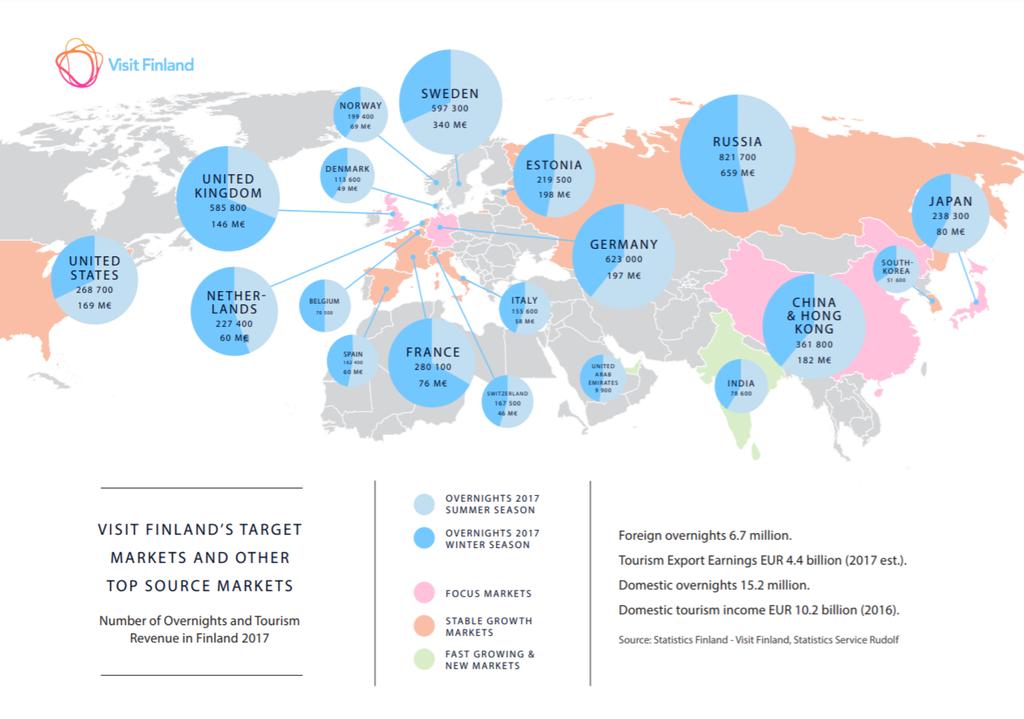
2 TOURISM IS A GROWING SOURCE OF EXPORT REVENUE AND A SIGNIFICANT EMPLOYMENT PROVIDER IN FINLAND TOURISM HAS A MULTIPLIER EFFECT ON OTHER SECTORS. 1 EURO IN TOURISM ADDS 56 CENTS VALUE TO THE OTHER SECTORS. OVERNIGHT STAYS (6.7 MILLION) OF FOREIGN VISITORS IN 217: 21.9 MILLION OVERNIGHT STAYS AT FINNISH ACCOMMODATION Russia 1 America 6% Other countries 1 EU-28 5 Foreign overnight stays 3 Asia 16% Domestic overnight stays 69% 8.3 MILLION FOREIGN VISITORS IN FINLAND IN 217 SPENDING PER VISIT IN China EUR 1, Spain EUR Belgium EUR France EUR India EUR USA EUR South Korea EUR Japan EUR Australia EUR Canada EUR 516 BREAKDOWN OF CONSUMPTION BY FOREIGN VISITORS IN 217 Other countries 3 Russia 2 Japan Estonia UK China 17% Sweden 8% Germany 6% Sources: Visit Finland, Statistics Finland
3
4 German Market Volume Population 83 million people Outbound travel from Germany 18 million arrivals to all destinations in 217 +,5% compared to 216 Ø Europe s share of German outbound travel is 88% Ø Finland s share of German outbound travel is,5% Travel expenditure (total outbound travel from Germany) 72 billion EUR German Overnights and Change % in Finland % % 9% % 2% 15% 1% 5% % -5% -1% Expenditure (billions)* Forecast for German Global outbound travel and Expenditure in foreign countries 8% 5% *Speding by residents on travel in foreign countries. EUR (billions) Arrivals (s) German global outbound travel is forecasted to reach 127 million arrivals by 223 and German residents spending is forecasted at 84 billion Euros Arrivals (s) Nights Spent % change y/y Source UNWTO/Statistics Finland/Eurostat/IMF Balance of Payments, Visit Finland StatisticsService Rudolf, StatisticsFinland


 No.")


5 German travelers Which part of Germany are the visitors from Finland s image in Germany Year , +15% 2 Finland top of mind Top words describing Finland s image in Germany Spending per trip Baden-Württemberg 9% Hessen 8 % Lower Saxony Nordrhein-Westfalen 9% Other Germany 15% German visitor rankings in Finland No. 2 in overnights in 217 (623, +15%) No. 4 in travel receipts in 217 ( 197 million, +1) Share of overnights by regions % 18% 27% Helsinki and Lapland areas with majority of the registered overnights 6% 38% 26% 5% Lakeland area?: summer cottages which are not registered in the statistics Sources: Visit Finland Statistics Service Rudolf, Statistics Finland Visit Finland Segmentation Survey 217 Visit Finland Visitor Survey 217
: 38 9 (+17%) 3 Germany 25 62 % 2 37% 38 % 19% 15 1 5 21 211 212 213 214 215 216")
 6% 35% 7% 5% 39% Source: Visit Finland Statistics Service Rudolf, Statistics")
6 German overnights in Finland Winter and Summer 217 Winter (Nov-Apr): (+1) Summer (May-Oct): 38 9 (+17%) 3 Germany % 2 37% 38 % 19% High winter season (12-2) Spring season (3-5) High summer season (6-8) Autumn season (9-11) 6% 35% 7% 5% 39% Source: Visit Finland Statistics Service Rudolf, Statistics Finland


 115 +6%")

 274 +18% Autumn")


7 German overnights in Finland Seasonal overnights in 217 Year 217 Whole Finland No. of German overnights in Finland vs. 216 Winter (Dec-Feb) Spring (Mar-May) % Kittilä/Levi 2 Rovaniemi 19% Muonio 17% Inari/Saariselkä 1 Sodankylä 9% Kolari/Ylläs 8% Summer (Jun-Aug) % Autumn (Sep-Nov) 14 +2% German overnights in Finland by season in 217 Turku 2% Oulu 1% Rauma 7% Pori 7% Tampere 16% Jyväskylä 1 Savonlinna 1% Kuopio reg. 8% Lahti 6% Mikkeli reg. 6% Uusimaa (excl. greater Helsinki area) 18% Aland 9% Helsinki 8 Source: Rudolf data base, Statistics Finland
8 German visitors in Finland German overnights in Finland by month German overnights by monthly change % % 8 2% 6 1% 4 % 2-1% January February Ma rch April Ma y June July August September October November December -2% January February Ma rch April Ma y June July August September October November December Source: Visit Finland Statistics Service Rudolf, Statistics Finland


9 Germany Nordic countries' share of German overnights 217 Iceland % 3 Development of German overnights Sweden % Norway % Denmark % Finland % Denmark Finland Norway Sweden Iceland 5% German overnights, change % Change 217/16 Average annual change % 5% % % -6% Denmark Finland Norway Sweden Iceland
10 Germany German overnights in the Nordic countries, winter season (Dec-Apr) German overnights in the Nordic countries, summer season (Jun-Aug) Denmark Finland Norway Sweden Denmark Finland Norway Sweden Change of German overnights by season 217/16 Winter (Dec-Apr) Summer (Jun-Aug) 18% Corresponding seasonal overnights not available for Iceland 1 1 5% 7% - - Denmark Finland Norway Sweden Sources: Visit Finland Statistics Service Rudolf, Statistics Finland Statistics Sweden, Norway and Denmark 1

11 German internet searches regarding Finland M1 German internet searches and overnights by month 216M2 216M3 216M4 216M5 216M6 216M7 216M8 216M9 216M1 Searches 216M11 216M12 217M1 217M2 217M3 Overnights Graph indicating all German overnights in Finland in relation to internet searches regarding Finland 217M4 217M5 217M6 217M7 217M8 217M9 217M1 217M11 217M January Online searches by Germans regarding Finland February Ma rch April Ma y June July August September October November December All online travel and tourism related searches conducted by Germans regarding Finland Source: Visit Finland Statistics Service Rudolf, Statistics Finland, Digital Demand, MyStay


 Experienced during the trip Finnish sauna")


12 German visitors in Winter (Nov-April) PURPOSE OF TRAVEL Study or training 16 % Other reason 2 % Transit 4 % Holiday trip 3 % A German traveler spends on average 65 per trip during winter. Age group German visitors activities and interests, Winter (Nov-April) Experienced during the trip Finnish sauna Buildings, castles, monuments, museums Intererested but did not experience during the trip 37% 46% 2 1 Visiting friends or relatives 21 % Business trip 27 % TRAVEL COMPANY 28% 2 19% 2% 5% 5% over 64 Winter sports Duration Accommodation Walking, hiking, camping in nature Finnish culinary experiences National parks Other winter activities and experiences Shopping 3 27% 45% 1% 19% % 37% Alone Spouse/Partner only Group of friends Immediate family (household with kids) Extended family (with family members outside Other company 17% 16% 16% 47% 6 days or more 45 % 1 day 7 % 2 days 1 % 4-5 days 18 % 3 days 2 % Rental flat (incl. Airbnb) 2 % Other 16 % Camping area, hostel or rented cottage 14 % Hotel or motel 41 % Friends or relatives 9 % Finnish summer cottages Cultural events Other outdoor activities Sport events Concerts and music festivals Biking, mountaing biking Family destinations Wellness services and treatments % 15% 1 19% 1 1 6% 2% 16% 9% 1 9% Note: the figures on this slide are not definite but directional figures. Winter N=247 Source: VF Visitor Survey 217


 Extended family (with")

 12 % Friends or relatives 24 % Hotel or motel 4 % Cultural events Finnish summer")

13 German visitors in Summer (May-Oct) Visiting friends or relatives 18 % PURPOSE OF TRAVEL Study or training 5 % Transit 8 % Health and medicalcare 3 % Business trip 21 % Holiday trip 45 % A German traveler spends on average 294 per trip during summer. 17% 28% Age group 2 16% 7% over 64 German visitors activities and interests, Summer (May-Oct) Experienced during the trip Buildings, castles, monuments, museums Finnish culinary experiences Finnish sauna Walking, hiking, camping in nature Other outdoor activities Other winter activities and experiences National parks Intererested but did not experience during the trip 28% 29% 28% 2 49% 4 6% 16% 2 2 2% 1 1 TRAVEL COMPANY Duration Accommodation Shopping 3 Alone Spouse/Partner only Group of friends Immediate family (household with kids) Extended family (with family members outside the Other company 1 16% 2% 25% 3 6 days or more 35 % 4-5 days 24 % 1 day 8 % 2 days 11 % 3 days 22 % Other 4 % Camping area, hostel or rented cottage 2 % Rental flat (incl. Airbnb) 12 % Friends or relatives 24 % Hotel or motel 4 % Cultural events Finnish summer cottages Winter sports % Concerts and music festivals Biking, mountaing biking Wellness services and treatments 1 1 5% 8% 1 7% 2 17% Sport events 1 17% 16% Family destinations 7% Note: the figures on this slide are not definite but directional figures. Summer N=44 Source: VF Visitor Survey 217
America 6% Russia 12%
 TOURISM IS A GROWING SOURCE OF EXPORT REVENUE AND A SIGNIFICANT EMPLOYMENT PROVIDER IN FINLAND TOURISM HAS A MULTIPLIER EFFECT ON OTHER SECTORS. 1 EURO IN TOURISM ADDS 56 CENTS VALUE TO THE OTHER SECTORS.
Japan 3% Foreign overnight stays 31% Domestic overnight stays 69% 8.3 MILLION FOREIGN VISITORS IN FINLAND IN 2017
 TOURISM IS A GROWING SOURCE OF EXPORT REVENUE AND A SIGNIFICANT EMPLOYMENT PROVIDER IN FINLAND TOURISM HAS A MULTIPLIER EFFECT ON OTHER SECTORS. 1 EURO IN TOURISM ADDS 56 CENTS VALUE TO THE OTHER SECTORS.
China 17% Foreign overnight stays 31% Domestic overnight stays 69% 8.3 MILLION FOREIGN VISITORS IN FINLAND IN 2017
 TOURISM IS A GROWING SOURCE OF EXPORT REVENUE AND A SIGNIFICANT EMPLOYMENT PROVIDER IN FINLAND TOURISM HAS A MULTIPLIER EFFECT ON OTHER SECTORS. 1 EURO IN TOURISM ADDS 56 CENTS VALUE TO THE OTHER SECTORS.
Russia 12% Russia 24% Foreign overnight stays 31% Domestic overnight stays 69% 8.3 MILLION FOREIGN VISITORS IN FINLAND IN 2017
 TOURISM IS A GROWING SOURCE OF EXPORT REVENUE AND A SIGNIFICANT EMPLOYMENT PROVIDER IN FINLAND TOURISM HAS A MULTIPLIER EFFECT ON OTHER SECTORS. 1 EURO IN TOURISM ADDS 56 CENTS VALUE TO THE OTHER SECTORS.
Visit Tampere partners - verkosto Visit Finland Japan activities
 Visit Tampere partners - verkosto Visit Finland Japan activities 4.10.2018 VF main messages - Japan Northern lights and nature Northern Lights Soft activities in pure nature Finnish nature lifestyle Healing
Spain. Spanish Visitors in Finland Statistical Trends and Profile
 Spain M A R K E T R E V I E W 2 0 1 5 Spanish Visitors in Finland Statistical Trends and Profile 25.10.2016 STATISTICS ON SPANISH TOURISM IN FINLAND STATISTICAL TRENDS 3 Registered overnights 4 Number
South Korea. South-Korean Visitors in Finland Statistical Trends and Profile
 South Korea M A R K E T R E V I E W 2 0 1 5 South-Korean Visitors in Finland Statistical Trends and Profile 14.10.2016 STATISTICS ON KOREAN TOURISM IN FINLAND STATISTICAL TRENDS 3 Registered overnights
Belgium. Belgian Visitors in Finland Statistical Trends and Profile
 Belgium M A R K E T R E V I E W 2 0 1 5 Belgian Visitors in Finland Statistical Trends and Profile 24.10.2016 STATISTICS ON BELGIAN TOURISM IN FINLAND STATISTICAL TRENDS 3 Registered overnights 4 Number
Norway MARKET REVIEW Norwegian Visitors in Finland Statistical Trends and Profile
 Norway MARKET REVIEW 2015 Norwegian Visitors in Finland Statistical Trends and Profile 24.11.2016 STATISTICS ON NORWEGIAN TOURISM IN FINLAND STATISTICAL TRENDS 3 Registered overnights 4 Number of visitors
France. French Visitors in Finland Statistical Trends and Profile
 France M A R K E T R E V I E W 2 0 1 5 French Visitors in Finland Statistical Trends and Profile 14.10.2016 STATISTICS ON FRENCH TOURISM IN FINLAND STATISTICAL TRENDS 3 Registered overnights 4 Number of
Sweden. Swedish Visitors in Finland Statistical Trends and Profile
 Sweden M A R K E T R E V I E W 2 0 1 5 Swedish Visitors in Finland Statistical Trends and Profile 26.10.2016 STATISTICS ON SWEDISH TOURISM IN FINLAND STATISTICAL TRENDS 3 Registered overnights 4 Number
Visit Finland Visitor Survey 2017
 Visit Finland Visitor Survey 2017 Visit Finland Studies 9 Business Finland, Visit Finland Helsinki 2018 Foreign visitors in Finland in 2017 Contents Abstract 5 Introduction 7 Trips to Finland 10 Day and
Accommodation statistics 2016
 Transport and Tourism 2017 Accommodation statistics 2016 Demand for accommodation services grew by 3 per cent in 2016 In 2016, accommodation in Finland recorded 203 million overnight stays, of which domestic
Accommodation statistics
 Transport and Tourism 20 Accommodation statistics 20 August Nights spent by foreign tourists in Finland increased by 14 per cent in August The number of recorded nights spent by foreign tourists at Finnish
Accommodation statistics
 Transport and Tourism 2012 Accommodation statistics 2012, October Nights spent by foreign tourists in Finland up by 36 per cent in October 2012 The number of recorded nights spent by foreign tourists at
total - foreign overnights - domestic overnights
 TOURISM IN ESTONIA IN 214 TOURISM IN ESTONIA IN 214 (updated in Sept. 216) 1 In 214, 3.1 million foreign and domestic tourists stayed overnight in the accommodation establishments of Estonia (3.6% more
Accommodation statistics
 Transport and Tourism 201 Accommodation statistics 201, September Nights spent by foreign tourists in Finland up by 11.3 per cent in September 201 Nights spent by foreign tourists at Finnish accommodation
Accommodation statistics
 Transport and Tourism 201 Accommodation statistics 201, October Nights spent by non-resident tourists up by 12.3 per cent in October 201 Nights spent by foreign tourists at Finnish accommodation establishments
Accommodation statistics
 Transport and Tourism 2018 Accommodation statistics 2018, January Nights spent by foreign tourists in Finland grew by 6.6 per cent in January 2018 Corrected on 8 March 2018. The corrected number is indicated
Foreign Overnights in Finland 2016
 Foreign Overnights in Finland 2016 June 14, 2017 First name Last name 2 Positive outlook for Finland growing flows of visitors from several markets FOREIGN OVERNIGHTS 2016 5.8 million +4.7% growth 2016
THE GROWTH OF THE HOSPITALITY INDUSTRY IN DUBAI
 THE GROWTH OF THE HOSPITALITY INDUSTRY IN DUBAI THE DEFINITION OF TOURISM Tourism is travel for recreational, leisure or business purposes. The World Tourism Organization defines tourists as people "traveling
Overview of tourism trends in Tallinn. First quarter report in 2018
 Overview of tourism trends in Tallinn First quarter report in 2018 Visits of foreign residents to Tallinn, January - March 2018 Residents of foreign countries made 780 338 visits to Tallinn, which means
An overview of Tallinn tourism trends
 An overview of Tallinn tourism trends August 2015 The data is collected from Statistics Estonia, Tallinn Airport and Port of Tallinn. In August 2015, 179,338 stayed overnight in Tallinn s accommodation
India Market Report. Visit Finland India. Kalsi Gurpreet November
 India Market Report Visit Finland India Kalsi Gurpreet November 2017 14.11.2017 Semiannual Report - INDIA Summer season 2017 and outlook for winter 2017-2018 CONTENTS What factors have affected the results
Tourist arrivals and overnight stays in collective accommodation 1 July 2017 (p)
") Jul-16 Aug-16 Sep-16 Oct-16 Nov-16 Dec-16 Jan-17 Feb-17 Mar-17 Apr-17 May-17 Jun-17 Jul-17 MONTENEGRO STATISTICAL OFFICE R E L E A S E No: 158 Podgorica, 31 August 2017 When using the data please name
Jul-16 Aug-16 Sep-16 Oct-16 Nov-16 Dec-16 Jan-17 Feb-17 Mar-17 Apr-17 May-17 Jun-17 Jul-17 MONTENEGRO STATISTICAL OFFICE R E L E A S E No: 158 Podgorica, 31 August 2017 When using the data please name
Tourism Snapshot A focus on the markets in which the CTC and its partners are active
 Tourism Snapshot A focus on the markets in which the CTC and its partners are active www.canada.travel/corporate January 214 Volume 1, Issue 1 Key highlights Total arrivals from CTC s international markets
MARKET NEWSLETTER No 57 January 2012
 OVERVIEW OF INTRA-EUROPEAN UNION TRADING BETWEEN 2007/08 AND 2010/11 The data on intra-eu trade reported in this month s newsletter have been taken from the EUROSTAT database. However, it is important
Survey on arrivals and overnight stays of tourists, total 2017
 MONTENEGRO STATISTICAL OFFICE R E L E A S E No: 34/2 Podgorica, 1 June 2018 When using the data please name the source Survey on arrivals and overnight stays of tourists, total In Montenegro, in, tourist
Global Travel Trends 2005
 Preliminary World Travel Monitor Results from IPK international for the ITB Berlin Message, 03/10/06 Global Travel Trends 2005 Based on the new data from the 2005 World Travel Monitor, and as it does every
I T N E T R E N R A N T A I T ON O AL A L A R A R R I R VA V L A S L S A N A D N D D E D PA
 INTERNATIONAL ARRIVALS AND DEPARTURES July 2015 Government of Tonga SD18M-36 Statistical Bulletin Month of Change from Change from July 2015 Number previous month previous year All Arrivals 8,252-28.0
Tourism Statistics Region 1
 Tourism Statistics Region 1 Tourism Research Unit Winter 2011 1 Summary In 2008, there were 101.0 million visits in and visitors spent $17.6 billion residents account for the majority of visits and spending
INTERNATIONAL TRAVEL AND TOURISM
 INTERNATIONAL TRAVEL AND TOURISM YEAR 2014 1. INTRODUCTION This issue of the Economic and Social Indicators presents data on International Travel and Tourism for the year 2014. A brief on the compilation
Blue Mountains Visitors. International overnight, domestic overnight and domestic daytrip visitors. Sep-11. Jun-11. Sep-10. Dec-10. Dec-11.
 Dec-08 Mar-09 Jun-09 Sep-09 Dec-09 Mar-10 Jun-10 Sep-10 Dec-10 Mar-11 Jun-11 Sep-11 Dec-11 Mar-12 Jun-12 Sep-12 Dec-12 Mar-13 Jun-13 Sep-13 Dec-13 Mar-14 Jun-14 Sep-14 Visitors (000's) OVERVIEW LGA PROFILE
OVERVIEW Four year annual average to the year ending September 2014
 LGA PROFILE - OVERVIEW Total Visitors (overnight and domestic daytrip) (000's) 1,453 80,316 Total Overnight Visitors (000's) 749 28,105 Total Nights (000's) 2,728 154,563 Total Spend (overnight and domestic
AUCKLAND DESTINATION OVERVIEW
 AUCKLAND DESTINATION OVERVIEW JULY 218 An in-depth overview of Auckland s visitor economy from the latest arrival, accommodation, spend and cruise data through to past five-year commentary. Prepared August
AUCKLAND DESTINATION OVERVIEW
 AUCKLAND DESTINATION OVERVIEW JUNE 218 An in-depth overview of Auckland s visitor economy from the latest arrival, accommodation, spend and cruise data through to past five-year commentary. Prepared July
Residents ensure increase on overnight stays in hotels and similar establishments
 13 July 2018 Tourism Activity May 2018 Residents ensure increase on overnight stays in hotels and similar establishments Hotels and similar establishments registered 2.0 million guests and 5.4 million
OVERVIEW Four year annual average to the year ending September 2014
 Dec-08 Mar-09 Jun-09 Sep-09 Dec-09 Mar-10 Jun-10 Sep-10 Dec-10 Mar-11 Jun-11 Sep-11 Dec-11 Mar-12 Jun-12 Sep-12 Dec-12 Mar-13 Jun-13 Sep-13 Dec-13 Mar-14 Jun-14 Sep-14 Visitors (000's) LGA PROFILE - Port
Finnish Housing Markets and Housing Policy. Tommi Laanti Senior Analyst Ministry of the Environtment
 Finnish Housing Markets and Housing Policy Tommi Laanti Senior Analyst Ministry of the Environtment tommi.laanti@ymparisto.fi Housing Stock Right of occupancy is a form of co-operative housing, where resident
Tourism Snapshot A focus on the markets in which the CTC and its partners are active
 Tourism Snapshot A focus on the markets in which the CTC and its partners are active www.canada.travel/corporate June Volume 1, Issue 6 Key highlights CTC s overseas markets leaped 1% over the same month
OVERVIEW Four year annual average to the year ending September 2014
 Dec-08 Mar-09 Jun-09 Sep-09 Dec-09 Mar-10 Jun-10 Sep-10 Dec-10 Mar-11 Jun-11 Sep-11 Dec-11 Mar-12 Jun-12 Sep-12 Dec-12 Mar-13 Jun-13 Sep-13 Dec-13 Mar-14 Jun-14 Sep-14 Visitors (000's) LGA PROFILE - Great
Total expenditure by international tourists visiting Spain in August increases by 3.8% compared with the same month last year
 5 October 2016 Tourist Expenditure Survey August 2016. Provisional data Total expenditure by international tourists visiting Spain in August increases by 3.8% compared with the same month last year Average
OVERVIEW Four year annual average to the year ending September 2014
 Dec-08 Mar-09 Jun-09 Sep-09 Dec-09 Mar-10 Jun-10 Sep-10 Dec-10 Mar-11 Jun-11 Sep-11 Dec-11 Mar-12 Jun-12 Sep-12 Dec-12 Mar-13 Jun-13 Sep-13 Dec-13 Mar-14 Jun-14 Sep-14 Visitors (000's) LGA PROFILE - Newcastle
Latest Tourism Trends. Humphrey Walwyn Head of VisitEngland Research
 Latest Tourism Trends Humphrey Walwyn Head of VisitEngland Research 1 Inbound Tourism 2 2003 2004 2005 2006 2007 2008 2009 2010 2011 2012 2013 2014 2015 2016 2017 UK inbound long term trend Spend per visit
Western Cape Destination Performance Report: April-June 2016
 Number of arrivals (millions) Western Cape Destination Performance Report: April-June 2016 Global Tourism Performance According to the United Nations World Tourism Organisation, international tourist arrivals
Japan Market Report November 2018
 Japan Market Report November 2018 Visit Finland Country Representatives ShigeyoshiNoto and KoichiNumata Semiannual Report JAPAN Summer season 2018 and outlook for winter 2018-19 CONTENTS Factors affecting
OVERVIEW Four year annual average to the year ending September 2014
 LGA PROFILE - Tweed OVERVIEW Total Visitors (overnight and domestic daytrip) (000's) 1,444 80,316 Total Overnight Visitors (000's) 534 28,105 Total Nights (000's) 2,054 154,563 Total Spend (overnight and
Foreign overnights in the Nordic countries 2014
 Foreign overnights in the Nordic countries 2014 Sources: Statistics Statistics Statistics Statistics Visit March 2015 All figures are preliminary. 2 Contents Foreign overnights in the Nordic countries.4
Nearly 2.5 million nights recorded in Foreigners' share of nights over 60% Record set in 2000 HELSINKI TOURISM STATISTICS
 Year HELSINKI TOURISM STATISTICS FIGURE 1. Monthly overnights in Helsinki Nearly 2.5 million nights recorded in Nights spent at registered accommodation establishments in Helsinki totalled nearly 2.5 million
OVERVIEW Four year annual average to the year ending September 2014
 Dec-08 Mar-09 Jun-09 Sep-09 Dec-09 Mar-10 Jun-10 Sep-10 Dec-10 Mar-11 Jun-11 Sep-11 Dec-11 Mar-12 Jun-12 Sep-12 Dec-12 Mar-13 Jun-13 Sep-13 Dec-13 Mar-14 Jun-14 Sep-14 Visitors (000's) LGA PROFILE - Orange
Total expenditure by international tourists visiting Spain in March rose by 10.0% compared with the same month last year 1
 5 May 2016 Tourist Expenditure Survey March 2016. Provisional data Total expenditure by international tourists visiting Spain in March rose by 10.0% compared with the same month last year 1 Average expenditure
Total expenditure by international tourists visiting Spain in February increases by 2.9% compared with the same month of 2018
 02 April 2019 Total expenditure survey. Provisional data Total expenditure by international tourists visiting Spain in February increases by 2.9% compared with the same month of 2018 Average daily expenditure
OVERVIEW. Currently South Australia contributes $6.3 billion to the Australian tourism economy.
 OVERVIEW Currently contributes $6.3 billion to the Australian tourism economy. has achieved 79 per cent of its $8.0 billion maximum potential by 2020. $6.3b $6.5b $8b 2016 2017 2020 Annual Visitor Summary
Tourism in Eastern Scotland 2010 Edinburgh & Lothian's, Angus & Dundee, Perthshire and the Kingdom of Fife
 Tourism in Eastern 2010 Edinburgh & Lothian's, Angus & Dundee, Perthshire and the Kingdom of Fife Edinburgh & Lothians Summary It is estimated that in 2010, UK residents made 2.31m trips to Edinburgh and
Easter boosts results in tourism accommodation
 14 June 2017 Tourism Activity April 2017 Easter boosts results in tourism accommodation Hotel establishments recorded 1.9 million guests and 5.1 million overnight stays in April 2017, figures that relate
Asian stopovers in Nordic countries Optimistic perspectives. March 2018
 Asian stopovers in Nordic countries Optimistic perspectives March 2018 OUR COMMITMENT IS TO HAVE THE MOST PRECISE, UP-TO-DATE MARKETDATA ON TRAVELLERS JOURNEYS 30.238.647 Travellers monitored each day
Non residents boost hotel activity
 14 November 2017 Tourism Activity September 2017 Non residents boost hotel activity Hotel establishments recorded 2.2 million guests and 6.3 million overnight stays in September 2017, figures that relate
2017 VISITOR STATISTICS WASHINGTON, DC
 2017 VISITOR STATISTICS WASHINGTON, DC TOTAL VISITATION TO WASHINGTON, DC WASHINGTON, DC (DISTRICT OF COLUMBIA) VISITORS (IN MILLIONS) 20 15 10 5 Overseas Domestic 14.9 1.0 13.9 15.9 1.1 16.6 16.3 1.4
Growth in hotel activity supported by the external market
 14 August 2017 Tourism Activity June 2017 Growth in hotel activity supported by the external market Hotel establishments recorded 2.1 million guests and 5.9 million overnight stays in June 2017, figures
Germany Market Report May Visit Finland Marketing Representative Jyrki Oksanen
 Germany Market Report May 2018 Visit Finland Marketing Representative Jyrki Oksanen Semiannual Report GERMANY Winter season 2017-18 and outlook for summer 2018 CONTENTS Factors affecting the results of
OVERVIEW Four year annual average to the year ending September 2014
 Dec-08 Mar-09 Jun-09 Sep-09 Dec-09 Mar-10 Jun-10 Sep-10 Dec-10 Mar-11 Jun-11 Sep-11 Dec-11 Mar-12 Jun-12 Sep-12 Dec-12 Mar-13 Jun-13 Sep-13 Dec-13 Mar-14 Jun-14 Sep-14 Visitors (000's) LGA PROFILE - Tenterfield
OVERVIEW Four year annual average to the year ending September 2014
 Dec-08 Mar-09 Jun-09 Sep-09 Dec-09 Mar-10 Jun-10 Sep-10 Dec-10 Mar-11 Jun-11 Sep-11 Dec-11 Mar-12 Jun-12 Sep-12 Dec-12 Mar-13 Jun-13 Sep-13 Dec-13 Mar-14 Jun-14 Sep-14 Visitors (000's) LGA PROFILE - Snowy
Cooma-Monaro Visitors. International overnight, domestic overnight and domestic daytrip visitors. Sep-11. Sep-10. Jun-11. Dec-11. Dec-10.
 OVERVIEW LGA PROFILE - Cooma-Monaro Key Measures Cooma- Monaro NSW Total Visitors (overnight and domestic daytrip) (000's) 301 80,316 Total Overnight Visitors (000's) 119 28,105 Total Nights (000's) 346
AUCKLAND DESTINATION OVERVIEW
 AUCKLAND DESTINATION OVERVIEW AUGUST 218 An in-depth overview of Auckland s visitor economy from the latest arrival, accommodation, spend and cruise data through to past five- commentary. Prepared September
Tourism in South Africa A statistical overview
 Tourism in South Africa A statistical overview Purpose of presentation Purpose of the presentation is to present different tourism statistics produced by Stats SA People like to travel we are a country
Overnights of residents and non residents increased by 9%, accelerating when compared with the previous month
 15 January 2018 Tourism Activity November 2017 Overnights of residents and non residents increased by 9%, accelerating when compared with the previous month Hotel establishments recorded 1.2 million guests
Digest of International Travel and Tourism Statistics 2017
 Vol. 44 Republic of Mauritius Digest of International Travel and Tourism Statistics 2017 Ministry of Finance and Economic Development Statistics Mauritius October 2018 (Price: Rs 75.00) DIGEST OF INTERNATIONAL
Preliminary results for 2017 point to increases of 8.9% in guests and 7.4% in overnight stays
 14 February 2018 Tourism Activity December 2017 Preliminary results for 2017 point to increases of 8.9% in guests and 7.4% in overnight stays Hotel establishments recorded 1.2 million guests and 2.7 million
2016 VISITOR STATISTICS WASHINGTON, DC
 2016 VISITOR STATISTICS WASHINGTON, DC TOTAL VISITATION TO WASHINGTON, DC WASHINGTON, DC (DISTRICT OF COLUMBIA) VISITORS (IN MILLIONS) 20 15 10 Overseas Domestic 15.1 14.9 1.0 1.0 14.1 13.9 18.3 19.0 17.8
Tourism Snapshot. June 2015 Volume 11, Issue 6. A focus on the markets in which Destination Canada (DC) and its partners are active.
 and its partners are active.") Tourism Snapshot Tourism PEI / Paul Baglole A focus on the markets in which Destination Canada (DC) and its partners are active. www.destinationcanada.com June Volume 11, Issue 6 Key highlights Over the
Tourism Snapshot Tourism PEI / Paul Baglole A focus on the markets in which Destination Canada (DC) and its partners are active. www.destinationcanada.com June Volume 11, Issue 6 Key highlights Over the
OVERVIEW Four year annual average to the year ending September 2014
 Dec-08 Mar-09 Jun-09 Sep-09 Dec-09 Mar-10 Jun-10 Sep-10 Dec-10 Mar-11 Jun-11 Sep-11 Dec-11 Mar-12 Jun-12 Sep-12 Dec-12 Mar-13 Jun-13 Sep-13 Dec-13 Mar-14 Jun-14 Sep-14 Visitors (000's) LGA PROFILE - Eurobodalla
International Visitation to the Northern Territory. Year ending March 2017
 International Visitation to the Northern Territory Year ending March 217 The following is a summary of information relevant to the Northern Territory tourism industry including visitation results from
Global robot installations: high double digit growth rates
 ' of units Global robot installations: high double digit growth rates 5 45 4 35 3 25 2 15 1 5 113 6 Estimated annual worldwide supply of industrial robots 28-216 and 217-22* +15% on average per year 121
OVERVIEW Four year annual average to the year ending September 2014
 Dec-08 Mar-09 Jun-09 Sep-09 Dec-09 Mar-10 Jun-10 Sep-10 Dec-10 Mar-11 Jun-11 Sep-11 Dec-11 Mar-12 Jun-12 Sep-12 Dec-12 Mar-13 Jun-13 Sep-13 Dec-13 Mar-14 Jun-14 Sep-14 Visitors (000's) LGA PROFILE - Oberon
Helsinki experiences its best-ever travel year in 2015
 2015 Gymnaestrada 2015 Helsinki experiences its best-ever travel year in 2015 The number of overnight stays in Helsinki rose to a new record, almost 3.5 million, in 2015. Helsinki experienced growth of
MONTHLY NATURAL GAS SURVEY. November 2009
 MONTHLY NATURAL GAS SURVEY November 2009 INTERNATIONAL ENERGY AGENCY INTERNATIONAL ENERGY AGENCY Next Release: 12 March 2010 MONTHLY NATURAL GAS SURVEY - 1 CONTENTS TABLE 1 Natural Gas Balances in OECD
Tourism Snapshot A focus on the markets in which the CTC and its partners are active
 Tourism Snapshot A focus on the markets in which the CTC and its partners are active www.canada.travel/corporate April Volume 1, Issue 4 Key highlights Total arrivals from CTC s international markets improved
U.S. Travel and Tourism Report
 2014/TWG44/010 Agenda Item: 18 U.S. Travel and Tourism Report Purpose: Information Submitted by: United States 44 th Tourism Working Group Meeting Cusco, Peru 9-10 April 2014 U.S. Travel and Tourism Report
Tourism Statistics RTO 1
 Tourism Statistics RTO 1 Tourism Research Unit Spring 2012 1 1 Ontario Tourism 2 2 Ontario Tourism Indicators 2011* Visits increased by 1.3% to 104.4 million. Visits from Ontario and overseas countries
Significant increases in overnight stays and revenue
 15 April 2016 Tourism Activity February 2016 Significant increases in overnight stays and revenue Hotel establishments recorded 989.9 thousand guests and 2.6 million overnight stays in February 2016, the
Steve Smith Director Cargo Supply Chain Management
 IATA e-freight project status Steve Smith Director Cargo Supply Chain Management Contents 1. Introduction: Vision and Board Mandate 2. Current Performance 3. 2010 progress to increasing e-freight capability:
TOURISM FACTS Total Foreign Exchange Earnings ,065 4,057 3,989 3,935 3,637 3,115 2, ,000 2,000 3,000 4,000 5,000 6,000
 TOURISM FACTS 2008 Tourism Performance in 2008 Expenditure by visitors to Ireland (including receipts paid to Irish carriers by foreign visitors) was estimated to be worth 4.8 billion in 2008. Total Foreign
AUCKLAND DESTINATION OVERVIEW
 AUCKLAND DESTINATION OVERVIEW September 218 An in-depth overview of Auckland s visitor economy from the latest arrival, accommodation, spend, cruise and event data through to past five- commentary. Prepared
Tourism Snapshot Year-in-review. Facts & Figures 5th edition.
 Tourism Snapshot 2010 Year-in-review Facts & Figures 5th edition www.canada.travel/corporate Tourism highlights In 2010, international visitors made15.9 million overnight trips to Canada, up 1.8% compared
How Russians Spend Abroad 2010
 Russia Consumer research How Russians Spend Abroad Citibank s Annual Research of Credit Card Transactions Abroad August Spend Abroad Dynamics Share of spend abroad (as % of total spend over one year) 20%
Next Release: 13 April Next Release: 13 April December
 43070 Next Release: 13 April 2018 Next Release: 13 April 2018 December Date of publication: 15 March 2018 TABLE OF CONTENTS Charts 1 Gross consumption of natural gas by OECD region 3 2 Indigenous production
Tourism Statistics
 Tourism Statistics 2006-2010 TABLE OF CONTENTS FOREWORD 4 DEFINITIONS 5 STATISTICAL SUMMARY FOR 2010 6 INTERNATIONAL TOURIST ARRIVALS 7 International Tourist Arrivals: 1994-2010 7 International Tourist
India Market Report November 2018
 India Market Report November 2018 Visit Finland Country Representative Sara KaurSodhi Semiannual Report INDIA Summer season 2018 and outlook for winter 2018-19 CONTENTS Factors affecting the results of
AFTA Travel Trends. June 2017
 AFTA Travel Trends June 2017 AFTA Travel Trends Report 2017 Inbound and Outbound overview Introduction This snapshot provides an overview of the balance of trade between Inbound and Outbound Travel for
Rotorua. newzealand.com. argentina. Market information about our Visitors and our Active Considerers
 Rotorua argentina Market information about our Visitors and our Active Considerers newzealand.com PAST VISITORS HISTORIC VIEW TOTAL ARRIVALS YE MARCH 2018 AUS 1,495K 39% INDIA 63K 2% USA 340K 9% GERMAN
Tourism Snapshot A focus on the markets in which the CTC and its partners are active
 Tourism Snapshot A focus on the markets in which the CTC and its partners are active www.canada.travel/corporate May Volume 1, Issue 5 Key highlights Total arrivals from CTC s international markets improved
SITUATION OF THE TOURISM SECTOR YEAR ENDING 2012
 SITUATION OF THE TOURISM SECTOR YEAR ENDING 2012 1 INDEX PAGE GENERAL STATISTICS TABLE 3 STATISTIC TABLE BY MARKET 4 ANNUAL SUMMARY GRAPHS 5 SECTION 1. TOURISTS AND PASSENGERS 9 GRAN CANARIA 10 TOURISTS
% change vs. Dec ALL VISITS (000) 2,410 12% 7,550 5% 31,148 1% Spend ( million) 1,490 15% 4,370-1% 18,710 4%
 2,410 12% 7,550 5% 31,148 1% Spend ( million) 1,490 15% 4,370-1% 18,710 4%") HEADLINES FULL YEAR 2012 (PROVISIONAL) 1 Overall visits 31.148 million visits making 2012 the best year for inbound tourism since 2008 but not a record. 1% increase in visits on 2011 (30.798 visits) slightly
HEADLINES FULL YEAR 2012 (PROVISIONAL) 1 Overall visits 31.148 million visits making 2012 the best year for inbound tourism since 2008 but not a record. 1% increase in visits on 2011 (30.798 visits) slightly
Prague Tourism Developments in Q1 2018
 Prague Tourism Developments in Q1 2018 Facts and Figures: Total visitors: 1,499,044 foreign: 1,239,848 (82.7%) domestic: 259,196 (17.3%) Total visitor growth in Prague: 121,224 visitors (8.8%) foreign
Easter boosts results in tourism accommodation
 16 May 2016 Tourism Activity March 2016 Easter boosts results in tourism accommodation Hotel establishments recorded 1.4 million guests and 3.7 million overnight stays in March 2016, the equivalent to
Chart 2. International Student Nights in NSW
 International Student Visitors to NSW Year Ended March 2017 INTRODUCTION The International Education segment in Australia and NSW has had a resurgence and is growing. According to the Department of Education
Attracting tourists all year round challenges and opportunities in seasonality and responsibility
 Attracting tourists all year round challenges and opportunities in seasonality and responsibility Terhi Hook, product development manager, Visit Finland 11.4.2008 Alatunniste teksti 11.4.2008 Alatunniste
Source: Statistics New Zealand International Visitor Arrivals. Aug Visitors aged year old.
 1 2 Source: Statistics New Zealand International Visitor Arrivals. Aug 2015. Visitors aged 18-29 year old. 3 4 Desktop Research (IVA) Who are our current Youth visitors? Arrivals (k) Stay Days (m) Expenditure
78 MILLION 150, domains in 28 languages LARGEST TRAVEL SIT E IN THE WORLD MIL LION.
 1 # LARGEST TRAVEL SIT E IN THE WORLD 225 MIL LION reviews & opinions 340 unique visitors a month businesses listed * MILLION 4.9 MILLION 78 MILLION members 150,000+ destinations 139 user contributions
Market Profile. 3 rd largest market 69K 624K
 Market Profile Germany is our 3 rd largest market Visitor Market The island of Ireland welcomed 651K visitors from Germany in 2016. German visitors account for 6% of all visitors to the island. Where do