Latin America Airfinance Conference
|
|
|
- Brandon Berry
- 5 years ago
- Views:
Transcription

1 13 th Annual Latin America Airfinance Conference September 2017 Belmond Copacabana Palace, Rio de Janeiro, Brazil Andres Del Valle Senior Vice President Corporate Finance LATAM Airlines Group From Financial Strength to Competitive Excellence Sep 2017
2 This presentation may include forward-looking comments regarding the Company s business outlook and anticipated financial and operating results. These expectations are highly dependent on the economy, the airline industry, commodity prices, international markets and external events. Therefore, they are subject to change and we undertake no obligation to publicly update or revise any forward looking statements to reflect events or circumstances that may arise after the date of this presentation. More information on the risk factors that could affect our results are contained on our Form 20-F for the year ended December 31, Information, tables and logos contained in this presentation may not be used without consent from LATAM Airlines Group S.A.
3 One of the largest airline groups in the world Pax transported 2016 (mm) Biggest airline in Latin America, 13 th worldwide Best Airline in South America Skytrax DJSI World category for 4 th consecutive year Latin American airlines Sources: Bloomberg, company s websites (Data as of December 31, 2016) 3
4 Presence in 5 continents, 25 countries, 135 cities 4

5 Unique network and connectivity in Latin America ~50% regional market share, ~96% domestic capacity Hubs: Sao Paulo Lima Santiago Brasilia Partnerships: Oneworld AA IAG Loyalty program: 30 mm members Over 43 thousand employees across 25 countries 5
6 The Company has developed diversified sources of revenue LTM Revenue by Business Unit LTM Revenue by Point of Sale Cargo 11% Others 6% APAC & Other Latin America 8% Colombia 4% Peru 7% Ecuador 2% Domestic SSC 16% Domestic Brazil 23% International 44% Europe 7% U.S.A 10% Argentina 12% Chile 16% Brazil 34% Total = US$9,840 mm Total = US$9,840 mm Data as of June 30, 2017 Source: LATAM s published Financial statements and public Company filings 6
7 LATAM has strengthened its financial position Cash & Cash equivalents (US$ million) June 30, 2017 June 30, 2016 vs. 1H 2016 Cash & cash equivalents 1,706 1, RCF & commited credit lines Liquidity (1) 21.1% 13.4% +7.7pp Net Debt 6,987 7, Leverage Adjusted Net Debt 11,189 11, EBITDAR(LTM) 2,134 1, Leverage (2) 5.2x 5.9x -0.7x Fleet Fleet commitments ,027 2,065-1,038 Fleet by the end of (1): % of last twelve months revenues. Includes RCF. (2): Adjusted for the capitalization of operating leases (7x yearly expense) 7
8 The Company rightsized its fleet plan Fleet plan Fleet commitments (US$ million) US$402 mm reduction (1) US$636 mm reduction (1) US$448 mm reduction (2) 13 aircrafts ,950 4 aircrafts aircrafts 701 1, Freighter Wide Body Narrow Body (1): Since last conference. (2): Compared with fleet plan as of March
9 Fleet Deliveries Plan (US$) 763 mm 3 x A321neo 326 mm 2 x A320neo S&LB B787-9 S&LB B787-9 RENTAL OPERATING LEASE FIN. LEASE mm 3 x A320neo S&LB 2 x A S&LB OPERATING LEASE mm 2 x A321neo 4 x A320neo FINANCIAL LEASE 378 mm 2 x B787-9 S&LB A S&LB OPERATING LEASE 2019 A321ceo 3 x A320neo 3 x A TO BE FINANCED 9
10 Financing Highlights LTM Σ US$2,353 mm Margin Loan MULTIPLUS US$200 mm PDP Financing Facility US$260 mm Mortgage Loan US$50 mm QATAR Capital Increase US$608 mm Junior Loan Financing US$45 mm 7 yrs. Unsecured Bond US$700 mm EETC Tranche C US$140 mm Local Bond Chile US$350 mm First Issuance 2016 sep sep oct nov nov dic jan feb feb mar mar abr apr may jun jun jul jul ago aug 2017 Secured Unsecured PDP Financing Equity Increase 10

11 LATAM s Unsecured Bonds Liability Management US$ % US$ % US$ % Sep 2016 Issued April 6, 2017 TAM 2017 Fully Repaid April 30, 2017 LATAM 2020 Issued August 17, 2017 TAM 2021 Sep 2017 Called September 1st, 2017 Extended Debt Maturity Lowered Cost of Debt Sep 2016 LATAM 2024 US$ % LATAM 2020 US$ % Sep 2017 LATAM 23/ 28 US$350 mm Chile Local Bond Issuance 11
12 The Company has improved its debt repayment profile (US$ million) 1, , , , Aircraft Loans Bank Loans Public Obligations Secured Bonds Debt amortization profiles do not include revolving short term debt nor PDP Financing 12
13 And improved liquidity and leverage during Liquidity (1) and Leverage Position (2) (US$ million) 5,8x 5,3x 5,2x 5,2x 13% 19% 21% 22% 2,081 2,156 1, , ,486 1,706 1, Cash and Cash Equivalents RCF Drawn Commitments RCF Undrawn Commitments 2Q16 4Q16 2Q17 2Q17 Proforma Cash and Cash Equivalents RCF Drawn Commitments RCF Undrawn Commitments (1): Liquidity: Cash plus RCF / Revenues LTM (2): Leverage: Adjusted Net Debt / EBITDAR LTM 13
14 Also seeing improvements on the operational side Operating Revenues (US$ bn) EBIT (US$ mm) Net income (US$ mm) % % 5.1% +0.9 pp EBIT Margin 6.0% 5.0% -0.8 pp 4.2% +US$249 mm in higher fuel prices (72) % H6 1H H16 1H H16 1H17 Source: LATAM s published Financial Statements 14
15 Positive unit revenue trend across all businesses 1H17 vs 1H16 System Capacity Capacity Traffic Load Factor RASK (US cents) International (Long Haul & Regional) Domestic Brazil 26% 56% +3.8% -6.9% +5.6% -7.8% 86.8% (+1.5 p.p.) 81.1% (-0.8 p.p.) 5.9 (+6.9%) 6.3 (+20.5%) BRL 1H17:+3.1% SSC Domestic 18% +0.1% -0.6% 80.9% (-0.6 p.p.) Passenger +0.1% +0.8% 84.3% (+0.6 p.p.) Cargo -9.7% -3.7% 53.4% (+3.3 p.p.) Source: Public Company filings and quarterly financial press release 7.1 (+2.4%) 6.0 (+8.8%) 16.9 (+5.4%) 15
16 Proactive capacity management driving load factors and pricing Latin America real GDP growth (1) LATAM ASK growth LATAM passenger load factor (1.0%) 0.6% 84.2% 1.0% 1% - 3% Guidance 84.3% (2) Capacity (ASK) 3% 1% 0% 0% 0% -1% 1Q16 2Q16 3Q16 4Q16 1Q17 2Q17 Passenger unit revenue growth (YoY) 8% 8% 10% -1% -19% -14% 1Q16 2Q16 3Q16 4Q16 1Q17 2Q17 (1): IMF as of July 2017 (2): YTD as of June
17 Proactive capacity management Brazil domestic Brazil real GDP growth (1) LATAM Brazil ASK growth LATAM Brazil passenger load factor (3.5%) (11.5%) 82.3% 0.3% -(3% - 1%) Guidance 81.1% (2) Capacity (ASK) -4% -8% -11% -10% -14% -13% 1Q16 2Q16 3Q16 4Q16 1Q17 2Q17 Passenger unit revenue growth (YoY) 35% 25% 16% 9% -25% -10% 1Q16 2Q16 3Q16 4Q16 1Q17 2Q17 (1): IMF as of July 2017 (2): YTD as of June
18 Better macroeconomic conditions YTD Currency Appreciation (1) BRL/USD 4.9% 8.7% 3.3% CLP/USD COP/USD GDP in Brazil 1.3% 0.1% 0.3% -3.8% -3.6% E 2018E 2017 Estimated GDP in South America PEN/USD 3.8% ARS/USD -7.9% Argentina: 2.2% Chile: 1.5% Colombia: 2.3% Ecuador: -1.6% Peru: 2.7% (1): As of Sources: Bloomberg & IMF (July, 2017) 18


19 Region attracting new competitors Main carriers as of September, 2016 New competitors International front: 19
20 Taking right steps to consolidate leading position in the region Best Network Cost Competitiveness New Domestic Business Model Enhanced Customer Experience 20
21 Network: Strengthening hubs and starting point-to-point routes on domestic markets 2017 Domestic routes Already operating Announced Airlines Colombia Airlines Brazil Brazil Chile Belo Horizonte - Fortaleza Concepción - Antofagasta Airlines Ecuador Belo Horizonte - Vitoria Concepción Punta Arenas Brasilia Foz de Iguaçu Curitiba Foz de Iguaçu Colombia San Andrés - Cartagena Airlines Peru Fortaleza - Manaus Medellín Santa Marta Sao Paulo (GRU) Rio de Janeiro (SDU) Sao Paulo (GRU) Londrina Sao Paulo (GRU) Joinville Río de Janeiro - Goiânia Medellin- Barranquilla Cali Cartagena Peru Lima - Jauja Airlines Chile Airlines Argentina Cusco Trujillo - Point-to-point domestic routes 21

 Tucumán Neuquén San Juan Melbourne 9 North")
: Subject to regulatory approval Source: Public Company filings and press")
22 Network: Improving international by adding new routes and building strategic alliances 2017 International routes 6 Europe LIM Others Already operating Cartagena Mendoza Tucumán Río de Janeiro San José (Costa Rica) Río de Janeiro - Orlando Brasilia Punta Cana Announced Santa Cruz Rosario SCL Joint Business agreements (1) Tucumán Neuquén San Juan Melbourne 9 North /Central America & Caribbean 3 LIM SCL BSB GRU South America 116 Africa 1 Enero Oceania LATAM Destinations JBAs (1): Subject to regulatory approval Source: Public Company filings and press releases) 22
23 Costs: Focus on increased productivity Employees/Aircraft (1) # Aircraft and Average Seats 52, % 49, # Employees (average) 43, Narrow Body Fleet Avg. # Seats NB Wide Body Fleet Avg. # Seats WB # aircraft Q E 2018E 2019E One-time costs 2016: US$58 mm in aircraft re-deliveries, and US$89 mm in severance payments (1): Average number of employees divided by operating aircrafts 23


24 New domestic business model: Increase competitiveness vs. ULCC More growth Sustainable margins Lower costs More capacity Lower fares More ancillaries More passengers Source:LATAM website ( and press releases 24


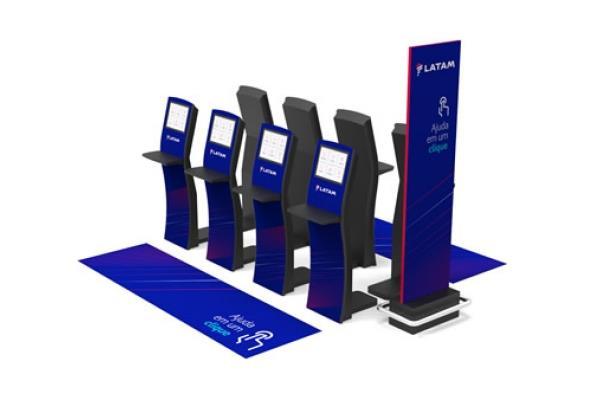
25 New domestic business model: Buy-on-Board and New Sales Model implemented in our domestic markets 5 million passengers already tried the Buy-on-Board service 2 million passengers flying under the new sales model 25% of daily passengers in SSCs flying with discounted fares 449 self attendance kiosks for check-in and to check baggage 71 airports with self attendance kiosks 25


26 Customer experience: A culture built around the client Digital Airport FFP Operational excellence 26


27 Summary Strengthened balance sheet position Improving operating results Addressing new competitive landscape Unmatchable network Cost Competitiveness New Domestic Business Model Customer Experience 27

28 13 th Annual Latin America Airfinance Conference September 2017 Belmond Copacabana Palace, Rio de Janeiro, Brazil Thank you Andres Del Valle Senior Vice President Corporate Finance LATAM Airlines Group (56-2) Sep 2017
Second Quarter 2017 Results Presentation. August 2017
 Second Quarter 2017 Results Presentation August 2017 Second Quarter 2017 Highlights Revenues per ASK increased by 10.3% as a result of proactive capacity management. Operating revenues increased by 7.7%
J.P. Morgan 9 th Annual Global Emerging Markets Corporate Conference. Miami, February 2018
 J.P. Morgan 9 th Annual Global Emerging Markets Corporate Conference Miami, February 2018 This presentation may include forward-looking comments regarding the Company s business outlook and anticipated
Deutsche Bank 16 th Annual Global Emerging Markets. New York, September 2017
 Deutsche Bank 16 th Annual Global Emerging Markets New York, September 2017 This presentation may include forward-looking comments regarding the Company s business outlook and anticipated financial and
Bank of America Merrill Lynch 2018 Emerging Markets Corporate Credit Conference. Miami, May 2018
 Bank of America Merrill Lynch 2018 Emerging Markets Corporate Credit Conference Miami, May 2018 This presentation may include forward-looking comments regarding the Company s business outlook and anticipated
Santander 22 nd Annual Latin American Conference. Cancun, January 2018
 Santander 22 nd Annual Latin American Conference Cancun, January 2018 This presentation may include forward-looking comments regarding the Company s business outlook and anticipated financial and operating
UBS 14 th Global Emerging Markets Conference. New York, November 2016
 UBS 14 th Global Emerging Markets Conference New York, November 2016 This presentation may include forward-looking comments regarding the Company s business outlook and anticipated financial and operating
Bank of America Merrill Lynch Emerging Markets Corporate Conference. Miami, June 2016
 Bank of America Merrill Lynch Emerging Markets Corporate Conference Miami, June 2016 This presentation may include forward-looking comments regarding the Company s business outlook and anticipated financial
J.P. Morgan 2019 Global Emerging Markets Corporate Conference. Miami, February 2019
 J.P. Morgan 2019 Global Emerging Markets Corporate Conference Miami, February 2019 This presentation may include forward-looking comments regarding the Company s business outlook and anticipated financial
Santander 20 th Annual Latin America CEO Conference Cancun, January 2016
 Santander 20 th Annual Latin America CEO Conference Cancun, January 2016 This presentation may include forward-looking comments regarding the Company s business outlook and anticipated financial and operating
Second quarter 2013 Results Presentation. August, 2013
 Second quarter 2013 Results Presentation August, 2013 This presentation may include forward-looking comments regarding the Company s business outlook and anticipated financial and operating results. These
BTG Pactual VI Latin American CEO Conference 2015 New York, October 2015
 BTG Pactual VI Latin American CEO Conference 2015 New York, October 2015 This presentation may include forward-looking comments regarding the Company s business outlook and anticipated financial and operating
Fourth Quarter and Full Year 2011 Results Presentation. February 1, 2012
 Fourth Quarter and Full Year 2011 Results Presentation February 1, 2012 This presentation may include forward-looking comments regarding the Company s business outlook and anticipated financial and operating
Fourth Quarter and Full Year 2009 Results Presentation January 27, 2010
 Fourth Quarter and Full Year 2009 Results Presentation January 27, 2010 This presentation may include forward-looking comments regarding the Company s business outlook and anticipated financial and operating
LATAM AIRLINES GROUP REPORTS A 25.8% IMPROVEMENT IN OPERATING INCOME AND NET INCOME OF US$155.3 MILLION FOR FULL YEAR 2017
 LATAM AIRLINES GROUP REPORTS A 25.8% IMPROVEMENT IN OPERATING INCOME AND NET INCOME OF US$155.3 MILLION FOR FULL YEAR 2017 Santiago, Chile, March 14, 2017 LATAM Airlines Group S.A. (NYSE: LTM; IPSA: LTM),
LATAM AIRLINES GROUP REPORTS CONSOLIDATED OPERATING INCOME OF US$175.0 MILLION FOR THIRD QUARTER 2018
 LATAM AIRLINES GROUP REPORTS CONSOLIDATED OPERATING INCOME OF US$175.0 MILLION FOR THIRD QUARTER 2018 Santiago, Chile, November 20, 2018 LATAM Airlines Group S.A. (NYSE: LTM; IPSA: LTM), the leading airline
LATAM AIRLINES GROUP REPORTS CONSOLIDATED OPERATING INCOME OF US$6.5 MILLION FOR SECOND QUARTER 2018, TOTALING US$235 MILLION FOR FIRST HALF 2018
 LATAM AIRLINES GROUP REPORTS CONSOLIDATED OPERATING INCOME OF US$6.5 MILLION FOR SECOND QUARTER 2018, TOTALING US$235 MILLION FOR FIRST HALF 2018 Santiago, Chile, August 20, 2018 LATAM Airlines Group S.A.
Conference Call 1Q14 Results. Investor Relations May 15, 2014
 Conference Call Results Investor Relations May 15, 2014 1 Highlights 2 Highlights Net revenues of R$2.5 billion in the quarter, an increase of 20% or R$411 million quarter-over-quarter; EBIT totaled R$144
LATAM AIRLINES GROUP RECORDS A 50.1% INCREASE IN OPERATING INCOME AND A US$93.9 MILLION NET PROFIT IN THE FIRST QUARTER OF 2018
 LATAM AIRLINES GROUP RECORDS A 50.1% INCREASE IN OPERATING INCOME AND A US$93.9 MILLION NET PROFIT IN THE FIRST QUARTER OF 2018 Santiago, Chile, May 8, 2018 LATAM Airlines Group S.A. (NYSE: LTM; IPSA:
LATAM AIRLINES GROUP REPORTS OPERATING INCOME OF US$267 MILLION FOR FOURTH QUARTER 2014 AND US$513 FOR FULL YEAR 2014
 LATAM AIRLINES GROUP REPORTS OPERATING INCOME OF US$267 MILLION FOR FOURTH QUARTER 2014 AND US$513 FOR FULL YEAR 2014 Santiago, Chile, March 17, 2015 (NYSE: LFL; IPSA: LAN; BOVESPA: LATM33), the leading
Fourth Quarter & FY 2008 Results Presentation January 28, 2008
 Fourth Quarter & FY 2008 Results Presentation January 28, 2008 This presentation may include forward-looking comments regarding the Company s business outlook and anticipated financial and operating results.
PRESS RELEASE. First Half 2017 Financial Results Higher Load Factors and traffic lead to a significant rebound in second quarter profitability
 PRESS RELEASE First Half 2017 Financial Results Higher Load Factors and traffic lead to a significant rebound in second quarter profitability Kifissia, 12 September 2017 AEGEAN announces first half 2017
Copa Holdings Reports Net Income of $49.9 million and EPS of $1.18 for the Second Quarter of 2018
 Copa Holdings Reports Net Income of $49.9 million and EPS of $1.18 for the Second Quarter of 2018 Panama City, Panama --- Aug 8, 2018. Copa Holdings, S.A. (NYSE: CPA), today announced financial results
Cebu Air, Inc. 4 th Quarter and Full Year 2017 Results of Operations. cebupacificair.com
 Cebu Air, Inc. 4 th Quarter and Full Year 2017 Results of Operations cebupacificair.com Disclaimer The information provided in this presentation is provided only for your reference. Such information has
Management Presentation. March 2016
 Management Presentation March 2016 Forward looking statements This presentation as well as oral statements made by officers or directors of Allegiant Travel Company, its advisors and affiliates (collectively
Copa Holdings Reports Record Earnings of US$41.8 Million for 4Q06 and US$134.2 Million for Full Year 2006
 Copa Holdings Reports Record Earnings of US$41.8 Million for 4Q06 and US$134.2 Million for Full Year 2006 Panama City, Panama --- March 7, 2007. Copa Holdings, S.A. (NYSE: CPA), parent company of Copa
Citi Annual Latin America Conference New York March 24-26, 2010
 Citi Annual Latin America Conference New York March 24-26, 2010 This presentation may include forward-looking comments regarding the Company s business outlook and anticipated financial and operating results.
Results 2Q17. August 9, 2017
 Results 2Q17 August 9, 2017 2Q17 Highlights Indicators 2Q17 Var. x 2Q16 ASK (BN) 10.4-3.0% Traffic (000) 7,261-1.3% RPK (BN) 8.1 +0.5% Load Factor 77.9% +2.7 p.p. Yield (R$ cents) 23.2 +4.8% Pax Revenue
Fourth Quarter 2006 Results Presentation February 15, 2007
 Fourth Quarter 2006 Results Presentation February 15, 2007 This presentation may include forward-looking comments regarding the Company s business outlook and anticipated financial and operating results.
Avianca Holdings S.A. 1Q 2018 Earnings Presentation 2018
 Avianca Holdings S.A. 1Q 2018 Earnings Presentation 2018 Disclaimer The present document consolidates information from Avianca Holdings S.A. and its subsidiaries, including unaudited financial figures,
Management Presentation. May 2013
 Management Presentation May 2013 Forward looking statements This presentation as well as oral statements made by officers or directors of Allegiant Travel Company, its advisors and affiliates (collectively
Copa Holdings Reports Earnings of US$30.3 Million and EPS of US$0.70 for 3Q08
 Copa Holdings Reports Earnings of US$30.3 Million and EPS of US$0.70 for 3Q08 Panama City, Panama --- November 13, 2008. Copa Holdings, S.A. (NYSE: CPA), parent company of Copa Airlines and Aero Republica,
PRESS RELEASE Financial Results. Rising passenger traffic at 12.5m Exceeding 1bn in consolidated revenue
 PRESS RELEASE 2016 Financial Results Rising passenger traffic at 12.5m Exceeding 1bn in consolidated revenue Kifissia, 23 March 2017 AEGEAN reports full year 2016 results with consolidated revenue at 1,020m,
OPERATING AND FINANCIAL HIGHLIGHTS
 Copa Holdings Reports Net Income of US$32.0 Million and EPS of US$0.72 for the Second Quarter of 2012 Excluding special items, adjusted net income came in at $58.6 million, or EPS of $1.32 per share Panama
Air China Limited Annual Results. March Under IFRS
 Air China Limited 21 Annual Results Under IFRS March 211 Agenda Part 1 Highlights Part 2 Business Overview Part 3 Financial Overview Part 4 Outlook 2 Part 1 Highlights Steady Economic Growth; Asia Pacific
4Q15 and 2015 Results Presentation. March 30, 2016
 4Q15 and 2015 Results Presentation March 30, 2016 Highlights Paulo Kakinoff CEO Highlights Macro Environment Even more adverse environment for the Brazilian economy, with a GDP drop of 3.8% in 2015 Devaluation
Full Year 2009 Results
 Full Year 2009 Results 1 Antonio Vázquez Chairman & Chief Executive Officer 2 Highlights 2009 Strong decrease in revenues: weak demand and yield deterioration. High competition and drop of business traffic.
Third Quarter 2014 Results. 29 October 2014
 Third Quarter 2014 Results 29 October 2014 Highlights of the Third Quarter Operating environment Air France-KLM Economic environment remains weak Further currency volatility affecting revenues and results
OPERATING AND FINANCIAL HIGHLIGHTS
 Copa Holdings Reports Financial Results for the Fourth Quarter of 2018 Excluding special items, adjusted net profit came in at $44.0 million, or Adjusted EPS of $1.04 Panama City, Panama --- February 13,
INVESTOR PRESENTATION. Imperial Capital Global Opportunities Conference September 2015
 INVESTOR PRESENTATION Imperial Capital Global Opportunities Conference September 2015 Forward-looking Statements This presentation contains forward-looking statements within the meaning of the Private
Cebu Air, Inc. Annual Stockholders Briefing. 24 June cebupacificair.com
 Cebu Air, Inc. Annual Stockholders Briefing 24 June 2015 cebupacificair.com Business Updates Passengers (M) Operating Statistics 2014: Passenger traffic grew 17.5% to 16.9M. Seat capacity grew 14.8% to
Management Presentation. November 2011
 Management Presentation November 2011 Forward looking statements This presentation as well as oral statements made by officers or directors of Allegiant Travel Company, its advisors and affiliates (collectively
Management Presentation. September 2011
 Management Presentation September 2011 Forward looking statements This presentation as well as oral statements made by officers or directors of Allegiant Travel Company, its advisors and affiliates (collectively
SAS Q3 2017/ August 2018
 SAS Q3 2017/2018 31 August 2018 Strong earnings in peak season POSITIVES Record number of passengers Total revenue up MSEK 936 vs. LY Currency adjusted yield up 1.1% vs. LY EB point sale up 27% vs. LY
OPERATING AND FINANCIAL HIGHLIGHTS
 Copa Holdings Reports Net Income of US$18.6 Million and EPS of US$0.42 for the Second Quarter of 2010 Excluding special items, adjusted net income came in at $26.3 million, or $0.60 per share Panama City,
Azul Increases Net Income by R$152 Million in 1Q18 Operating margin was a record 12.5% despite the 21% increase in oil year over year
 Azul Increases Net Income by R$152 Million in 1Q18 Operating margin was a record 12.5% despite the 21% increase in oil year over year São Paulo, May 10, Azul S.A., Azul, (B3:AZUL4, NYSE:AZUL) the largest
NOVEMBER YEAR III LATIN AMERICA&CARIBBEAN MID-MARKETS: OPPORTUNITIES IN THE REGION
 NOVEMBER 2011 - YEAR III MARKETWATCH LATIN AMERICA&CARIBBEAN MID-MARKETS: OPPORTUNITIES IN THE REGION THE REGION IN PERSPECTIVE LAC in Perspective - 2011 Facts % of the world 595 mi people 9,3 $ 5,8 tri
2Q Earnings Results Presentation
 2Q Earnings Results Presentation SAFE HARBOR The present document consolidates information from Avianca Holdings S.A. and its subsidiaries, including unaudited financial figures, operational managerial
LAN AIRLINES REPORTS NET INCOME OF US$88.3 MILLION FOR THE FIRST QUARTER OF 2010
 FOR IMMEDIATE RELEASE LAN AIRLINES REPORTS NET INCOME OF US$88.3 MILLION FOR THE FIRST QUARTER OF 2010 Santiago, Chile, April 27, 2010 LAN Airlines S.A. (NYSE: LFL), one of Latin America s leading passenger
INVESTOR PRESENTATION. May 2015
 INVESTOR PRESENTATION May 2015 Forward-looking Statements This presentation contains forward-looking statements within the meaning of the Private Securities Litigation Reform Act of 1995 that reflect the
TOKYO MEETINGS NOVEMBER 2016
 TOKYO MEETINGS NOVEMBER 2016 CONTENTS AEROMEXICO AT A GLANCE BUILDING A STRONG AND FLEXIBLE AIRLINE STRATEGIC INITIATIVES 2 AEROMEXICO: MEXICO S PREMIUM NETWORK CARRIER. Mexico s only full service carrier,
Management Presentation. August 2012
 Management Presentation August 2012 Forward looking statements This presentation as well as oral statements made by officers or directors of Allegiant Travel Company, its advisors and affiliates (collectively
Gerry Laderman SVP Finance, Procurement and Treasurer
 Gerry Laderman SVP Finance, Procurement and Treasurer Safe Harbor Statement Certain statements included in this release are forward-looking and thus reflect our current expectations and beliefs with respect
3Q 2016 Earnings Results Presentation. B787 Dreamliner
 3Q 2016 Earnings Results Presentation B787 Dreamliner 2 The present document consolidates information from Avianca Holdings SA and its subsidiaries, including unaudited financial figures, operational managerial
CREDIT SUISSE GLOBAL INDUSTRIALS CONFERENCE DECEMBER 4, 2014
 CREDIT SUISSE GLOBAL INDUSTRIALS CONFERENCE DECEMBER 4, 2014 1 1 SAFE HARBOR This presentation contains statements of a forward-looking nature which represent our management's beliefs and assumptions concerning
Public meeting with analysts and investors APIMEC. December 7, 2015
 Public meeting with analysts and investors APIMEC December 7, 2015 Opening December 7, 2015 Constantino de Oliveira Junior Chairman Smiles history VARIG launches SMILES Co-branded credit card Bradesco
LAN AIRLINES REPORTS NET INCOME OF US$4.2 MILLION FOR THE SECOND QUARTER OF 2009
 FOR IMMEDIATE RELEASE LAN AIRLINES REPORTS NET INCOME OF US$4.2 MILLION FOR THE SECOND QUARTER OF 2009 Santiago, Chile, July 28, 2009 LAN Airlines S.A. (NYSE: LFL), one of Latin America s leading passenger
Management Presentation. November 2018
 Management Presentation November 2018 Forward looking statements This presentation as well as oral statements made by officers or directors of Allegiant Travel Company, its advisors and affiliates (collectively
Cebu Air, Inc. 2Q2014 Results of Operation
 Cebu Air, Inc. 2Q2014 Results of Operation 1 Disclaimer This information provided in this presentation is provided only for your reference. Such information has not been independently verified and, as
OPERATING AND FINANCIAL HIGHLIGHTS SUBSEQUENT EVENTS
 Copa Holdings Reports Net Income of US$6.2 Million and EPS of US$0.14 for the Third Quarter of 2015 Excluding special items, adjusted net income came in at $37.4 million, or EPS of $0.85 per share Panama
Copa Holdings Reports Fourth Quarter and Full Year 2007 Results
 Copa Holdings Reports Fourth Quarter and Full Year 2007 Results Panama City, Panama --- February 21, 2008. Copa Holdings, S.A. (NYSE: CPA), parent company of Copa Airlines and Aero Republica, today announced
Information meeting. 1 st September 2011
 Information meeting 1 st September 2011 Full Year 2010-11 key data April 2010-March 2011 Revenues in billions Operating result in millions 77% Passenger 18.10 +11.3% -44 +874 13% Cargo 3.16 +29.5% +69
Institutional presentation. February, 2016
 Institutional presentation February, 2016 Company and scenario highlights GOL at a glance - Largest low cost airline in LatAm Standardized fleet of 142 Boeing 737-700 and 800 NG aircraft Shareholder Structure
OPERATING AND FINANCIAL HIGHLIGHTS. Subsequent Events
 Copa Holdings Reports Net Income of $103.8 million and EPS of $2.45 for the Third Quarter of 2017 Excluding special items, adjusted net income came in at $100.8 million, or EPS of $2.38 per share Panama
AIR CANADA REPORTS 2010 THIRD QUARTER RESULTS; Operating Income improved $259 million or 381 per cent from previous year s quarter
 AIR CANADA REPORTS 2010 THIRD QUARTER RESULTS; Operating Income improved $259 million or 381 per cent from previous year s quarter MONTRÉAL, November 4, 2010 Air Canada today reported operating income
Volaris Reports Strong First Quarter 2015: 32% Adjusted EBITDAR Margin, 9% Operating Margin
 Volaris Reports Strong First Quarter 2015: 32% Adjusted EBITDAR Margin, 9% Operating Margin Mexico City, Mexico, April 22, 2015 Volaris* (NYSE: VLRS and BMV: VOLAR), the ultra-low-cost airline serving
SAS Group Q Teleconference
 SAS Group Q4 2012 Teleconference December 12, 2012 1 Break-even result in 2012 despite 1.6 bn SEK higher fuel cost 23 MSEK EBT (before non-recurring items) despite 1.6 bn SEK higher fuel cost Positive
IAG results presentation. Quarter One th May 2018
 IAG results presentation Quarter One 2018 4 th May 2018 Highlights Willie Walsh, Chief Executive Officer Highlights Another strong quarter performance with an operating profit of 280m (5.6% margin, +2.3pts)
Analysts and Investors conference call. Q results. 15 May 2013
 Analysts and Investors conference call Q1 2013 results 15 May 2013 Management summary Key messages of Q1 2013 +6% +9% +3.3%p. Q1 2013 operational KPIs are in line with 109.7 116.2 6.5 7.1 82.3 85.6 expectations,
STAYING TRUE. Scotia Capital Transportation & Aerospace Conference. November 15, 2011
 STAYING TRUE Scotia Capital Transportation & Aerospace Conference November 15, 2011 FORWARD-LOOKING STATEMENT Certain information in this presentation and statements made during this presentation, including
Joshua Koshy, Executive Vice President & CFO. Changing the Game
 Joshua Koshy, Executive Vice President & CFO Changing the Game Changing the Game Canada s #1 domestic, trans-border and international airline Strong brand recognition Innovative revenue model driving customer
Copa Holdings Reports Net Income of $136.5 million and EPS of $3.22 for the First Quarter of 2018
 Copa Holdings Reports Net Income of $136.5 million and EPS of $3.22 for the First Quarter of 2018 May 9, 2018 PANAMA CITY, May 9, 2018 /PRNewswire/ -- Copa Holdings, S.A. (NYSE: CPA), today announced financial
Corporate presentation CIBC Whistler Institutional Investor Conference January 21, 2010
 Corporate presentation CIBC Whistler Institutional Investor Conference January 21, 2010 Forwardlooking statement Certain information in this presentation and statements made during this presentation, including
OPERATING AND FINANCIAL HIGHLIGHTS SUBSEQUENT EVENTS
 Copa Holdings Reports Financial Results for the Third Quarter of 2016 Excluding special items, adjusted net income came in at $55.3 million, or adjusted EPS of $1.30 per share Panama City, Panama --- November
OPERATING AND FINANCIAL HIGHLIGHTS
 Copa Holdings Reports Financial Results for the Fourth Quarter of 2015 Excluding special items, adjusted net income came in at $31.7 million, or EPS of $0.73 per share Panama City, Panama --- February
Information meeting. Full Year results. June 2011
 Information meeting Full Year 2010-11 results 1 June 2011 Agenda 2010-11: Recovery in activity and return to profitability 2011: Ongoing actions and reinforced strategic advantages 2 2010-11: Strong improvement
Financial Review. Changing the Game
 Financial Review Changing the Game 1 $7,238 +8.1% Revenue (1) $ Millions $7,824 $10,095 30-Sep-05 30-Sep-06 12 Months Ended Sept. 9 months ended 30, 2006 2 8.1% revenue growth achieved with only 3.8% ASM
Q Fast growth continued, Comparable operating result at record high levels Pekka Vauramo
 2018 Fast growth continued, Comparable operating result at record high levels 17.7.2018 Pekka Vauramo 2 A good - Comparable operating result increased to new seasonal high Revenue Comparable operating
SAS Group Q2 2012/13. Q2 Restructuring programme moving KPIs in the right direction
 SAS Group Q2 2012/13 1 Q2 Restructuring programme moving KPIs in the right direction Operating revenues +1.6%* Yield improvement of +2.7%* Forceful implementation of 4XNG plan: Unit cost down by 10.7%
In 2Q18, Brazil s #1 airline achieves a 2% EBIT margin and grows net revenues by 9%
 In 2Q18, Brazil s #1 airline achieves a 2% EBIT margin and grows net revenues by 9% Operating Income for the second quarter doubled, reaching R$43 million São Paulo, August 2, 2018 - ( GOL or Company ),
Copa Holdings Reports Net Income of $57.7 million and EPS of $1.36 for the Third Quarter of 2018
 Copa Holdings Reports Net Income of $57.7 million and EPS of $1.36 for the Third Quarter of 2018 November 14, 2018 PANAMA CITY, Nov. 14, 2018 /PRNewswire/ -- Copa Holdings, S.A. (NYSE: CPA), today announced
SAS Q3 2016/
 SAS Q3 2016/2017 05.09.2017 A strong summer performance drives result improvements Q3 IN SUMMARY Positives + Currency adjusted passenger revenue up 6.4% + Passengers up by ~300,000 + Ancillary and cargo
SAS Q1 2017/2018. Q1 in Summary: Improved earnings CHANGE VS. Q1 FY17
 SAS 2017/2018 27.02.2018 in Summary: Improved earnings POSITIVES + Passenger revenue up 1% (FX adj.) + Cargo and EB-point sale revenue increased MSEK 109 + Efficiency program delivered MSEK 165 + Positive
Transportation and Logistics Conference. Toronto March 18, 2008
 Transportation and Logistics Conference Toronto March 18, 2008 1 Our Investment Proposition Innovative revenue strategy that produces results Major cost reductions Strong financial performance Aggressive
THIRD QUARTER RESULTS 2018
 THIRD QUARTER RESULTS 2018 KEY RESULTS In the 3Q18 Interjet total revenues added $ 6,244.8 million pesos that represented an increase of 7.0% over the revenue generated in the 3Q17. In the 3Q18, operating
1Q 2017 Earnings Call. April 18, 2017
 1Q 2017 Earnings Call April 18, 2017 Safe Harbor Statement Certain statements included in this presentation are forward-looking and thus reflect our current expectations and beliefs with respect to certain
OPERATING AND FINANCIAL HIGHLIGHTS. Subsequent Events
 Copa Holdings Reports Net Income of US$113.1 Million and EPS of US$2.57 for the First Quarter of 2015 Excluding special items, adjusted net income came in at US$106.0 million, or EPS of US$2.41 per share
2Q 2016 Earnings Results Presentation. B787 Dreamliner
 2Q 2016 Earnings Results Presentation B787 Dreamliner 2 The present document consolidates information from Avianca Holdings SA and its subsidiaries, including unaudited financial figures, operational managerial
Scotia Capital Transportation & Aerospace Conference. June 5, 2007
 Scotia Capital Transportation & Aerospace Conference June 5, 2007 1 2 Changing the Game Changing the Game Canada s #1 domestic, trans-border and international airline Strong brand recognition Innovative
Grupo Viva Aerobus announces results for the third quarter of 2016
 Earnings Earnings Report Report 3 rd rd Quarter Quarter 2016 2016 Grupo Grupo Viva Viva Aerobus Aerobus Grupo Viva Aerobus announces results for the third quarter of 2016 Mexico City, Mexico, October 27,
Investor Presentation
 Investor Presentation December, 2011 FORWARD-LOOKING STATEMENTS This document contains forward-looking statements, including with respect to the negotiation, implementation and effects of the proposed
2018 Annual Meeting of Stockholders
 2018 Annual Meeting of Stockholders Playing the Long Game June 13, 2018 Doug Parker Chairman and Chief Executive Officer American Airlines Group Inc. Cautionary Statement Regarding Forward-Looking Statements
2012 Result. Mika Vehviläinen CEO
 2012 Result Mika Vehviläinen CEO 1 Agenda Market environment in Q4 Business performance and strategy execution Outlook Financials 2 Market Environment According to IATA, Global air travel continues to
OPERATING AND FINANCIAL HIGHLIGHTS. Subsequent Events
 Copa Holdings Reports Financial Results for the First Quarter of 2016 Excluding special items, adjusted net income came in at US$69.9 million, or EPS of US$1.66 per share Panama City, Panama --- May 5,
Management Presentation. September 2015
 Management Presentation September 2015 Forward looking statements This presentation as well as oral statements made by officers or directors of Allegiant Travel Company, its advisors and affiliates (collectively
Tiger Airways Holdings Limited FY11 Results
 Tiger Airways Holdings Limited FY11 Results May 2011 Financial Year Ended 31 March 2011 Disclaimer The information contained in this presentation (the "Information") is provided by Tiger Airways Holdings
Copa Holdings Reports Net Income of US$51.9 Million for the Fourth Quarter of 2008 and US$152.2 Million for Full Year 2008
 Copa Holdings Reports Net Income of US$51.9 Million for the Fourth Quarter of 2008 and US$152.2 Million for Full Year 2008 Panama City, Panama --- February 19, 2009. Copa Holdings, S.A. (NYSE: CPA), parent
COPA HOLDINGS, S.A. Investor Luncheon 2014 May 30, 2014
 COPA HOLDINGS, S.A. Investor Luncheon 2014 May 30, 2014 Safe Harbor Statement Statements in this presentation that are not reported financial results or other historical information are forward-looking
FOURTH QUARTER RESULTS 2017
 FOURTH QUARTER RESULTS 2017 KEY RESULTS In the 4Q17 Interjet total revenues added $5,824.8 million pesos that represented an increase of 10.8% over the revenue generated in the 4Q16. In the 4Q17, operating
Norwegian Air Shuttle ASA
 Norwegian Air Shuttle ASA Q1 2018 Presentation 26 April 2018 Highlights Q1 2018 Successfully completed private placement of NOK 1.3 billion Added two 737-800s and six 787-9s to operations Launched interline
Air Berlin PLC AGM 18 June 2014 London
 Air Berlin PLC AGM 18 June 2014 London Executive summary (1) Key Highlights 2013 2013: a challenging year for airberlin Operational loss of 231.9 million euros Group revenue down in line with capacity