Cathay Pacific Airways 2013 Analyst Briefing 25 June Cathay Pacific Airways 2013 Analyst Briefing 25 June 2013
|
|
|
- Allan Henderson
- 5 years ago
- Views:
Transcription

1 Cathay Pacific Airways 2013 Analyst Briefing 25 June 2013 Cathay Pacific Airways 2013 Analyst Briefing 25 June
2 Operating Performance The challenging business environment continues into the first half of Continued weak demand in the air cargo markets. Some improvement in the passenger business, particularly longhaul demand, but yield pressure short-haul. Persistent high price of jet fuel. Lower operating costs due to reduced capacity and the withdrawal of older, less fuel-efficient aircraft. 2
 51,832,911-5.")
3 Performance to May 13 - Capacity Data CATHAY PACIFIC/ DRAGONAIR COMBINED CAPACITY Cumulative May 2013 % change YTD China 4,720, % North East Asia 6,976, % South East Asia 7,520, % India, Middle East, Pakistan & Sri Lanka 4,471, % South West Pacific & South Africa 7,386, % North America 12,215, % Europe 8,541, % ASK ( 000) 51,832, % Passenger load factor 80.6% 1.0pt Available cargo and mail tonne km ( 000) 5,463, % Cargo and mail load factor 62.6% -1.4pt ATK ( 000) 10,392, % 3

 (RTK) 3,419,757-4.")
4 Performance to May 13 - Traffic Data CATHAY PACIFIC AND DRAGONAIR COMBINED TRAFFIC Cumulative May 2013 % change YTD China 3,324, % North East Asia 5,231, % South East Asia 5,942, % India, Middle East, Pakistan & Sri Lanka 3,332, % South West Pacific & South Africa 5,804, % North America 10,813, % Europe 7,307, % RPK ( 000) 41,755, % Passengers carried 12,012, % Cargo and mail revenue tonne-km ( 000) (RTK) 3,419, % Cargo and mail carried kg ( 000) 618, % Number of flights 29, % 4

5 Operating Performance - Passenger Passenger demand is strong on long-haul routes for all classes. Reduced capacity largely in long-haul frequencies, enabled improvement which transpired to yield improvement. Demand on regional routes did not keep pace with the increase in capacity. The Asia Pacific region was affected by H7N9 avian flu outbreak, political issues in the Korean peninsula and an earthquake in Sichuan. 5

6 Passenger Services Development in 2013 Cathay Pacific Restored the frequencies on long-haul routes cancelled as part of 2012 cost reduction. In March, services to Toronto were restored from 7 to 10 and from June Los Angeles to 3 times daily. New York will be four times daily from September. Added a fifth daily flight between London and Hong Kong in June. Increased the service between Bangkok and Hong Kong by adding 5 weekly flights, resulting in 47 weekly flights from July. Enhanced Mumbai service from March by changing three weekly flights to non-stop, brining a total of 10 weekly non-stop flights. 6
7 Passenger Services Development in 2013 Dragonair New services New services to Wenzhou, Yangon and Zhengzhou were introduced in January. New service to Da Nang was introduced in March. Addition of frequencies Increased frequency to Kaohsiung in February. Increased frequencies to Chiang Mai, Kota Kinabalu and Wuhan in April. 7
8 90% PASSENGER LOAD FACTOR (JAN MAY 2013) 85% 80% 75% 70% JAN FEB MAR APR MAY JUN JUL AUG SEP OCT NOV DEC
9 Operating Performance - Cargo Weak demand in all major markets throughout the first half of Demand out of Hong Kong remained weak. General air cargo market remains weak, particularly in Europe. Transpacific routes held up better but still below expectations. Demand on routes within Asia is relatively robust, but yields are under pressure due to surplus capacity. 9
10 Cargo Services Development Suspended freighter operations to Brussels and Stockholm in February. Merged the separate services to Chongqing and Chengdu to reduce costs. Reduced Zhengzhou freighter schedule from six flights a week to three. 10
11 CARGO AND MAIL LOAD FACTOR (JAN MAY 2013) 85% 80% 75% 70% 65% 60% 55% 50% JAN FEB MAR APR MAY JUN JUL AUG SEP OCT NOV DEC
12 150 USD/Bbl - Brent- Daily Closing Price and 250 Day Simple Moving Average Brent Daily Close Brent 250 Day SMA 12
13 190 USD/Bbl - Brent and Sing Jet Daily Closing Price Brent Daily Close Sing Jet Daily Close 13

14 2012 Cost-Saving Measures continued into 1H 2013 Reduce passenger and cargo capacity. Deploy more fuel-efficient aircraft on long-haul flights. Accelerate the retirement of the old Boeing s. Hiring freeze on new or replacement ground staff except those who are critical to operations. Offer voluntary unpaid leave for cabin crew. Cancel all non-essential business travel. Reduce marketing and IT spend. 14
 - - - Parked aircraft - (1) (1) - 1 1 Sold to ACCJV - (1) (1) - - - Sold to Boeing - (1) (1) - (2) (2) Retired (1) - (1) - - - Deregistered (3) - (3) - - - 30 Jun 2013 (projected) 150 21 171-2 2")
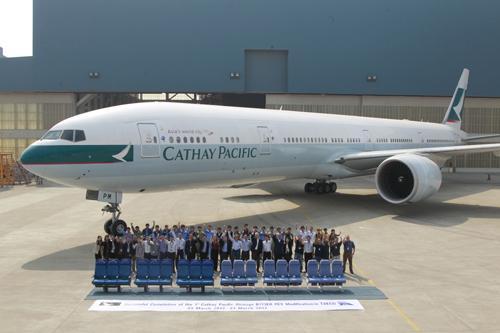
15 CX and KA Fleet Plan 2013 till 30 June 2013 In operation Parked Passenger Freighter Total Passenger Freighter Total 31 Dec New deliveries (a) Returned to lessor (1) - (1) Parked aircraft - (1) (1) Sold to ACCJV - (1) (1) Sold to Boeing - (1) (1) - (2) (2) Retired (1) - (1) Deregistered (3) - (3) Jun 2013 (projected) (a) Two A , Three B ER and one B747-8F were delivered during the first half of
16 New Aircraft as at June 2013 Orders brought forward at 1 Jan Delivered (6) New Orders in February 2013 (Two A ) 2 New Orders in March 2013 (Three B747-8F) 3 Cancellation of orders (Eight B F) (8) Total as at 30 Jun 2013 (Projected) 83 16
17 Aircraft Delivery Plan as at June B747-8F 4 4 A A A A B ER Total

18 Fleet out of operation in 2013 Freighter Boeing BCF Four Boeing BCF were disposed of in a trade-in deal with the Boeing Company entered into in March. Three out of four aircraft were deregistered and in first half Remaining one to be sold in August. The last of four Boeing BCF was sold to ACCJV in March. Passenger Boeing Deregistered three Boeing s in first half Retired one Boeing in June. 18


19 Fleet & Scheduling Retirement Plan As of 24 June 2013 Exit date Number Remaining Mar Jun Oct
20 Cargo Fleet Plan 2013 Forecast fleet composition as at 30 Jun x 747 Freighters : 6 x F, 6 x ERF, 2 x BCF and 9 x 747-8F. Latest development New delivery 747-8F 4 orders to be delivered in second half of
21 Development in 2013 Passenger 9 aircraft deliveries in second half of 2013 and 14 in Projected ASK contraction in 2013 is approximately 1.7%. Cargo 4 aircraft (B747-8F) to be delivered in second half Projected DL ATK contraction in 2013 is approximately 4.1%. 21
22 Major subsidiaries AHK Air Hong Kong Operates a fleet of eight owned Airbus A F, three Boeing BCF dryleased from Cathay Pacific and two wet-leased Airbus A F freighters. Expect an increase in profit in the first half of 2013 compared with first half of Cathay Pacific Catering Services Growth in the number of meals produced. Expect a decrease in profit in the first half of 2013 compared with first half of 2012 due to increase in operating costs. Asia Miles Membership exceeds 5 million worldwide. Increase in redemptions by Asia Miles members in first half of More than 90% of Cathay Pacific flights carry passengers who have redeemed frequent flyer miles through the Asia miles programme. 22


23 Cargo Terminal Development HK$5.9bn investment, commenced in three stages. First stage of operations commenced at February 2013, handling valuable cargo, transit civil mail and interface transfer transshipments. Stage Two operations commence in June, handling all transhipments, import cargo. Stage Three operations scheduled for September. 23

24 Cargo Terminal Development (Continued) Launch of new terminal will provide streamlined cargo solutions and innovative, tailor-made products that suit the needs of customers. It will greatly enhance the competitiveness and efficiency of Hong Kong as an airfreight hub. 24

25 Air China Cathay Pacific has a 20% interest in Air China. Cathay Pacific accounts for Air China for the 6 months ended 31 March 2013 and any significant events or transactions during their last quarter. Profits from Air China in the 6 months to 31 March 2013 were significantly down compared to the same period 2012 due to similar factors as Cathay Pacific high oil price, pressure on yield and weak cargo market. 25
26 Air China / Cathay Pacific Cargo Joint Venture CX acquired 49% economic interest in Air China Cargo (ACC), with the remaining 51% interest held by Air China. On 1 March 2013, ACC entered into agreements pursuant to which ACC has agreed to purchase 8 Boeing F freighters and to sell 7 Boeing BCF freighters to The Boeing Company. The 8 Boeing F are expected to deliver from late 2013 to CX sold the last of four Boeing BCF to ACCJV in the first half of

27 Air China / Cathay Pacific Cargo Joint Venture (Continued) Operating performance Performance of Air China Cargo has been weak but remains strategically important. Opened two new routes: Shanghai-Zhengzhou-Amsterdam and Shanghai-Chongqing-Frankfurt in March
28 Airline Strategy Grow our international network, expand frequencies and further develop Hong Kong as one of the world s leading aviation hubs. Ensure that quality and our brand are not compromised and the service proposition to the customer remains strong. Continue to develop the strategic relationship with Air China. Maintain a prudent approach to financial risk management. 28


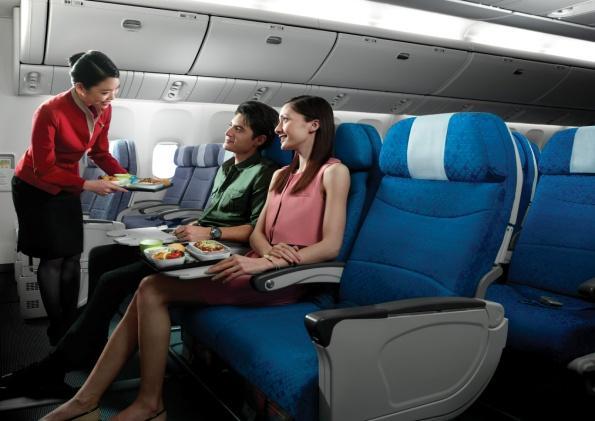
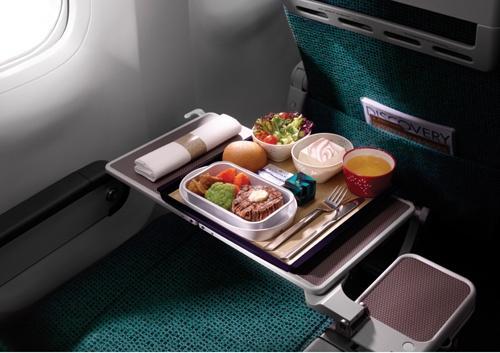
29 Product and Services New long-haul Economy Class seats New Business Class seats 29

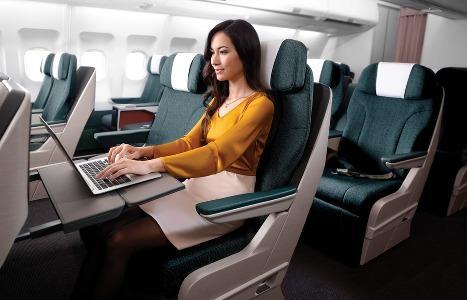
30 Product and Services (Continued) New Premium Economy Class 30


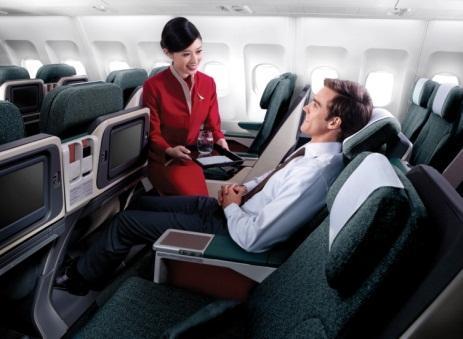
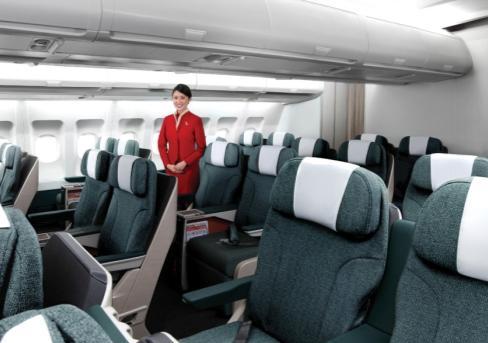
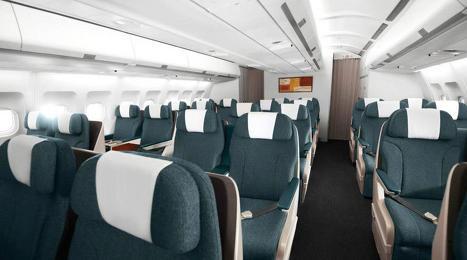
31 Product and Services (Continued) New Regional Business Class 31

32 Product and Services (Continued) New KA Business Class 32


33 Product and Services (Continued) New KA Economy Class 33

34 Product and Services (Continued) New Inflight Entertainment System for Dragonair 34


35 Product and Services (Continued) New Uniform for KA launched on March


36 Product and Services (Continued) Reopened the First Class Lounge in February


37 Product and Services (Continued) Upgrade of flagship web site for CX and KA 37
")
38 Product and Services (Continued) Upgrade of flagship web site for CX and KA (con t) 38

39 Product and Services (Continued) Mobile Boarding Pass has rolled out in AKL, AMS, BAH, CDG, DXB, FCO, FRA, HKG, JED, KHH, KUL, MXP, LHR, RMQ, TPE, SIN, YVR, YYZ and Japan ports. Development of new departure control system. 39


40 Awards Cathay Pacific awarded the World s Best Cabin Staff and Best Transpacific Airline honours in the annual Skytrax World Airline Awards programme in June. Dragonair awarded World s Best Regional Airline for the third time and Best Regional Airline in Asia. Skytrax is one of the most comprehensive customer satisfaction surveys in the airline industry. 40
41 Financial Risk Management Currency All major currencies are hedged in compliance with our policy. Liquidity A total of HK$3.2billion with tenors of 5 or 10 years raised through MTN programme since first issue in Oct Unpledged liquid funds and undrawn committed lines HK$22.3bn as at 31 May Interest rates Overall cost of debt remains low. Margins have widened, but yield curve at historically attractive levels. Strategic management of fixed / floating ratio taking advantage of low fixed rates to lock in aircraft financing. 41
42 Net debt to equity ratio May 2013 Dec 2012 Dec 2011 Dec 2010 Dec 2009 Dec 2008 Dec 2007 Dec Continue to adopt prudent financial strategy, maintain adequate cash reserves. CAPEX on new aircraft, product enhancement and cargo terminal will be over HK$26B in the next 3 years. 42
43 Fuel hedging Coverage Fuel Hedging Fuel Hedging Coverage 35% 30% 25% 20% 15% 10% 5% 0% Brent (US$/barrel) Jun-Dec Brent (US$/barrel) 43

44 Outlook Global economic uncertainties continue into the second half of 2013, impacting passenger demand. Cargo demand remains weak. Fuel price remains high, but we benefit from the recent decline. Cost cutting measures initiated in 2012 will continue to yield benefits. Continued enhancement of products and services to strengthen our competitive edge. 44

45 Q & A For more information, please visit our website 45
Cathay Pacific Airways 2013 Analyst Briefing 25 June Cathay Pacific Airways Analyst Briefing 27 November 2013
 Cathay Pacific Airways 2013 Analyst Briefing 25 June 2013 Cathay Pacific Airways Analyst Briefing 27 November 2013 2013 Operating Performance to date: Passenger yield and load factor growth on lower ASKs.
Cathay Pacific Airways 2012 Analyst Briefing 28 June 2012
 Cathay Pacific Airways 2012 Analyst Briefing 28 June 2012 1 Airline Strategy Grow our international network, expand frequencies and further develop Hong Kong as one of the world s leading aviation hubs
Cathay Pacific Airways Analyst Briefing 27 November 2012
 Cathay Pacific Airways Analyst Briefing 27 November 2012 1 Trading Statement 2012 A very challenging year High fuel prices Soft premium demand High competition in Economy Class putting pressure on yield
Cathay Pacific Airways Interim Results for the six months ended 30 June 2012
 Cathay Pacific Airways Interim Results for the six months ended 30 June 2012 8 August 2012 1 Interim Result 1H2012 1H2011 Change Group attributable (loss) / profit HK$ million (935) 2,808-133.3% Group
Cathay Pacific Airways 2011 Analyst Briefing 23 June 2011
 Cathay Pacific Airways 2011 Analyst Briefing 23 June 2011 1 Airline Strategy Grow our international network, expand frequencies and further develop Hong Kong as one of the world s leading aviation hubs
Cathay Pacific Airways Analyst Briefing. 21 November 2014
 Cathay Pacific Airways Analyst Briefing 21 November 2014 Operating Performance Passenger demand remains strong, although growth in North America is significantly short of increase in capacity. Demand for
Cathay Pacific Airways
 Cathay Pacific Airways Interim Results for the six months ended 30 th June 2014 13th August 2014 1 Interim Results 1H2014 1H2013 Change Profit attributable to the shareholders of Cathay Pacific HK$ million
Analyst Briefing. 12 June Cathay Pacific Airways Limited
 Analyst Briefing 12 June 2015 Cathay Pacific Airways Limited Operating Performance The positive operating environment continues into the first half of 2015. Robust passenger demand and healthy cargo demand.
Analysts Briefing. 18 March Cathay Pacific Airways Limited
 Analysts Briefing 18 March 2015 Cathay Pacific Airways Limited Annual Results 2014 2013 Change Group attributable profit HK$m 3,150 2,620 +20.2% Group turnover HK$m 105,991 100,484 +5.5% Profit margin
Analysts Briefing. 27 November Cathay Pacific Airways Limited
 Analysts Briefing 27 November 2015 Cathay Pacific Airways Limited Operating performance - overview Passenger load factors are high, driven by strong back-end demand. Passenger front-end yield and load
Analysts Briefing. 24 June Cathay Pacific Airways Limited
 Analysts Briefing 24 June 2016 Cathay Pacific Airways Limited Operating performance - overview Challenging business environment. Load factor lower than expectations on weakening passenger demand. Strong
Cathay Pacific Airways
 Cathay Pacific Airways Annual Results for the year ended 31 st December 2011 14 March 2012 1 Annual Result 2011 2010 Change Group attributable profit HK$5,501m HK$14,048m -60.8% Group Turnover HK$98,406m
Cathay Pacific Airways Analyst & Investor Briefing June Cathay Pacific Airways Interim Results 6 August 2008
 Cathay Pacific Airways 2010 Analyst & Investor Briefing June 2010 Cathay Pacific Airways 2008 Interim Results 6 August 2008 Airline Strategy Remains largely unchanged Grow our international network, expand
Credit Suisse. 19 th Annual AIC 8 th April Cathay Pacific Airways Limited
 Credit Suisse 19 th Annual AIC 8 th April 2016 Cathay Pacific Airways Limited Annual Results - 2015 Group Financial Statistics 2015 2014 % Var Group Revenue HK$m 102,342 105,991-3.4% Group attributable
Cathay Pacific Airways Cathay Pacific Airways 2008 Annual Results Investor Relations Meeting 11 March June 2009
 Cathay Pacific Airways Cathay Pacific Airways 2008 Annual Results Investor Relations Meeting 11 March 2009 22 June 2009 Airline Strategy Continue to grow our extensive international network, expand frequencies
Cathay Pacific Airways 2010 Annual Results 9 March 2011
 Cathay Pacific Airways 2010 Annual Results 9 March 2011 1 Annual Result 2010 2009 Change Group Profit/(Loss) HK$14,048m HK$4,694m +199.3% Group Turnover HK$89,524m HK$66,978m +33.7% Profit Margin 15.7%
Cathay Pacific Airways Annual Results 10 March Cathay Pacific Airways Interim Results 6 August 2008
 Cathay Pacific Airways 2009 Annual Results 10 March 2010 Cathay Pacific Airways 2008 Interim Results 6 August 2008 Annual Result 2009 2008 (restated) Group Profit/(Loss) HK$4,694m (HK$8,696m) Group Turnover
Cathay Pacific Airways 2011 Interim Results 10 August 2011
 Cathay Pacific Airways 2011 Interim Results 10 August 2011 1 Interim Result 1H 2011 1H 2010 Group profit HK$2,808m HK$6,840m Group turnover HK$46,791 HK$41,337m Profit margin 6.0% 16.5% Return on capital
Cathay Pacific Airways Interim Results 04 August Cathay Pacific Airways Interim Results 6 August 2008
 Cathay Pacific Airways 2010 Interim Results 04 August 2010 Cathay Pacific Airways 2008 Interim Results 6 August 2008 Interim Result 1H 2010 1H 2009 Group Profit/(Loss) HK$6,840m HK$812m Group Turnover
Analysts Briefing. 15 March Cathay Pacific Airways Limited
 Analysts Briefing 15 March 2017 Cathay Pacific Airways Limited Annual Results - 2016 Group Financial Statistics 2016 2015 % Var Group Revenue HK$m 92,751 102,342-9.4% Group attributable profit/(loss) Million
Air China Limited Annual Results. March Under IFRS
 Air China Limited 21 Annual Results Under IFRS March 211 Agenda Part 1 Highlights Part 2 Business Overview Part 3 Financial Overview Part 4 Outlook 2 Part 1 Highlights Steady Economic Growth; Asia Pacific
Analyst Presentation. 9 th June 2006
 Analyst Presentation 9 th June 2006 1 Existing Principal Shareholding Structure CITIC Pacific 46.30% 25.40% 10.00% 68.36% CNAC(HK) 43.29% 7.71% 17.79% 28.50% Dragonair Source: Announcement on 9 th June
Cathay Pacific Airways Limited. Stock Code: Interim Report
 Cathay Pacific Airways Limited Stock Code: 00293 2013 Interim Report Hong Kong Cathay Pacific Cathay Pacific Freighter Dragonair Air Hong Kong Contents 2 Financial and Operating Highlights 3 Chairman s
Air China Limited Interim Results. August Under IFRS
 Air China Limited 21 Interim Results Under IFRS August 21 1 Agenda 21 Interim Results Overview Business Overview Financial Overview Outlook 2 2 2 21 Interim Results 3 21 Interim Results Overview 4 4 4
CATHAY PACIFIC ANNOUNCES 2013 ANNUAL RESULTS
 Media Information 12 March 2014 CATHAY PACIFIC ANNOUNCES 2013 ANNUAL RESULTS Results 2013 2012 (restated) Change Turnover HK$ million 100,484 99,376 +1.1% Profit attributable to the owners of Cathay Pacific
Air China Limited 2014 Annual Results Under IFRS
 Air China Limited 2014 Annual Results Under IFRS March 2015 Agenda Part 1 Results Highlights Part 2 Business Overview Part 3 Financial Overview Part 4 Outlook Part 1 Results Highlights Gradual Global Economic
2007/08 Full Year Results Investor Briefing
 2007/08 Full Year Results Investor Briefing Highlights of Result Profit before tax up 46% to $1,408 million Up 36% on the reported result Margin improvement $3 billion of Sustainable Future Benefits achieved
Third Quarter 2014 Results. 29 October 2014
 Third Quarter 2014 Results 29 October 2014 Highlights of the Third Quarter Operating environment Air France-KLM Economic environment remains weak Further currency volatility affecting revenues and results
CATHAY PACIFIC AIRWAYS LIMITED (Incorporated in Hong Kong with limited liability) (Stock Code: 00293)
 (Stock Code: 00293)") Hong Kong Exchanges and Clearing Limited and The Stock Exchange of Hong Kong Limited take no responsibility for the contents of this announcement, make no representation as to its accuracy or completeness
Hong Kong Exchanges and Clearing Limited and The Stock Exchange of Hong Kong Limited take no responsibility for the contents of this announcement, make no representation as to its accuracy or completeness
CATHAY PACIFIC AIRWAYS LIMITED (Incorporated in Hong Kong with limited liability)
") Hong Kong Exchanges and Clearing Limited and The Stock Exchange of Hong Kong Limited take no responsibility for the contents of this announcement, make no representation as to its accuracy or completeness
Hong Kong Exchanges and Clearing Limited and The Stock Exchange of Hong Kong Limited take no responsibility for the contents of this announcement, make no representation as to its accuracy or completeness
Information meeting. 1 st September 2011
 Information meeting 1 st September 2011 Full Year 2010-11 key data April 2010-March 2011 Revenues in billions Operating result in millions 77% Passenger 18.10 +11.3% -44 +874 13% Cargo 3.16 +29.5% +69
SIA ANALYST/MEDIA BRIEFING Q2 and 1H FY17/18 Results 8 November 2017
 SIA ANALYST/MEDIA BRIEFING Q2 and 1H FY17/18 Results 8 November 2017 THE PARENT AIRLINE Q2 AND 1H FY17/18 RESULTS THE PARENT AIRLINE COMPANY OPERATING PERFORMANCE Q2 % 1H % FY17/18 Change FY17/18 Change
Singapore Airlines Group Analyst/Media Briefing HALF YEAR FY RESULTS 5 NOVEMBER 2012 THE PARENT AIRLINE 1H FY2012/13 RESULTS
 Singapore Airlines Group Analyst/Media Briefing HALF YEAR FY2012-13 13 RESULTS 5 NOVEMBER 2012 THE PARENT AIRLINE 1H FY2012/13 RESULTS THE PARENT AIRLINE COMPANY RESULTS 2Q & 1H FY12/13 2Q/12 $million
Advancing World-Class Service
 Aviation Division Advancing World-Class Service We aim to continue to improve our products and services on the ground and in the air, to strengthen our aircraft engineering business and to expand our fleet
AIR NEW ZEALAND ANNUAL RESULTS ANNUAL RESULTS
 AIR NEW ZEALAND ANNUAL RESULTS 2008 1 HIGHLIGHTS Record operating revenue, up 9% Normalised earnings* $197m Net cash position of $1.3bn Launched direct service to Vancouver and Beijing Award winning product
Part 1 Performance Highlights. Part 2 Business Overview. Part 3 Financial Review
 August 216 1 Part 1 Performance Highlights Part 2 Business Overview Part 3 Financial Review Part 4 Outlook 2 Under IFRS 3 Part 1 Performance Highlights Performance Highlights - Key Operational Metrics
THAI AIRWAYS INTERNATIONAL PCL
 THAI AIRWAYS INTERNATIONAL PCL 2Q2017 analysts briefing 16-Aug-2017 1 DISCLAIMER The information contained herein is intended to represent the Company s operating and financial position at a given point
14 Swire Pacific 2012 Annual Report
 We aim to continue to improve our products and services on the ground and in the air, to strengthen our aircraft engineering business and to expand our fleet by acquiring fuel efficient aircraft. 14 Swire
SAS Group Presentation Carnegie, May 22, 2012 Sture Stölen, Head of IR
 SAS Group Presentation Carnegie, May 22, 2012 Sture Stölen, Head of IR 1 This is the SAS Group 128 destinations 27,2 million passengers 28 new routes to be launched 2012 1,085 daily flights Revenues 2011,
Passenger services 7,438 10,550 Cargo services 4,405 4,225 Catering and other services Turnover 1 12,275 15,511
 Cathay Pacific Airways Limited - 2003 Interim Results Consolidated Profit and Loss Account - Unaudited Six months ended 30th June 2003 2002 Note Passenger services 7,438 10,550 Cargo services 4,405 4,225
Navigating through Turbulence. Andrew Herdman AAPA Director General IFSA ITCA WAEA Asia Pacific Conference Kuala Lumpur Malaysia, 29 April 2009
 Asia Pacific Aviation Navigating through Turbulence Andrew Herdman AAPA Director General IFSA ITCA WAEA Asia Pacific Conference Kuala Lumpur Malaysia, 29 April 2009 Presentation Outline Asia Pacific Aviation
First Half 2013 Results. 16 mai 2013
 First Half 2013 Results 16 mai 2013 26 July 2013 Results Increasing effects of Transform 2015 Highlights of the First Half A difficult global economic environment Transform 2015 plan roll-out on track
Information meeting. 12 September 2011
 Information meeting 12 September 2011 Full Year 2010-11 key data April 2010-March 2011 Revenues in billions Operating result in millions 77% Passenger 18.10 +11.3% -44 +874 13% Cargo 3.16 +29.5% +69 +505
Interim Management Report First Half Results 2010/11. October 29, 2010
 Interim Management Report First Half Results 2010/11 October 29, 2010 Disclaimer Certain information included in these statements is forward-looking and involves risks and uncertainties that could cause
The Accounting Case Competition for Secondary Schools and Tertiary Institutes. Tertiary Institutes Group
 The Accounting Case Competition for Secondary Schools and Tertiary Institutes 2004 Time allowed 2 hours Answer ALL the questions Marks Section A 50 Section B 20 Section C 15 Section D 15 100 DO NOT OPEN
2003/04 Full Year Results Presentation to Investors
 2003/04 Full Year Results Presentation to Investors 19 August 2004 Geoff Dixon Chief Executive Officer Highlights 12 months to June 2004 12 months to June 2003 Increase/ (decrease) % Sales and operating
Overview. > Normalised earnings* before taxation of, up 30% > Statutory earnings before taxation of, up 40% > Statutory net profit after taxation of
 1 Overview > Normalised earnings* before taxation of, up 30% > Statutory earnings before taxation of, up 40% > Statutory net profit after taxation of > Operating revenue of > Strong operating cash flow
Cathay Pacific is committed to building its network and connectivity and so to strengthen Hong Kong s position as a major aviation hub.
 Connecting Worlds together 26 Swire Pacific Annual Report 2010 Cathay Pacific is committed to building its network and connectivity and so to strengthen Hong Kong s position as a major aviation hub. Swire
NEWS RELEASE ON FINANCIAL RESULTS FOR THE THREE MONTHS ENDED 31 DECEMBER 2003 CONTINUED RECOVERY IN THIRD FINANCIAL QUARTER
 No. 01/04 5 February 2004 NEWS RELEASE ON FINANCIAL RESULTS FOR THE THREE MONTHS ENDED 31 DECEMBER 2003 CONTINUED RECOVERY IN THIRD FINANCIAL QUARTER MAIN POINTS OF THE GROUP S RESULTS Oct-Dec 03 Oct-Dec
Information meeting. September 2011
 Information meeting September 2011 Full Year 2010-11 key data April 2010-March 2011 Revenues in billions Operating result in millions 77% Passenger 18.10 +11.3% -44 +874 13% Cargo 3.16 +29.5% +69 +505
Analysts and Investors conference call. Q results. 15 May 2013
 Analysts and Investors conference call Q1 2013 results 15 May 2013 Management summary Key messages of Q1 2013 +6% +9% +3.3%p. Q1 2013 operational KPIs are in line with 109.7 116.2 6.5 7.1 82.3 85.6 expectations,
FIRST QUARTER OPERATING PROFIT IMPROVES TO $274 MILLION
 1 August 2006 Page 1 of 4 No. 03/06 1 August 2006 FIRST QUARTER OPERATING PROFIT IMPROVES TO $274 MILLION HIGHLIGHTS OF THE GROUP S PERFORMANCE 1st Quarter 2006-07 Year-on-Year % Change Operating revenue
Cathay Pacific Airways Limited
 Cathay Pacific Airways Limited Stock Code: 00293 2012 Interim Report Hong Kong Cathay Pacific Cathay Pacific Freighter Dragonair Air Hong Kong CONTENTS 2 Financial and Operating Highlights 3 Chairman s
FY key data Passenger. Cargo. Maintenance. Other. Operating result in m. Revenues in bn -10.4% 78% 11%
 Information meeting FY 2009-10 key data Revenues in bn Operating result in m 78% Passenger 16.3-13.6% -918 11% Cargo 2.4-27.8% -436 5% Maintenance 1.0-4.0% +81 6% Other 1.3-12 -10.4% 2 Our industry is
CONSOLIDATED PROFIT AND LOSS ACCOUNT
 CONSOLIDATED PROFIT AND LOSS ACCOUNT for the year ended 31st December Turnover Note Passenger services 26,407 18,663 Cargo services 11,395 9,913 Catering and other services 1,263 1,002 Total turnover 1
SAS Group Asia Tour Financial Hearing Presentation May 14, 2012
 SAS Group Asia Tour Financial Hearing Presentation May 14, 2012 1 This is the SAS Group 128 destinations 27,2 million passengers 28 new routes to be launched 2012 1,085 daily flights Revenues 2011, MSEK
Media Release. Qantas Group Full Year 2017 Financial Result 1. Sydney, 25 August 2017
 Media Release Qantas Group Full Year 2017 Financial Result 1 Sydney, 25 August 2017 Underlying Profit Before Tax: $1,401 million (second highest in Qantas history) Statutory Profit Before Tax: $1,181 million
AIR FRANCE-KLM RESULTS PRESENTATION
 AIR FRANCE-KLM RESULTS PRESENTATION Results as at 30 th of June 2018 1 st August 2018 SECOND QUARTER 2018: KEY HIGHLIGHTS Leveraging ongoing solid demand +0.8% +1.7% Stable operating result before strike
2012 Result. Mika Vehviläinen CEO
 2012 Result Mika Vehviläinen CEO 1 Agenda Market environment in Q4 Business performance and strategy execution Outlook Financials 2 Market Environment According to IATA, Global air travel continues to
Bank of America Merrill Lynch 2018 Emerging Markets Corporate Credit Conference. Miami, May 2018
 Bank of America Merrill Lynch 2018 Emerging Markets Corporate Credit Conference Miami, May 2018 This presentation may include forward-looking comments regarding the Company s business outlook and anticipated
Air China Limited Announces 2010 Annual Results
 Air China Limited Announces 2010 Annual Results Profit reaches record high on strong economic growth Hong Kong March 29, 2011 Air China Limited ( Air China or the Company, together with its subsidiaries,
Building A New Silk Road Capacity Planning and Selecting Markets. Greg Kaldahl SVP Resource Management
 Building A New Silk Road Capacity Planning and Selecting Markets Greg Kaldahl SVP Resource Management 1 The Airline Industry Is In A State Of Constant Change Market cap ( bn) as of 1 Jan 1999 10 9.3 NA/EU
2014 Annual Results 1
 1 2014 Annual Results Annual Results 2014 2013 Change HK$M HK$M Attributable profit 573 625-8.3% Revenue 11,927 7,387 +61.5% Earnings per share (HK$) 3.45 3.76-8.3% Total dividends per share (HK$) 2.10
Air China Limited Announces 2010 Interim Results
 Air China Limited Announces 2010 Interim Results Record High First Half Results Leveraging New Opportunities to Drive Growth Hong Kong August 25, 2010 Air China Limited ( Air China or the Company, together
Finnair Group Interim Report 1 January 30 June 2008
 Finnair Group Interim Report 1 January 30 June 2008 1 08/08/2008 Presentation name / Author Airline industry at a historical turning point Fuel price has a stranglehold on the business Average ticket prices
Group First Half Account Settlement For FY2007
 JAL GroupFirst Half Account Settlement For FY2007 Nov 7 th 2007 Japan Airlines JAL 2007 1 Disclaimer Unless specifically dealing with matters of historical fact, the plans, forecasts and strategies described
Finnair 2015 kolmannen vuosineljänneksen tulos
 Finnair 215 kolmannen vuosineljänneksen tulos Q3 Result 215 3 October 215 3.1.215 Toimitusjohtaja Pekka Vauramo Talousjohtaja Pekka Vähähyyppä 1 Highlights of the quarter Excellent Q3 result: Record result
CATHAY PACIFIC AIRWAYS LIMITED (Incorporated in Hong Kong with limited liability) (Stock Code: 00293)
 (Stock Code: 00293)") Hong Kong Exchanges and Clearing Limited and The Stock Exchange of Hong Kong Limited take no responsibility for the contents of this announcement, make no representation as to its accuracy or completeness
Hong Kong Exchanges and Clearing Limited and The Stock Exchange of Hong Kong Limited take no responsibility for the contents of this announcement, make no representation as to its accuracy or completeness
CATHAY PACIFIC AIRWAYS LIMITED (Incorporated in Hong Kong with limited liability) (Stock Code: 293)
 (Stock Code: 293)") CATHAY PACIFIC AIRWAYS LIMITED (Incorporated in Hong Kong with limited liability) (Stock Code: 293) 2006 Interim Results Financial and Operating Highlights Group Financial Statistics 2006 2005 Change Results
CATHAY PACIFIC AIRWAYS LIMITED (Incorporated in Hong Kong with limited liability) (Stock Code: 293) 2006 Interim Results Financial and Operating Highlights Group Financial Statistics 2006 2005 Change Results
JAPAN AIRLINES Financial Results 2 nd Quarter Mar / 2014 (FY2013)
") JAPAN AIRLINES Financial Results 2 nd Quarter Mar / 2014 (FY2013) Yoshiharu Ueki, President Norikazu Saito, Managing Executive Officer 31 October, 2013 Contents P.2 P.3 P.4 P.6 1 Overview of 2 nd Quarter
JAPAN AIRLINES Financial Results 2 nd Quarter Mar / 2014 (FY2013) Yoshiharu Ueki, President Norikazu Saito, Managing Executive Officer 31 October, 2013 Contents P.2 P.3 P.4 P.6 1 Overview of 2 nd Quarter
Singapore Airlines Group Analyst/Media Briefing HALF YEAR FY RESULTS. 13 November 2013 THE PARENT AIRLINE 1H FY2013/14 RESULTS
 Singapore Airlines Group Analyst/Media Briefing HALF YEAR FY2013-14 14 RESULTS 13 November 2013 THE PARENT AIRLINE 1H FY2013/14 RESULTS THE PARENT AIRLINE COMPANY RESULTS 2Q & 1H FY13/14 2Q/13 $million
Leaving the Competition Behind. Second Quarter (Apr-Jun) 2009 Results
 2009 Results") Leaving the Competition Behind Second Quarter (Apr-Jun) 2009 Results 12 Aug 2009 1 Disclaimer Information contained in our presentation is intended solely for your reference. Such information is subject
Leaving the Competition Behind Second Quarter (Apr-Jun) 2009 Results 12 Aug 2009 1 Disclaimer Information contained in our presentation is intended solely for your reference. Such information is subject
CATHAY PACIFIC AIRWAYS LIMITED (Incorporated in Hong Kong with limited liability) (Stock Code: 00293)
 (Stock Code: 00293)") Hong Kong Exchanges and Clearing Limited and The Stock Exchange of Hong Kong Limited take no responsibility for the contents of this announcement, make no representation as to its accuracy or completeness
Hong Kong Exchanges and Clearing Limited and The Stock Exchange of Hong Kong Limited take no responsibility for the contents of this announcement, make no representation as to its accuracy or completeness
THIRD QUARTER NET PROFIT OF $397 MILLION ON RECORD REVENUE
 THIRD QUARTER NET PROFIT OF $397 MILLION ON RECORD REVENUE HIGHLIGHTS OF THE GROUP S PERFORMANCE 3rd Quarter 2005-06 9 Months 2005-06 Year-on-Year Apr-Dec % Change 2005 Oct-Dec 2005 Year-on-Year % Change
Finnair Group Interim Report 1 January 31 March 2008
 Finnair Group Interim Report 1 January 31 March 2008 1 29/04/2008 Presentation name / Author Outlook for the industry less positive Growth of demand declining due to uncertainty of global economy Growth
Air Berlin PLC AGM 06 June 2013 London
 Air Berlin PLC AGM 06 June 2013 London airberlin a strong European carrier Market position as of 31 December 2012 No. 2 in core market: Germany / Austria / Switzerland No. 7 in Europe with 33.3 m guests
JET AIRWAYS (I) LTD. Presentation on Financial Results Q July 24, 2009
 LTD. Presentation on Financial Results Q July 24, 2009") JET AIRWAYS (I) LTD Presentation on Financial Results Q1 2010 July 24, 2009 1 1 1 Agenda Domestic operating environment Jet Airways performance highlights JetLite performance highlights Outlook 2 2 2 Domestic
JET AIRWAYS (I) LTD Presentation on Financial Results Q1 2010 July 24, 2009 1 1 1 Agenda Domestic operating environment Jet Airways performance highlights JetLite performance highlights Outlook 2 2 2 Domestic
RECORD REVENUE AND EFFICIENCY DRIVE SOFTEN IMPACT OF HIGH FUEL COST, ENABLE HALF YEAR PROFIT OF $578 MILLION
 RECORD REVENUE AND EFFICIENCY DRIVE SOFTEN IMPACT OF HIGH FUEL COST, ENABLE HALF YEAR PROFIT OF $578 MILLION HIGHLIGHTS OF THE GROUP S PERFORMANCE First Half 2005-06 2nd Quarter 2005-06 Apr-Sep 2005 Year-on-Year
PROFIT OF $1.24b ON STRONG REVENUE GAINS BUT FUEL COSTS REMAIN GREATEST CHALLENGE
 PROFIT OF $1.24b ON STRONG REVENUE GAINS BUT FUEL COSTS REMAIN GREATEST CHALLENGE HIGHLIGHTS OF THE GROUP S PERFORMANCE Financial Year 2005-06 4th Quarter 2005-06 Apr 2005 Mar 2006 Year-on-Year % Change
Airline industry outlook remains fragile
 Airline industry outlook remains fragile June 2009 www.iata.org/economics To represent, lead and serve the airline industry Airline industry outlook remains fragile Green shoots starting to appear Recovery
JAPAN AIRLINES Co., Ltd. Financial Results 1 st Quarter Mar/2018(FY2017)
") JAPAN AIRLINES Co., Ltd. Financial Results Mar/2018(FY2017) July 31, 2017 Today s Topics P.1 P.2 P.3 P.4 P.6 P.15 Overview of Financial Results for (FY2017) 1 st quarter resulted in an increase in both
JAPAN AIRLINES Co., Ltd. Financial Results Mar/2018(FY2017) July 31, 2017 Today s Topics P.1 P.2 P.3 P.4 P.6 P.15 Overview of Financial Results for (FY2017) 1 st quarter resulted in an increase in both
Air China Limited Announces 2009 Annual Results
 Air China Limited Announces 2009 Annual Results Record Operating Profit in Complex Market Environment Strengthened Position to Capture Growth Opportunities Hong Kong April 22, 2010 Air China Limited (
FIRST QUARTER OPERATING PROFIT RISES TO $281 MILLION
 27 July 2017 Page 1 of 5 No. 03/17 27 July 2017 FIRST QUARTER OPERATING PROFIT RISES TO $281 MILLION Revenue improvement seen for all SIA Group airlines, but pressure on yields remains Earnings supported
SECOND QUARTER OPERATING PROFIT IMPROVES TO $87 MILLION
 12 November 2013 Page 1 of 5 No. 05/13 12 November 2013 SECOND QUARTER OPERATING PROFIT IMPROVES TO $87 MILLION GROUP FINANCIAL PERFORMANCE Second Quarter 2013-14 The Group earned an operating profit of
Cathay Pacific Airways Limited Stock Code: Annual Report 2012
 Cathay Pacific Airways Limited Stock Code: 00293 Annual Report Hong Kong Contents 2 Financial and Operating Highlights 3 Chairman s Letter 5 in Review 16 Review of Operations 24 Financial Review 32 Directors
SHAPING A SUSTAINABLE FUTURE
 SHAPING A SUSTAINABLE FUTURE Full Year Results Year ended 31 March 2017 Analyst and Investor Presentation 8 June 2017 Agenda Introduction Christine Ourmieres-Widener Financial Review Philip de Klerk Performance
JAPAN AIRLINES Co., Ltd. Financial Results 1 st Quarter Mar/2017(FY2016) July 29, 2016
 July 29, 2016") JAPAN AIRLINES Co., Ltd. Financial Results Mar/2017(FY2016) July 29, 2016 Today s Topics P.1 P.2 P.13 From the first quarter of this fiscal year, figures for Revenue Passengers Carried, ASK, RPK and Load
JAPAN AIRLINES Co., Ltd. Financial Results Mar/2017(FY2016) July 29, 2016 Today s Topics P.1 P.2 P.13 From the first quarter of this fiscal year, figures for Revenue Passengers Carried, ASK, RPK and Load
$168 MILLION PROFIT FOR FIRST HALF
 2 November 2012 Page 1 of 4 No. 05/12 02 November 2012 $168 MILLION PROFIT FOR FIRST HALF GROUP FINANCIAL PERFORMANCE First Half 2012-13 The SIA Group registered a net profit of $168 million in the first
Commercial aviation. Market outlook, key trends driving growth and implications for airports. Dave Gamrath BCA Marketing.
 Commercial aviation Market outlook, key trends driving growth and implications for airports Dave Gamrath BCA Marketing June 2014 BOEING is a trademark of Boeing Management Company. Copyright 2014 Boeing.
PARENT AIRLINE OPERATIONS LIFT GROUP PROFIT
 PARENT AIRLINE OPERATIONS LIFT GROUP PROFIT HIGHLIGHTS OF THE GROUP S PERFORMANCE Financial Year 2006-07 4th Quarter 2006-07 Apr 2006 Mar 2007 Year-on-Year % Change Jan-Mar 2007 Year-on-Year % Change Operating
THIRD QUARTER OPERATING PROFIT UP 51% TO $675 MILLION
 THIRD QUARTER OPERATING PROFIT UP 51% TO $675 MILLION GROUP FINANCIAL PERFORMANCE Third Quarter 2007-08 The Group made an operating profit of $675 million in the third quarter of financial year 2007-08,
THE PARENT AIRLINE FY2010/11 RESULTS
 SINGAPORE AIRLINES GROUP ANALYST / MEDIA BRIEFING FY21-11 11 RESULTS 13 MAY 211 THE PARENT AIRLINE FY21/11 RESULTS THE PARENT AIRLINE COMPANY RESULTS FY21/11 4Q/1 $million Better/ (Worse) $million 21/11
ANA Group Announces Its Fiscal Year 2019 Flight Schedule
 ANA NEWS ANA Group Announces Its Fiscal Year Flight Schedule ANA plans to accelerate growth by expanding its international network. New state-of-the-art aircraft will be introduced to further improve passenger
THAI AIRWAYS INTERNATIONAL PCL
 THAI AIRWAYS INTERNATIONAL PCL 1-March-2016 1 DISCLAIMER The information contained herein is intended to represent the Company s operating and financial position at a given point in time and may also contain
Thank you for participating in the financial results for fiscal 2014.
 Thank you for participating in the financial results for fiscal 2014. ANA HOLDINGS strongly believes that safety is the most important principle of our air transportation business. The expansion of slots
QANTAS HALF YEAR 2015 FINANCIAL RESULTS 1
 QANTAS HALF YEAR 2015 FINANCIAL RESULTS 1 Key points: Underlying Profit Before Tax: $367 million Statutory Profit After Tax: $206 million Transformation benefits: $374 million Comparable unit cost reduction:
HIGH FUEL PRICES DRIVE HALF YEAR PROFIT DOWN 62% AMIDST CHALLENGING ENVIRONMENT
 3 November 2011 Page 1 of 4 No. 06/11 03 November 2011 HIGH FUEL PRICES DRIVE HALF YEAR PROFIT DOWN 62% AMIDST CHALLENGING ENVIRONMENT GROUP FINANCIAL PERFORMANCE First Half 2011-12 The Group made a net
SAS Group Q2 2012/13. Q2 Restructuring programme moving KPIs in the right direction
 SAS Group Q2 2012/13 1 Q2 Restructuring programme moving KPIs in the right direction Operating revenues +1.6%* Yield improvement of +2.7%* Forceful implementation of 4XNG plan: Unit cost down by 10.7%
SAS AB Analyst meeting
 SAS AB Analyst meeting London, August 9, 2001 2 2nd Quarter a tough Quarter The Marketplace Continued weak world economy Weaker Swedish economy SAS Weaker traffic growth and reduced passenger load factors
FULL YEAR OPERATING PROFIT RISES TO $259 MILLION 25 CENTS SPECIAL DIVIDEND PROPOSED OUTLOOK REMAINS CHALLENGING
 8 May 2014 Page 1 of 5 No. 02/14 8 May 2014 FULL YEAR OPERATING PROFIT RISES TO $259 MILLION 25 CENTS SPECIAL DIVIDEND PROPOSED OUTLOOK REMAINS CHALLENGING GROUP FINANCIAL PERFORMANCE Financial Year 2013-14