Forecasts of Aviation Activity
|
|
|
- Karin Douglas
- 5 years ago
- Views:
Transcription
1 Forecasts of Aviation Activity Introduction This is the second chapter in the Master Plan Update document. The first chapter identified the existing airport facilities, as well as physical conditions on and surrounding the airport. The next step in the process of planning for an airport facility is to determine the need for new or expanded facilities, which is to be reasonably expected over the specified planning period. At Paine Field, this involves the development of a set of forecasts that defines potential future aviation demand. As in most airport planning studies, forecasts are based on unconstrained demand (market demand) derived in part from actual and forecast population data, along with other factors. At this early stage in the planning process, it is necessary to utilize this theoretical unconstrained demand in order to provide a basis for developing various operational demand scenarios, without regard to site specific physical or environmental constraints; the identification and analysis of facility options for various operational demand scenarios then follows. Various alternatives can subsequently be developed to accommodate these facility options. Recognizing the myriad of constraints that will influence these alternatives, Snohomish County will be provided with a rational basis to select the appropriate alternative for airport development. Conditions on the airport and in the area surrounding the airport will influence the type and volume of aviation activity which can be reasonably accommodated. Aviation activity forecasting generally commences by utilizing the present time as an initial point, supplemented with historical trends obtained from previous year's activity and recorded information. This data has evolved from a comprehensive examination of historical airport records from airport personnel and a review of the following documents, Paine Field Airport Master Plan and Noise Study Update (1995), Puget Sound Regional Council: Regional Airport System Plan (1999), FAA Terminal Area Forecasts ( ), and the FAA Aviation Forecasts Fiscal Years These documents were prepared in different years, making the base year data quite variable, and emphasizing the Master Plan Update B.1
2 need for establishing a well-defined and well-documented set of base information from which to project future aviation activity trends. Prior to an examination of current and future activity levels at the airport, there are several conditions and assumptions that should be noted, which form the basis or foundation for the development of the forecasts contained herein. The following statements cover a wide variety of physical, operational, and socioeconomic considerations, and include, although not necessarily in order of importance or priority: Weather Conditions. Existing weather data (i.e., visibility, ceiling and wind conditions) for Paine Field were available for analysis from the National Oceanic and Atmospheric Administration (NOAA). With the exception of very few days annually, the airport is not adversely affected by poor weather conditions. Visual Flight Rules (VFR) meteorological conditions are experienced approximately 89.1% of the time annually; therefore, aircraft can operate at the airport on a regular basis throughout the year, with limited interruption due to weather. The potential negative impact of poor weather conditions on the operational capability of the airport is documented in the next chapter of this document. This information will be analyzed and evaluated in later chapters regarding the identification of potential instrument approach facility enhancements and the preparation of development alternatives for their implementation. Airport/Community Location and Proximity. Paine Field is situated six miles southwest of the Everett Central Business District (CBD) and twenty miles north of downtown Seattle. Breathtaking views of the Cascade Mountain Range to the east and the Olympic Mountain Range to the west help to define the bucolic setting and popularity of Paine Field with many aviators across the country, as well as with surrounding neighboring residents. The airport serves as an economic magnet to the region of the state, supporting approximately 30,000 jobs. Vehicular access to the airport is provided by Interstate 5 (I-5), State Road 99 (SR 99), State Road 526 (SR 526/Boeing Freeway), State Road 525 (SR 525/Mukilteo Speedway) and existing roads - Airport Road and128 th St. S.W., which link the airport to both, I-5 and SR 99. Regional Socioeconomic Conditions. The existing socioeconomic condition of a particular region has historically impacted aviation activity within that area. The two primary socioeconomic indicators, which are often analyzed in the forecast of aviation activity, are population and employment statistics. According to the latest population data prepared by the Washington State Office of Financial Management (OFM), the estimated population in 2000 for the City of Everett totaled 95,000 residents. This compares to the 1990 population for Everett of 69,961, an increase of 35.8%. The year 2010 (the most current data available) population projections Master Plan Update B.2
3 for Everett are expected to reach a total of 125,000, reflecting an average annual growth rate of 2.5%. This compares to a projected average annual growth of 1.6% for Snohomish County, 1.0% for the Puget Sound Region, and 1.2% for the State of Washington. The OFM estimates that employment for Snohomish County and the State of Washington for the year 1999 is 213,600 and 3.1 million respectively. Employment is projected to increase to 303,405 and 3.97 million, representing a respective 1.7% and 1.2% average annual growth rate. In addition, as referenced by the OFM and PSRC, estimated per capita income in 1998 for Snohomish County was $27,015, for the State of Washington was $28,719, and for the United States was $27,203. Per capita income for the State of Washington is projected to be $34,458, a 33.9% increase, and for the United States it is projected to be $32,857, a 36.8% increase. Per capita income is currently unavailable for Snohomish County. Community Support. Paine Field generally benefits from the support of the surrounding cities and county governments, as well as local industry and residents. The airport is recognized as a vital county asset, which contributes to the stability and the future of the area's economy. The support for the airport is tempered over the concern of aircraft noise from both the residents near the airport and the representatives they elect. The overall position of the county is one of continued growth and development, with special focus on the impetus that the airport provides to maintain and attract additional economic and aviation-related development to the region. It should be noted that Snohomish County adopted a General Aviation role for Paine Field in a Mediated Role Determination process in 1978/79, which will continue to affect the accommodation of various aviation activities at the airport. This General Aviation roles objective is to retain and enhance light aircraft general aviation as the dominant aeronautical activity at Paine Field while encouraging the continuation and expansion of aircraft related industries, business and corporate aviation, public service aviation, air taxi and commuter service, and discouraging expansion beyond 1978 levels of supplemental/charter air passenger service (per 14 CFR Part 121 SFAR 38-2 pp6), large transport crew training operations, air cargo and military aviation, while remaining compliant with the covenants in deeds and grants of the United States government. Additionally, many of the surrounding county communities and much of the Puget Sound region benefit from the close proximity of a regional general/industrial aviation facility and, in turn, provide an economic base that can attract additional based aircraft, as well as industrial/business development to the airport. Facilities Potential. Paine Field currently serves a vital service role to the economy of western Washington. It is one of several airport facilities within the regional Master Plan Update B.3
4 service area with adequate runway length to accommodate the operation of air carrier aircraft. In addition, the airport can accommodate the operation of large business jet aircraft, which need runway lengths greater than available at many of the region s other general aviation airports. Negative or Neutral Factors. As a general comment, the airport has very few negative factors and is in an enviable position due to its many positive features and conditions. However, there are some factors that can and do have a negative impact on the airport and that must be considered in the planning process. The first issue is the overall condition of the general aviation industry in the United States, which, since 1978, had been in a significant recession until the mid 1990s. The FAA has identified several factors that have contributed to this prolonged downturn. These include three economic recessions, two fuel crises, the enactment of the Airline Deregulation Act of 1978, the repeal of the GI Bill, and the repeal of the investment tax credit. Secondly, due to the substantial areas of owner occupied single family residential development around the airport, airport expansion is constrained from both a physical and operational standpoint. However, there are a number of bright spots having a positive impact in certain segments of the general aviation industry. They include the passage of the longawaited General Aviation Revitalization Act of 1994, which provides an eighteenyear limit on product liability lawsuits against general aviation aircraft and component manufacturers. As a result of this legislation, there is renewed interest and optimism among US aircraft manufacturers, who are either re-entering the single engine aircraft market after several years absence, or are increasing future production schedules to meet expected renewed demand. The growth in the amateur-built aircraft market, and the strength of the used aircraft market, indicate that demand for inexpensive personal aircraft is increasing. Increased general aviation instrument operations at FAA towered airports, and general aviation aircraft handled at FAA en route centers point to continued growth of users of more sophisticated general aviation aircraft. Additionally, operations at nontowered US airports have increased, supporting the belief held by many that much of general aviation has been forced out of many towered airports because of the increased commercial air carrier activity. Master Plan Update B.4
5 Historical Airport Activity A tabulation of Paine Field's historical aviation activity since 1990 is presented in Table B1, entitled HISTORICAL AVIATION ACTIVITY, This table presents the number of passenger enplanements and four categories of operations, plus total operations. Local FAA Air Traffic Control personnel tabulate aircraft activity data during the time the tower is operational, currently 7 a.m. to 9 p.m. Operations occurring between 9 p.m. and 7 a.m. are not included, and are assumed to add approximately 5%. Forecast information is intended to reflect operations occurring during the time the tower is operational (from 7 a.m. to 9 p.m.). Table B1 HISTORICAL AVIATION ACTIVITY, Paine Field Master Plan Update Large Transport General Passenger Aircraft Air Taxi Aviation Military Total Instrument Year Enplanements 1 Operations Operations Operations Operations Operations Operations ,623 1, ,943 5, ,544 21, ,308 1, ,330 5, ,083 22, ,096 1, ,605 5, ,010 18, ,837 1, ,215 5, ,823 21, ,860 1, ,639 5, ,670 20, ,653 2, ,584 5, ,824 20, ,322 3, ,308 4, ,076 18, ,679 2, ,891 1, ,365 19, ,987 3, ,543 1, ,612 28, ,011 4, ,801 2, ,407 32, ,443 3, ,925 2, ,291 23,256 Source: Operations information provided by airport staff. 1 FAA Terminal Area Forecast Report. 2 Instrument Operations are not an additive element with regard to total operations. Master Plan Update B.5
6 Passenger Enplanements. The passenger enplanements listed in the previous table are only those which occurred on military and charter flights. There is currently no scheduled airline passenger service provided to Paine Field. Large Transport Aircraft Operations. As counted by airport traffic control tower (ATCT) personnel in recent years, operations in this category (classified as Air Carrier by ATCT) include all aircraft capable of carrying over sixty passengers, including those aircraft used for cargo purposes, such as wide-body aircraft utilized by UPS, and using a three letter company designator (regardless of whether or not they actually are being utilized for passenger service). For the most part, these are made up of aircraft operating into or out of The Boeing Company or Goodrich. Air Taxi Operations. Operations in this class are made up of aircraft capable of seating less than 60 passengers, which are being utilized for passenger or air freight service and which use a three letter company designator or "Tango" (this is a definition used by ATCT personnel to classify aircraft operations. For planning purposes, air taxi operations will be included as part of the general aviation forecasts. Please refer to the Appendix for data from the Save Our Communities organization regarding the various possible definitions of air taxi, commuter, and regional airlines). At Paine Field, this category of operations is primarily made up of air freight operations with some non-scheduled passenger aircraft operations. As previously noted, there is currently no scheduled passenger airline service at Paine Field. However, in 1997, Horizon Airlines evaluated initiating service between Paine Field and Portland, OR with the thirty-seven seat DHC8-200 aircraft. Horizon ultimately decided to meet the projected growth in this market by increasing the size of their aircraft on the Seattle-Portland route from the DHC8-200 to the seventy seat DHC8Q-400 and the fifty seat Canadair Regional Jet (CRJ200). General Aviation Operations. Historically, the number of general aviation operations has been directly tied to economic conditions. Nationally, there was an upward trend in the number of general aviation operations during the 1990s. This was due primarily to the great economic condition experienced for a majority of the country and a decrease in the price of fuel. These national trends are reflected at Paine Field during the last four years, where the number of general aviation operations has increased. This reflects the strength of the local/regional economy and the strength of the demand for general aviation facilities in the Seattle Metropolitan area. Instrument Operations. Instrument operations have remained relatively flat through the 1990s, with a slight increase in the last few years. Instrument aircraft Master Plan Update B.6
7 operations are those operations conducted by aircraft filing an IFR flight plan operating in the vicinity of Paine Field. Military Operations. The number of military operations at the airport has declined since the last Master Plan. The U.S. Army Aviation Support Facility located on Paine Field was responsible for a majority of the operations. However, in September 1996, this squadron relocated from Paine Field to Fort Lewis reducing the number of military operations conducted at the airport. Currently, the primary military use is related to C-9 and C-12 aircraft, supporting the Everett based aircraft carrier U.S.S Lincoln, which regularly visit the field picking up or delivering sailors and their equipment, as well as EA-6Bs stationed at Whidbey Island Naval Air Station (NAS). It is projected that the demand for military operational activity at the airport will remain at this present level through the planning period. Unconstrained Passenger Enplanement Demand Forecast The projection of demand for passenger service; i.e., enplaned or boarding passengers at an airport, is an important part of the forecasting effort. In essence, passenger service projections form the cornerstone for formulating projections of air carrier/commuter aircraft operations. This task is more difficult at Paine Field because there is little history of passenger service on which to build a forecast. However, because of the population located in the vicinity of the airport, the driving time to Seattle-Tacoma International Airport (SEA-TAC), and the forecast population growth of the region, it can be reasonably assumed that some level of unconstrained demand exists for passenger service at Paine Field. Passenger Service Demand Forecast Methodology The methodology used to determine demand for passenger service at Paine Field involved determining an existing domestic originating passenger to population (PAX do /POP) ratio for Seattle-Tacoma International Airport, then relating that ratio to the various population levels likely to be served by Paine Field if passenger service were available. Because of the existence of the most accurate and consistent population data and operational data for SEA-TAC, calendar year 1999 was chosen as the base year for determining the PAX do /POP ratio. For this calculation, the area considered as the service area for SEA-TAC was a ten-county area in northwest Washington, consisting of Snohomish, King, Pierce, Skagit, Thurston, Grays Harbor, Mason, Kitsap, Island, and Lewis counties (this service area is consistent with the "market-shed" served by SEA-TAC as defined in the Flight Plan Project published in 1992 by the Puget Sound Air Master Plan Update B.7
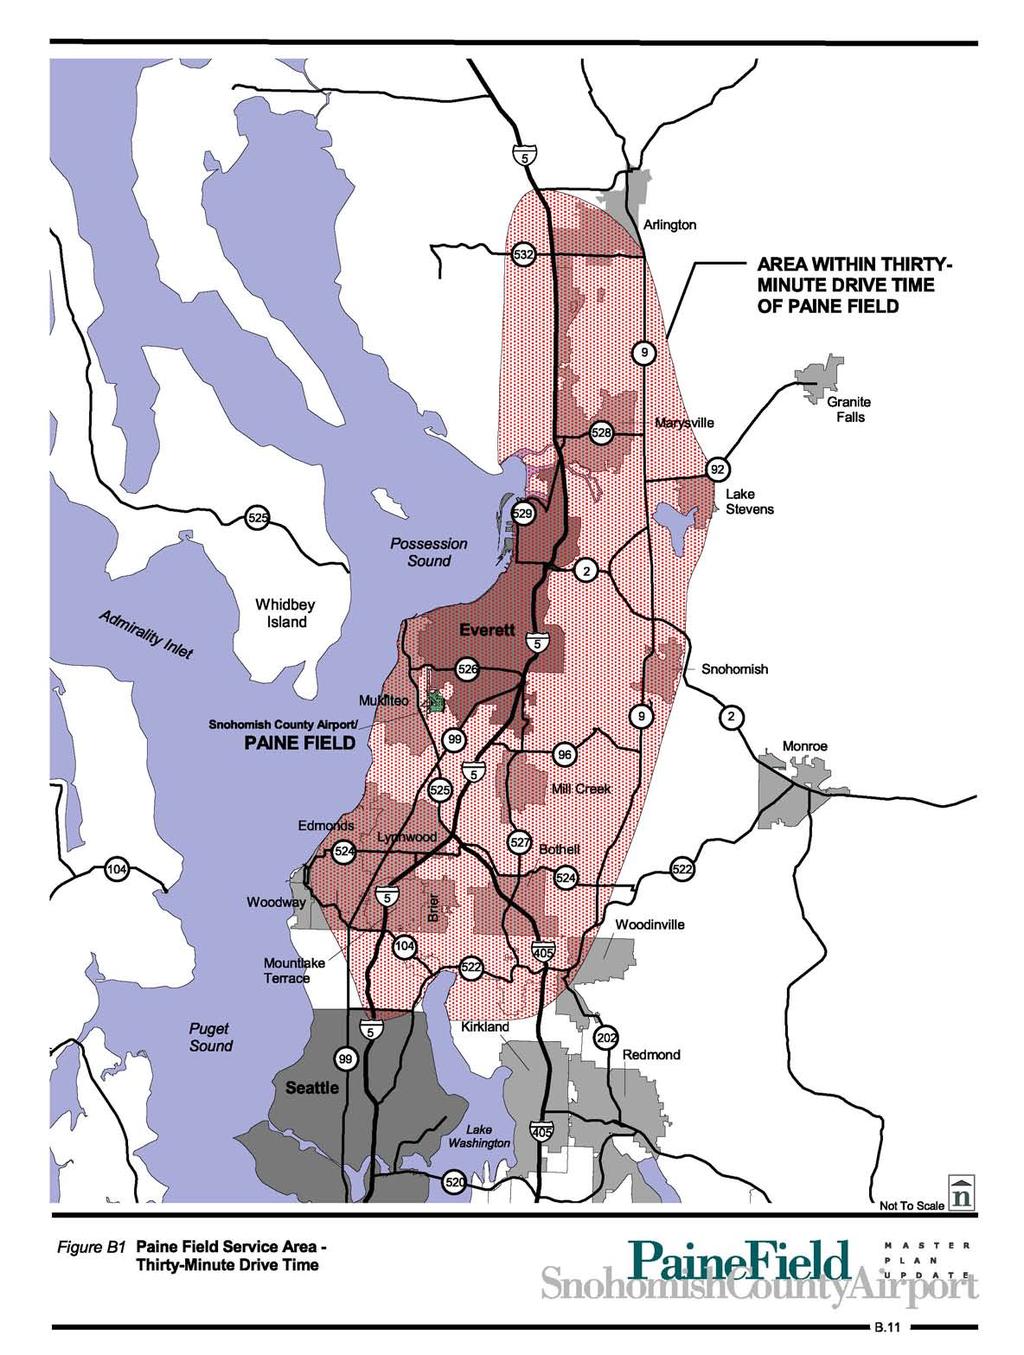
8 Transportation Committee, with the exception that Whatcom County was included in the Flight Plan Project). Through the 1990s, SEA-TAC experienced tremendous growth in terms of both passenger and cargo levels. Annual operations have increased from 355,077 in 1990 to 433,660 in 1999, representing a twenty-two percent increase. Additionally, passenger levels (domestic and international) increased seventy-five percent through these same years. In addition to a robust 16.4% growth in population within the SEA-TAC service area during the 1990s, the PAX do /POP (8,608,553 enplanements/3,739,722 population) ratio for SEA-TAC increased to 2.30 in 1999 (2.30 domestic originating passengers annually for each person living within the defined service area). This is higher than the ratio used in the 1995 Master Plan (MP), which was based on the PAX do /POP (4,895,840 enplanements/3,211,757 population) ratio of 1.52 experienced at SEA-TAC in If only regional destinations, those within the 500-mile circle are considered (e.g., Bellingham, Vancouver, B.C., Port Angeles, Portland, Missoula, Butte, Kalispell, Helena, Yakima, Spokane, Pasco, Eugene, Boise, Pullman, and Sun Valley), the 1999 PAX do /POP ratio is 0.22 (828,160 enplanements/3,739,722 population). This is an increase from SEA-TAC s 1990 regional PAX do /POP ratio of 0.17 (538,865 enplanements/3,211,757 population) as used in the 1995 MP. With these ratios as a basis, four scenarios for unconstrained enplanement demand at Paine Field were formulated. This methodology uses the PAX do /POP ratio and census tract or county population projections for the defined service areas to determine enplanement demand forecasts. Snohomish County, the U.S. Census Bureau, and the Puget Sound Regional Council provided census tract population projections. In addition, estimated 1999 census information and population projections from the U.S. Census Bureau were utilized for all counties within the service area. The population projections provided by these entities are estimated to the year Because the forecasts are a twenty-year time frame, a trend projection based on historical data was used to determine the year 2021 population. In all scenarios, the PAX do /POP ratios remain the same throughout the forecasting period. 1. National Service Low Range. This scenario considers the provision of passenger service at Paine Field with both national and regional destinations available (similar to the domestic service destinations presently served by aircraft operating at SEA-TAC). In this scenario, it is projected that passengers will only be captured from a service area within a thirty minute drive time of Paine Field (a map estimating the thirty minute driving distance from the airport was provided by the Snohomish County Public Works Department). The time of day for the model was based on the p.m. peak time frame of 4:30 p.m. to 5:30 p.m., which is consistent with the modeling approach used in the 1995 MP. The area is illustrated in the following figure, entitled PAINE FIELD SERVICE AREA - THIRTY MINUTE DRIVE TIME. It is realized that passengers are likely to be captured Master Plan Update B.8
9 from beyond the thirty minute area; however, this relatively small area was utilized to represent the minimum area from which Paine Field might attract passengers. As can be noted in the following table, entitled UNCONSTRAINED ENPLANEMENT DEMAND FORECAST, , the national low forecast indicates a passenger demand of 769,646 in 2001 increasing to 996,180 by the year This compares with the 1995 MP forecast demand of 553,000 in 2014 (the last year provided in that planning study). The increased demand over that projected in the 1995 MP is due primarily to a higher PAX do /POP ratio and to a lesser extent, due to the population increase within the low range service area. 2. National Service High Range. This scenario considers the same national service defined above, with a larger service area. The service area for the high range scenarios is increased to include all of Snohomish, Skagit and Island counties, in addition to those portions of King county within a thirty minute drive of Paine Field. Passenger demand for this scenario is 1,137,263 in 2001 and is forecast to increase to 1,562,219 by The 1995 MP forecast demand was 895,000 by the year As stated above, this increase is primarily due to a higher PAX do /POP ratio. 3. Regional Service Low Range. This scenario considers the same service area as Scenario 1 (thirty minute drive time) with the provision of only regional passenger service. For the most part, regional service is defined as providing service only to destinations within 500 miles (e.g., Bellingham, Vancouver, B.C., Port Angeles, Portland, Missoula, Butte, Kalispell, Helena, Yakima, Spokane, Pasco, Eugene, Boise, Pullman, Kelowna, Victoria, and Sun Valley), on aircraft seating less than 60 passengers (e.g., DHC-6, DHC-7, DHC8-200/300, EMB-120, Fokker F-27, etc.), although regional jets (EMB-135/145, CRJ-200, BAe-146, Fokker F-28, and larger turboprops such as the DHC8Q-400) are now being utilized in the United States (including SEA-TAC). This is consistent with the regional service type of aircraft and destinations presently operating at SEA-TAC. This scenario postulates a passenger demand of 117,929 and is forecast to increase to 152,640 by This compares with the 1995 MP of 96,000 by the year The increased demand is primarily due to a larger service area within the thirty minute drive area. 4. Regional Service High Range. As with the preceding scenario, only regional service is considered; however, the service area is increased to include all of Snohomish, Skagit and Island counties, in addition to those portions of King county within a thirty minute drive of Paine Field. This scenario estimates a passenger demand of 174,257 in 2001, increasing to 239,371 by the year This compares with the 1995 MP forecast of 155,000 by the year Again, this increase is due to a higher PAX do /POP ratio and a larger thirty minute drive time area. Master Plan Update B.9
10 Although these forecasts are considered to be unconstrained, one long-term constraint has been factored in. If Paine Field provides commercial passenger service, this service would supplement that which is currently provided at SEA-TAC. The type of services offered at "supplemental" airports is an important consideration in determining the number of enplaned passengers that will be captured in a certain market. Passengers will tend to choose the airport with the most convenient schedule, widest range of destinations and lowest price combination, even if there is a longer ground trip required to get to the airport. The best selection of airline schedules for longer stage length trips and those to very small regional markets will only be available at the region's primary airport (SEA-TAC). Therefore, it is estimated that passenger demand at Paine Field would consist of no more than 50% of the medium- to long-haul stage length domestic market (trips of over 500 miles), and only 85% of the short-haul regional market. This assumption is consistent with assumptions made in Flight Plan during the forecasting process for that project and has been confirmed (to the degree possible) with passenger data available from SEA-TAC. Master Plan Update B.10
11
12 The unconstrained forecasts do not consider what happens in a new market. In other words, the forecasts do not consider the fact that when a new service is offered it will take some time for that market to mature and reach its full potential. The forecasts are only intended as a measure of demand within the market area. Enplanement forecasts are presented in the following table, entitled UNCONSTRAINED ENPLANEMENT DEMAND FORECAST, The columns include data from: Flight Plan (Puget Sound Air Transportation Committee, 1992) and four scenarios for enplanement projections. A graphic presentation of the enplanement demand forecast is provided in the following figure, entitled UNCONSTRAINED ENPLANEMENT DEMAND FORECAST SCENARIOS. Table B2 UNCONSTRAINED ENPLANEMENT DEMAND FORECAST, Paine Field Master Plan Update Scenario 1 Scenario 2 Scenario 3 Scenario 4 Flight National Service National Service Regional Service Regional Service Year Plan Low Range High Range Low Range High Range ,646 1,137, , , ,736 1,157, , , ,826 1,177, , , ,070, ,916 1,198, , , ,006 1,218, , , ,096 1,238, , , ,220, ,019 1,312, , , ,634 1,360, , , ,430, ,998 1,421, , , ,907 1,461, , , ,180 1,562, , ,371 Flight Plan National Service Regional Service Low Range High Range Interpolated from Alternate #14, The Flight Plan Project, Draft Final Report and Final Environmental Impact Statement, 1992, Puget Sound Regional Council. Forecast with Airport served by national and regional air carriers. Forecast with Airport served by regional air carriers only. Enplanements captured only from area within 30 minute drive time. Enplanements captured from area within 30 minute drive time and from all of Snohomish, Skagit and Island counties. Master Plan Update B.12
13 Figure B2 UNCONSTRAINED ENPLANEMENT DEMAND FORECAST SCENARIOS Paine Field Master Plan Update 1,600,000 1,400,000 Enplanements 1,200,000 1,000, , , ,000 National Low National High Regional Low Regional High 200, Year Unconstrained Air Carrier/Commuter Operations Demand Forecast The next step in the forecasting process is to project the demand for Air Carrier/ Commuter aircraft operations, using the forecast of enplanements as a basis. This process normally involves the evaluation of the type of passenger aircraft that have served the airport in the past and a projection of the type that will serve the airport in the future. With the type of passenger aircraft known, average seating capacity and load factors can be formulated, which then can be equated to a quantity of aircraft operations that will be needed to accommodate forecast enplanement demand. While the trend of commuter airlines is leaning towards the use of larger regional jets (50-70 seats) and turboprops, it is not necessarily the case that all regional carriers will provide service with larger aircraft. From an operational standpoint, Paine Field s Master Plan Update B.13
14 market size may not necessitate the use of the larger 70-seat aircraft. As a result of contract negotiations with pilot unions, most airlines have adopted a pilot contract agreement, precluding pilots of regional carriers from operating aircraft with more than 60 seats. As more and more airlines strive for higher load factors and more profitability, it is inevitable that a certain number of existing and/or newly implemented routes will be relinquished to regional carriers. This pilot contract agreement is not necessarily an issue for Horizon Airlines, which has ordered fourteen 70-seat Canadair CRJ-700s and fifteen 70-seat DeHavilland DHC8Q-400 turboprop aircraft. Because the airport has no scheduled passenger service at this time, historic data on aircraft type and seating capacity cannot be used as a basis for future projections; therefore, assumptions regarding national trends as identified in FAA Aviation Forecasts Fiscal Years have been utilized as the foundation on which to build the forecast of Air Carrier/Commuter aircraft operations. Per the FAA Aviation Forecast Fiscal Years , and for purposes of this forecast documentation, Air Carrier is defined as an airline providing scheduled passenger service with aircraft larger than 60 seats, and Commuter/Regional is being defined as an airline primarily providing scheduled passenger service with aircraft a maximum of 60 seats. This is also consistent with current FAA Air Traffic counting criteria (air carrier vs. air taxi). Please refer to the Appendix for data from the Save Our Communities organization regarding the various possible definitions of air taxi, commuter, and regional airlines. It is assumed in the forecast calculations that commuter/regional aircraft will provide service only to destinations within 500 miles and will primarily utilize aircraft seating less than 60 passengers (e.g. DHC-6, DHC-7, DHC-8-200/300, EMB-120, BAe 146, Fokker F- 27, etc.). Also included in the commuter/regional aircraft fleet are several regional jet types (e.g., EMB-135/145, CRJ-200, Fokker F-28, etc.), which are now being utilized in numerous markets in the United States (including SEA-TAC) for short-haul destinations. The "less than 60 passenger" assumption relating to commuter/regional aircraft will only be utilized in the demand forecasts section of this document. Analysis related to noise and facility needs require more refined aircraft type determinations. The assumptions used relating to air carrier aircraft operations include: Domestic air carrier aircraft had an average seating capacity of in 1999, which is less than the FAA forecasted in the early 1990s. The FAA projects this to gradually increase to in Because air carrier operations at Paine Field would primarily be focused on shorter stage length trips, the Paine Field Master Plan Update forecasts are based on the average seating capacity of air carrier aircraft remaining at 147 through the end of the planning period (the combined average seating capacity of the B , the MD-80, and the Boeing next generation aircraft, B /800/900). Master Plan Update B.14
15 Domestic air carriers achieved a 69.8 percent load factor in 1999, significantly more than the FAA forecasted in the early 1990 s. This forecast uses the new projected load factors of 69.3 percent for 2000, decreasing to 68.3 percent in 2002, increasing to 69.5 percent in 2005 and 70.0 percent in the years Beyond the year 2011, the forecasts will continue to be based on a load factor of 70.0 percent for air carrier aircraft. The assumptions used relating to commuter/regional aircraft operations include: FAA indicates that commuter/regional aircraft average seating capacity grew from 22.9 in 1992 to 36.0 in 1999 and is projected to grow to 44.3 in 2011 (a 2.1% annual growth rate). This reflects the introduction of many larger aircraft, including regional jets into the market. Beyond the year 2011, the forecasts are based on the average commuter/regional aircraft seating capacity remaining at (This growth of aircraft seating capacity is the impetus for the reduction of operations depicted in the following figure, entitled UNCONSTRAINED AIR CARRIER & COMMUTER OPERATIONS DEMAND FORECAST SCENARIOS). FAA indicates that the average commuter/regional load factor was 48.3 in 1992, increased to 57.6 percent in 1999, and is forecast to grow to 61.6 in Beyond the year 2011, the forecasts are based on a load factor remaining at 61.6 percent for commuter/regional aircraft. It may be of interest to note that in the 1995 MP, domestic air carriers had an average seating capacity of 151.1, while achieving a 62.6% load factor, and regional carriers had an average seating capacity of 22.9, while achieving a 48.3% load factor. Operations demand forecast is presented below in the following table, entitled UNCONSTRAINED AIR CARRIER & COMMUTER OPERATIONS DEMAND FORECAST, In addition to the four forecast scenarios, the following table also presents forecasts from the Flight Plan. Master Plan Update B.15
16 Table B3 UNCONSTRAINED AIR CARRIER & COMMUTER OPERATIONS DEMAND FORECAST, Paine Field Master Plan Update Scenario 1 Scenario 2 Scenario 3 Scenario 4 Flight National Service National Service Regional Service Regional Service Year Plan Low Range High Range Low Range High Range ,893 35,305 11,005 16, ,042 35,647 10,873 16, ,985 35,680 10,745 15, ,760 24,185 36,093 10,759 16, ,128 36,121 10,635 15, ,094 36,178 10,514 15, ,460 24,489 37,145 10,252 15, ,934 38,057 10,259 15, ,400 25,811 39,746 10,620 16, ,396 40,872 10,861 16, ,858 43,687 11,462 17,975 Flight Plan National Service Regional Service Low Range High Range Note: Interpolated from Alternate #14, The Flight Plan Project, Draft Final Report and Final Environmental Impact Statement, 1992, Puget Sound Regional Council. Forecast with Airport served by national and regional air carriers. Forecast with Airport served by regional air carriers only. Enplanements captured only from area within 30 minute drive time. Enplanements captured from area within 30 minute drive time and from all of Snohomish, Skagit, and Island counties. Although passenger enplanement demand is forecast to increase, the number of commercial service operations is forecast to remain stable or increase only slightly because of increasing seating capacity of aircraft and increasing load factors (see assumptions in text above). Master Plan Update B.16
17 Figure B3 UNCONSTRAINED AIR CARRIER & COMMUTER OPERATIONS DEMAND FORECAST SCENARIOS Paine Field Master Plan Update 45,000 40,000 35,000 National Low National High Operations 30,000 25,000 20,000 15,000 Regional Low Regional High 95 MP National Low 95 MP National High 95 MP Regional Low 95 MP Regional High 10,000 5, Year Decrease in operations from for the MP Update is reflective of an increase in average seats per aircraft from 36 to Manufacturing/Maintenance Large Transport Activity There are currently two aviation manufacturing/maintenance organizations located at Paine Field, the Boeing Company and Goodrich. Large transport jet aircraft flight operations associated with these businesses (utilizing the same aircraft types as those used for "air carrier" passenger and freight activity) are conducted at Paine Field; however, because these operations are not related to commercial passenger service, they Master Plan Update B.17
18 have not been taken into consideration in the table above. Existing and projected flight operations at the airport associated with these two companies are presented in the following table entitled, MANUFACTURING/MAINTENANCE LARGE TRANSPORT AIRCRAFT ACTIVITY FORECAST. The types of aircraft expected to be operating at Paine Field by the Boeing Company include the B-737, B-747, B-757, B-767 and B-777. In addition to these aircraft, flight operations forecast for Goodrich also include the B-727, along with the MD-80 and DC-10 aircraft. Boeing is currently evaluating the option of relocating their B-737 and B-757 aircraft assembly operation from Renton to Paine Field. According to the FAA Terminal Area Forecasts, there were approximately 378 air carrier operations conducted at Renton Municipal Airport. These additional operations could be expected at Paine Field if the Boeing relocation were to come to fruition. Additionally, this number could also grow if the B-737/B-757 operations from Boeing Field/King County International Airport were also transferred to Paine Field. Table B4 MANUFACTURING/MAINTENANCE LARGE TRANSPORT AIRCRAFT ACTIVITY FORECAST Paine Field Master Plan Update Year Master Plan Forecast , , , , , , , , , ,000 1 Actual Master Plan Update B.18
19 Unconstrained Military Aircraft Operations Forecast Military aircraft have historically utilized Paine Field. In years past, the U.S. Army Aviation Support Facility located on Paine Field was responsible for a majority of the operations. However, in September 1996, this squadron relocated from Paine Field to Fort Lewis reducing the number of military operations conducted at the airport. Currently, the primary military use is related to C-9 and C-12 aircraft, supporting the Everett based aircraft carrier U.S.S. Lincoln, which regularly visits the field picking up or delivering sailors and their equipment, as well as EA-6Bs stationed at Whidbey Island Naval Air Station (NAS). Therefore, due to a lack of information associated with projecting an increase or decrease of military activity, it is projected that the demand for military operational activity at Paine Field will remain at existing levels through the end of the planning period. The following table, entitled UNCONSTRAINED MILITARY OPERATIONS FORECAST, , indicates the anticipated number of military operations during the planning period. The FAA's Terminal Area Forecasts have been included for comparison with the projections resulting from this study. Table B5 UNCONSTRAINED MILITARY OPERATIONS FORECAST, Paine Field Master Plan Update Terminal Area Master Plan Year Forecast 2 Forecast ,919 2, ,919 2, ,919 2, ,919 2, ,919 2, ,919 2, ,919 2, ,919 2, ,919 2, ,919 2,000 1 Actual 2 Terminal Area Forecasts Fiscal Years , FAA Master Plan Update B.19
20 General Aviation Operations Forecast General aviation operations at Paine Field have historically been affected by fluctuations in the regional and national economy. This is reflected in the overall decrease in training and private use of aircraft during periods of economic decline. Although more of the general aviation fleet is now used for business purposes than it was ten or more years ago, the economy continues to affect total general aviation operations. During the past ten years, the annual number of general aviation operations at Paine Field reached a high in 2000 with approximately 203,925 operations. The lowest number of annual general aviation operations was recorded in 1990, with 144,943 operations. It should also be noted that during the past decade, the number of general aviation operations at Paine Field has consistently increased, with only slight declines noted in 1994, 1995, and As discussed previously, growth in general aviation operations nationally has been inhibited during the 1980s and early 1990s by the high operating and ownership costs of aircraft. FAA Aviation Forecasts Fiscal Years, , indicates that nationally, general aviation hours flown are expected to increase at an annual rate of approximately 2.1% until the year A projection based on a 2.1% annual increase in the number of general aviation operations is presented in the "Low Forecast" column of the following table. Turbine powered general aviation aircraft use is projected by the FAA to increase at a 4.9% annual growth rate between 2000 and Paine Field experiences a significant amount of turboprop and business jet activity. A projection based on 4.9% annual growth is presented in the High Forecast column below. Construction of one corporate hangar capable of accommodating two aircraft, as well as permit approval for an additional eleven corporate units is currently in progress. Because of the large number of individuals on the airport s hangar waiting list (approximately 115), the airport is proceeding with a development process that could potentially add up to 100 additional T-hangar units by the year Interviews with businesses providing flight training on the airport indicate that significant growth in flight training activity at Paine Field is likely during the next few years. Due to the closing of Martha Lake Airport, coupled with the construction of new hangar space and flight training optimism, the selected forecast for general aviation operation demand is based on a more rapid growth rate in the first years of the planning period. This growth rate is tempered in later years (particularly due to the relatively flat historic trend in general aviation operations at the airport). Another factor that supports a forecast of significant growth in general aviation activity during the first few years of the planning period is the historical and forecast population growth rate. The U.S. Census Bureau reports Snohomish County population grew from Master Plan Update B.20
21 465,628 people in 1990 to 606,024 in That is a 30.2% growth compared to the U.S. average of 13.1%, making Snohomish County the 38 th fastest growing county in the U.S. and the fastest growing county in the Central Puget Sound Region. In 1999, the Puget Sound Regional Council forecast Snohomish County population to grow by 138,399 (23%) between 2000 and 2010 and by 112,198 between 2010 and So, it is not unreasonable that growth in general aviation operations and based aircraft would increase at a faster rate during the first few years of the planning period, while tapering off during the later years. Therefore, a 4.9% annual growth rate was used in years and a 1.5% annual growth rate was used for forecast years Table B6 GENERAL AVIATION OPERATIONS FORECAST, Paine Field Master Plan Update Low High Selected Year TAF 1995 MP TP Forecast Forecast Forecast 2000 (1) 191, , , , , , , , , , , , , , , , , , , , , , , , , , , , , , , , , , , , , , , , , , , , , , , , , , , , , , , , , , , ,714 Source: 1 Actual (includes Air Taxi operations) TAF: Terminal Area Forecasts Fiscal Years , FAA TP: Trend Projection Using General Aviation Annual Operations in years as basis. Master Plan Update B.21
22 Air Cargo Activity Forecast Historically, airmail and airfreight activity has occurred at Paine Field to a limited degree. These air cargo operations have been conducted at the airport with small air taxi type aircraft (prop aircraft with the capability of seating less than sixty passengers). This includes a scheduled mail route (by Methow Airlines), which transports mail from the regional postal facility in Everett to the San Juan Islands and a number of aircraft hauling checks (AMERIFLIGHT). Operations related to air cargo activity at the airport have been counted under the "Air Taxi" category of operations in Airport Traffic Control Tower data. In 2000, there were 3,886 operations recorded as "Air Taxi", which also included some non-scheduled passenger aircraft operations in addition to air freight operations. Although significant demand for air cargo operations at Paine Field may be present, air cargo activity at the airport is likely to be limited. Factors contributing to this assumption relate to the County s 1978/1979 Mediated Role Determination to discourage increases in air freight activity at Paine Field and, due to the location of Paine Field (northern region of the Metropolitan area away from the centroid of Metropolitan collection areas), cargo operators will be less inclined to utilize Paine Field because of its lack of centralized geography. Because air cargo companies operating at SEA-TAC and Boeing Field would benefit from this centralized location, it can be assumed that they will prefer to remain in their current locations. Due to the construction at SEA-TAC over the next several years with the North End Aviation Terminal (NEAT), which will displace approximately 40% of the SEA-TAC cargo hardstands and the lack of adequate developable areas at Boeing Field, the ability to accommodate cargo operations at its current level will be reduced. As a result, cargo operators may have to temporarily relocate to alternate airports within the region. For this planning effort, it is assumed that, if there is a demand for cargo operations at Paine Field, it is likely to be only temporary, until the cargo use area at SEA-TAC is reestablished when (and if) the Port of Seattle moves forward with construction of the South Aviation Support Area (SASA) at SEA-TAC. Operations Forecast By Aircraft Type Now that total numbers of aircraft operations have been projected, the next step in the forecasting process is to detail the various types of aircraft that will operate at the airport. The following table, entitled SUMMARY OF OPERATIONS DEMAND FORECAST BY AIRCRAFT TYPE, , presents that detail. As can be noted, total annual operations are anticipated to increase during the planning period. The forecasts indicate that total annual operational demand is expected to Master Plan Update B.22
23 Table B7 SUMMARY OF OPERATIONS DEMAND FORECAST BY AIRCRAFT TYPE, Paine Field Master Plan Update Operations By Type Industrial Air Carrier Jet 3,443 6,000 6,000 6,000 6,000 Military 2,037 2,000 2,000 2,000 2,000 General Aviation 207, , , , ,714 Single Engine Piston 176, , , , ,154 Multi-Engine Piston 16,620 21,470 22,830 24,280 25,820 Turboprop 6,230 9,510 11,710 14,190 16,990 Business Jet 6,230 9,510 11,710 14,190 16,990 Helicopter 2,080 2,990 3,510 4,100 4,760 Instrument 2 28,256 37,650 40,773 43,898 47,002 TOTAL WITHOUT COMMERCIAL PASSENGER AIRCRAFT 213, , , , ,714 Passenger Air Carrier/Commuter Scenario 1 (National Low) ,094 24,934 26,396 27,858 Jet ,259 19,804 20,965 22,127 Turboprop --- 6,835 5,130 5,431 5,731 Scenario 2 (National High) ,178 38,057 40,872 43,687 Jet ,915 30,227 32,463 34,699 Turboprop ,263 7,830 8,409 8,988 Scenario 3 (Regional Low) ,514 10,259 10,861 11,462 Jet --- 3,679 5,129 5,430 5,731 Turboprop --- 6,835 5,130 5,431 5,731 Scenario 4 (Regional High) ,788 15,659 16,817 17,975 Jet --- 5,525 7,829 8,408 8,987 Turboprop ,263 7,830 8,409 8,988 TOTAL ANNUAL OPERATIONS SCENARIO 1 (National Low) 213, , , , ,572 SCENARIO 2 (National High) 213, , , , ,401 SCENARIO 3 (Regional Low) 213, , , , ,176 SCENARIO 4 (Regional High) 213, , , , ,689 Source: Barnard Dunkelberg & Co. 1 Existing 2 Instrument operations are not an additive element with regard to total operations. Master Plan Update B.23
24 increase by approximately 78% with the highest scenario (Scenario 2), and by approximately 71% with the lowest scenario (Scenario 3) by the year The largest increase in operational demand is expected in the General Aviation category, with demand for approximately 130,000 additional operations during the 20-year planning period. General aviation operational demand is expected to grow most rapidly with the turboprop, jet, and helicopter types of aircraft. Industrial Air Carrier demand is expected to grow somewhat, with all of the activity being related to large air carrier jets. Military activity is expected to remain at its current level and will continue to be made up primarily of C-9 and EA-6B operations. Passenger aircraft operational demand is presented in the four scenarios, which have been previously discussed. Within the passenger aircraft category, the split between jet and turboprop aircraft varies depending on forecast year and scenario. The FAA AEROSPACE OPERATIONS, FISCAL YEARS , states that 15.3% of the current national commuter/regional fleet accounts for regional jets, and the remaining 84.7% accounts for turboprops. The FAA forecasts these figures to become a 50/50 split by the year In Scenario 1 and Scenario 2, demand for air carrier jet aircraft operations represents approximately 65% of the total demand for passenger aircraft operations at the airport in In Scenario 3 and Scenario 4, projections of jet aircraft for the year 2006 were calculated using the difference of the current percentage and the forecast percentage (34.7%), and projections for the remaining years were calculated with the even percentage split of 50/50. As stated previously, it is assumed in the forecast calculations that commuter/regional aircraft will be aircraft seating less than 60 passengers; however, regional jets are now being utilized in several markets in the United States (including SEA-TAC) for short-haul destinations and could be present in the commuter/regional aircraft fleet at Paine Field. Instrument Operations As described earlier, instrument aircraft operations are those operations conducted by aircraft filing an IFR flight plan operating in the vicinity of Paine Field. Instrument operations forecasts, shown in the following table, INSTRUMENT OPERATIONS, are taken from, or extrapolated from the TAF Forecast produced by the FAA for Paine Field. As a note, instrument operations are not an additive element with regard to total operations conducted at the airport. Master Plan Update B.24
3. Aviation Activity Forecasts
 3. Aviation Activity Forecasts This section presents forecasts of aviation activity for the Airport through 2029. Forecasts were developed for enplaned passengers, air carrier and regional/commuter airline
Time-series methodologies Market share methodologies Socioeconomic methodologies
 This Chapter features aviation activity forecasts for the Asheville Regional Airport (Airport) over a next 20- year planning horizon. Aviation demand forecasts are an important step in the master planning
The forecasts evaluated in this appendix are prepared for based aircraft, general aviation, military and overall activity.
 Chapter 3: Forecast Introduction Forecasting provides an airport with a general idea of the magnitude of growth, as well as fluctuations in activity anticipated, over a 20-year forecast period. Forecasting
Alternatives. Introduction. Range of Alternatives
 Alternatives Introduction Federal environmental regulations concerning the environmental review process require that all reasonable alternatives, which might accomplish the objectives of a proposed project,
APPENDIX E AVIATION ACTIVITY FORECASTS
 APPENDIX E AVIATION ACTIVITY FORECASTS E.1 PURPOSE AND CONTEXT This appendix presents the St. George Airport (SGU) aviation activity forecasts for the period of 2003 through 2020. Among the components
SECTION 3 AVIATION ACTIVITY FORECASTS
 SECTION 3 AVIATION ACTIVITY FORECASTS 3.1 INTRODUCTION Projecting future aviation demand is a critical element in the overall master planning process. The activity forecasts developed in this section are
CHAPTER 4 DEMAND/CAPACITY ANALYSIS
 CHAPTER DEMAND/CAPACITY ANALYSIS INTRODUCTION The demand/capacity analysis examines the capability of the airfield system at Blue Grass Airport (LEX) to address existing levels of activity as well as determine
Forecast of Aviation Activity
 DETROIT METROPOLITAN WAYNE COUNTY AIRPORT FAR PART 150 NOISE COMPATIBILITY STUDY UPDATE CHAPTER B FORECAST OF AVIATION ACTIVITY Forecast of Aviation Activity Introduction This chapter summarizes past aviation
Chapter Two FORECAST OF AVIATION DEMAND A. DESCRIPTION OF FORECAST ELEMENTS
 Chapter Two FORECAST OF AVIATION DEMAND A. DESCRIPTION OF FORECAST ELEMENTS The forecast of aeronautical activity at the (GED) during the 20-year planning period (2002-2021) is a key element of the Master
SECTION 5.0 FORECASTS OF AVIATION DEMAND
 SECTION 5.0 FORECASTS OF AVIATION DEMAND SECTION 5.0 FORECASTS OF AVIATION DEMAND 5.1 GENERAL This section provides an update of aviation activity forecasts for through the year 2021. The aviation activity
According to FAA Advisory Circular 150/5060-5, Airport Capacity and Delay, the elements that affect airfield capacity include:
 4.1 INTRODUCTION The previous chapters have described the existing facilities and provided planning guidelines as well as a forecast of demand for aviation activity at North Perry Airport. The demand/capacity
CHAPTER 2 AVIATION ACTIVITY FORECAST
 CHAPTER 2 AVIATION ACTIVITY FORECAST Aviation activity forecasts at the Airport are presented in this chapter for the period ending in 2027. The forecasts developed in this chapter provide needed input
Executive Summary. MASTER PLAN UPDATE Fort Collins-Loveland Municipal Airport
 Executive Summary MASTER PLAN UPDATE Fort Collins-Loveland Municipal Airport As a general aviation and commercial service airport, Fort Collins- Loveland Municipal Airport serves as an important niche
CHAPTER 1 EXECUTIVE SUMMARY
 CHAPTER 1 EXECUTIVE SUMMARY 1 1 EXECUTIVE SUMMARY INTRODUCTION William R. Fairchild International Airport (CLM) is located approximately three miles west of the city of Port Angeles, Washington. The airport
Westover Metropolitan Airport Master Plan Update
 Westover Metropolitan Airport Master Plan Update June 2008 INTRODUCTION Westover Metropolitan Airport (CEF) comprises the civilian portion of a joint-use facility located in Chicopee, Massachusetts. The
Chapter 3 Aviation Activity Forecasts
 Chapter 3 Aviation Activity Forecasts Introduction This chapter provides updated forecasts of aviation activity for Albany Municipal Airport (S12) for the twenty-year master plan horizon (2012-2032). The
CHAPTER THREE AVIATION ACTIVITY FORECASTS
 CHAPTER THREE AVIATION ACTIVITY FORECASTS Introduction The purpose of this chapter is to update the forecasts of aviation activity for the twenty year planning period addressed in the Update (2007-2027).
The purpose of this Demand/Capacity. The airfield configuration for SPG. Methods for determining airport AIRPORT DEMAND CAPACITY. Runway Configuration
 Chapter 4 Page 65 AIRPORT DEMAND CAPACITY The purpose of this Demand/Capacity Analysis is to examine the capability of the Albert Whitted Airport (SPG) to meet the needs of its users. In doing so, this
CHAPTER THREE AVIATION ACTIVITY FORECASTS INTRODUCTION
 CHAPTER THREE AVIATION ACTIVITY FORECASTS INTRODUCTION The purpose of this chapter is to update the forecasts of aviation activity for the twenty-year planning period addressed in the Update (2007-2027).
Outlook for Future Demand
 Chapter Three: Introduction This chapter discusses findings and methodologies used to project future aviation demand for study airports. Forecasts developed in the Greater Kansas City Regional Aviation
Forecast and Overview
 Forecast and Overview DENVER INTERNATIONAL AIRPORT Overall goals of the (MPR): Work with DEN to refine the preferred airport development plan to guide the development over an approximate 25-year planning
Appendix B Ultimate Airport Capacity and Delay Simulation Modeling Analysis
 Appendix B ULTIMATE AIRPORT CAPACITY & DELAY SIMULATION MODELING ANALYSIS B TABLE OF CONTENTS EXHIBITS TABLES B.1 Introduction... 1 B.2 Simulation Modeling Assumption and Methodology... 4 B.2.1 Runway
As stated in FAA Order C, Field Formulation of the National Plan of Integrated Airport Systems, dated December 4, 2004, forecasts should be: 2-1
 chapter 2 Forecasts airport master plan An important factor in facility planning involves a definition of demand that may reasonably be expected to occur during the useful life of the facility s key components.
Welcome to the Boise Airport Master Plan Update Open House
 Welcome to the Boise Airport Master Plan Update Open House Get the facts and sign up for the Master Plan Update newsletter at http://www.iflyboise.com/about-boi/master-plan/ What does the Master Plan Update
Draft Concept Alternatives Analysis for the Inaugural Airport Program September 2005
 Draft Concept Alternatives Analysis for the Inaugural Airport Program September 2005 Section 3 - Refinement of the Ultimate Airfield Concept Using the Base Concept identified in Section 2, IDOT re-examined
FORECAST OF AVIATION DEMAND
 3 3 FORECAST OF AVIATION DEMAND 3.1 FORECASTING BACKGROUND This chapter of the Juneau International Airport (JNU) Sustainability Master Plan (SMP) presents forecasts of future aviation demand. These forecasts
Yakima Air Terminal McAllister Field. Aviation Demand Forecast Workshop October 13, 2011
 Yakima Air Terminal McAllister Field Aviation Demand Forecast Workshop October 13, 2011 Today s Agenda What is happening at YKM that is different from FAA s assumptions? What are the national trends for
JOSLIN FIELD, MAGIC VALLEY REGIONAL AIRPORT DECEMBER 2012
 1. Introduction The Federal Aviation Administration (FAA) recommends that airport master plans be updated every 5 years or as necessary to keep them current. The Master Plan for Joslin Field, Magic Valley
Air Carrier and Commuter Airline Forecasts, Methodologies and Assumptions
 Appendix A BACKGROUND TO FORECASTS T he Sonoma County Airport has had a long history of regularly scheduled airline service, but has been without air carrier or commuter airline service since late 2001.
Technical Memorandum. Synopsis. Steve Carrillo, PE. Bryan Oscarson/Carmen Au Lindgren, PE. April 3, 2018 (Revised)
") Appendix D Orange County/John Wayne Airport (JWA) General Aviation Improvement Program (GAIP) Based Aircraft Parking Capacity Analysis and General Aviation Constrained Forecasts Technical Memorandum To:
Appendix D Orange County/John Wayne Airport (JWA) General Aviation Improvement Program (GAIP) Based Aircraft Parking Capacity Analysis and General Aviation Constrained Forecasts Technical Memorandum To:
2009 Muskoka Airport Economic Impact Study
 2009 Muskoka Airport Economic Impact Study November 4, 2009 Prepared by The District of Muskoka Planning and Economic Development Department BACKGROUND The Muskoka Airport is situated at the north end
Air Carrier and Commuter Airline Forecasts, Methodologies and Assumptions
 Appendix A PREFACE TO THE 2011 UPDATE The Airport Master Plan forecasts for the original version of this document were prepared during the years when scheduled passenger service was not available at Sonoma
FORT LAUDERDALE-HOLLYWOOD INTERNATIONAL AIRPORT ENVIRONMENTAL IMPACT STATEMENT DRAFT
 D.3 RUNWAY LENGTH ANALYSIS Appendix D Purpose and Need THIS PAGE INTENTIONALLY LEFT BLANK Appendix D Purpose and Need APPENDIX D.3 AIRFIELD GEOMETRIC REQUIREMENTS This information provided in this appendix
Forecast Data specific to SDM... 6 Aviation Industry Trends Collection of Other Data... 12
 Working Paper 2 Forecasts of Aviation Demand Table of Contents 2.1 Forecast Overview... 1 2.2 Identification of Aviation Demand Elements... 2 2.3 Data Sources... 3 2.4 Historical and Existing Aviation
The presentation was approximately 25 minutes The presentation is part of Working Group Meeting 3
 This is the presentation for the third Master Plan Update Working Group Meeting being conducted for the Ted Stevens Anchorage International Airport Master Plan Update. It was given on Thursday March 7
Regional Jets ,360 A319/ , , , ,780
 Excel Tab Name: Seats (18 MAP) PASSENGER AIRLINE FLIGHT SCHEDULE CALCULATION RECORD Summary 17.2 MAP flight schedule* (with Southwest Airlines B737-800s changed to B737-700s) Number of Total Seats Avg.
FORECASTING FUTURE ACTIVITY
 EXECUTIVE SUMMARY The Eagle County Regional Airport (EGE) is known as a gateway into the heart of the Colorado Rocky Mountains, providing access to some of the nation s top ski resort towns (Vail, Beaver
Purpose and Need for the Proposed Project
 Purpose and Need for the Proposed Project Introduction Snohomish County Airport/Paine Field (PAE) is located in Snohomish County, Washington, approximately 20 miles north of Seattle. Figure A1 depicts
2 Aviation Demand Forecast
 2 Aviation Demand Forecast 2.1 Historic Passenger and RPT Aircraft Movements Historic passenger and Regular Public Transport (RPT) aircraft movements from 1980 to 2007, with significant events that have
Runway Length Analysis Prescott Municipal Airport
 APPENDIX 2 Runway Length Analysis Prescott Municipal Airport May 11, 2009 Version 2 (draft) Table of Contents Introduction... 1-1 Section 1 Purpose & Need... 1-2 Section 2 Design Standards...1-3 Section
COMMERCIAL AND GENERAL AVIATION
 Existing Facilities Daytona Beach International Airport is served by a number of airside and landside facilities. The airport has three asphalt runways: Runway 07L/25R (10,500 feet long by 150 feet wide),
PRIEST RIVER AIRPORT MASTER PLAN. Aviation Activity Forecasts
 PRIEST RIVER AIRPORT MASTER PLAN Aviation Activity Forecasts *DRAFT* February 11, 2015 3.0 AVIATION ACTIVITY FORECAST This chapter discusses the findings and methodologies used to project aviation demand
APPENDIX B: NPIAS CANDIDATE AIRPORT ANALYSIS
 APPENDIX B: NPIAS CANDIDATE AIRPORT ANALYSIS The National Plan of Integrated Airport Systems (NPIAS) is the Federal Aviation Administration s (FAA) national airport plan. The NPIAS includes nearly 3,500
2.1 DESCRIPTION OF FORECAST ELEMENTS
 Forecasts for the are derived from analyses of aircraft and operational trends at the Airport, existing state and federal forecasts, general aviation industry trends, and professional judgment of the niche
PLU Airport Master Plan. Master Plan Advisory Committee (MPAC) Meeting #4 March 19, 2018
 Meeting #4 March 19, 2018") PLU Airport Master Plan Master Plan Advisory Committee (MPAC) Meeting #4 March 19, 2018 Meeting Agenda 1. Master Plan Status [5 Minutes] 2. Preferred Forecasts [15 Minutes] 3. Runway Length Options [45
PLU Airport Master Plan Master Plan Advisory Committee (MPAC) Meeting #4 March 19, 2018 Meeting Agenda 1. Master Plan Status [5 Minutes] 2. Preferred Forecasts [15 Minutes] 3. Runway Length Options [45
TABLE OF CONTENTS. Washington Aviation System Plan Update July 2017 i
 TABLE OF CONTENTS Chapter 1 Overview... 1-1 1.1 Background... 1-1 1.2 Overview of 2015 WASP... 1-1 1.2.1 Aviation System Performance... 1-2 1.3 Prior WSDOT Aviation Planning Studies... 1-3 1.3.1 2009 Long-Term
PART 150 AVIATION ACTIVITY FORECAST
 PART 150 AVIATION ACTIVITY FORECAST July 2010 TABLE OF CONTENTS INTRODUCTION... 1 1. COMMERCIAL PASSENGER... 1 1.1 Historical Enplanement Overview... 1 1.2 Historical Air Service Trends... 2 1.3 Passenger
3 Aviation Demand Forecast
 3 Aviation Demand 17 s of aviation demand were prepared in support of the Master Plan for Harrisburg International Airport (the Airport or HIA), including forecasts of enplaned passengers, air cargo, based
APPENDIX H 2022 BASELINE NOISE EXPOSURE CONTOUR
 APPENDIX H 2022 BASELINE NOISE EXPOSURE CONTOUR This appendix sets forth the detailed input data that was used to prepare noise exposure contours for 2022 Baseline conditions. H.1 DATA SOURCES AND ASSUMPTIONS
CHAPTER 2 AVIATION DEMAND FORECASTS
 CHAPTER 2 AVIATION DEMAND FORECASTS This chapter presents the passenger, based aircraft, and aircraft operations forecast for the. The objective of the forecast is to identify the long-term trends for
Study Design Outline. Background. Overview. Desired Study Outcomes. Study Approach. Goals (preliminary) Recession History
 Recession History") MIA BASELINE ACTIVITY FORECASTS, DERIVATIVE DATA AND FLEET MIX PROJECTIONS RESULTS SUMMARY ACCEPTANCE BRIEFING FOR THE AIRPORT AND SEAPORT COMMITTEE (ASC) JULY 15, 2010 Study Design Outline Background
MIA BASELINE ACTIVITY FORECASTS, DERIVATIVE DATA AND FLEET MIX PROJECTIONS RESULTS SUMMARY ACCEPTANCE BRIEFING FOR THE AIRPORT AND SEAPORT COMMITTEE (ASC) JULY 15, 2010 Study Design Outline Background
Chapter 1 Introduction and Project Overview
 Chapter 1 Introduction and Project Overview Kittitas County in cooperation with the Federal Aviation Administration (FAA) is updating the Airport Master Plan for Bowers Field Airport (FAA airport identifier
Document prepared by MnDOT Office of Aeronautics and HNTB Corporation. MINNESOTA GO STATE AVIATION SYSTEM PLAN
 LAST UPDATE JULY 2013 Acknowledgements The preparation of this document was financed in part by a grant from the Federal Aviation Administration (Project No: 3-27-0000-07-10), with the financial support
MONTEREY REGIONAL AIRPORT MASTER PLAN TOPICAL QUESTIONS FROM THE PLANNING ADVISORY COMMITTEE AND TOPICAL RESPONSES
 MONTEREY REGIONAL AIRPORT MASTER PLAN TOPICAL QUESTIONS FROM THE PLANNING ADVISORY COMMITTEE AND TOPICAL RESPONSES Recurring topics emerged in some of the comments and questions raised by members of the
MINNEAPOLIS-ST. PAUL RELIEVER AIRPORTS Activity Forecasts Technical Report April 2009
 1. Introduction MINNEAPOLIS-ST. PAUL RELIEVER AIRPORTS Activity Forecasts Technical Report April 2009 The purpose of this analysis is to provide aviation activity forecasts for use in the Long- Term Comprehensive
Aviation Activity Forecasts
 C H A P T E R 2 Aviation Activity Forecasts 2.0 OVERVIEW This chapter contains aviation activity forecasts for Chippewa Valley Regional Airport over the 20-year planning horizon. Aviation demand forecasts
CHAPTER 6 NOISE EXPOSURE
 CHAPTER 6 NOISE EXPOSURE FAA requires that the NEM submitted for review represent the aircraft noise exposure for the year of submittal (in this case 2008) and for a future year (2013 for OSUA). However,
Washington Dulles International Airport (IAD) Aircraft Noise Contour Map Update. Ultimate Operations 5th Working Group Briefing 9/25/18
 Aircraft Noise Contour Map Update. Ultimate Operations 5th Working Group Briefing 9/25/18") Washington Dulles International Airport (IAD) Aircraft Noise Contour Map Update Ultimate Operations 5th Working Group Briefing 9/25/18 Meeting Purpose Discuss methodology of Ultimate build scenario operations
Washington Dulles International Airport (IAD) Aircraft Noise Contour Map Update Ultimate Operations 5th Working Group Briefing 9/25/18 Meeting Purpose Discuss methodology of Ultimate build scenario operations
6.C.1 AIRPORT NOISE. Noise Analysis and Land Use Impact Assessment FORT LAUDERDALE-HOLLYWOOD INTERNATIONAL AIRPORT ENVIRONMENTAL IMPACT STATEMENT
 6.C.1 AIRPORT NOISE The existing land uses are described in Chapter Five, Affected Environment. The methodologies used to develop the Geographic Information System (GIS) land use database, the estimated
Airport forecasting is used in master planning to guide future development of the Airport.
 Airport Forecasts Airport forecasting is used in master planning to guide future development of the Airport. 4.1 INTRODUCTION Airport forecasting ensures development is appropriate for passengers, ground
Chapter 3: Aviation Forecasts
 Chapter 3: Aviation Forecasts Rapid City Regional Airport Master Plan Update Chapter 3 - Aviation Forecasts Introduction The Aviation Forecasts chapter of the Airport Master Plan analyzes current and future
Chapter 2 FINDINGS & CONCLUSIONS
 Chapter 2 FINDINGS & CONCLUSIONS 2.01 GENERAL Dutchess County acquired the airport facility in 1947 by deed from the War Assets Administration. Following the acquisition, several individuals who pursued
STUDY OVERVIEW MASTER PLAN GOALS AND OBJECTIVES
 INTRODUCTION An Airport Master Plan provides an evalua on of the airport s avia on demand and an overview of the systema c airport development that will best meet those demands. The Master Plan establishes
Finance and Implementation
 5 Finance and Implementation IMPLEMENTATION The previous chapters have presented discussions and plans for development of the airfield, terminal, and building areas at Sonoma County Airport. This chapter
Recommended Performance Measures
 Recommended Performance Measures January 2009 1 RECOMMENDED PERFORMANCE MEASURES Performance measures are utilized by the North Central Texas Council of Governments (NCTCOG) to monitor the performance
Interstate 90 and Mercer Island Mobility Study APRIL Commissioned by. Prepared by
 Interstate 90 and Mercer Island Mobility Study APRIL 2017 Commissioned by Prepared by Interstate 90 and Mercer Island Mobility Study Commissioned by: Sound Transit Prepared by: April 2017 Contents Section
APPENDIX D MSP Airfield Simulation Analysis
 APPENDIX D MSP Airfield Simulation Analysis This page is left intentionally blank. MSP Airfield Simulation Analysis Technical Report Prepared by: HNTB November 2011 2020 Improvements Environmental Assessment/
FACILITY REQUIREMENTS SUMMARY OF KEY ISSUES OVERVIEW
 FACILITY REQUIREMENTS SUMMARY OF KEY ISSUES OVERVIEW This summary is intended to provide a brief overview of the key issues associated with conformance to FAA standards at Methow Valley State Airport.
INTRODUCTION AND BACKGROUND
 CHAPTER THREE Aviation Activity Forecasts INTRODUCTION AND BACKGROUND This chapter presents projections of aviation activity at Herlong Airport (HEG) that will be used as the basis for facility planning
FINAL APPENDIX J FORECAST
 FAR PART 150 NOISE COMPATIBILITY STUDY FINAL APPENDIX J FORECAST This appendix provides the final forecast for Rickenbacker International Airport and the forecast approval letter received on October 2,
Airport Profile. St. Pete Clearwater International BY THE NUMBERS 818, ,754 $ Enplanements. Passengers. Average Fare. U.S.
 Airport Profile St. Pete Clearwater International St. Pete-Clearwater International Airport (PIE) is located in Pinellas County, Florida about nine miles north of downwn St. Petersburg, seven miles southeast
Table of Contents. Overview Objectives Key Issues Process...1-3
 Table of Contents Chapter One Introduction Overview...1-1 Objectives...1-1 Key Issues...1-2 Process...1-3 Chapter Two Inventory of Existing Conditions Airport Setting...2-1 Locale...2-1 Airport Surroundings...2-5
4 Forecast of Aviation Demand
 November 27, 2017, 2017 Forecast of Aviation Demand 4 1 4 Forecast of Aviation Demand 4.1 Introduction This master plan chapter presents forecasts of future aviation activity at the Bellingham International
Activity Projections and Design Aircraft Selection. Introduction. Airport Role. Present. Chapter 2
 Chapter 2 Activity Projections and Design Aircraft Selection Introduction The preparation of aviation activity projections is a necessary step in determining the need, the timing, and the nature of future
PENSACOLA INTERNATIONAL AIRPORT MASTER PLAN UPDATE AVIATION FORECAST JULY Subconsultant InterVISTAS Consulting Inc.
 PENSACOLA INTERNATIONAL AIRPORT MASTER PLAN UPDATE AVIATION FORECAST JULY 2016 Subconsultant InterVISTAS Consulting Inc. TABLE OF CONTENTS Contents 1.1 Background... 3 1.1.1 Project Introduction... 3 1.1.2
Burke Lakefront Airport (BKL) Master Plan Update
 Master Plan Update") Burke Lakefront Airport () Master Plan Update Public Workshop August 2, 2007 City of Cleveland Department of Port Control (DPC) City of Cleveland DPC Studies Currently In Progress Market Assessment & Feasibility
Burke Lakefront Airport () Master Plan Update Public Workshop August 2, 2007 City of Cleveland Department of Port Control (DPC) City of Cleveland DPC Studies Currently In Progress Market Assessment & Feasibility
AUGUST 2008 MONTHLY PASSENGER AND CARGO STATISTICS
 Inter-Office Memo Reno-Tahoe Airport Authority Date: October 2, 2008 To: Statistics Recipients From: Tom Medland, Director Air Service Business Development Subject: RENO-TAHOE INTERNATIONAL AIRPORT PASSENGER
STAFF REPORT. Airport Land Use Plan Consistency Review: Santa Barbara Airport Master Plan. MEETING DATE: November 19, 2015 AGENDA ITEM: 7D
 STAFF REPORT SUBJECT: Airport Land Use Plan Consistency Review: Santa Barbara Airport Master Plan MEETING DATE: AGENDA ITEM: 7D STAFF CONTACT: Peter Imhof, Andrew Orfila RECOMMENDATION: Adopt findings
1. Background and Proposed Action
 1. Background and Proposed Action This chapter describes Hillsboro Airport and the planning background for the proposed project. The Port of Portland (the Port) is the sponsor for the Hillsboro Airport
Chapter Two Airport Master Plan Update AERONAUTICAL ACTIVITY FORECAST Grants Pass Airport
 Chapter Two Airport Master Plan Update AERONAUTICAL ACTIVITY FORECAST Grants Pass Airport Aviation demand forecasts help to determine the size and timing of needed airport improvements. This chapter indicates
Whangarei Airport. Prepared by Carine Andries 10/20173
 Whangarei Airport Prepared by Carine Andries 10/20173 March 2010 TABLE OF CONTENTS 1 2 3 INTRODUCTION... 3 AIRPORT ROLE AND FUNCTION... 3 AIRPORT FEATURES AND CAPACITY... 3 3.1 3.2 3.3 3.4 3.5 3.5.1 3.5.2
Current Airport Roles
 Chapter Four: Current Airport Roles Introduction Current airport roles are defined differently from national, state, and local perspectives. The Federal Aviation Administration (FAA) has established two
Planning, Development and Environment Committee
 Page 1 of 7 MEMORANDUM TO: Planning, Development and Environment Committee FROM: Neil Ralston, Airport Planner Airport Development (726-8129) SUBJECT: 2035 MSP LONG TERM COMPREHENSIVE PLAN FORECAST, FACILITY
Airport Profile Pensacola International
 Airport Profile Pensacola International 2015 BY THE NUMBERS Enplanements 808,170 Airport Pensacola International Airport (PNS) is located approximately three nautical miles northeast of the central business
Hartford-Brainard Airport Potential Runway Closure White Paper
 Hartford-Brainard Airport Potential Runway 11-29 Closure White Paper June 2012 In recent years there has been discussion regarding the necessity of Runway 11-29 to the Hartford- Brainard Airport (HFD)
Draft Concept Alternatives Analysis for the Inaugural Airport Program September 2005
 Draft Concept Alternatives Analysis for the Inaugural Airport Program September 2005 Section 1 - Introduction This report describes the development and analysis of concept alternatives that would accommodate
Merritt Island Airport
 TABLE OF CONTENTS CHAPTER 1 INTRODUCTION... 1-1 INTRODUCTION AND PROJECT OVERVIEW... 1-1 General Guidelines... 1-1 Prior Planning Documentation... 1-2 Key Issues... 1-2 Goals and Objectives... 1-2 Regulatory
BEAR LAKE COUNTY AIRPORT MASTER PLAN. Aviation Activity Forecast
 BEAR LAKE COUNTY AIRPORT MASTER PLAN Aviation Activity Forecast *DRAFT* 3.0 AVIATION ACTIVITY FORECAST This chapter discusses the findings and methodologies used to project aviation demand at Bear Lake
Draft Concept Alternatives Analysis for the Inaugural Airport Program September 2005
 Section 10 Preferred Inaugural Airport Concept 10.0 Introduction The Preferred Inaugural Airport Concept for SSA was developed by adding the preferred support/ancillary facilities selected in Section 9
> Aircraft Noise. Bankstown Airport Master Plan 2004/05 > 96
 Bankstown Airport Master Plan 2004/05 > 96 24.1 Why Is Aircraft Noise Modelled? Modelling of the noise impact of aircraft operations has been undertaken as part of this MP. Such modelling is undertaken
APPENDIX X: RUNWAY LENGTH ANALYSIS
 APPENDIX X: RUNWAY LENGTH ANALYSIS Purpose For this Airport Master Plan study, the FAA has requested a runway length analysis to be completed to current FAA AC 150/5325-4B, Runway Length Requirements for
Recommendations for Northbound Aircraft Departure Concerns over South Minneapolis
 Recommendations for Northbound Aircraft Departure Concerns over South Minneapolis March 21, 2012 Noise Oversight Committee Agenda Item #4 Minneapolis Council Member John Quincy Background Summer of 2011
CHAPTER 1 BACKGROUND AND PROPOSED ACTION
 CHAPTER 1 BACKGROUND AND PROPOSED ACTION 1.0 INTRODUCTION An Environmental Assessment (EA) evaluates the effects of a proposed Federal action on the surrounding environment and is prepared in compliance
APPENDIX B NATIONAL PLAN OF INTEGRATED AIRPORT SYSTEMS
 APPENDIX B NATIONAL PLAN OF INTEGRATED AIRPORT SYSTEMS Pocatello Regional Airport Airport Master Plan APPENDIX B NATIONAL PLAN OF INTEGRATED AIRPORT SYSTEMS The Airport and Airway Improvement Act of 1982
EAT Master Plan Planning Advisory Committee (PAC) Meeting #2 Summary (FINAL)
 Meeting #2 Summary (FINAL)") PAC Meeting #2: November 10, 2016 Meeting Participants: Pangborn Airport: Port of Chelan County: Consultant Team: PAC Members: Trent Moyers, Tina Stadther, Ron Russ Mark Urdahl Damon Smith, Jeff Smith,
PAC Meeting #2: November 10, 2016 Meeting Participants: Pangborn Airport: Port of Chelan County: Consultant Team: PAC Members: Trent Moyers, Tina Stadther, Ron Russ Mark Urdahl Damon Smith, Jeff Smith,
Chapter 8.0 Implementation Plan
 Chapter 8.0 Implementation Plan 8.1 Introduction This chapter is the culmination of the analytical work accomplished in the previous chapters. The result is a prioritized list of the essential projects.
Airport Planning Area
 PLANNING AREA POLICIES l AIRPORT Airport Planning Area LOCATION AND CONTEXT The Airport Planning Area ( Airport area ) is a key part of Boise s economy and transportation network; it features a multi-purpose
TABLE OF CONTENTS. General Study Objectives Public Involvement Issues to Be Resolved
 TABLE OF CONTENTS Description Page Number LIST OF ACRONYMS... a CHAPTER ONE INTRODUCTION General... 1-1 Study Objectives... 1-1 Public Involvement... 1-2 Issues to Be Resolved... 1-2 CHAPTER TWO EXISTING
AVIATION ACTIVITY FORECAST St. Petersburg-Clearwater International Airport
 AVIATION ACTIVITY FORECAST St. Petersburg-Clearwater International Airport 4.1 INTRODUCTION This chapter presents the development of the forecast of aviation activity at the St. Petersburg-Clearwater International
RSAT RUNUP ANALYSIS 1. INTRODUCTION 2. METHODOLOGY
 RSAT RUNUP ANALYSIS 1. INTRODUCTION The FAA Runway Safety Action Team (RSAT) is a team of FAA staff that works with airports to address existing and potential runway safety problems and issues. The RSAT