Air Arabia. Investor Presentation. Sharjah, UAE: September 2013
|
|
|
- Lewis Gibbs
- 6 years ago
- Views:
Transcription

1 Air Arabia Investor Presentation Sharjah, UAE: September 2013
2 Disclaimer Information contained in this presentation is subject to change without notice, its accuracy is not guaranteed and it may not contain all material information concerning the company. Neither we nor our advisors make any representation regarding, and assume no responsibility or liability for, the accuracy or completeness of, or any errors or omissions in, any information contained herein. In addition, the information contains projections and forward-looking statements that reflect the company s current views with respect to future events and financial performance. These views are based on current assumptions which are subject to various risks and which may change over time. No assurance can be given that future events will occur, that projections will be achieved, or that the company s assumptions are correct. Actual results may differ materially from those projected. This presentation is strictly not to be distributed without the explicit consent of Company management under any circumstance.
3 Content Air Arabia Story Investment Highlights Financials Way Forward Governance & Community Appendix

4 Section 1 Air Arabia Story

5 AED - Million Air Arabia Story General Overview Company Overview Global Presence (2013) Launched in October 2003, Air Arabia is the first and largest low cost carrier in the Middle East and North Africa. Following 10 successful years of operations, Air Arabia has grown to become a leading low cost carrier operator across key Global emerging markets. Currently operates to 88 destinations spread across the Middle East, North Africa, Indian Subcontinent, Central Asia and Europe. Air Arabia operates from 3 main hubs in the UAE, Morocco and Egypt. Air Arabia s fleet consists of 33 owned and leased Airbus A320s. Asset Value Evolution Russia IPO IPO Years

6 Air Arabia Story General Overview Air Arabia has been profitable since first year of operations. AED10.8 billion RPK in % growth compared to Strong balance sheet with AED1.33 billion in cash RPK: 8.5 billion 2009 ASK: 10.5 billion 2010 RPK: 9.2 billion 2010 ASK: 11.0 billion 2011 RPK: 9.6 billion 2011 ASK: 11.7 billion 2012 RPK: billion 2012 ASK: 13 billion Source: Company

7 Air Arabia Story Map of Global Presence
8 Air Arabia Story Group Portfolio Air Arabia (PJSC)- (DFM:AIRARABIA), consists of a group of airlines and companies offering travel and tourism services across the globe. Industry Companies Ownership Description Airlines Ground Handling & MRO Flight Operations Hospitality Tourism Technology 100% 49% 41% 50% 100% 100% 100% 51% 100% 51% First & Largest LCC in MENA region covering vast population spreading across Middle East and Indian Subcontinent and CIS region. Morocco's leading LCC extensively covering Europe from various airports across the Kingdom with great potential to spread wings into Africa. Egypt s most innovative LCC, serving GCC the Middle East, Europe and Africa. SAS is a JV with Sharjah Airport that delivers a comprehensive range of passenger, ramp and cargo handling for airline operators and airport customers. Maintenance Hangar designed to meet all MRO requirements for entire Air Arabia fleet while serving other airlines and aircraft. Providing significant cost saving, this flight simulator facility helps Air Arabia provide world-class training for up to 400 pilots a year. Both hotels perfectly situated in Sharjah and Dubai providing Air Arabia with a great expansion into hospitality. JV company that supports and enhances the quality of on-board catering while servicing a niche market for catering and hospitality Spread across GCC states, Cozmo Travel is a leading travel agency providing a wide range of individual and corporate travel solutions. ISA is a leading IT solutions provider. ISA unique creation is the leading reservations system AcelAero that is now being used by many airlines across the world.

9 Section 2 Investment Highlights
10 Investment Highlights General Overview Leadership Advantage First mover advantage - capitalizing on the multi-hub model taking key emerging markets as basis to penetrating new regions and grow network. The first Arab listed airline (DFM) providing the carrier an independent path to growth and profitability. Brand Name - as the name reflects, Air Arabia is set on becoming the only Pan Arab airline connecting the whole range of the Arab world with Europe, Asia and Africa. Seat Factor - runs at one of the industry s highest seat load factors, 82% registered in Ancillary Revenues Revenue from Ancillary services have grown to represent 6% of total revenue for FY Average Hedge US$99.58/bbl Average Hedge US$97.44/bbl Average Hedge US$97.13/bbl Fuel Hedging ( ) 48% 52% 52% 48% 69% 31% Hedge Fuel No Hedge Fuel
 The world's best operator of an Airbus A320 fleet; highest aircraft utilization and operational reliability. (see graph A1).")

11 Investment Highlights Cost Control & Operational Efficiency Amongst the world s top 5 lowest airline operational cost. Operational Reliability VS Daily Utilization (A320) The world's best operator of an Airbus A320 fleet; highest aircraft utilization and operational reliability. (see graph A1). Industry record for average head count number per aircraft: 53 employees / 1 Aircraft. Aircraft fixed costs are diluted by the industry leading aircraft utilization hours. In-House MRO, Simulator and Reservation system proving increased savings as the airline grow. Graph A1 Source: Airbus Independence, Quality and Control Supporting businesses are individual success stories providing Air Arabia with excellent saving and quality control. Maintenance hangar & flight simulator provides Air Arabia with a unique competitive edge to operational excellence and growth.
 FY 11 FY 12 50% 85.8 87.6 51% 33.1 37.6 51% 24.5 29.5 51% 4.4 7.4 100% 8.1 23.")
12 Investment Highlights Strong Subsidiaries Air Arabia supporting businesses contribute positively to the Group s bottom-line Stake Revenue (AED MM) FY 11 FY 12 50% % % % % %


13 Investment Highlights Multi-Continental Growth 1 Air Arabia UAE 3 Air Arabia Maroc 2 Air Arabia Egypt 3 2 Growth in number of destinations at each Hub 1 Strategic bases located at key emerging markets & spreading wings to under-served regions covering mass population of over 3 billion: Middle East Indian Subcontinent South and Central Asia Africa CIS Region Europe
14 Investment Highlights Record Performance Key Indicators Goals Set in (2007) Accomplishments (2012) Revenue To expand the company and double the revenue streams. In 2007 Total revenue was AED 1.3Billion. Group revenue touched AED 3Billion (2012). Fleet Size Fleet Ownership Dividend Distribution Network To grow the fleet size with a projection to reach 19 by 2010 and 34 planes by 2015 To have at least half of fleet owned by To distribute at least 25% of the net profits generated as dividend to investors. To have 50 destinations by 2010 and 85 by Current fleet size is 32 aircraft, far ahead of projection. 19 aircraft out of 32 fleet is owned today, that s 59%. Distribution of 96.68% of the net profits generated since the IPO; that is equivalent to 41% of capital over the past 5 years. 84 destinations worldwide by far; without counting the repeated frequencies. Subsidiaries & JV s To grow our subsidiaries in a way that best complement our operations and strategic goals. At the time we had 2 subsidiaries, today Air Arabia Group have 9 profitable ones. Operational Growth To seek strategic opportunities for growth. In addition to the UAE, Air Arabia operates from Morocco and Egypt and fully own two hotels in the UAE. Passengers Growth To reach 4.5 Million passengers by Million passenger in 2010 and 5.3 million in Ancillary Revenues To grow our ancillary revenues through expanding product offering. Ancillary revenue grew from 1% of revenues at IPO stage, to 6% of revenues today.


15 Investment Highlights Leadership Expert Teams Lead by its founder and Group Chief Executive Officer Adel A. Ali, who is well known for being at the forefront of the development of modern aviation. Home of some of the world's best aviation talents, together driving Air Arabia into new heights. Few Industry Recognitions World Airline Award for best LCC in MENA region for five consecutive years by Skytrax World s most profitable airline for the year 2008 by CAPA World s best LCC in 2009 by Aviation Week The Best Managed Company in the Middle East Aviation sector by Euromoney Award for excellence in Corporate Governance in 2010 by ESCA CSR Award for best Social Responsibility practices 2012 by Aviation Business World s second best performing airline in 2012 by Aviation Week
16 Section 3 Financials
17 Financials Q Quarterly Performance Financial Highlights (AED Millions) Q Q % Change TOTAL REVENUE % NET PROFIT % Operational Highlights NUMBER OF PAX CARRIED (Millions) % RPK (Billions) % ASK (Billions) % AVERAGE LOAD FACTOR 78% 82% -4%


.")

 2004-2012 Margin Cargo traffic registered a")
18 Financials FY 2012 Revenues (AED) Air Arabia added 6 new Airbus A320 aircraft to its fleet in Seat factor for the full year ending December 31, 2012 stood at 82%. The number of passengers carried for the year 2012 increased by 13% compared to previous year with Air Arabia carrying 5.3 million passenger. Total of 21 new routes in 2012 (9 from Sharjah and 12 from Morocco). Global network in 2012 reached 82 routes from three hubs. Air Arabia distributed 7% cash dividend for the year 2012 equivalent to 7 fils per share. Net Profits (AED) Margin Cargo traffic registered a strong increase of 24% in 2012 compared to previous year, with 24 thousand kilograms being lifted. Ancillary revenues grew by 57% in 2012 compared to previous year.


19 Financials Fleet Funding Plans Out of the first 14 deliveries of our 44 order, 12 have been achieved through finance supported by the European ECA s (at extremely competitive rates). It is anticipated that the remaining aircraft will be a mixture of ECA financing, commercial finance and sale and lease back options. Air Arabia will capitalize on the current low interest rate environment to partially finance new aircraft purchases. The entire fleet consists of the Airbus A320 aircraft type. One of the world s youngest fleet with average age of 2.5 years Ordered 44 A320 aircraft in The delivery will be completed in 2016, in which the carrier fleet will exceed 50 aircraft. All new deliveries are equipped with Airbus latest Sharklet technology (wingtip improving fuel efficiency and Aerodymic of aircraft)

20 Section 4 Way Forward


21 Way Forward Group Strategy Air Arabia aims to strengthen its position as the leading low cost carrier operator across the Arab World: Providing its customers with the most competitive fares; Greatest number of destinations; and Highest quality of service while maintaining the Highest return on investment to its shareholders.

22 Section 5 Governance & Community
23 Governance & Community Corporate Governance Corporate governance code implemented in 2007 is a combination of International and national (UAE) corporate standards. Two board committees with specific responsibility for Audit, nomination and remuneration as well as corporate ethics. Monthly budgeting process, management projection and management financial reports. Risk management framework embedded in the management structure. Fully pledged investor relations function.


24 Governance & Community Corporate Social Responsibility Charity Cloud Program Air Arabia s initiative for sustainable development in 2005 and currently runs schools and medical centres across: Sudan, Sri Lanka, India, Nepal, Yemen and Turkey providing education and health care to thousands of under privileged members of communities across the Globe. Air Arabia Sports Adventure Community Initiative launched in 2007 to help individual and team athletes achieve their sports dreams. Air Arabia World Sailing Endurance Challenge 2007 Bahrain Team Air Arabia World Sailing Competition 2008 Air Arabia Sailing Adventure 2010 Air Arabia Para-Gliding Challenge 2011 Team Air Arabia 2012 World Cycling Challenge

25 Section 6 Appendix
26 Appendix Operating Statistics (Figures in AED) Number of Aircrafts Average Aircrafts Destinations Number of Pax (Millions) RPK (Billions) ASK (Billions) Average Load Factor 68% 79% 80% 86% 85% 80% 83% 82% 82% Air Arabia Only. Year End 2012

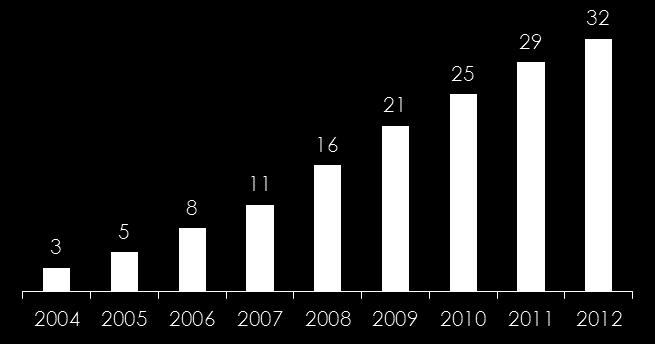

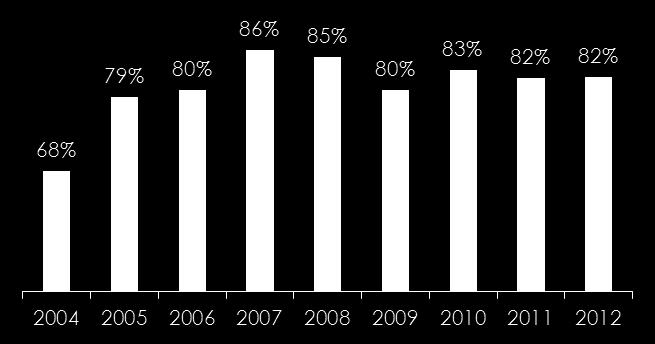
27 Appendix Operating Metrics Destinations Fleet Size Load Factor Total Passengers (Million)
28 Latin America Middle East Europe Asia Pacific Africa North America Middle East Europe Latin America Asia Pacific North America Africa North America Europe Middle East Asia Pacific Latin America Africa (% of ASKs) Appendix Arab Aviation Overview RPKs Growth (Y-o-Y) ASKs Growth (Y-o-Y) Total Passenger Load Factor 14% 12% 10% 8% 6% 4% 2% 12% 10% 9% 5% Industry: 6% 4% 3% 10% 8% 6% 4% 2% 9% 8% 8% 4% Industry: 5% 3% 2% 90% 85% 80% 75% 70% 65% 87% 84% 82% 80% 80% 73% 0% 0% 60% LCC Penetration - MENA Region (2007) LCC Penetration - MENA Region (2012) Traditional Carriers, 98.6% LCC, 1.4% Traditional Carriers, 94-95% LCC, 5-6% Note: Penetration is based on number of passengers Source: IATA, SRS Analyzer, Airbus and AACO
29 Appendix Contact Us For full financials and further information: investor-relations.airarabia.com Tel: Thank You
Air Arabia. Investor Presentation. 1 st Quarter 2015
 Air Arabia Investor Presentation 1 st Quarter 2015 Disclaimer Information contained in this presentation is subject to change without notice, its accuracy is not guaranteed and it may not contain all material
Air Arabia. Investor Presentation. Sharjah, UAE: 3 rd Quarter 2014
 Air Arabia Investor Presentation Sharjah, UAE: 3 rd Quarter 2014 Disclaimer Information contained in this presentation is subject to change without notice, its accuracy is not guaranteed and it may not
Air Arabia Investor Presentation Q2 2016
 Air Arabia Investor Presentation Q2 2016 The Development of Air Arabia Air Arabia - General Overview Company Overview Launched in October 2003, Air Arabia was the first and is the largest low cost carrier
Air Arabia Investor Presentation FY / Q4 2016
 Air Arabia Investor Presentation FY / Q4 2016 The Development of Air Arabia Air Arabia - General Overview Company Overview Launched in October 2003, Air Arabia was the first and is the largest low cost
Air Arabia Air Arabia Q Q1 2017
 Air Arabia Air Arabia Q2 2017 Investor Investors Presentation Presentation Q1 2017 The Development of Air Arabia Air Arabia - General Overview Company Overview Launched in October 2003, Air Arabia was
Investor Presentation Q2 2011
 Investor Presentation Q2 Disclaimer Information contained in this presentation is subject to change without notice, its accuracy is not guaranteed and it may not contain all material information concerning
VietJet Aviation Joint Stock Company Key Highlights Q1/2017 Business result. Apr 2017
 VietJet Aviation Joint Stock Company Key Highlights Q1/2017 Business result Apr 2017 Disclaimer INFORMATION CONTAINED IN OUR PRESENTATION IS INTENDED SOLELY FOR YOUR REFERENCE. SUCH INFORMATION IS SUBJECT
Thank you for participating in the financial results for fiscal 2014.
 Thank you for participating in the financial results for fiscal 2014. ANA HOLDINGS strongly believes that safety is the most important principle of our air transportation business. The expansion of slots
Key Highlights Q2/2018 Business result. July 2018
 Key Highlights Q2/2018 Business result July 2018 Disclaimer INFORMATION CONTAINED IN OUR PRESENTATION IS INTENDED SOLELY FOR YOUR REFERENCE. SUCH INFORMATION IS SUBJECT TO CHANGE WITHOUT NOTICE, ITS ACCURACY
Cebu Air, Inc. 2Q2014 Results of Operation
 Cebu Air, Inc. 2Q2014 Results of Operation 1 Disclaimer This information provided in this presentation is provided only for your reference. Such information has not been independently verified and, as
1Q13 R sults esentation
 1Q13 Results Presentation 14 May 2013 Disclaimer The presentation is dated the day it is given. The delivery of this presentation shall not, under any circumstances, create any implication that there has
Q3 FY18 Business Highlights
 Q3 FY18 RESULTS Q3 FY18 Business Highlights 1 2 3 4 5 6 7 Record passengers 7.1m, record revenues 423m Investing in growth 24% passenger growth in Q3 Disciplined cost management flat ex-fuel CASK Largest
Tiger Airways Holdings Limited FY11 Results
 Tiger Airways Holdings Limited FY11 Results May 2011 Financial Year Ended 31 March 2011 Disclaimer The information contained in this presentation (the "Information") is provided by Tiger Airways Holdings
AirAsia X Berhad First Quarter 2014 Results - Investor and Analyst Briefing -
 AirAsia X Berhad First Quarter 2014 Results - Investor and Analyst Briefing - Disclaimer Information contained in our presentation is intended solely for your reference. Such information is subject to
Cebu Air, Inc. 4 th Quarter and Full Year 2017 Results of Operations. cebupacificair.com
 Cebu Air, Inc. 4 th Quarter and Full Year 2017 Results of Operations cebupacificair.com Disclaimer The information provided in this presentation is provided only for your reference. Such information has
John Schubert Managing Director Asia Pacific & India Marketing
 John Schubert Managing Director Asia Pacific & India Marketing September 2017. The statements contained herein are based on good faith assumptions are to be used for general information purposes only.
Vietjet Aviation Joint Stock Company Key Highlights Q1/2018 Business result. April 2018
 Vietjet Aviation Joint Stock Company Key Highlights Q1/2018 Business result April 2018 Disclaimer INFORMATION CONTAINED IN OUR PRESENTATION IS INTENDED SOLELY FOR YOUR REFERENCE. SUCH INFORMATION IS SUBJECT
AIR ARABIA PJSC Q4 AND FULL YEAR COMMENTARY 2017
 AIR ARABIA PJSC Q4 AND FULL YEAR COMMENTARY 2017 Financial highlights Full year 2017 Passengers carried reached 8.53million at a seat factor of 79%. Turnover reached AED 3.74 billion. Yield margin fell
Management Presentation. March 2016
 Management Presentation March 2016 Forward looking statements This presentation as well as oral statements made by officers or directors of Allegiant Travel Company, its advisors and affiliates (collectively
OPERATING AND FINANCIAL HIGHLIGHTS
 Copa Holdings Reports Financial Results for the Fourth Quarter of 2018 Excluding special items, adjusted net profit came in at $44.0 million, or Adjusted EPS of $1.04 Panama City, Panama --- February 13,
ANALYST MEETING 3Q2015
 ANALYST MEETING 3Q2015 November 12, 2015 DISCLAIMER The presentation is dated the day it is given. The delivery of this presentation shall not, under any circumstances, create any implication that there
AIR CANADA REPORTS THIRD QUARTER RESULTS
 AIR CANADA REPORTS THIRD QUARTER RESULTS THIRD QUARTER OVERVIEW Operating income of $112 million compared to operating income of $351 million in the third quarter of 2007. Fuel expense increased 49 per
Copa Holdings Reports Record Earnings of US$41.8 Million for 4Q06 and US$134.2 Million for Full Year 2006
 Copa Holdings Reports Record Earnings of US$41.8 Million for 4Q06 and US$134.2 Million for Full Year 2006 Panama City, Panama --- March 7, 2007. Copa Holdings, S.A. (NYSE: CPA), parent company of Copa
AerCap Holdings N.V. April 11, 2015
 AerCap Holdings N.V. April 11, 2015 Disclaimer Incl. Forward Looking Statements & Safe Harbor This presentation contains certain statements, estimates and forecasts with respect to future performance and
UBS 14 th Global Emerging Markets Conference. New York, November 2016
 UBS 14 th Global Emerging Markets Conference New York, November 2016 This presentation may include forward-looking comments regarding the Company s business outlook and anticipated financial and operating
OPERATING AND FINANCIAL HIGHLIGHTS
 Copa Holdings Reports Financial Results for the Fourth Quarter of 2015 Excluding special items, adjusted net income came in at $31.7 million, or EPS of $0.73 per share Panama City, Panama --- February
Copa Holdings Reports Net Income of $49.9 million and EPS of $1.18 for the Second Quarter of 2018
 Copa Holdings Reports Net Income of $49.9 million and EPS of $1.18 for the Second Quarter of 2018 Panama City, Panama --- Aug 8, 2018. Copa Holdings, S.A. (NYSE: CPA), today announced financial results
Aviation Updates. Mr. John Schubert. Managing Director, Marketing-Asia Pacific & India
 Aviation Updates Mr. John Schubert Managing Director, Marketing-Asia Pacific & India Market Update The statements contained herein are based on good faith assumptions are to be used for general information
Leveraging the New Partnership. 19 December 2011
 Leveraging the New Partnership 19 December 2011 2 Transaction Highlights airberlin and Etihad have today agreed on a comprehensive commercial agreement which is highly synergistic for both companies Etihad
Santander 22 nd Annual Latin American Conference. Cancun, January 2018
 Santander 22 nd Annual Latin American Conference Cancun, January 2018 This presentation may include forward-looking comments regarding the Company s business outlook and anticipated financial and operating
OPERATING AND FINANCIAL HIGHLIGHTS
 Copa Holdings Reports Net Income of US$18.6 Million and EPS of US$0.42 for the Second Quarter of 2010 Excluding special items, adjusted net income came in at $26.3 million, or $0.60 per share Panama City,
Fourth Quarter 2006 Results Presentation February 15, 2007
 Fourth Quarter 2006 Results Presentation February 15, 2007 This presentation may include forward-looking comments regarding the Company s business outlook and anticipated financial and operating results.
2012 Result. Mika Vehviläinen CEO
 2012 Result Mika Vehviläinen CEO 1 Agenda Market environment in Q4 Business performance and strategy execution Outlook Financials 2 Market Environment According to IATA, Global air travel continues to
OPERATING AND FINANCIAL HIGHLIGHTS. Subsequent Events
 Copa Holdings Reports Financial Results for the First Quarter of 2016 Excluding special items, adjusted net income came in at US$69.9 million, or EPS of US$1.66 per share Panama City, Panama --- May 5,
Introduction: Airline Industry Overview Dr. Peter Belobaba Presented by: Alex Heiter & Ali Hajiyev
 Introduction: Airline Industry Overview Dr. Peter Belobaba Presented by: Alex Heiter & Ali Hajiyev Istanbul Technical University Air Transportation Management M.Sc. Program Network, Fleet and Schedule
AACO Members Quick Facts 2013
 2014 AACO Members Quick Facts 2013 Member Airlines 32 Billion $ Revenue (+10.0% over 2012) 49.5 Million Passengers Carried (+7.5% over 2012) 153 Million Tonnes of Cargo (+11.6% over 2012) 4.8 Destinations
Randy Tinseth Vice President, Marketing Boeing Commercial Airplanes
 Randy Tinseth Vice President, Marketing Boeing Commercial Airplanes June 2017. The statements contained herein are based on good faith assumptions are to be used for general information purposes only.
MIRAMAR, Fla., April 29, 2015 (GLOBE NEWSWIRE) -- Spirit Airlines, Inc. (Nasdaq:SAVE) today reported first quarter 2015 financial results.
 -- Spirit Airlines, Inc. (Nasdaq:SAVE) today reported first quarter 2015 financial results.") April 29, 2015 Spirit Airlines Announces First Quarter 2015 Results; Adjusted Net Income Increases 87.1 Percent to $70.7 Million and Pre-Tax Margin Increases 900 Basis Points to 22.7 Percent MIRAMAR, Fla.,
April 29, 2015 Spirit Airlines Announces First Quarter 2015 Results; Adjusted Net Income Increases 87.1 Percent to $70.7 Million and Pre-Tax Margin Increases 900 Basis Points to 22.7 Percent MIRAMAR, Fla.,
Passenger: 17.2 Million (+3.9% yoy) OTP: 85.8% SLF: 73.3% Subsidiaries Operating Revenues US$415.2 Million Cargo Carried 219.4K ton (+10.
 OTP: 85.8% SLF: 73.3% Subsidiaries Operating Revenues US$415.2 Million Cargo Carried 219.4K ton (+10.") Value* 14.78 3.36 4.97 Volume** 32.85 9.59 13.43 Last Price 423 342 348 Market Cap.*** 8.74 8.85 9.01 Note: * Average Value in Billion Rupiah ** Average Volume in Million *** Market Capitalization in Trillion
Value* 14.78 3.36 4.97 Volume** 32.85 9.59 13.43 Last Price 423 342 348 Market Cap.*** 8.74 8.85 9.01 Note: * Average Value in Billion Rupiah ** Average Volume in Million *** Market Capitalization in Trillion
ALAFCO Aviation Lease And Finance Co. KSCC
 Information MEMORANDUM ALAFCO Aviation Lease And Finance Co. KSCC Mr. Abulqasim Abdulghaffar Redha Acting Chief Executive Officer The 5th Forum for Listed Companies and Analysts Kuwait 20 May 2013 Why
Quarterly Aviation Industry Performance
 Quarterly Aviation Industry Performance ALAFCO Aviation Lease and Finance Company K.S.C.P. Quarterly Aviation Industry Performance 3Q17 (Updated November 17) Prepared by: Strategic Planning department
OPERATING AND FINANCIAL HIGHLIGHTS. Subsequent Events
 Copa Holdings Reports Net Income of $103.8 million and EPS of $2.45 for the Third Quarter of 2017 Excluding special items, adjusted net income came in at $100.8 million, or EPS of $2.38 per share Panama
OPERATING AND FINANCIAL HIGHLIGHTS SUBSEQUENT EVENTS
 Copa Holdings Reports Financial Results for the Third Quarter of 2016 Excluding special items, adjusted net income came in at $55.3 million, or adjusted EPS of $1.30 per share Panama City, Panama --- November
Leaving the Competition Behind. Second Quarter (Apr-Jun) 2009 Results
 2009 Results") Leaving the Competition Behind Second Quarter (Apr-Jun) 2009 Results 12 Aug 2009 1 Disclaimer Information contained in our presentation is intended solely for your reference. Such information is subject
Leaving the Competition Behind Second Quarter (Apr-Jun) 2009 Results 12 Aug 2009 1 Disclaimer Information contained in our presentation is intended solely for your reference. Such information is subject
OPERATING AND FINANCIAL HIGHLIGHTS. Subsequent Events
 Copa Holdings Reports Net Income of US$113.1 Million and EPS of US$2.57 for the First Quarter of 2015 Excluding special items, adjusted net income came in at US$106.0 million, or EPS of US$2.41 per share
Analyst Meeting 1Q/2015
 Analyst Meeting 1Q/2015 DISCLAIMER The presentation is dated the day it is given. The delivery of this presentation shall not, under any circumstances, create any implication that there has been no change
Emirates Group Announces $23.9 billion Revenue & 26th Consecutive Year of Profit
 Emirates Group Announces $23.9 billion Revenue & 26th Consecutive Year of Profit The Emirates Group today announced its 26th consecutive year of profit and companywide growth, ending the year in a strong
Airline Performance and Capacity Strategies Dr. Peter Belobaba
 Airline Performance and Capacity Strategies Dr. Peter Belobaba Istanbul Technical University Air Transportation Management M.Sc. Program Network, Fleet and Schedule Strategic Planning Module 18 : 13 March
AerCap Holdings N.V. Keith Helming Chief Financial Officer. Wachovia Securities Equity Conference June 23, 2008
 AerCap Holdings N.V. Keith Helming Chief Financial Officer Wachovia Securities Equity Conference June 23, 2008 Forward Looking Statements & Safe Harbor This presentation contains certain statements, estimates
ROUTE TRAFFIC FORECASTING DATA, TOOLS AND TECHNIQUES
 ROUTE TRAFFIC FORECASTING DATA, TOOLS AND TECHNIQUES Introduction and Background COURSE OBJECTIVES Understanding how economic factors impact demand for air travel. Understanding of how changes in airline
2Q Earnings Results Presentation
 2Q Earnings Results Presentation SAFE HARBOR The present document consolidates information from Avianca Holdings S.A. and its subsidiaries, including unaudited financial figures, operational managerial
INVESTOR PRESENTATION. May 2015
 INVESTOR PRESENTATION May 2015 Forward-looking Statements This presentation contains forward-looking statements within the meaning of the Private Securities Litigation Reform Act of 1995 that reflect the
Meeting the Demand The Battle for Asia Pacific s Airspace
 Meeting the Demand The Battle for Asia Pacific s Airspace The statements contained herein are based on good faith assumptions and are to be used for general information purposes only. These statements
Kuwait Airline Industry Report-Update
 May 2011 Industry Research Kuwait Airline Industry Report-Update Report Contents Summary Industry Overview GCC Airline Sector Kuwait Airline Sector - Brief about Kuwaiti Airlines - Kuwait Airways - Jazeera
ANA HOLDINGS Announces Mid-Term Corporate Strategy for FY ~Strengthening the foundations of the business and looking into the future~
 ANA HOLDINGS NEWS ANA HOLDINGS Announces Mid-Term Corporate Strategy for FY2018-2022 ~Strengthening the foundations of the business and looking into the future~ TOKYO, February 1, 2018 ANA HOLDINGS (hereinafter
Copa Holdings Reports Net Income of $136.5 million and EPS of $3.22 for the First Quarter of 2018
 Copa Holdings Reports Net Income of $136.5 million and EPS of $3.22 for the First Quarter of 2018 May 9, 2018 PANAMA CITY, May 9, 2018 /PRNewswire/ -- Copa Holdings, S.A. (NYSE: CPA), today announced financial
Avianca Holdings S.A. 1Q 2018 Earnings Presentation 2018
 Avianca Holdings S.A. 1Q 2018 Earnings Presentation 2018 Disclaimer The present document consolidates information from Avianca Holdings S.A. and its subsidiaries, including unaudited financial figures,
AIR CANADA REPORTS 2010 THIRD QUARTER RESULTS; Operating Income improved $259 million or 381 per cent from previous year s quarter
 AIR CANADA REPORTS 2010 THIRD QUARTER RESULTS; Operating Income improved $259 million or 381 per cent from previous year s quarter MONTRÉAL, November 4, 2010 Air Canada today reported operating income
OPERATING AND FINANCIAL HIGHLIGHTS SUBSEQUENT EVENTS
 Copa Holdings Reports Net Income of US$6.2 Million and EPS of US$0.14 for the Third Quarter of 2015 Excluding special items, adjusted net income came in at $37.4 million, or EPS of $0.85 per share Panama
Operating lease of 50 new MC aircraft. Annual General Meeting of Shareholders Moscow 25 June 2018
 Operating lease of 50 new MC-21-300 aircraft Annual General Meeting of Shareholders Moscow 25 June 2018 Disclaimer This document has been prepared by PJSC Aeroflot (the Company ). By attending the meeting
PRESS RELEASE Financial Results. Rising passenger traffic at 12.5m Exceeding 1bn in consolidated revenue
 PRESS RELEASE 2016 Financial Results Rising passenger traffic at 12.5m Exceeding 1bn in consolidated revenue Kifissia, 23 March 2017 AEGEAN reports full year 2016 results with consolidated revenue at 1,020m,
Vietjet Aviation Joint Stock Company Key Highlights Q3/2017 Business result. October 2017
 Vietjet Aviation Joint Stock Company Key Highlights Q3/2017 Business result October 2017 Disclaimer INFORMATION CONTAINED IN OUR PRESENTATION IS INTENDED SOLELY FOR YOUR REFERENCE. SUCH INFORMATION IS
Management Presentation. November 2018
 Management Presentation November 2018 Forward looking statements This presentation as well as oral statements made by officers or directors of Allegiant Travel Company, its advisors and affiliates (collectively
THAI AIRWAYS INTERNATIONAL PCL
 THAI AIRWAYS INTERNATIONAL PCL 2Q2017 analysts briefing 16-Aug-2017 1 DISCLAIMER The information contained herein is intended to represent the Company s operating and financial position at a given point
2007/08 Full Year Results Investor Briefing
 2007/08 Full Year Results Investor Briefing Highlights of Result Profit before tax up 46% to $1,408 million Up 36% on the reported result Margin improvement $3 billion of Sustainable Future Benefits achieved
OPERATING AND FINANCIAL HIGHLIGHTS
 Copa Holdings Reports Net Income of US$32.0 Million and EPS of US$0.72 for the Second Quarter of 2012 Excluding special items, adjusted net income came in at $58.6 million, or EPS of $1.32 per share Panama
ANA Holdings Financial Results for FY2013
 ANA HOLDINGS NEWS ANA Holdings Financial Results for FY2013 TOKYO April 30, 2014 - ANA Holdings (hereafter ANA HD ) today reports its consolidated financial for fiscal year 2013 (April, 2013 March, 2014).
Cebu Air, Inc. Annual Stockholders Briefing. 24 June cebupacificair.com
 Cebu Air, Inc. Annual Stockholders Briefing 24 June 2015 cebupacificair.com Business Updates Passengers (M) Operating Statistics 2014: Passenger traffic grew 17.5% to 16.9M. Seat capacity grew 14.8% to
Quarterly Aviation Industry Performance
 Quarterly Aviation Industry Performance ALAFCO Aviation Lease and Finance Company K.S.C.P. Quarterly Aviation Industry Performance (March - June 17) Prepared by: Strategic Planning department 1 Quarterly
Cathay Pacific Airways Interim Results for the six months ended 30 June 2012
 Cathay Pacific Airways Interim Results for the six months ended 30 June 2012 8 August 2012 1 Interim Result 1H2012 1H2011 Change Group attributable (loss) / profit HK$ million (935) 2,808-133.3% Group
Mr. Adel Al-Banwan Deputy CEO
 The 8th Forum for Listed Companies and Analysts ALAFCO Aviation Lease and Finance Co. Mr. Adel Al-Banwan Deputy CEO (18 th April 2016) ALAFCO Aviation Lease and Finance Company K.S.C.P. ALAFCO Aviation
MEDIA/ANALYST PRESENTATION FY RESULTS 11 MAY 2007
 MEDIA/ANALYST PRESENTATION FY2006-07 RESULTS 11 MAY 2007 SIA GROUP FY2006-07 07 RESULTS GROUP REVENUE FY2006/07 ($ million) ($ million) 15,000 14,494 14,000 13,000 12,000 11,000 10,515 12,013 13,341 Record
Africa, Airbus; A vision of the future
 Africa, Airbus; A vision of the future Addis Ababa March 13 th, 2013 Image: DSK Source: Global Insight, United Nations, Airbus GMF Africa Real GDP Urban population Intra-regional & domestic Inter-regional
I AO Chi h e i f E c E on o o n m o i m c i A na n ly l s y is i & P o P l o ilc i y y Se S ctio i n
 Narjess Teyssier ICAO Chief Economic Analysis & Policy Section Montréal 29 September 2010 Content Data Trends Forecasts Impact on stakeholders Monitoring air transport development: Statistics, analysis
ETIHAD AIRWAYS ANNOUNCES ORDER FOR UP TO 117 AIRBUS AIRCRAFT
 Sunday 17 November, 2013 ETIHAD AIRWAYS ANNOUNCES ORDER FOR UP TO 117 AIRBUS AIRCRAFT Major purchase to accommodate growth, increase efficiency and refresh fleet First order of new generation A320neo family
SIA ANALYST/MEDIA BRIEFING Q2 and 1H FY17/18 Results 8 November 2017
 SIA ANALYST/MEDIA BRIEFING Q2 and 1H FY17/18 Results 8 November 2017 THE PARENT AIRLINE Q2 AND 1H FY17/18 RESULTS THE PARENT AIRLINE COMPANY OPERATING PERFORMANCE Q2 % 1H % FY17/18 Change FY17/18 Change
AIRBUS H Roadshow Presentation. New York July 31 st, 2017
 AIRBUS H1 2017 Roadshow Presentation New York July 31 st, 2017 H1 2017 HIGHLIGHTS 2 Healthy commercial aircraft environment; robust backlog of 6,771 a/c supports ramp-up plans H1 financials reflect delivery
Copa Holdings Reports Net Income of US$113.9 Million for the Fourth Quarter of 2013
 Copa Holdings Reports Net Income of US$113.9 Million for the Fourth Quarter of 2013 Panama City, Panama --- February 12, 2014. Copa Holdings, S.A. (NYSE: CPA), today announced financial results for the
Finnair Group Interim Report 1 January 30 September 2008
 Finnair Group Interim Report 1 January 30 September 2008 1 31/10/2008 Presentation name / Author Airline industry at a historical turning point Expensive fuel price in the beginning of 2008 has dramatical
2008/09 Interim Results For the six months ended 31 December 2008
 Bossini International Holdings Limited 2008/09 Interim Results For the six months ended 31 December 2008 Corporate Presentation 18 March 2009 0 0 Disclaimer The information contained in this presentation
American Airlines Group Inc.
 American Airlines Group Inc. Bank of America Merrill Lynch 2018 Transportation Conference Derek Kerr Chief Financial Officer Cautionary Statement Regarding Forward-Looking Statements and Information This
2010 ANNUAL GENERAL MEETING. May 4, 2010
 2010 ANNUAL GENERAL MEETING May 4, 2010 FORWARD-LOOKING STATEMENT Certain information in this presentation and statements made during this presentation, including any question and answer session, may contain
Steve Hahn. Current Market Outlook. Director, Japan Enterprise Technology Programs. Boeing Commercial Airplanes July 2014.
 Current Market Outlook 2015 Boeing Commercial Airplanes July 2014 The statements contained herein are based on good faith assumptions and are to be used for general information purposes only. These statements
Copa Holdings Reports Net Income of $57.7 million and EPS of $1.36 for the Third Quarter of 2018
 Copa Holdings Reports Net Income of $57.7 million and EPS of $1.36 for the Third Quarter of 2018 November 14, 2018 PANAMA CITY, Nov. 14, 2018 /PRNewswire/ -- Copa Holdings, S.A. (NYSE: CPA), today announced
TUI GROUP INVESTOR PRESENTATION
 TUI GROUP INVESTOR PRESENTATION German Investment Conference UniCredit / Kepler Munich, 26-27 September 2012 Future-related statements This presentation contains a number of statements related to the future
Boeing Commercial Airplanes
 May 2014 Investor Conference Boeing Commercial Airplanes Ray Conner President and Chief Executive Officer Boeing Vice Chairman May 21, 2014 Boeing Commercial Airplanes Strong operating performance Record
John Leahy Chief Operating Officer, Customers Airbus Annual Press Conference
 John Leahy Chief Operating Officer, Customers Airbus Annual Press Conference 13 January 2014 A year of new industry records 2013 result Previous records Airbus records Airbus orders 1,619 gross 1,608 (Airbus
Management Discussions and Analysis for the three-month period ended 31 March 2014 and Executive Summary
 Executive Summary Overview of the global economy during the first quarter of 2015 (Q1/2015) are as following; the US economy has been in recovery mode while rapidly dollar appreciation weighs on net exports
Introduction to IATA
 Introduction to IATA Founded in 1945 Travel Agency Community of 90,000 offices Plays a vital and central in airline product distribution IATA Mission: to represent, lead and serve the airline industry
Asia s most profitable LCC airline AirAsia dominates 2012 with another outstanding year-end result
 FOR IMMEDIATE RELEASE Asia s most profitable LCC airline AirAsia dominates 2012 with another outstanding year-end result Note FYE December 2012: Revenue up 11%; Profit After Tax up 238% 4Q2012: Revenue
INVESTOR NEWSLETTER. Full Year 2013 Editions. PT Garuda Indonesia (Persero) Tbk. FY 2012 FY 2013 Change. Summary.
 Tbk. FY 2012 FY 2013 Change. Summary.") INVESTOR NEWSLETTER PT Garuda Indonesia (Persero) Tbk. Full Year 2013 Editions FY 2012 FY 2013 Change Financial Summary (USD Mio) OPERATING REVENUES 3,472 3,716 7.02% OPERATING EXPENSES 3,304 3,660 10.75%
INVESTOR NEWSLETTER PT Garuda Indonesia (Persero) Tbk. Full Year 2013 Editions FY 2012 FY 2013 Change Financial Summary (USD Mio) OPERATING REVENUES 3,472 3,716 7.02% OPERATING EXPENSES 3,304 3,660 10.75%
Air China Limited Interim Results. August Under IFRS
 Air China Limited 21 Interim Results Under IFRS August 21 1 Agenda 21 Interim Results Overview Business Overview Financial Overview Outlook 2 2 2 21 Interim Results 3 21 Interim Results Overview 4 4 4
FOURTH QUARTER RESULTS 2017
 FOURTH QUARTER RESULTS 2017 KEY RESULTS In the 4Q17 Interjet total revenues added $5,824.8 million pesos that represented an increase of 10.8% over the revenue generated in the 4Q16. In the 4Q17, operating
Analyst and Investor Conference Call Q Ulrik Svensson, CFO and Member of the Executive Board
 Analyst and Investor Conference Call Q2 2017 Ulrik Svensson, CFO and Member of the Executive Board Frankfurt, 2 August 2017 Disclaimer The information herein is based on publicly available information.
INVESTOR PRESENTATION. Imperial Capital Global Opportunities Conference September 2015
 INVESTOR PRESENTATION Imperial Capital Global Opportunities Conference September 2015 Forward-looking Statements This presentation contains forward-looking statements within the meaning of the Private
AerCap Holdings N.V. Aengus Kelly, CEO. January 2017
 AerCap Holdings N.V. Aengus Kelly, CEO January 2017 Industry Update Looking Back PASSENGER TRAFFIC GROWTH Air traffic growth in 2016 remained robust, short-haul at 5.6% and long-haul at 6.4% 1 CHINA SLOWING
Copa Holdings Reports Fourth Quarter and Full Year 2007 Results
 Copa Holdings Reports Fourth Quarter and Full Year 2007 Results Panama City, Panama --- February 21, 2008. Copa Holdings, S.A. (NYSE: CPA), parent company of Copa Airlines and Aero Republica, today announced
UBS Latin American New Opportunities Conference. June 11 th -12 th, 2007
 UBS Latin American New Opportunities Conference June 11 th -12 th, 2007 Company Overview OMA operates a diversified portfolio of 13 airports distributed throughout Northern and Central Mexico and is diversified
Quarterly Report Doha Hotels Q Doha Q Review. Hotel Market
 Quarterly Report Doha Hotels Q2 2016 Doha Q2 2016 Review Hotel Market Doha SUPPLY Doha saw an influx of 538 hotel keys in Q2 2016. The most recent openings included properties such as the Moevenpick Al
3M 2013 Edition. Share Information : GIAA.IJ / GIAA.JK. Daily Share Price Movements
 3M 2013 Edition 3M 2012 3M 2013 Change Financial Summary (USD Mio) OPERATING REVENUES 717 807 12.51% OPERATING EXPENSES 734 827 12.70% INCOME (LOSS) FROM OPERATIONS (17) (20) 20.68% INCOME (LOSS) BEFORE