Second quarter 2013 Results Presentation. August, 2013
|
|
|
- Avice Bryant
- 6 years ago
- Views:
Transcription


1 Second quarter 2013 Results Presentation August, 2013
2 This presentation may include forward-looking comments regarding the Company s business outlook and anticipated financial and operating results. These expectations are highly dependent on the economy, the airline industry, commodity prices, international markets and external events. Therefore, they are subject to change and we undertake no obligation to publicly update or revise any forward looking statements to reflect events or circumstances that may arise after the date of this presentation. More information on the risk factors that could affect our results are contained on our Form 20-F for the year ended December 31, This presentation is for informational purposes only and does not constitute an offer, or the solicitation of an offer, to sell, purchase or subscribe for securities in the United States or elsewhere. Securities may not be offered or sold in the United States absent registration or an exemption from registration, and any public offering of securities to be made in the United States will be made by means of a prospectus filed with the U.S. Securities and Exchange Commission that, when filed, may be obtained from LATAM and will contain detailed information about LATAM and its management, as well as financial statements. LATAM intends to register the proposed preemptive rights offering in the United States. Information, tables and logos contained in this presentation may not be used without consent from LATAM Airlines Group S.A. 2
3 LATAM Airlines Group: Highlights 2Q 2013 (US$ million) 2Q13 2Q12 Proforma % Change (YoY) Total Revenues 3,098,911 3,089, % Passenger Revenues 2,520,129 2,554, % Cargo Revenues 486, , % Total Operating Expenses -3,059,551-3,206, % Operating Income 39, ,992 n.m. Operating M argin 1.3% -3.8% 5.1 pp Net Income -329, , % EBITDAR* 383, , % EBITDAR M argin 12.4% 8.0% 4.3 pp Non operational results include a US$361 million and US$431 foreign exchange loss for the second quarter 2013 and 2012 respectively. Results include a 5% YoY and 10% QoQ depreciation of the Brazilian currency. * EBITDAR = Operating income + depreciation & amortization + aircraft rentals 3
4 LATAM Airlines Group Operating Margin Analysis +1.7pp 1,3% +0,5pp -3.8% +3.7pp -19% commission to agents -4% Depreciation and Amortization -10% Aircraft rentals -2.9pp +2.1pp 2Q12 Yield Load Factor Fuel Price W&B Efficiency 2Q Brazilian real [US$] Fuel Price [US$] % -9.9% -117 Op. Margin [US$MM] 39
5 LATAM Airlines Group Passenger Operations Revenue decreased 1.4% -0.6% +1.9% +1.9pp. -3.2% -0.7% 2Q12 2Q13 7


 -0,6% International")


6 LATAM Airlines Group: Diversified passenger capacity growth ASK 2Q 2013 D. Argentina 3% D. Peru 3% D. Colombia 2% D. Ecuador 1% D.Chile 7% International (Long Haul) 34% Growth in ASK (2Q13 vs. 2Q12) -0,6% International (Long Haul & Regional) 3,6% Brazil Domestic -11,6% Chile Domestic 21,1% Peru Domestic 16,5% Argentina Domestic 3,2% Colombia Domestic 3,1% Ecuador Domestic 48,7% D. Brazil 34% Regional 17% 5
7 International: Rationalization of international passenger operations Reducing capacity on certain long haul routes from Brazil, especially from Rio de Janeiro to Europe Strengthening Sao Paulo Hub at Guarulhos Airport Grounding oldest Airbus A330 aircraft Operating Boeing 767s on TAM s long haul routes = lower CASK Starting August 15, 2013, TAM is marketing its code share agreements with American Airlines
8 Domestic Brazil: Successful turnaround Continued capacity reductions: YoY Growth Load Factor improvement: 80% 80% -11% ASKs as compared to June % 78% 67% 68% 68% 69% +9pp 2Q13 3Q11 3Q12 4Q11 4Q12 1Q12 1Q13 2Q12 2Q13 RASK improvement of over 14% in Brazilian reais as compared to 2Q12
9 LATAM Airlines Group Cargo Operations Revenue increases 1.7% +3.2% +3.3% +0.1pp. -1.5% -1.4% 2Q12 2Q13 7
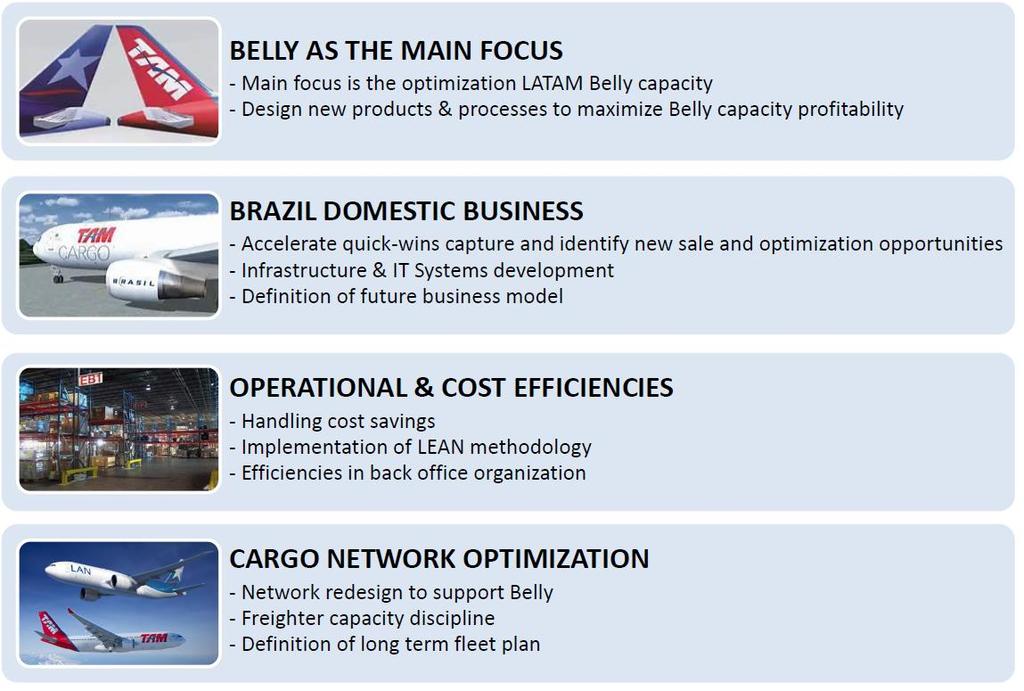
10 Main Cargo initiatives


11 Merger Synergies on track + Cargo Operations Passenger Operations Integration of international cargo operations Implementation of new connection process in GRU and GIG Enhanced connectivity through route optimization, cross selling and code shares intra LATAM`s companies and partners. Sharing of best practices Cost Synergies Renegotiations of fuel contracts have been completed in all airports Joint negotiation of contracts with different suppliers Exchange of best practices within the company Reduction of duplicate functions in the commercial structure Alignment of fare combinability and commercial policies Standardization of the company's product During the first 12 months since the merger the company recorded: US$ 233 million in synergies US$103 million in one-time merger costs
12 LATAM operating exposure dominated by BRL LATAM FX Rate Composition (%) Others CLP 100% 5% 100% 5% FX Operational Impact Gap between revenues and cost in Brazil of 8pp Over the last 12 months we ve reduced operating exposure in approximately US$100 mm BRL 35% 27% Manage operating exposure by increasing sales in USD and costs in BRL USD 53% 63% Revenue Cost Note: Others include CLP, EUR, PEN, ARS and COP 8
13 LATAM balance sheet exposure dominated by BRL 2Q12 3Q12 4Q12 1Q13 2Q13 YE13e 2Q14e BRL Balance Sheet exposure (US bn) ~0.9 ~0.0 BRL Depreciation vs previous quarter 10.0% 0.9% 1.2% -1.5% 10.4% P&L non operating impact (US mm) Balance Sheet exposure reduced by moving aircraft from TAM to LATAM 8

14 Right sizing LATAM s fleet plan Total aircraft at the end of the year Freighters Wide Body Narrow Body

15 Fleet commitments as compared to June 2012 US millions Total Fleet commitmens June ,297 2,594 1,248 6,139 Fleet commitmens June ,953 1,343 1,773 5,069 Reduction: 1.1 billion NET FLEET REDUCTION: NB: 21 aircraft WB: 1 aircraft Aircraft Returns and Sale ,434 Total Adjusted Net Debt reduction: 2.5 billion
16 2013 Guidance Guidance Dic13-Dic12 ASK Growth International (Long Haul & Regional) 2% / 4% ~-10% Brazil Domestic -7 / -9% ~-2% SSC Domestic 12% /14% ~13% TOTAL 0% /2% ~-4% ATK Growth 0% / 2% Synergies(EBITDA) (FY 2013) US$ mm Operating Margin (FY 2013) 4% / 6% Average exchange rate (BRL/USD) (2H 2013) 2.30 Jet Fuel Price (US$/bl) (2H 2013) 122
17
Bank of America Merrill Lynch Emerging Markets Corporate Conference. Miami, June 2016
 Bank of America Merrill Lynch Emerging Markets Corporate Conference Miami, June 2016 This presentation may include forward-looking comments regarding the Company s business outlook and anticipated financial
Fourth Quarter and Full Year 2011 Results Presentation. February 1, 2012
 Fourth Quarter and Full Year 2011 Results Presentation February 1, 2012 This presentation may include forward-looking comments regarding the Company s business outlook and anticipated financial and operating
UBS 14 th Global Emerging Markets Conference. New York, November 2016
 UBS 14 th Global Emerging Markets Conference New York, November 2016 This presentation may include forward-looking comments regarding the Company s business outlook and anticipated financial and operating
Fourth Quarter & FY 2008 Results Presentation January 28, 2008
 Fourth Quarter & FY 2008 Results Presentation January 28, 2008 This presentation may include forward-looking comments regarding the Company s business outlook and anticipated financial and operating results.
Santander 20 th Annual Latin America CEO Conference Cancun, January 2016
 Santander 20 th Annual Latin America CEO Conference Cancun, January 2016 This presentation may include forward-looking comments regarding the Company s business outlook and anticipated financial and operating
Fourth Quarter 2006 Results Presentation February 15, 2007
 Fourth Quarter 2006 Results Presentation February 15, 2007 This presentation may include forward-looking comments regarding the Company s business outlook and anticipated financial and operating results.
Fourth Quarter and Full Year 2009 Results Presentation January 27, 2010
 Fourth Quarter and Full Year 2009 Results Presentation January 27, 2010 This presentation may include forward-looking comments regarding the Company s business outlook and anticipated financial and operating
BTG Pactual VI Latin American CEO Conference 2015 New York, October 2015
 BTG Pactual VI Latin American CEO Conference 2015 New York, October 2015 This presentation may include forward-looking comments regarding the Company s business outlook and anticipated financial and operating
Bank of America Merrill Lynch 2018 Emerging Markets Corporate Credit Conference. Miami, May 2018
 Bank of America Merrill Lynch 2018 Emerging Markets Corporate Credit Conference Miami, May 2018 This presentation may include forward-looking comments regarding the Company s business outlook and anticipated
Deutsche Bank 16 th Annual Global Emerging Markets. New York, September 2017
 Deutsche Bank 16 th Annual Global Emerging Markets New York, September 2017 This presentation may include forward-looking comments regarding the Company s business outlook and anticipated financial and
Santander 22 nd Annual Latin American Conference. Cancun, January 2018
 Santander 22 nd Annual Latin American Conference Cancun, January 2018 This presentation may include forward-looking comments regarding the Company s business outlook and anticipated financial and operating
J.P. Morgan 2019 Global Emerging Markets Corporate Conference. Miami, February 2019
 J.P. Morgan 2019 Global Emerging Markets Corporate Conference Miami, February 2019 This presentation may include forward-looking comments regarding the Company s business outlook and anticipated financial
J.P. Morgan 9 th Annual Global Emerging Markets Corporate Conference. Miami, February 2018
 J.P. Morgan 9 th Annual Global Emerging Markets Corporate Conference Miami, February 2018 This presentation may include forward-looking comments regarding the Company s business outlook and anticipated
Second Quarter 2017 Results Presentation. August 2017
 Second Quarter 2017 Results Presentation August 2017 Second Quarter 2017 Highlights Revenues per ASK increased by 10.3% as a result of proactive capacity management. Operating revenues increased by 7.7%
LATAM AIRLINES GROUP REPORTS OPERATING INCOME OF US$267 MILLION FOR FOURTH QUARTER 2014 AND US$513 FOR FULL YEAR 2014
 LATAM AIRLINES GROUP REPORTS OPERATING INCOME OF US$267 MILLION FOR FOURTH QUARTER 2014 AND US$513 FOR FULL YEAR 2014 Santiago, Chile, March 17, 2015 (NYSE: LFL; IPSA: LAN; BOVESPA: LATM33), the leading
Latin America Airfinance Conference
 13 th Annual Latin America Airfinance Conference 14-15 September 2017 Belmond Copacabana Palace, Rio de Janeiro, Brazil Andres Del Valle Senior Vice President Corporate Finance LATAM Airlines Group From
LATAM AIRLINES GROUP REPORTS A 25.8% IMPROVEMENT IN OPERATING INCOME AND NET INCOME OF US$155.3 MILLION FOR FULL YEAR 2017
 LATAM AIRLINES GROUP REPORTS A 25.8% IMPROVEMENT IN OPERATING INCOME AND NET INCOME OF US$155.3 MILLION FOR FULL YEAR 2017 Santiago, Chile, March 14, 2017 LATAM Airlines Group S.A. (NYSE: LTM; IPSA: LTM),
LATAM AIRLINES GROUP RECORDS A 50.1% INCREASE IN OPERATING INCOME AND A US$93.9 MILLION NET PROFIT IN THE FIRST QUARTER OF 2018
 LATAM AIRLINES GROUP RECORDS A 50.1% INCREASE IN OPERATING INCOME AND A US$93.9 MILLION NET PROFIT IN THE FIRST QUARTER OF 2018 Santiago, Chile, May 8, 2018 LATAM Airlines Group S.A. (NYSE: LTM; IPSA:
LATAM AIRLINES GROUP REPORTS CONSOLIDATED OPERATING INCOME OF US$175.0 MILLION FOR THIRD QUARTER 2018
 LATAM AIRLINES GROUP REPORTS CONSOLIDATED OPERATING INCOME OF US$175.0 MILLION FOR THIRD QUARTER 2018 Santiago, Chile, November 20, 2018 LATAM Airlines Group S.A. (NYSE: LTM; IPSA: LTM), the leading airline
Avianca Holdings S.A. 1Q 2018 Earnings Presentation 2018
 Avianca Holdings S.A. 1Q 2018 Earnings Presentation 2018 Disclaimer The present document consolidates information from Avianca Holdings S.A. and its subsidiaries, including unaudited financial figures,
LATAM AIRLINES GROUP REPORTS CONSOLIDATED OPERATING INCOME OF US$6.5 MILLION FOR SECOND QUARTER 2018, TOTALING US$235 MILLION FOR FIRST HALF 2018
 LATAM AIRLINES GROUP REPORTS CONSOLIDATED OPERATING INCOME OF US$6.5 MILLION FOR SECOND QUARTER 2018, TOTALING US$235 MILLION FOR FIRST HALF 2018 Santiago, Chile, August 20, 2018 LATAM Airlines Group S.A.
Copa Holdings Reports Net Income of $49.9 million and EPS of $1.18 for the Second Quarter of 2018
 Copa Holdings Reports Net Income of $49.9 million and EPS of $1.18 for the Second Quarter of 2018 Panama City, Panama --- Aug 8, 2018. Copa Holdings, S.A. (NYSE: CPA), today announced financial results
FIRST QUARTER 2017 RESULTS. 4 May 2017
 FIRST QUARTER 2017 RESULTS 4 May 2017 A resilient start of the year, traffic up 4.2% 20.9 million passengers carried, up 5.2%, traffic (RPK) up 4.2%, capacity (ASK) up 3.3% and load factor up 0.7pts Confirmation
4Q15 and 2015 Results Presentation. March 30, 2016
 4Q15 and 2015 Results Presentation March 30, 2016 Highlights Paulo Kakinoff CEO Highlights Macro Environment Even more adverse environment for the Brazilian economy, with a GDP drop of 3.8% in 2015 Devaluation
3Q 2016 Earnings Results Presentation. B787 Dreamliner
 3Q 2016 Earnings Results Presentation B787 Dreamliner 2 The present document consolidates information from Avianca Holdings SA and its subsidiaries, including unaudited financial figures, operational managerial
Conference Call 1Q14 Results. Investor Relations May 15, 2014
 Conference Call Results Investor Relations May 15, 2014 1 Highlights 2 Highlights Net revenues of R$2.5 billion in the quarter, an increase of 20% or R$411 million quarter-over-quarter; EBIT totaled R$144
OPERATING AND FINANCIAL HIGHLIGHTS. Subsequent Events
 Copa Holdings Reports Financial Results for the First Quarter of 2016 Excluding special items, adjusted net income came in at US$69.9 million, or EPS of US$1.66 per share Panama City, Panama --- May 5,
Avianca Holdings S.A. 4Q 2018 Earnings Presentation
 Avianca Holdings S.A. 4Q Earnings Presentation Disclaimer The present document consolidates information from Avianca Holdings S.A. and its subsidiaries, including unaudited financial figures, operational
Finnair Q Result
 Finnair Q1 2015 Result 7 May 2015 CEO Pekka Vauramo, Interim CFO Mika Stirkkinen 1 Turbulent market environment The weakness of the Finnish economy continued to be reflected in the demand in the first
LAN AIRLINES REPORTS NET INCOME OF US$4.2 MILLION FOR THE SECOND QUARTER OF 2009
 FOR IMMEDIATE RELEASE LAN AIRLINES REPORTS NET INCOME OF US$4.2 MILLION FOR THE SECOND QUARTER OF 2009 Santiago, Chile, July 28, 2009 LAN Airlines S.A. (NYSE: LFL), one of Latin America s leading passenger
OPERATING AND FINANCIAL HIGHLIGHTS
 Copa Holdings Reports Financial Results for the Fourth Quarter of 2015 Excluding special items, adjusted net income came in at $31.7 million, or EPS of $0.73 per share Panama City, Panama --- February
Copa Holdings Reports Record Earnings of US$41.8 Million for 4Q06 and US$134.2 Million for Full Year 2006
 Copa Holdings Reports Record Earnings of US$41.8 Million for 4Q06 and US$134.2 Million for Full Year 2006 Panama City, Panama --- March 7, 2007. Copa Holdings, S.A. (NYSE: CPA), parent company of Copa
AIR CANADA REPORTS THIRD QUARTER RESULTS
 AIR CANADA REPORTS THIRD QUARTER RESULTS THIRD QUARTER OVERVIEW Operating income of $112 million compared to operating income of $351 million in the third quarter of 2007. Fuel expense increased 49 per
Finnair Q Result
 Finnair Q2 2015 Result 14 August 2015 CEO Pekka Vauramo, Interim CFO Mika Stirkkinen 1 Market environment shows signs of improvement There were signs of a recovery in the demand for consumer and business
2Q Earnings Results Presentation
 2Q Earnings Results Presentation SAFE HARBOR The present document consolidates information from Avianca Holdings S.A. and its subsidiaries, including unaudited financial figures, operational managerial
OPERATING AND FINANCIAL HIGHLIGHTS SUBSEQUENT EVENTS
 Copa Holdings Reports Net Income of US$6.2 Million and EPS of US$0.14 for the Third Quarter of 2015 Excluding special items, adjusted net income came in at $37.4 million, or EPS of $0.85 per share Panama
First Quarter Results August 31 st, 2006
 First Quarter Results 2006-07 August 31 st, 2006 Key features of the First Quarter Market context Sustained global economic growth, and a recovery in Europe Average jet fuel price of 691 $/t, up 25% year-on-year
LAN AIRLINES REPORTS NET INCOME OF US$88.3 MILLION FOR THE FIRST QUARTER OF 2010
 FOR IMMEDIATE RELEASE LAN AIRLINES REPORTS NET INCOME OF US$88.3 MILLION FOR THE FIRST QUARTER OF 2010 Santiago, Chile, April 27, 2010 LAN Airlines S.A. (NYSE: LFL), one of Latin America s leading passenger
OPERATING AND FINANCIAL HIGHLIGHTS
 Copa Holdings Reports Financial Results for the Fourth Quarter of 2018 Excluding special items, adjusted net profit came in at $44.0 million, or Adjusted EPS of $1.04 Panama City, Panama --- February 13,
OPERATING AND FINANCIAL HIGHLIGHTS. Subsequent Events
 Copa Holdings Reports Net Income of $103.8 million and EPS of $2.45 for the Third Quarter of 2017 Excluding special items, adjusted net income came in at $100.8 million, or EPS of $2.38 per share Panama
2Q 2016 Earnings Results Presentation. B787 Dreamliner
 2Q 2016 Earnings Results Presentation B787 Dreamliner 2 The present document consolidates information from Avianca Holdings SA and its subsidiaries, including unaudited financial figures, operational managerial
OPERATING AND FINANCIAL HIGHLIGHTS
 Copa Holdings Reports Net Income of US$32.0 Million and EPS of US$0.72 for the Second Quarter of 2012 Excluding special items, adjusted net income came in at $58.6 million, or EPS of $1.32 per share Panama
INVESTOR PRESENTATION. Imperial Capital Global Opportunities Conference September 2015
 INVESTOR PRESENTATION Imperial Capital Global Opportunities Conference September 2015 Forward-looking Statements This presentation contains forward-looking statements within the meaning of the Private
OPERATING AND FINANCIAL HIGHLIGHTS SUBSEQUENT EVENTS
 Copa Holdings Reports Financial Results for the Third Quarter of 2016 Excluding special items, adjusted net income came in at $55.3 million, or adjusted EPS of $1.30 per share Panama City, Panama --- November
OPERATING AND FINANCIAL HIGHLIGHTS. Subsequent Events
 Copa Holdings Reports Net Income of US$113.1 Million and EPS of US$2.57 for the First Quarter of 2015 Excluding special items, adjusted net income came in at US$106.0 million, or EPS of US$2.41 per share
Institutional presentation. February, 2016
 Institutional presentation February, 2016 Company and scenario highlights GOL at a glance - Largest low cost airline in LatAm Standardized fleet of 142 Boeing 737-700 and 800 NG aircraft Shareholder Structure
Q3 FY18 Business Highlights
 Q3 FY18 RESULTS Q3 FY18 Business Highlights 1 2 3 4 5 6 7 Record passengers 7.1m, record revenues 423m Investing in growth 24% passenger growth in Q3 Disciplined cost management flat ex-fuel CASK Largest
Copa Holdings Reports Net Income of US$113.9 Million for the Fourth Quarter of 2013
 Copa Holdings Reports Net Income of US$113.9 Million for the Fourth Quarter of 2013 Panama City, Panama --- February 12, 2014. Copa Holdings, S.A. (NYSE: CPA), today announced financial results for the
AIR CANADA REPORTS 2010 THIRD QUARTER RESULTS; Operating Income improved $259 million or 381 per cent from previous year s quarter
 AIR CANADA REPORTS 2010 THIRD QUARTER RESULTS; Operating Income improved $259 million or 381 per cent from previous year s quarter MONTRÉAL, November 4, 2010 Air Canada today reported operating income
SAS Q2 2017/2018 TELECONFERENCE
 SAS Q2 2017/2018 TELECONFERENCE 30 May 2018 Earnings as expected despite negative currency effect POSITIVES + Total revenue up MSEK 73 vs. LY + Currency adjusted yield up 0.6% vs. LY + EB-point sale revenue
Analyst and Investor Conference Call Q Ulrik Svensson, CFO and Member of the Executive Board
 Analyst and Investor Conference Call Q2 2017 Ulrik Svensson, CFO and Member of the Executive Board Frankfurt, 2 August 2017 Disclaimer The information herein is based on publicly available information.
Results 2Q17. August 9, 2017
 Results 2Q17 August 9, 2017 2Q17 Highlights Indicators 2Q17 Var. x 2Q16 ASK (BN) 10.4-3.0% Traffic (000) 7,261-1.3% RPK (BN) 8.1 +0.5% Load Factor 77.9% +2.7 p.p. Yield (R$ cents) 23.2 +4.8% Pax Revenue
Finnair 2015 kolmannen vuosineljänneksen tulos
 Finnair 215 kolmannen vuosineljänneksen tulos Q3 Result 215 3 October 215 3.1.215 Toimitusjohtaja Pekka Vauramo Talousjohtaja Pekka Vähähyyppä 1 Highlights of the quarter Excellent Q3 result: Record result
INVESTOR PRESENTATION. May 2015
 INVESTOR PRESENTATION May 2015 Forward-looking Statements This presentation contains forward-looking statements within the meaning of the Private Securities Litigation Reform Act of 1995 that reflect the
Copa Holdings Reports Fourth Quarter and Full Year 2007 Results
 Copa Holdings Reports Fourth Quarter and Full Year 2007 Results Panama City, Panama --- February 21, 2008. Copa Holdings, S.A. (NYSE: CPA), parent company of Copa Airlines and Aero Republica, today announced
OPERATING AND FINANCIAL HIGHLIGHTS
 Copa Holdings Reports Net Income of US$18.6 Million and EPS of US$0.42 for the Second Quarter of 2010 Excluding special items, adjusted net income came in at $26.3 million, or $0.60 per share Panama City,
Copa Holdings Reports Net Income of $57.7 million and EPS of $1.36 for the Third Quarter of 2018
 Copa Holdings Reports Net Income of $57.7 million and EPS of $1.36 for the Third Quarter of 2018 November 14, 2018 PANAMA CITY, Nov. 14, 2018 /PRNewswire/ -- Copa Holdings, S.A. (NYSE: CPA), today announced
IAG results presentation. Quarter One th May 2018
 IAG results presentation Quarter One 2018 4 th May 2018 Highlights Willie Walsh, Chief Executive Officer Highlights Another strong quarter performance with an operating profit of 280m (5.6% margin, +2.3pts)
Cebu Air, Inc. 2Q2014 Results of Operation
 Cebu Air, Inc. 2Q2014 Results of Operation 1 Disclaimer This information provided in this presentation is provided only for your reference. Such information has not been independently verified and, as
Copa Holdings Reports Earnings of US$30.3 Million and EPS of US$0.70 for 3Q08
 Copa Holdings Reports Earnings of US$30.3 Million and EPS of US$0.70 for 3Q08 Panama City, Panama --- November 13, 2008. Copa Holdings, S.A. (NYSE: CPA), parent company of Copa Airlines and Aero Republica,
SECOND QUARTER RESULTS 2018
 SECOND QUARTER RESULTS 2018 KEY RESULTS In the 2Q18 Interjet total revenues added $ 5,781.9 million pesos that represented an increase of 9.6% over the revenue generated in the 2Q17. In the 2Q18, operating
2012 Result. Mika Vehviläinen CEO
 2012 Result Mika Vehviläinen CEO 1 Agenda Market environment in Q4 Business performance and strategy execution Outlook Financials 2 Market Environment According to IATA, Global air travel continues to
LAN and TAM announce intention to combine. Investor Presentation August 13, 2010
 LAN and TAM announce intention to combine Investor Presentation August 13, 2010 Forward Looking Statements This presentation contains forward-looking statements, including with respect to the negotiation,
Cebu Air, Inc. Annual Stockholders Briefing. 24 June cebupacificair.com
 Cebu Air, Inc. Annual Stockholders Briefing 24 June 2015 cebupacificair.com Business Updates Passengers (M) Operating Statistics 2014: Passenger traffic grew 17.5% to 16.9M. Seat capacity grew 14.8% to
Korean Air Lines Q Results & 2011 Business Plan. 27 Feb 2011
 Korean Air Lines 2010 4Q Results & 2011 Business Plan 27 Feb 2011 Disclaimer This presentation is for informational purposes only, contains preliminary financial and other information about Korean Air
JET AIRWAYS (I) LTD. Presentation on Financial Results Q4 FY08
 LTD. Presentation on Financial Results Q4 FY08") JET AIRWAYS (I) LTD Presentation on Financial Results Q4 FY08 June 24, 2008 1 1 1 Agenda Domestic operating environment Jet Airways performance highlights JetLite performance highlights Consolidated Jet
JET AIRWAYS (I) LTD Presentation on Financial Results Q4 FY08 June 24, 2008 1 1 1 Agenda Domestic operating environment Jet Airways performance highlights JetLite performance highlights Consolidated Jet
SECURITIES AND EXCHANGE COMMISSION Washington, D.C FORM 6-K
 6-K 1 gol20190104_6k1.htm GOL20190104_6K1 SECURITIES AND EXCHANGE COMMISSION Washington, D.C. 20549 FORM 6-K REPORT OF FOREIGN ISSUER PURSUANT TO RULE 13a-16 OR 15d-16 OF THE SECURITIES EXCHANGE ACT OF
Copa Holdings Reports Net Income of US$51.9 Million for the Fourth Quarter of 2008 and US$152.2 Million for Full Year 2008
 Copa Holdings Reports Net Income of US$51.9 Million for the Fourth Quarter of 2008 and US$152.2 Million for Full Year 2008 Panama City, Panama --- February 19, 2009. Copa Holdings, S.A. (NYSE: CPA), parent
Investor Relations Update January 25, 2018
 General Overview Investor Relations Update Accounting Changes On January 1, 2018, the company adopted two new Accounting Standard Updates: (ASUs): ASU 2014-9: Revenue from Contracts with Customers (the
Full Year 2017 RESULTS 16 th of February 2018
 Full Year 2017 RESULTS 16 th of February 2018 2017 FULL YEAR 2017 MAIN ACHIEVEMENTS Robust traffic statistics Strong Full Year results +5.6% +2.0% 42% +101% 1,049 1,488 347 696 FY 2016 FY 2017 Passengers
Public meeting with analysts and investors APIMEC. December 7, 2015
 Public meeting with analysts and investors APIMEC December 7, 2015 Opening December 7, 2015 Constantino de Oliveira Junior Chairman Smiles history VARIG launches SMILES Co-branded credit card Bradesco
SAS Q3 2017/ August 2018
 SAS Q3 2017/2018 31 August 2018 Strong earnings in peak season POSITIVES Record number of passengers Total revenue up MSEK 936 vs. LY Currency adjusted yield up 1.1% vs. LY EB point sale up 27% vs. LY
FIRST QUARTER RESULTS 2016
 FIRST QUARTER RESULTS 2016 KEY RESULTS In 1Q16 Interjet total revenues added $3,850.8 million pesos that represented an increase of 21.9% over the income generated in the 1Q15. In 1Q16 total passengers
Azul Increases Net Income by R$152 Million in 1Q18 Operating margin was a record 12.5% despite the 21% increase in oil year over year
 Azul Increases Net Income by R$152 Million in 1Q18 Operating margin was a record 12.5% despite the 21% increase in oil year over year São Paulo, May 10, Azul S.A., Azul, (B3:AZUL4, NYSE:AZUL) the largest
FIRST QUARTER RESULTS 2017
 FIRST QUARTER RESULTS 2017 KEY RESULTS In the 1Q17 Interjet total revenues added $4,421.5 million pesos that represented an increase of 14.8% over the income generated in the 1Q16. In the 1Q17, operating
THIRD QUARTER 2016 RESULTS. 3 November 2016
 THIRD QUARTER 2016 RESULTS 3 November 2016 Highlights of the Third Quarter 2016 Environment Operations Financial highlights Strong increase in airline industry capacity Terrorist attacks in Europe resulting
JET AIRWAYS (I) LTD. Presentation on Financial Results Q July 24, 2009
 LTD. Presentation on Financial Results Q July 24, 2009") JET AIRWAYS (I) LTD Presentation on Financial Results Q1 2010 July 24, 2009 1 1 1 Agenda Domestic operating environment Jet Airways performance highlights JetLite performance highlights Outlook 2 2 2 Domestic
JET AIRWAYS (I) LTD Presentation on Financial Results Q1 2010 July 24, 2009 1 1 1 Agenda Domestic operating environment Jet Airways performance highlights JetLite performance highlights Outlook 2 2 2 Domestic
In 2Q18, Brazil s #1 airline achieves a 2% EBIT margin and grows net revenues by 9%
 In 2Q18, Brazil s #1 airline achieves a 2% EBIT margin and grows net revenues by 9% Operating Income for the second quarter doubled, reaching R$43 million São Paulo, August 2, 2018 - ( GOL or Company ),
Corporate Presentation March 2018
 Corporate Presentation March 2018 Disclaimer The material that follows comprises information about Avianca Holdings S.A. (the Company ) and its subsidiaries, as of the date of the presentation. It has
Finnair Q Result
 17 August 2016 CEO Pekka Vauramo CFO Pekka Vähähyyppä Finnair Q2 2016 Result 1 Highlights of the second quarter The seventh consecutive quarter of profit improvement Fukuoka & Guangzhou route openings
KOREAN AIR 4Q17 FINANCIAL RESULTS
 KOREAN AIR 4Q17 FINANCIAL RESULTS 1 Disclaimer This presentation is for informational purposes only, contains preliminary financial and other information about Korean Air Lines Co., Ltd. and is subject
Financial Position (consolidated)
") May 14 th, 2015 Disclaimer This presentation is for informational purposes only, contains preliminary financial and other information about Korean Air Lines Co., Ltd. and is subject to updating, revision,
May 14 th, 2015 Disclaimer This presentation is for informational purposes only, contains preliminary financial and other information about Korean Air Lines Co., Ltd. and is subject to updating, revision,
1 st Quarter Results FY
 1 st Quarter Results FY 2004-05 05 Q1 Highlights p Context 8Improving economic context 8Strong economic growth in Americas and Asia 8Modest economic recovery in Europe 8Soaring fuel prices 8IPE Brent up
Copa Holdings Reports Net Income of $136.5 million and EPS of $3.22 for the First Quarter of 2018
 Copa Holdings Reports Net Income of $136.5 million and EPS of $3.22 for the First Quarter of 2018 May 9, 2018 PANAMA CITY, May 9, 2018 /PRNewswire/ -- Copa Holdings, S.A. (NYSE: CPA), today announced financial
1Q 2017 Earnings Call. April 18, 2017
 1Q 2017 Earnings Call April 18, 2017 Safe Harbor Statement Certain statements included in this presentation are forward-looking and thus reflect our current expectations and beliefs with respect to certain
THIRD QUARTER RESULTS 2018
 THIRD QUARTER RESULTS 2018 KEY RESULTS In the 3Q18 Interjet total revenues added $ 6,244.8 million pesos that represented an increase of 7.0% over the revenue generated in the 3Q17. In the 3Q18, operating
Air China Limited Interim Results. August Under IFRS
 Air China Limited 21 Interim Results Under IFRS August 21 1 Agenda 21 Interim Results Overview Business Overview Financial Overview Outlook 2 2 2 21 Interim Results 3 21 Interim Results Overview 4 4 4
Investor Presentation
 Investor Presentation December, 2011 FORWARD-LOOKING STATEMENTS This document contains forward-looking statements, including with respect to the negotiation, implementation and effects of the proposed
SAS Group Q2 2012/13. Q2 Restructuring programme moving KPIs in the right direction
 SAS Group Q2 2012/13 1 Q2 Restructuring programme moving KPIs in the right direction Operating revenues +1.6%* Yield improvement of +2.7%* Forceful implementation of 4XNG plan: Unit cost down by 10.7%
Third Quarter 2014 Results. 29 October 2014
 Third Quarter 2014 Results 29 October 2014 Highlights of the Third Quarter Operating environment Air France-KLM Economic environment remains weak Further currency volatility affecting revenues and results
TOKYO MEETINGS NOVEMBER 2016
 TOKYO MEETINGS NOVEMBER 2016 CONTENTS AEROMEXICO AT A GLANCE BUILDING A STRONG AND FLEXIBLE AIRLINE STRATEGIC INITIATIVES 2 AEROMEXICO: MEXICO S PREMIUM NETWORK CARRIER. Mexico s only full service carrier,
Virgin Australia Holdings Limited (ASX: VAH) H1 FY18 Results 1
 H1 FY18 Results 1") Virgin Australia Holdings Limited (ASX: VAH) H1 FY18 Results 1 Summary of H1 FY18 Group Outcomes 2 Group Underlying Profit Before Tax of $102.5 million up 142.3% Group Statutory Profit After Tax of $4.4
Virgin Australia Holdings Limited (ASX: VAH) H1 FY18 Results 1 Summary of H1 FY18 Group Outcomes 2 Group Underlying Profit Before Tax of $102.5 million up 142.3% Group Statutory Profit After Tax of $4.4
3Q Earnings Results Presentation
 3Q Earnings Results Presentation SAFE HARBOR The present document consolidates information from Avianca Holdings S.A. and its subsidiaries, including unaudited financial figures, operational managerial
Annual Results Air New Zealand
 Annual Results 2011 Air New Zealand Highlights Normalised earnings* $75m Net cash position of $860m Operating cash flow down 5% Gearingat467% at 46.7% Final dividend 2.5 cents per share (unimputed) New
AIR CANADA REPORTS FULL YEAR AND FOURTH QUARTER 2010 RESULTS
 AIR CANADA REPORTS FULL YEAR AND FOURTH QUARTER 2010 RESULTS Record annual EBITDAR of $1.386 billion, 104 per cent improvement Operating income improvement of $677 million Employees to receive special
FOURTH QUARTER RESULTS 2017
 FOURTH QUARTER RESULTS 2017 KEY RESULTS In the 4Q17 Interjet total revenues added $5,824.8 million pesos that represented an increase of 10.8% over the revenue generated in the 4Q16. In the 4Q17, operating
Financial Position (consolidated)
") 2013. 8. 14. Disclaimer This presentation is for informational purposes only, contains preliminary financial and other information about Korean Air Lines Co., Ltd. and is subject to updating, revision,
2013. 8. 14. Disclaimer This presentation is for informational purposes only, contains preliminary financial and other information about Korean Air Lines Co., Ltd. and is subject to updating, revision,
Adjusted net income of $115 million versus an adjusted net loss of $7 million in the second quarter of 2012, an improvement of $122 million
 Air Canada Reports Record Second Quarter 2013 Results Highest Adjusted Net Income, Operating Income and EBITDAR Results for Second Quarter in Air Canada s History Adjusted net income of $115 million versus
THIRD QUARTER RESULTS 2017
 THIRD QUARTER RESULTS 2017 KEY RESULTS In the 3Q17 Interjet total revenues added $5,835.1 million pesos that represented an increase of 22.0% over the revenue generated in the 3Q16. In the 3Q17, operating
AIR CANADA REPORTS FIRST QUARTER RESULTS
 AIR CANADA REPORTS FIRST QUARTER RESULTS As a result of the deconsolidation of Jazz effective May 24, 2007, Air Canada s consolidated results for the first quarter of 2008 are not directly comparable to