FY2002 Competition Plan
|
|
|
- Cameron Marilyn Merritt
- 6 years ago
- Views:
Transcription
1 FY2002 Competition Plan DFW will be the Airport of Choice by creating a positive, competitive, and safe environment that exceeds our customers expectations.
2
3 CONTENTS INTRODUCTION...1 PART ONE EXECUTIVE SUMMARY HIGHLIGHTS OF THE PAST YEAR... 2 I. POLICIES AND PROCEDURES...2 II. FACILITY EXPANSION...4 III. MARKETING INITIATIVES...5 CONCLUSION - EXECUTIVE SUMMARY... 7 PART TWO - PLAN UPDATE 1.0 BACKGROUND Plan Update Status DFW s Performance Air Service Status DFW S FINANCIAL STRUCTURE DFW Use Agreement Majority-in-Interest Airport Cost Structure PFC Funds TERMINAL FACILITIES USE AND OCCUPANCY Number and Allocation of Gates Gate Utilization Rates and Monitoring Common Use Gates Gate Use and Availability New Service Requests and Accommodation Subleasing Arrangements Disputes Resolution AIRPORT DEVELOPMENT Airport Development Plan Airport Capital Development Program AIRFARE ANALYSIS... 41
4 5.01 Fare Yield Revenue Yield Average Fare Comparison DFW Average Fare by Airline AIR SERVICE DEVELOPMENT Marketing Initiatives Marketing Programs CONCLUSION APPENDICES Appendix A - Gate Monitoring Procedures Appendix B - Gate Activity Report Appendix C - Average Turns Per Gate Summary Appendix D - Preferential Use Gate and Common Use Gate Policies Appendix E - MII Approval Letter Terminal D Appendix F - Gate Exchange Location Map Appendix G - Gate Exchange Agreement Appendix H - Preferential Lease Agreement Appendix I - Airline Sub-Lease & Other Agreements Request Letter NOTE: Copies of the Appendices to this document are not attached in this PDF format due to size and format. Please contact the DFW Planning and Real Estate Department at should you desire copies of any of the attached Appendices.
5 DALLAS/FORT WORTH INTERNATIONAL AIRPORT A Competitive Airport for All Airlines INTRODUCTION The passage of the Wendell H. Ford Aviation Investment and Reform Act for the 21 st Century (AIR-21), P.L , in 2000, marked the beginning of a new era in how the nation's airports conduct their business affairs with respect to airlines, facilities and the furthering of airline industry competition. Congressional intent to expand competition throughout the U.S. airline industry led to many new provisions in the legislation. Airports have a clear and affirmative obligation to provide a pro-competitive atmosphere for all airlines, from the largest network airlines to the smallest regional airlines. Pursuant to Section 155 of the AIR-21 legislation, Dallas/Fort Worth International Airport (DFW or Airport) submitted its Airport Competition Plan (the DFW Plan) to the Federal Aviation Administration (FAA) Office of Airport Planning and Programming in December After an exchange of correspondence with DFW, the FAA approved the DFW Plan in March DFW has prepared an update to the DFW Plan (FY2001 Competition Plan Update) under the industry guidelines provided by the FAA in August Included in the FY2001 Competition Plan Update is information about new efforts at DFW to promote competition and updated financial and operational data. Specific responses to issues raised by the FAA in the exchange of correspondence regarding the DFW Plan are also incorporated in the FY2001 Competition Plan Update. The FY2001 Competition Plan Update is arranged in two parts. The first part (Executive Summary) is a narrative description of the major actions taken by DFW during the period October 1, September 30, 2001 (Reporting Period) to promote competition and enhance airline growth at DFW. The second part (Plan Update) updates the information provided to the FAA in the DFW Plan with information from the Reporting Period. This part also addresses the specific issues outlined in the Letter of Approval from the FAA for the DFW Plan. 1
6 PART ONE EXECUTIVE SUMMARY HIGHLIGHTS OF THE PAST YEAR Over the Reporting Period, DFW has taken definitive steps to promote airline competition at the Airport. The Airport's efforts include the adoption of new policies and procedures, facility planning to accommodate future growth of the Airport's airlines and marketing efforts to attract new airlines and new service from existing airlines. Specifically, the pro-competitive actions that have taken place at DFW over the Reporting Period include: Policies and Procedures Adoption of formal Preferential Use Gate and Common Use Gate Policies Establishment of formal Gate Monitoring and Reporting Procedures Conversion of two (2) gates from exclusive use gates to preferential use gates Facility Expansion Start of Construction of Terminal D and a new People Mover System Receipt of Majority-in-Interest (MII) approval for Terminal F from American Airlines Interim Terminal Expansion Planning Marketing Initiatives Inauguration of new domestic and international airline service Expansion of the Carrier Support Program Implementation of New Marketing Programs These new pro-competitive actions are explained in detail in the attached Plan Update. However, a summary is provided in the following paragraphs. I. POLICIES AND PROCEDURES A. New Gate Use Policies Over time, DFW hopes to provide additional passenger terminals and related facilities to continue to provide all airlines with ample facilities reasonably necessary for current and future operations. In the short term however, DFW is somewhat gate constrained and must carefully manage all terminal facilities. Consequently, in September 2001, the Dallas/Fort Worth International Airport Board (DFW Board) passed two new policies 2
7 concerning preferential use gates and common use gates at DFW (the Policy or Policies). The new Policies detail the rights and responsibilities in the use of preferential or common use gates at the Airport for incumbent airlines, accommodated airlines and DFW. The Common Use Gate Policy applies to the six (6) common use gates in Terminal B (Common Use Gates). Historically, DFW has accommodated all airlines wishing to use the Common Use Gates and coordinated operating schedules. However, as demand for Common Use Gates has risen, DFW instituted the formal Common Use Gate Policy that outlines the priority for all future airline accommodation requests for Common Use Gate access. The Preferential Use Gate Policy assists domestic or international airlines seeking entry into DFW with scheduled service or seeking to expand scheduled flight operations at DFW. If these requirements cannot be reasonably accommodated by use of a sublease with existing airlines on exclusive use gates (Exclusive Use Gates) or on Common Use Gates, then the Chief Executive Officer of DFW shall have the right to pursue accommodation from airlines operating at DFW on preferential use gates (Preferential Use Gates). The innovative aspect of the Preferential Gate Use Policy is the ability to accommodate new or expanding airlines even with high utilization of existing gates. This historically high utilization would exceed the threshold for typical "use it or lose it" provisions. DFW created these Policies specifically to promote competition by ensuring that any airline seeking to operate or grow at DFW has access to adequate facilities for operations under the unique and competitive environment of the Airport. B. Formal Gate Monitoring and Reporting Procedures Signatory Airline status is achieved at DFW by executing the Restated Use Agreement (Use Agreement). The Use Agreement, negotiated in the late 1960's, effective in 1974 and terminating in 2009, was a reflection of the industry at that time and provides for long term, exclusive unit terminal leases on a residual basis. Due to the limited number of existing gates and the hubbing activity by American Airlines, Inc. (American) and Delta Air Lines, Inc. (Delta), Exclusive Use Gate utilization remains high. However, in support of the enforcement of Passenger Facility Charge (PFC) Assurance 7, DFW has created and instituted formal gate monitoring procedures (Gate Monitoring and Reporting Procedures) to determine if any of the gates at DFW, specifically including Exclusive Use Gates, are not fully utilized. These Gate Monitoring and Reporting Procedures were put in place beginning in April 2001 and continue today. 3
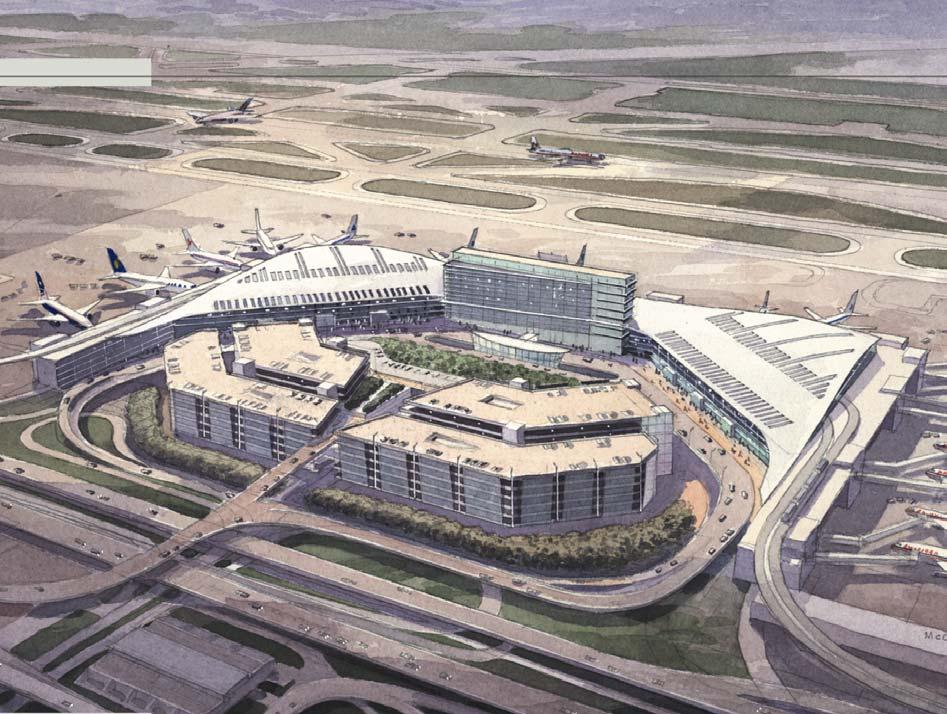
8 C. Establishment of Preferential Use Gates The first of DFW's Exclusive Use Gates to convert to Preferential Use Gates are Gates B-11 and B-12 in Terminal B. American requested the exchange with DFW of two (2) gates leased to American as Exclusive Use Gates for two (2) gates controlled by DFW as Common Use Gates. DFW required, as part of the Gate Exchange negotiation with American, the conversion of the two (2) Exclusive Use Gates leased to American as a result of the exchange to Preferential Use Gates. When the exchange was completed, the number of Common Use Gates stayed the same. DFW created detailed preferential use accommodation provisions and dispute resolution procedures that were spelled out in the Gate Exchange Agreement and later included in the Preferential Use Gate Lease with American for Gates B-11 and B-12. The Preferential Use Gates provide a first ever opportunity for DFW to require an incumbent airline to accommodate another airline should there be no other reasonable space at the Airport. DFW plans to use the Policy as a model for future accommodation rights as additional gates are constructed and/or as existing Exclusive Use Gates convert to Preferential Use Gates in the future. II. FACILITY EXPANSION Demand for gates at DFW is expected to be greater than supply over the next few years. Even with the recent attacks and subsequent decline in traffic, DFW is still a gate-constrained airport. The opening of Terminal D in 2005 will provide needed customer service enhancements for international operations, however, only with the construction of Terminal F (opening in 2007 or later) will needed gate capacity, particularly for domestic service, be increased. In the interim, DFW has been in discussions with the airlines about how to add temporary facilities to meet the growing demand for terminal facilities. A. Terminal D and Automated People Mover Construction During the Reporting Period, significant construction progress has been achieved in the Airport's $2.6 Billion Dollar Capital Development Program (CDP). Terminal D, the Airport's new international terminal facility, and the Automated People Mover System are two elements of the CDP that will enhance and promote airline competition at DFW. Terminal D will create a state of the art facility for international operations and the Automated People Mover System will provide expeditious connections between passengers on smaller or affiliated 4
9 airlines who may want to connect with the American or Delta hubbing operations. B. Terminal F Initial planning efforts were continued in the Reporting Period for the approval and construction of an additional terminal facility, Terminal F, which would be scheduled to open two (2) or three (3) years after the opening of Terminal D. The planning effort was initiated based upon the forecasted demand for additional gate facilities, particularly for the nonhubbing airlines, and DFW's commitment to support airline competition by providing adequate gate capacity. The business plan discussed with the airlines serving DFW provided that Terminal F would be a nonexclusive, multi-tenant, Airport-managed international/domestic facility. Airlines would occupy gates at Terminal F either on a Common Use Gate or Preferential Use Gate basis. The need for this new terminal was generally acknowledged by the airlines. American demonstrated its support for Terminal F by providing its affirmative Majority-In-Interest vote for Terminal F. Subsequent to these initial efforts, planning for Terminal F has been halted for the immediate future given current demand levels post September 11, As we continue to monitor demand recovery, environmental processing for this project will continue. C. Interim Gate Expansions The airlines and DFW have spent time detailing three options to provide for additional capacity for new entrants prior to new terminal construction. All current options involve the improvement or addition of facilities in or near Terminal B. The plans under consideration create additional gate space for international operations, with the ability to use the gates for domestic operations. Additionally, depending on the exact configuration and/or alignment of airlines and gates, an additional gate may be available for DFW to purchase, which would be used to provide additional capacity for domestic operations. DFW is particularly pleased with the progress on this issue because of the strong support it is receiving from the incumbent airlines and the possibility that DFW will regain the rights to another gate for common or preferential use. As with the planning efforts for Terminal F, the interim gate expansion projects have been deferred as a result of the impact of September 11, 2001 events. However, DFW is continuing the planning efforts to install a common use terminal equipment system on Common Use Gates in Terminal B to maximize the utilization of such gates. 5
10 III. MARKETING INITIATIVES DFW has some of the most diverse air service options and choices available to travelers anywhere. The Airport features two hubbing airlines, six new entrant/low cost airlines and nearly two dozen other airlines offering both network and/or point-to-point service. DFW's ability to construct facilities and foster a positive airport environment is critical to promoting local competition for the local Dallas/Fort Worth air service market, but it is also important as a major connecting hub for two network airlines. New services at DFW have the potential to not only benefit the local market, but to also provide enhanced network competition between two spoke markets that previously did not have a connection option at DFW. Thus, DFW strives to fulfill the dual objectives of promoting competition through new entry, but also encourages incumbent airlines to provide additional services to new markets. A. Inauguration of New Airline Service Airlines celebrating new service at DFW include American Eagle, Air France, Sabena, Delta Connection carriers, Singapore Airlines and Korean Air. DFW has developed and expanded numerous marketing programs during the Reporting Period. More than 30 business case presentations were made to airlines, including low-fare domestic airlines, national and international airlines. Over 22 domestic and 36 international airline markets have been targeted for FY2002. B. Expansion of the Carrier Support Program DFW has implemented a marketing policy known as the Carrier Support Program (CSP) that focuses on ensuring the success of new airline service as well as attracting new air service to DFW. The CSP allows the Airport to provide specified incentives for new service in the form of cooperative funds aimed at promoting the new service. Since the program's inception in 1999, multiple airlines, both international and domestic, have been eligible for CSP funds. Initially, the CSP requirements provided that only new daily scheduled service was eligible for CSP funds. During the Reporting Period, DFW enhanced the CSP to include airlines with three times weekly non-stop international service. C. New Marketing Programs In addition to air service marketing, DFW has also expanded many other marketing programs including an award winning print advertising campaign and multi-media enhanced materials. New multi-lingual 6
11 passenger and cargo marketing videos were produced as well as the creation of DFW s first ever Air Shipper guide, promoting air cargo through DFW maps data and freight forwarder listings. DFW has also made great progress in promoting and enhancing the official DFW web site, dfwairport.com. DFW launched a new corporate identity in September This new identity, including a new DFW brand, has been incorporated into the web site and reinforces DFW s customer focused attitude. Utilizing over 8 different advertising venues to support the campaign, visitors to dfwairport.com have increased dramatically. Another tremendously successful addition to the web site includes the Track-A-Flight option, which provides real-time flight information to users and the ability to have flight status updates ed to the user s computer, cell phone, pager and personal digital assistant (PDA). In addition to these enhancements, DFW has also added key financial and operational information to the web site, giving customers and airlines the tool for tracking airport data in a timely manner. Since the events of September, this information has been especially beneficial to the airlines. Future enhancements planned for the web-page will give DFW the opportunity to provide valuable information to its current and future airline tenants. Airlines interested in serving the DFW market can benefit from quick access to DFW s published rates schedules, policies and important point of contact information. The evolution of DFW s web page continues to prove a valuable tool for both present and future customers and airlines. CONCLUSION Despite a reduction in demand from the tragic events of September 11, 2001, DFW's sustained growth of international and low-fare airlines and representation by almost all national airlines as well as two hub airlines demonstrates DFW's continued commitment to support a competitive environment. Additional competition enhancements undertaken by the Airport during the Reporting Period are described in Part II, the FY2001 Competition Plan Update. The Airport remains committed to providing the facilities, policies and operational plans to support the needs of all airlines in our unique, competitive environment. 7
12 PART TWO FY2002 COMPETITION PLAN UPDATE FOR REPORTING PERIOD October 1, 2000 through September 30, BACKGROUND 1.01 Plan Update Status DFW is submitting this Plan Update pursuant to Section 155 of Publication L of AIR-21. This part of the Plan Update provides financial and operational information, addresses the specific issues outlined in the Letter-of- Approval from the FAA for the DFW Plan and identifies new processes and policies being implemented by DFW to ensure continued open and competitive access for all airlines. In order to facilitate the review of the updated information, the Section titles used in the DFW Plan are used in this part of the Plan Update. However, to more accurately describe current data and to accommodate the additional information, individual numbered Paragraphs within a Section have changed and consolidated. Data contained in the DFW Plan that has not changed during the Reporting Period is not included in this Plan Update. The financial and operational data contained herein will reflect information for the Reporting Period or most recent complete calendar year, Calendar Year The catastrophic events of September 11, 2001 had a profound impact on the Airport and the results of those events will be presented in the future DFW Fiscal Year 2002 Competition Plan Update DFW's Performance During the Reporting Period, DFW continued to demonstrate growth in air service, both in choices of airlines and in travel destinations with nearly 2,300 daily flights serving 132 domestic and 31 international destinations. As demonstrated in Exhibit 1.1, DFW passengers exceeded 60 million, ranking DFW as the fifth largest among the top U.S. airports in passenger activity. 8
13 Passenger activity, as reported monthly to DFW during the Reporting Period, is shown in Exhibit 1.2. Exhibit Airport Passenger Ranking DFW Passenger Ranking for 2000 (In millions) ATL ORD LAX LHR DFW HND FRA CDG SFO AMS DEN LAS SEL MSP PHX DTW IAH EWR MIA JFK MAD HKG LGW MCO STL Source: 2000 ACI Exhibit 1.2 DFW Monthly Passenger Comparisons Total Passengers (In Millions) Oct Nov Dec Jan Feb Mar Apr May Jun Jul Aug Sep FY FY Source: DFW Monthly Flight Activity Report DFW aircraft operations were in excess of 838,000, ranking DFW as the third highest among the top U.S. airports in terms of total operations as illustrated in Exhibit 1.3. Operations data, as reported monthly to DFW during the Reporting Period, is shown in Exhibit
14 DFW Operations Ranking for 2000 (In millions) ATL ORD DFW PHX LAX DTW MSP CDG MIA LAS DEN CVG PHL IAH STL BOS LHR FRA IAD SEA CLT EWR OAK PIT AMS Exhibit Airport Operations Ranking Source: 2000 ACI Exhibit 1.4 DFW Monthly Operations Comparison Total Operations (In Thousands) Oct Nov Dec Jan Feb Mar Apr May Jun Jul Aug Sep FY FY Source: DFW Monthly Flight Activity Report DFW recognizes that new service, whether through new entrant airlines or additional service to new markets by incumbent airlines, not only enhances network competition but also benefits the local market. DFW s commitment to provide both the necessary facilities and a positive airport environment for the airlines has contributed to strong growth in the local DFW air service market. Over the past five years, DFW has added over 3 million new O&D passengers, resulting in a compounded annual growth rate of 4.1% as shown in Exhibit
15 Exhiibit 1.5 DFW 5-Year Passenger History DFW O & D Passenger History (In m illio n s) CAGR = 4.1% Source: U.S. DOT, DB1A database; domestic + int l DFW s commitment to promoting local competition is further demonstrated by Exhibit 1.6, which identifies DFW as seventh among the top U.S. airport in Local Market Revenue generation with over 5.7 billion in Local Market Revenue. Exhibit Local Market Revenue Ranking DFW Local Market Revenue Generated Ranking 2000 $14.00 $12.00 In B illions $10.00 $8.00 $6.00 $5.70 $4.00 $2.00 $0.00 LAX SFO JFK ORD EWR BOS DFW ATL MAI LGA DEN SEA IAD LAS MCO IAH DTW PHL MSP PHX HNL SAN DCA BWI TPA Source: U.S. DOT, DB1A database; adjusted for foreign flags; domestic + int l In addition to the history of growth in O & D passengers at DFW, the introduction of new service has the potential to provide enhanced network competition. In addition to being one of only two airports in the world with two major airlines operating hubs at its facilities, DFW provides a competitive environment for six new entrant/low cost airlines and nearly two dozen other airlines offering both network and/or point to point service. Thirty-two airlines are now Signatory Airlines to the DFW Use Agreement. 11
16 DFW has a dual objective to promote competition through 1) new entrant airlines and 2) the expansion of service from incumbent airlines. The direct marketing efforts of DFW continue to impact the airline market share distribution at DFW, both in domestic and international airline market shares. Exhibit 1.7 and 1.8 illustrate the change in domestic and international airline market shares over the past five-year period. Exhibit 1.7 DFW Domestic Airline Market Share Comparison DFW Domestic Airline Market Share DFW Domestic Airline Market Share - FY2001 DL/ASA 20% Northwest 2% United 2% Continental 2% US Airways 1% DL/ASA 18.9% Northwest 1.7% United 2.5% Continental 2.3% US Airways 1.3% AA/Am Eagle 69% TWA 1% AA/Am Eagle 67.1% TWA 1.5% Other 2% America West 1% Other 4.7% Source: DFW Monthly Flight Activity Report Total Passenger (Local & Connect) Exhibit 1.8 DFW International Airline Market Share Comparison DFW International Airline Market Share DFW International Airline Market Share - FY2001 AA/Am Eagle 87.3% British Air 3.6% Lufthansa 2.8% AeroMexico 2.4% Allegro 2.3% Korean 0.8% Aspen Air 0.5% Other 0.3% AA/Am Eagle 78.2% British Air 3.0% Other 5.9% Lufthansa 2.7% Sabena 2.6% AeroMexico 2.2% Air Canada 2.1% Air France 2.1% Grupo Taca 0.9% Japan Airlines 0.3% Source: DFW Monthly Flight Activity Report Total Passenger (Local & Connect) DFW continues to demonstrate its ability to maintain a positive and competitive environment for all airlines. This fact is further demonstrated by comparing hubbing airlines market share percentages. DFW s largest hubbing airline s market shares remain one of the lowest in comparison to the other hub airports. Gate concentration percentages as well as the percentage of available airline seats for DFW s largest hubbing airline are well below those of other airport hubs, as illustrated in Exhibits 1.9 and Exhibit
17 Exhibit 1.9 Hubbing Airline Market Share Comparisons by Gate DFW Airline Market Shares vs. Other Hubs % Gates Controlled 100% 90% 80% 70% 60% 50% 40% 30% 20% 10% 0% 90% 84% 68% 66% 66% 65% 65% 62% 62% 61% NW-MEM DL-CVG UA-IAD US-CLT US-PIT DL-SLC UA-DEN CO-IAH DL-ATL AA-DFW Source: Salomon Smith Barney, April 2001 Hub Fact Book Exhibit 1.10 Hubbing Airline Market Share Comparisons by Seat DFW Airline Market Shares vs. Other Hubs % Seats 100% 90% 80% 70% 60% 50% 40% 30% 20% 10% 0% 92% 90% 86% 80% 77% 76% 74% 71% 68% 58% DL-CVG US-CLT US-PIT CO-IAH NW-MEM DL-ATL DL-SLC UA-DEN AA-DFW UA-IAD Source: Salomon Smith Barney, April 2001 Hub Fact Book 13
18 1.03 Air Service Status During the Reporting Period, DFW provided service to 174 markets throughout the world with nonstop or true-direct service, including 137 domestic markets and 37 international markets. Out of the total 174 markets served, 152 markets enjoy non-stop service, including 122 domestic and 30 international markets. Domestic Markets DFW s domestic service is high compared to other U.S. airports. DFW currently ranks fourth in terms of nonstop and true-direct domestic destinations offered as shown in Exhibit Exhibit 1.11 Domestic Destination Comparison Nonstop & True-Direct ATL ORD MSP DFW DEN STL DTW CVG PIT IAH PHX CLT Source: OAG, Oct The top 12 domestic airports average 18 different airline choices to their domestic destinations. DFW, on the other hand, offers 23 domestic airline choices, more options than any other U.S. airport as shown in Exhibit Exhibit 1.12 Domestic Market Carrier Comparison Nonstop & True-Direct DFW ORD ATL STL PHX PIT DTW MSP DEN CVG CLT IAH Source: OAG, Oct
19 Low Fare Markets In addition to offering the largest number of domestic airline choices, DFW has successfully pursued new low-fare service by new entrant airlines. Due to this diligent pursuit, DFW remains one of the top airports in providing more lowfare carrier options as illustrated in Exhibit Exhibit 1.13 Low Fare Carrier Comparison Total Low-Fare Carriers LAX DFW LAS MCO MDW LGA SFO BOS MSP PHX SEA ABQ ATL DEN DTW EWR IAD MCI MSY ORD PHL SAN TPA BWI HOU IAH IND JFK MIA OAK PDX PIT SLC STL CLE CVG HNL MEM SNA Source: Official Airline Guide, Oct During the Reporting Period, services from DFW by AirTran, ATA, Frontier, National, Sun Country and Vanguard provided more than 1.5 million passengers, as shown in Exhibit 1.14, with connections to more than 60 domestic and international destinations, as illustrated in Exhibit Exhibit 1.14 DFW Low-Fare Domestic Airline Passengers D om estic Air Service (In Thousands) In Thousands ATA Air Tran Frontier Vanguard National Sun Country Source: DFW Airport Statistics 15
20 Exhibit 1.15 DFW Extensive Low-Fare Network SEA PDX MSP SFO SLC DEN MCI MKE ORD MDW DTW TOL DAY CAK PIT BUF PHL IAD DCA PHF LGA EWR BOS LAS ABQ GSO RDU LAX SAN PHX DFW ATL SAV MYR GPT VPS JAX AirTran ATA Frontier National Sun Country Vanguard SJD PVR ZIH CZM CUN MCO TPA RSW FLL MIA International Markets Internationally, DFW ranks eighth in terms of nonstop destinations, with 30 out of 31 international markets serving DFW with nonstop service. (See Exhibit 1.17). During the Reporting Period, DFW has attracted nonstop service to the following new international markets: Brussels, Zurich, and Belize City. Additionally, service to Seoul has been upgraded from true-direct to nonstop. Exhibit 1.17 International Destination Comparison - Nonstop JFK MIA LAX EWR IAH ATL ORD DFW SFO BOS IAD PHL 16
21 Source: OAG, Oct Similarly, DFW ranks tenth among top international airports in terms of international airline choices. DFW has experienced tremendous growth in international airlines over the past five years. While on average the top U.S. airports increased their number of international market airlines by 1.0%, DFW increased its number of international market airlines by 140%, more than all top U.S. international airports. (See Exhibit 1.18) Realizing the regional economic benefits derived from international service, DFW places a priority on recruitment of both national and foreign flag airlines for international service. Exhibit 1.18 Growth in International Market Airlines, Oct vs. Oct % 120% 100% 80% 60% 40% 20% 0% -20% 140% 133% 42% 18% 8% 5% 5% 4% 4% 0% -8% -19% DFW PHL IAD IAH ORD BOS SFO LAX EWR ATL JFK MIA Source: OAG, Oct vs. Oct With this tremendous growth in international market airlines, DFW has experienced a similar and steady growth in international passengers and in foreign flag operations. Over the past five years, DFW has enjoyed a compounded annual growth rate of 10.9% in international passengers and 26.2% in foreign flag traffic, as demonstrated in Exhibits 1.19 and 1.20, respectively. Exhibit 1.19 DFW 5-Year International Passenger History DFW International Passenger History 6.00 In Millions CAGR 10.9% Source: DFW Monthly Flight Activity Report 17
22 Exhibit DFW 5-Year Foreign Flag Traffic History 336 DFW Foreign Flag Traffic (In thousands) CAGR = 26.2% In Thousands Source: DFW Monthly Flight Activity Report-Local + Connect Traffic As a result, DFW supports an international network of 31 international destinations, which are identified in Exhibit Thirty of these international destinations have nonstop service from DFW. Exhibit 1.21 DFW International Network YVR YYC YYZ YUL LGW BRU FRA CDG ZRH SEL KIX NRT DFW SLW MTY SJD PVR GDL BJX AGU CUN ZIH ACA MEX CZM BZE GUA SJO CCS LIM GRU YUL SCL LGWBRU FRA CDG ZRH CUN CZM BZE GUA SJO CCS 18 LIM GRU
23 2.0 DFW's FINANCIAL STRUCTURE 2.01 DFW Use Agreement The DFW Use Agreement is residual in nature. Airport revenues in any fiscal year that exceed the Airport's debt service, coverage, and operation and maintenance costs are returned to the airlines who are signatories to the Use Agreement (Signatory Airlines), pro rata. Fiscal year-end revenue shortfalls are billed to, and paid by, the Signatory Airlines on the same basis. Although different airlines have become Signatory Airlines at different times, all Airport Use Agreements expire December 31, There are 32 Signatory Airlines operating at DFW with three (3) airlines obtaining Signatory Airline status during the Reporting Period. The new Signatory Airlines are Air France, Sabena and Champion Air. There have been no amendments to the DFW Use Agreement during the Reporting Period. However, see Section 3.0, Paragraph 3.03 for a description of new terminal lease agreements Majority-in-Interest (MII) DFW Airport continues to work closely with the Signatory Airlines to ensure that the MII process does not delay or prevent needed capital projects at the Airport. To date, DFW Airport has had a successful track record in this regard. Exhibit 2.2 details the MII votes taken during the Reporting Period. Exhibit DFW MII Voting Activity Action Item Negative Votes Final Results Request to increase Capital Development Program Budget by $345,767,824 Request approval for $37M Bond Sale Proposal for Renewal & Rehabilitation/ Major Works Reimbursement Agreement to fund improvements for accommodating Air France US Airways No Continental No, except for airfield projects None None MII Approval MII Approval MII Approval 19
24 Previously, DFW received a letter from the Signatory Airlines indicating support for terminal expansion and improvements needed to accommodate new entrants. During the Reporting Period, DFW Airport has been working diligently to finalize the scope of projects and obtain an estimated project budget so that a formal MII vote can be requested. This advance communication process expedites the formal MII approval process. To date, there have been no instances where an MII vote delayed, restricted or prevent construction of capacity related infrastructure improvements to accommodate competition at DFW Airport. To the contrary, during the Reporting Period, MII approval was received for the funding of a portion of the cost of improvements in Terminal E that were necessary to accommodate new service from Air France. In particular, there have been no instances where MII approval has been withheld for terminal projects that are eligible for PFC funding Airport Cost Structure DFW continues to have one of the lowest Net Cost per Enplaned Passenger for a major hub airport. The current Capital Development Program and Expanded Customer Service initiatives, together with the decrease in passengers are expected to increase the record low Net Cost per Enplaned Passenger of $2.08 from FY1999. Exhibit 2.1 illustrates the projected impact on the Net Cost per Enplaned Passenger as a result of these initiatives. As illustrated, the Net Cost per Enplaned Passenger of $3.14 for the Reporting Period remains well below the current $5.43 average for comparable hubs. Despite the projected increase in the Net Cost per Enplaned Passenger for DFW, as other hubs also experience sizable increases to their Net Cost per Enplaned Passenger, DFW will remain very competitive. Exhibit 2.1 Forecasted Future Net Cost per Enplaned Passenger Im pact of CDP Net Cost per Enplanem ent Historical Forecast $10 $9 $8 $7 $6 $5 $4 $3 $2 $1 $0 $3.44 $ $ $ $ A c t u a l Forecast C urrent A verage for C om parable H ubs Source: Actual DFW Airport Finance - Settlem ent Rate. F o re c a s t - B o o z -A lle n & H a m ilto n In c. 20
25 The following financial information details the primary revenue and expense sources contributing to the Net Cost per Enplaned Passenger for the Reporting Period. Regarding revenues, approximately thirty percent (30%) of total annual revenues for the Reporting Period were received from Signatory Airlines in the form of landing fees or terminal rents, which are defined in the DFW Use Agreement and detailed in Exhibit 2.2. Signatory Revenues averaged approximately $7 million per month for an estimated total of $83.5 million, which was 3.45% below the forecasted total of $86.4 million. Exhibit 2.2 DFW Signatory Revenue Comparison Signatory Revenues - FY01 (In Millions) Forecast Actual $8 $7 $6 $5 $4 $3 $2 $1 $0 Oct Nov Dec Jan Feb Mar Apr May Jun Jul Aug Sep Signatory Payments Forecast Actual Variance % Landing Fees $ 83,355 $ 82,016 $ (1,339) -1.61% Terminal Rentals -Signatory 3,106 1,462 (1,644) % Total Signatory Revenues $ 86,460 $ 83,478 $ (2,983) -3.45% Source: FY01 Settlement (unaudited) 21
26 The remaining seventy (70%) percent of revenues, defined as Other Revenues can be accounted for by Non-Signatory airlines, concessionaires and other nonaviation funding sources. Other Revenues for the Reporting Period averaged approximately $16.7 million per month for an estimated total of $200 million. Compared to the forecast of $202 million, this was a decrease of just slightly more than 1%, as illustrated in Exhibit 2.3. Other Revenues are DFW s largest funding source and are utilized to help reduce the landing fee costs. In addition, as DFW begins to capitalize on real estate opportunities made available through the use of its Commercial Development Land Use Plan, these non-aviation funding sources will continue to grow. Exhibit 2.3 Non-Signatory Revenue Comparison Other Revenues - FY01 (Millions) Forecast Actual $20 $15 $10 $5 $0 Oct Nov Dec Jan Feb Mar Apr May Jun Jul Aug Sep Forecast Actual Variance % Non-Signatory Payments Terminal rentals - non signatory $ 6,601 $ 6,781 $ % Landing Fees - non signatory 3,499 3, % Terminal concessions 28,984 29, % Parking / ground transportation 81,025 76,121 (4,904) -6.05% Ground rental/concessions/rac 38,976 40,260 1, % Other revenues 43,374 43, % Non-Signatory Revenues $ 202,458 $ 200,202 $ (2,256) -1.11% Source: FY01 Settlement (unaudited) 22
27 Operating and Maintenance expenses for the Reporting Period averaged approximately $14.3 million per month for an estimated total of $171 million. This was approximately 3% below the forecasted total of $177 million, as illustrated in Exhibit 2.4. Exhibit 2.4 Operating and Maintenance Expense Comparison O&M Expenses - FY01 In Millions Forecast Actual $30 $25 $20 $15 $10 $5 $0 Oct Nov Dec Jan Feb Mar Apr May Jun Jul Aug Sep Forecast Actual Variance % Salaries, wages, benefits $ 101,213 $ 100,678 $ (535) -0.53% Contract services 38,772 36,305 (2,467) -6.36% Maintenance & other supplies 10,677 11, % Insurance 2,528 2,351 (177) -7.02% Utilities 12,499 14,595 2, % General, administrative & other 11,231 6,269 (4,962) % Total Expenses $ 176,920 $ 171,495 $ (5,425) -3.07% Source: FY01 Settlement (unaudited) 23
28 Annual debt service obligations are offset with interest earned on monthly payments received from Signatory Airlines. Total debt service obligations averaged approximately $11 million per month until the last quarter of the Reporting Period. The sudden drop during this quarter reflects an adjustment made at year end when outstanding capitalized interest was used to pay the annual debt service. (See Exhibit 2.5). Exhibit 2.5 Net Debt Service - FY01 (In Millions) Forecast Actual $12 $10 $8 $6 $4 $2 $0 Oct Nov Dec Jan Feb Mar Apr May Jun Jul Aug Sep Forecast Actual Variance % Debt Service $ 134,566 $ 134,604 $ % Interest earned (22,569) (22,420) % Net Debt Service $ 111,998 $ 112,184 $ % Source: FY01 Settlement (unaudited) 24
29 In summary, total DFW revenues from Signatory and Other Revenues, along with operating and maintenance expenses and debt service has resulted in an estimated Net Cost per Enplaned Passenger of $3.14 for the Reporting Period, as shown in Exhibit 2.6. This is just slightly more than the forecasted Net Cost per Enplaned Passenger of $2.96 and is still well below the $5.43 average Net Cost per Enplaned Passenger at comparable hub airports as shown earlier in Exhibit 2.1. Exhibit 2.6 Net Debt Service Comparison Fiscal Year 2001 Financial Summary ($000's) Forecast Actual Variance Signatory Revenues $ 86,460 $ 83,478 $ (2,982) Non-Signatory Revenues 202, ,201 (2,257) Total Revenues $ 288,918 $ 283,679 $ (5,239) O&M Expenses $ 176,920 $ 171,495 $ (5,425) Nebt Debt Service 111, , Total Expenses $ 288,918 $ 283,679 $ (5,239) Excess Revenues over Expenses $ - $ - $ - Landing Fee Rate $ 1.82 $ 1.84 $ 0.02 Net Cost Per Enplanement $ 2.96 $ 3.18 $ 0.22 Source: FY01 Settlement (unaudited) 2.04 Past Use of PFC Funds In the Reporting Period, DFW has submitted one PFC application known as PFC No. 6, and includes the imposition and expenditure of PFC funds for the following proposed elements: Terminal D Terminal D Roadways Terminal D Apron Paving Airport-wide Fueling System Upgrade Wetlands Mitigation ARFF Station No. 5 Surface Movement Guidance Control System Solid Waste Container Area 5W Deicing GSE Facility The inclusion of this last application resulted in total collection authority for DFW's PFC Program of $4,381,498,989. At the close of the Reporting Period, a total of $519,988,063 had been collected. 25
30 3.0 TERMINAL FACILITIES USE AND OCCUPANCY 3.01 Number and Allocation of Gates Exhibit 3.1 below illustrates the Gate and Aircraft Parking Position distribution for the Reporting Period. Exhibit 3.2 identifies airline operations from specific Airport terminals as of September 30, Exhibit 3.1 Current DFW Airport Aircraft Parking Position Distribution Terminal /Concourse Exclusive Terminal Tenants Numbered Gates Bridge Served Positions Non-Bridge Served Positions Terminal A American Airlines Terminal A-Satellite American Airlines (Temporary ) Terminal B American (TWA) DFW Airport Board Continental United Airlines US Airways Term B Sub-total Terminal C American Airlines Terminal E Air Trans Northwest Delta Term E Sub-total Terminal E Satellite Delta Total The graph exhibits current exclusive gate distribution (identified as numbered gates), and aircraft parking positions associated with them. Bridge served positions are defined as those gates which utilize a jetbridge, whereas Non-Bridge served positions are those which have ramp access only. The American Satellite is defined as a bridge served position because passengers utilize a "tunnelized" platform, and there is no ramp access. Aircraft parking positions were recalculated in fiscal year 2001 to account for increased utilization by wide body aircraft. DFW Board identifies five exclusive gates, these gates are traditionally for narrow body aircraft and can be converted to only three wide-body positions. * This graph is intended to account for those aircraft parking positions utilized by airlines during the Reporting Period and does not account for additional permanent aircraft parking positions that are available at the Airport. 26

31 Exhibit 3.2 Airport Terminals TERMINAL A TEMP. SATELLITE TERMINAL B Carriers America West American Airlines American Trans Air British Airways Champion Air Continental Charter Airlines Frontier Japan Airlines Korean Air Lufthansa Mesa Midwest Express National Airlines Sun Country TWA United Airlines US Airways Carrier American Eagle TERMINAL A Carriers American Airlines American Eagles Grupo TACA Sabena TERMINAL C Carrier American Airlines TERMINAL D UNDER CONSTRUCTION FUTURE TERMINAL F TERMINAL E Carriers Air France AeroMexico AirTran Airways Atlantic Southeast Big Sky Comair Delta Northwest Vanguard TERMINAL E. SATELLITE Carriers Atlantic Southeast Big Sky Air Canada Comair Delta Laker Air 27
32 3.02 Gate Utilization Rates and Monitoring During the Reporting Period, DFW implemented formal Gate Monitoring and Reporting Procedures, attached as Appendix "A". The Gate Monitoring and Reporting Procedures utilize two sources of data, the Flight Information Display System (FIDS) and DFW's Airline Flight Activity Reports. These two sources provide the highest level of necessary gate utilization data including date, terminal airline, and flight number and gate assignment. Combined, this data is used to summarize daily gate utilization activity by gate and terminal in a monthly Gate Activity Report Summary. A copy of the August 2001 Gate Activity Report Summary is attached as Appendix "B". These monthly reports are compared with the average number of turns per gate for DFW. Any significant variances from DFW gate utilization averages are research by the Airport's Terminal Management department. Appendix C outlines the average number of turns per gate for the Reporting Period. Overall, the airlines serving DFW demonstrated a very efficient utilization of existing gates. In support of the gate monitoring process, DFW has established a Gate Monitoring Task Force responsible for reviewing the monthly Gate Activity Reports and notifying the Airport's Real Estate department regarding any significant variances or changes in gate use patterns that could potentially provide opportunities for additional utilization. The DFW Gate Monitoring Task Force is represented by a staff member from the Airport's Planning, Real Estate, Information and Technology Service and Terminal Management departments. In addition, DFW has created Terminal Coordinator positions for each of the four terminals at the Airport. Terminal Coordinators play an integral part in the gate monitoring process by randomly verifying the accuracy of the flight activity data with on-site monitoring. Since the inception of the Gate Monitoring and Reporting Procedures, no significant variances have been identified. While still in the early stages of implementation, the Gate Utilization Monitoring Procedures will be a valuable tool for monitoring utilization of all gates at the Airport, to support the enforcement of PFC Program Assurance No. 7 if necessary, and to identify opportunities for the accommodation of new entrant or expanding airlines Common Use Gates The Common Use Gates controlled and managed by DFW have international and domestic operation ability and are utilized primarily by international and domestic scheduled and charter airlines who do not lease gates at the Airport. Signatory Airlines also use Common Use Gates for increases to existing schedules that exceed their current Exclusive Use Gate capacity. In addition, transient and unscheduled airline flights are also accommodated. Exhibit 3.3 provides a list of the airlines currently operating from Common Use Gates, while 28
33 Exhibit 3.4 demonstrates the unscheduled operations accommodated on Common Use Gates during the Reporting Period. Exhibit 3.3 DFW Common Use Gate Users Airlines Utilizing Common Gates ATA Lufthansa British Airways National Champion Sun Country Korean Air United Japan Airlines Exhibit 3.4 Unscheduled Common Use Gate Utilization Airline Total Number of Turns for 12-Month Period Air Ground Support Systems 6 Bahamasair Holdings 1 Base Ops World Fuel 1 Lineas Aereas Allegro 6 Miami Air 43 Omni Air 62 Ryan Air 1 Southwest Airlines 1 Spirit Airlines 23 Star Air 28 Sun World International 1 Southeast Airlines 1 Sport Jet 2 Sky Service 1 Sky King 4 Springdale Air 5 Sport Hawk 10 Total
34 In recognition of the high demand for Common Use Gates at peak operating times by various types of airline service providers, and in support of the desire to accommodate as many types of airline services as possible, the DFW Board adopted a formal Common Use Gate Policy. This Policy formalizes the priority of accommodation in the event of schedule conflicts between proposed new airline services. With the adoption of this formal Policy, a written description of gate use priorities will be available to all existing airlines at DFW as well as potential new entrants. A copy of this Policy is attached as Appendix "D". The Policy applies only to airlines seeking to use jet bridge positions at Common Use Gates. Under the circumstance where facilities are limited at a certain operating time, the Policy determines priority among competing air services. The priority system developed and adopted by the Airport is as follows: 1) International Widebody Service; 2) International Narrowbody Service; 3) New Entrant Airline Introducing Scheduled Domestic Service; 4) Current Incumbent Airline Introducing New or Expanded Domestic Service; and, 5) Charter, Itinerant and Other Non-scheduled Services. The Policy was effective on September 6, All operations at the time of the Policy were grandfathered. The highest priority is given to the introduction of new international air services in recognition of the economic impact a single new international flight can have on the North Texas Region. In addition, the Policy places new entrants introducing new domestic service at a higher priority level than incumbent airlines proposing new or expanded domestic service in an attempt to ensure that that new, low-cost/fare airlines can enter the DFW market. New entrants retain their priority status for the first twelve (12) months of operation at DFW. This extended priority status permits new entrants to test the market with a limited schedule. If demand supports additional services, then the new entrant can expand its schedule within that first year with the same priority under which it introduced service. The Policy only takes effect if proposed future operating schedules of two airlines are in conflict and cannot be reconciled through the use of a different gate or operating arrangement. Naturally, DFW will strive to accommodate all airlines at their proposed times and try to limit the number of situations in which the application of this new Policy is needed. 30
35 3.04 Gate Use and Availability As reported in the DFW Plan, DFW is committed to complying with all applicable provisions of federal laws and regulations including the use of PFC revenues. Of course, this commitment extends to PFC funded terminal facilities at the Airport. Since the PFC legislation was passed, three separate business deals have been negotiated for PFC funded terminal facilities at the Airport. The most recent negotiation that occurred in the Reporting Period resulted in creating the first Preferential Use Gates at DFW. A description of each business transaction is provided herein to illustrate the circumstances and results in gate usage of PFCfunded terminal facilities. 1. Gates B2-B10, Short Term Exclusive Use Gates The first terminal lease for PFC funded facilities at the Airport is a lease with American for premises comprising Gates B2- B10 in Terminal B. This Lease was negotiated in 1998 and went into effect on January 1, This Lease was in effect prior to the enactment of AIR-21 and was negotiated in accordance with PFC Program Assurances Nos. 5 and 6. As a result, American occupies these gates under an Exclusive Use Gate Lease for a term of less than five years with an explicit understanding that there is no automatic carry over opportunity. DFW has clearly noted the concern of the FAA over the exclusive lease of PFC funded facilities to a dominant airline and the FAA's commitment to closely monitor the reassignment of these gates once the current lease expires. DFW will continue to provide information on the use of these gates in future Competition Plan updates. 2. Terminal D Beginning in the Spring of 1999, DFW and the Signatory Airlines developed the financing and business plan for the Airport s Capital Development Program. One of the main components of the Capital Development Program is the construction of Terminal D. The construction of Terminal D will be funded with PFC revenues and Joint Revenue Bonds. American will occupy a portion of Terminal D (approximately 17 gates) pursuant to a short-term Exclusive Use Gate Lease and other airlines will operate out of DFW Common Use Gates (approximately 9 gates). 31
Kansas City Aviation Department. Update to Airport Committee January 26, 2017
 Kansas City Aviation Department Update to Airport Committee January 26, 2017 1 Status of Customer Service Improvements Additional electric outlets in public areas Review Wi-Fi speed / coverage / study
The Airport Credit Outlook
 The Airport Credit Outlook Peter Stettler Ricondo & Associates, Inc. National Federation of Municipal Analysts National Conference April 19, 2012 Las Vegas, Nevada The Outlook for Airports Recent Trends
Kansas City Aviation Department. Update to Airport Committee October 20, 2016
 Kansas City Aviation Department Update to Airport Committee October 20, 2016 1 Status of Customer Service Improvements Additional electric outlets in public areas Wayfinding / Rental car signage Review
,~-- JOHN WAYNE AIRPORT, ORANGE COUNTY. Airline Competition Plan UPDATE. Barry A. Rondinella, A.A.E/C.A.E. Airport Director
 JOHN WAYNE AIRPORT, ORANGE COUNTY Airline Competition Plan UPDATE JOrNVAYN. AIRPOITT O R A N GE COU N TY,~-- Barry A. Rondinella, A.A.E/C.A.E. Airport Director 3160 Airway Avenue Costa Mesa, CA 92626 January
Gateway Travel Program
 TENTATIVE AGREEMENT June 27, 2002 LETTER OF AGREEMENT Between ATLAS AIR, INC. and the AIR LINE PILOTS in the service of ATLAS AIR, INC. as represented by THE AIR LINE PILOTS ASSOCIATION, INTERNATIONAL
Update to Airline Competition Plan Philadelphia International Airport
 Final Report Update to Airline Competition Plan Philadelphia International Airport Prepared for Federal Aviation Administration in compliance with requirements of AIR21 Prepared by City of Philadelphia
SEPTEMBER 2014 BOARD INFORMATION PACKAGE
 SEPTEMBER 2014 BOARD INFORMATION PACKAGE MEMORANDUM TO: Members of the Airport Authority FROM: Lew Bleiweis, Executive Director DATE: September 19, 2014 Informational Reports: A. July, 2014 Traffic Report
Aviation Gridlock: Airport Capacity Infrastructure How Do We Expand Airfields?
 Aviation Gridlock: Airport Capacity Infrastructure How Do We Expand Airfields? By John Boatright Vice President - Delta Air Lines Properties and Facilities Issue What can be done to expand airfield capacity?
Buffalo Niagara International Airport Airline Competition Plan Fiscal year 2017
 Buffalo Niagara International Airport Airline Competition Plan Fiscal year 2017 Buffalo Niagara International Airport 4200 Genesee Street Buffalo, New York 14225 Table of Contents Introduction.. 3 A. Availability
State of Hawaii, Department of Transportation, Airports Division. PATA Hawai i. September 13, 2018
 State of Hawaii, Department of Transportation, Airports Division PATA Hawai i September 13, 2018 Department of Transportation DOTA Continues Major Initiatives in 2018 Airports Division Enhance financial
TravelWise Travel wisely. Travel safely.
 TravelWise Travel wisely. Travel safely. The (CATSR), at George Mason University (GMU), conducts analysis of the performance of the air transportation system for the DOT, FAA, NASA, airlines, and aviation
ACI-NA BUSINESS TERM SURVEY APRIL 2017
 ACI-NA BUSINESS TERM SURVEY APRIL 2017 Airport/Airline Business Working Group Randy Bush Tatiana Starostina Dafang Wu Assisted by Professor Jonathan Williams, UNC Agenda Background Rates and Charges Methodology
Managing And Understand The Impact Of Of The Air Air Traffic System: United Airline s Perspective
 Managing And Understand The Impact Of Of The Air Air Traffic System: United Airline s Perspective NEXTOR NEXTOR Moving Moving Metrics: Metrics: A Performance-Oriented View View of of the the Aviation Aviation
Data Session U.S.: T-100 and O&D Survey Data. Presented by: Tom Reich
 Data Session U.S.: T-100 and O&D Survey Data Presented by: Tom Reich 1 What are Doing Here? Learn how to use T100 & O&D (DB1A/DB1B) to: Enhance your air service presentations Identify opportunities for
Supportable Capacity
 Supportable Capacity Objective Understand Network Planning and Capacity Management How the game is played How fleet impacts the playing field Why it is flawed 2 Route Economic Fundamentals Airlines compete
Dallas/Fort Worth International Airport Development Opportunities Southgate Plaza
 Dallas/Fort Worth International Airport Development Opportunities Southgate Plaza City of Dallas Economic Development Committee Briefing March 2, 2009 Business Overview Business Overview DFW s contribution
PITTSBURGH INTERNATIONAL AIRPORT ANALYSIS OF SCHEDULED AIRLINE TRAFFIC. October 2016
 ANALYSIS OF SCHEDULED AIRLINE TRAFFIC October 2016 Passenger volume Pittsburgh International Airport enplaned passengers totaled 379,979 for the month of October 2016, a 7.0% increase from the previous
ATRS Global Airport Performance Benchmarking Report, 2003
 ATRS Global Airport Performance Benchmarking Report, 2003 Tae H. Oum UBC and Air Transport Research Society www.atrsworld.org presented at NEXTOR Conference Tuesday, January 27 Friday, January 30, 2004
CANSO Workshop on Operational Performance. LATCAR, 2016 John Gulding Manager, ATO Performance Analysis Federal Aviation Administration
 CANSO Workshop on Operational Performance LATCAR, 2016 John Gulding Manager, ATO Performance Analysis Federal Aviation Administration Workshop Contents CANSO Guidance on Key Performance Indicators Software
March 4, Investor Conference
 March 4, 2014 Investor Conference Disclaimer This Investor Presentation is provided for your general information and convenience only, is current only as of its date and does not constitute an offer to
ACI-NA BUSINESS TERM SURVEY 2018 BUSINESS OF AIRPORTS CONFERENCE
 ACI-NA 2017-18 BUSINESS TERM SURVEY 2018 BUSINESS OF AIRPORTS CONFERENCE Airport/Airline Business Working Group Tatiana Starostina Dafang Wu Assisted by Professor Jonathan Williams, UNC Agenda Background
Fundamentals of Airline Markets and Demand Dr. Peter Belobaba
 Fundamentals of Airline Markets and Demand Dr. Peter Belobaba Istanbul Technical University Air Transportation Management M.Sc. Program Network, Fleet and Schedule Strategic Planning Module 10: 30 March
Air Service and Airline Economics in 2018 Growing, Competing and Reinvesting
 Air Service and Airline Economics in 2018 Growing, Competing and Reinvesting John P. Heimlich, VP & Chief Economist Presentation to the CAAFI Biennial General Meeting December 5, 2018 The ~720,000 Employees*
Amended & Restated Lease of Terminal Building Premises (Airport Use & Lease Agreement)
") Amended & Restated Lease of Terminal Building Premises (Airport Use & Lease Agreement) Briefing to the Transportation and Environment Committee Department of Aviation October 27, 2008 Purpose Review 5-Party
Amended & Restated Lease of Terminal Building Premises (Airport Use & Lease Agreement) Briefing to the Transportation and Environment Committee Department of Aviation October 27, 2008 Purpose Review 5-Party
Travel Report Volume 20, Number 2 July 2011
 Travel Report Volume 20, Number 2 July 2011 IN THIS ISSUE: Ticket Profile... 2 Average Airfares... 2 Cost per Segment... 4 Cost per Mile... 5 Negotiated Airfares... 6 Market Fare Analysis... 8 Domestic
Travel Report Volume 19, Number 4 January 2011
 Travel Report Volume 19, Number 4 January 2011 IN THIS ISSUE: Ticket Profile... 2 Average Airfares... 2 Cost per Segment... 6 Cost per Mile... 8 Negotiated Airfares... 9 Market Fare Analysis... 12 Domestic
FY 2018 Rates, Fees, and Charges Year End Reconciliation. Finance Department P.O. Box DFW Airport, Texas
 FY Rates, Fees, and Charges Year End Reconciliation Finance Department P.O. Box 619428 DFW Airport, Texas 75261-9428 Business Units Executive Summary Summary of FY Year-End Reconciliation Landing Fee Terminal
CINCINNATI/NORTHERN KENTUCKY INTERNATIONAL AIRPORT 2017 AIR SERVICE INCENTIVE PROGRAM. Revision 2 (11/20/2017)
") CINCINNATI/NORTHERN KENTUCKY INTERNATIONAL AIRPORT 2017 AIR SERVICE INCENTIVE PROGRAM Revision 2 (11/20/2017) CVG Air Service Incentive Program The Kenton County Airport Board (KCAB), operator of the Cincinnati/Northern
CINCINNATI/NORTHERN KENTUCKY INTERNATIONAL AIRPORT 2017 AIR SERVICE INCENTIVE PROGRAM Revision 2 (11/20/2017) CVG Air Service Incentive Program The Kenton County Airport Board (KCAB), operator of the Cincinnati/Northern
Description of the National Airspace System
 Description of the National Airspace System Dr. Antonio Trani and Julio Roa Department of Civil and Environmental Engineering Virginia Tech What is the National Airspace System (NAS)? A very complex system
ASIP2 AIR SERVICE INCENTIVE PROGRAM
 Albany International Airport ASIP2 AIR SERVICE INCENTIVE PROGRAM December 2011 Albany International Airport Air Service Incentive Program Introduction: The Albany County Airport Authority (ACAA), operator
Competition Plan Detroit Metropolitan Wayne County Airport
 September 28, 2000 Mr. James Opatrny Acting Airports District Manager Federal Aviation Administration Airport District Office 8820 Beck Road Belleville, MI 48111 Re: Competition Plan Detroit Metropolitan
JANUARY 2018 BOARD INFORMATION PACKAGE
 JANUARY 2018 BOARD INFORMATION PACKAGE MEMORANDUM TO: Members of the Airport Authority FROM: Lew Bleiweis, Executive Director DATE: January 19, 2018 Financial Report (document) Informational Reports: A.
The Big 4 Airline Era, New Ultra Low Cost Carriers, and Implications for Airports
 The Big 4 Airline Era, New Ultra Low Cost Carriers, and Implications for Airports Linda Perry, Director AAAE Rates and Charges Workshop November 4, 2016 Outline The Big 4 American Delta Southwest United
Airline Mergers and Consumers. Before the US DOT Advisory Committee for Aviation Consumer Protection
 Airline and Consumers Before the US DOT Advisory Committee for Aviation Consumer Protection Daniel M. Kasper October 29th, 2014 Presentation Overview 1. Key drivers of airline consolidation a) Relentless
RENO-TAHOE INTERNATIONAL AIRPORT APRIL 2008 PASSENGER STATISTICS
 Inter-Office Memo Reno-Tahoe Airport Authority Date: June 5, 2008 To: Statistics Recipients From: Tom Medland, Director Air Service Business Development Subject: RENO-TAHOE INTERNATIONAL AIRPORT PASSENGER
A Decade of Consolidation in Retrospect
 A Decade of Consolidation in Retrospect MARCH 7, 2017 CONSOLIDATION TIMELINE Airlines Announced Closed SOC US Airways- America West Delta- Northwest Frontier- Midwest United- Continental Southwest- AirTran
Travel Report Volume 19, Number 2 July 2010
 Travel Report Volume 19, Number 2 July 2010 IN THIS ISSUE: Ticket Profile... 2 Average Airfares... 2 Cost per Segment... 4 Cost per Mile... 5 Negotiated Airfares... 6 Market Fare Analysis... 8 Domestic
Trends Shaping Houston Airports
 Trends Shaping Houston Airports Ian Wadsworth Chief Commercial Officer April 2014 Our mission is to connect Houston with the world Connect the people, businesses, cultures and economies of the world to
Federal Perspectives on Public-Private Partnerships (P3) in the United States
 in the United States") Federal Perspectives on Public-Private Partnerships (P3) in the United States Prepared for: ACI-World Bank Symposium London, United Kingdom Presented by: Elliott Black Director Office of Airport Planning
Federal Perspectives on Public-Private Partnerships (P3) in the United States Prepared for: ACI-World Bank Symposium London, United Kingdom Presented by: Elliott Black Director Office of Airport Planning
JANUARY 2014 BOARD INFORMATION PACKAGE
 JANUARY 214 BOARD INFORMATION PACKAGE MEMORANDUM TO: Members of the Airport Authority FROM: Lew Bleiweis, Executive Director DATE: January 1, 214 Financial Report (document) Informational Reports: A. November,
ATRS Global Airport Benchmarking Report 2003
 ATRS Global Airport Benchmarking Report 2003 Presented to Pacific Economic Cooperation Council (PECC) Conference, 5-6 September, 2003, Singapore The Global Airport Benchmarking Task Force of Air Transport
What Does the Future Hold for Regional Aviation?
 What Does the Future Hold for Regional Aviation? FAA Aviation Forecast Conference March 10, 2010 HCH T C George W. Hamlin Hamlin Transportation Consulting Fairfax, Virginia www.georgehamlin.com Taxonomy
Air Carrier Update II Lufthansa Group
 Air Carrier Update II Lufthansa Group Daniel Pauli Manager Intercontinental Network Planning Washington D.C, Dec 7, 2017. lufthansagroup.com Who we are Lufthansa Group: Three-pillar strategy Shareholders
AUGUST 2008 MONTHLY PASSENGER AND CARGO STATISTICS
 Inter-Office Memo Reno-Tahoe Airport Authority Date: October 2, 2008 To: Statistics Recipients From: Tom Medland, Director Air Service Business Development Subject: RENO-TAHOE INTERNATIONAL AIRPORT PASSENGER
Airline Operations A Return to Previous Levels?
 Airline Operations A Return to Previous Levels? Prof. R John Hansman, Director MIT International Center for Air Transportation rjhans@mit.edu Impact of Sept on Demand Schedule Cutbacks -2% Currently about
APRIL 2016 BOARD INFORMATION PACKAGE
 APRIL 2016 BOARD INFORMATION PACKAGE MEMORANDUM TO: Members of the Airport Authority FROM: Lew Bleiweis, Executive Director DATE: April 8, 2016 Financial Report (document) Informational Reports: A. February,
World Class Airport For A World Class City
 World Class Airport For A World Class City Air Service Update April 2017 2017 Air Service Updates February 2017 Cleveland new destination, 2x weekly Raleigh-Durham new destination, 2x weekly March 2017
Airport Preliminary Master Plan Workshop Board of County Commissioners April 18, 2017
 Airport Preliminary Master Plan Workshop Board of County Commissioners April 18, 2017 (PRELIMINARY DRAFT) WORK IN PROGRESS - FOR DISCUSSION PURPOSES ONLY Agenda (PRELIMINARY DRAFT) WORK IN PROGRESS - FOR
Cleveland Hopkins International Airport Preliminary Merger Analysis
 City of Cleveland Frank G. Jackson, Mayor Operational Issues Cleveland Hopkins International Airport Preliminary Merger Analysis As of today, Continental and United have not even admitted that they are
World Class Airport For A World Class City
 World Class Airport For A World Class City Air Service Update April 2018 2018 Air Service Updates February 2018 Seattle new departure, seasonal, 2x weekly Boston new departure, seasonal, 2x weekly March
ACI-NA 2014 (FY13) Benchmarking Survey September 7, 2014
 Benchmarking Survey September 7, 2014") ACI-NA 2014 (FY13) Benchmarking Survey September 7, 2014 Contact: Economic Affairs and Research Tel: 202-293-8500 Email: EconomicAffairs@aci-na.org www.aci-na.org Who Are We? Airports Council International
ACI-NA 2014 (FY13) Benchmarking Survey September 7, 2014 Contact: Economic Affairs and Research Tel: 202-293-8500 Email: EconomicAffairs@aci-na.org www.aci-na.org Who Are We? Airports Council International
May Air Traffic Statistics. Prepared by the Office of Corporate Risk and Strategy
 May 214 Air Traffic Statistics Prepared by the Office of Corporate Risk and Strategy Commercial Total Int'l Dom Air Traffic Summary May 214 Passenger Activity (in Millions) Current Month Year-to-Date Last
JANUARY 2017 BOARD INFORMATION PACKAGE
 JANUARY 2017 BOARD INFORMATION PACKAGE MEMORANDUM TO: Members of the Airport Authority FROM: Lew Bleiweis, Executive Director DATE: January 13, 2017 Financial Report (document) Informational Reports: A.
FLL Master Plan Update Policy Advisory Committee (PAC) Briefing #2 July 10, 2017
 Briefing #2 July 10, 2017") FLL Master Plan Update Policy Advisory Committee (PAC) Briefing #2 July 10, 2017 (PRELIMINARY DRAFT) WORK IN PROGRESS - FOR DISCUSSION PURPOSES ONLY PAC Committee (PRELIMINARY DRAFT) WORK IN PROGRESS -
FLL Master Plan Update Policy Advisory Committee (PAC) Briefing #2 July 10, 2017 (PRELIMINARY DRAFT) WORK IN PROGRESS - FOR DISCUSSION PURPOSES ONLY PAC Committee (PRELIMINARY DRAFT) WORK IN PROGRESS -
2016 Air Service Updates
 Air Service Update June 2016 2016 Air Service Updates February 2016 Pittsburgh new destination, 2x weekly April 2016 Los Angeles new departure, 1x daily Atlanta new departure, 1x daily Jacksonville new
CONTACT: Investor Relations Corporate Communications
 NEWS RELEASE CONTACT: Investor Relations Corporate Communications 435.634.3200 435.634.3553 Investor.relations@skywest.com corporate.communications@skywest.com SkyWest, Inc. Announces Fourth Quarter 2017
AIRPORT EMERGENCY CONTINGENCY PLAN TEMPLATE V 3.3 April 27, 2012
 AIRPORT EMERGENCY CONTINGENCY PLAN TEMPLATE V 3.3 April 27, 2012 Section 42301 of the FAA Modernization and Reform Act of 2012 1 (the Act) requires airport operators to submit emergency contingency plans
Temporal Deviations from Flight Plans:
 Temporal Deviations from Flight Plans: New Perspectives on En Route and Terminal Airspace Professor Tom Willemain Dr. Natasha Yakovchuk Department of Decision Sciences & Engineering Systems Rensselaer
World Class Airport For A World Class City
 World Class Airport For A World Class City Air Service Update October 2017 2017 Air Service Updates February 2017 Cleveland new destination, 2x weekly Raleigh-Durham new destination, 2x weekly March 2017
Dallas Love Field General Aviation Landing Fee
 Dallas Love Field General Aviation Landing Fee Mobility Solutions, Infrastructure & Sustainability Committee October 9, 2017 Mark Duebner, Director Department of Aviation Overview Provide overview of Department
Airport Incentive Programs: Legal and Regulatory Considerations in Structuring Programs and Recent Survey Observations
 Airport Incentive Programs: Legal and Regulatory Considerations in Structuring Programs and Recent Survey Observations 2010 ACI-NA AIRPORT ECONOMICS & FINANCE CONFERENCE Monica R. Hargrove ACI-NA General
2016 Air Service Updates
 Air Service Update May 2016 2016 Air Service Updates February 2016 Pittsburgh new destination, 2x weekly April 2016 Los Angeles new departure, 1x daily Atlanta new departure, 1x daily Jacksonville new
ACI-NA 2014 (FY13) Benchmarking Survey September 7, 2014
 Benchmarking Survey September 7, 2014") ACI-NA 2014 (FY13) Benchmarking Survey September 7, 2014 Contact: Economic Affairs and Research Tel: 202-293-8500 Email: EconomicAffairs@aci-na.org www.aci-na.org Who Are We? Airports Council International
ACI-NA 2014 (FY13) Benchmarking Survey September 7, 2014 Contact: Economic Affairs and Research Tel: 202-293-8500 Email: EconomicAffairs@aci-na.org www.aci-na.org Who Are We? Airports Council International
Monthly Airport Passenger Activity Summary. December 2007
 T F Green Airport 06/23/08 Monthly Airport Passenger Activity Summary December 2007 Calendar Year Basis Year Year December December Percent to Date to Date Percent 2007 2006 Change 2007 2006 Change Enplaned
Economics of International Airline Joint Ventures. Bryan Keating Georgetown Airline Competition Conference July 17, 2017
 Economics of International Airline Joint Ventures Bryan Keating Georgetown Airline Competition Conference July 17, 2017 International Airline Joint Ventures Connect Complementary Networks No individual
Inter-Office Memo Reno-Tahoe Airport Authority
 Inter-Office Memo Reno-Tahoe Airport Authority Date: November 30, 2009 To: Statistics Recipients From: Krys T. Bart, A.A.E., President/CEO Subject: RENO-TAHOE INTERNATIONAL AIRPORT PASSENGER STATISTICS
air traffic statistics
 June 23 air traffic statistics Prepared by the Office of Finance Department of Internal Controls, Compliance and Financial Strategy Metropolitan Washington Airports Authority Air Traffic Statistics Table
EXHIBIT K TERMINAL PROJECT PROCEDURES PHASE I - DEVELOPMENT OF TERMINAL PROGRAM & ALTERNATIVES
 EXHIBIT K TERMINAL PROJECT PROCEDURES PHASE I - DEVELOPMENT OF TERMINAL PROGRAM & ALTERNATIVES Over the term of the Master Amendment to the Airline Use and Lease Agreement, the Kansas City Aviation Department
2016 Air Service Updates
 2016 Air Service Updates February 2016 Pittsburgh new destination, 2x weekly April 2016 Los Angeles new departure, 1x daily Atlanta new departure, 1x daily Jacksonville new destination, 2x weekly Philadelphia
2011 AIRPORT UPDATE. March 25, 2011
 2011 AIRPORT UPDATE March 25, 2011 1 Airports are important economic engines for the regions they serve; creating jobs, facilitating commerce and providing access to the global marketplace 2 AIRPORT HIGHLIGHTS
air traffic statistics
 December 213 air traffic statistics Prepared by the Office of Finance Department of Internal Controls, Compliance and Financial Strategy Commercial Total Dom Int'l Passengers % Change Air Traffic Summary
2nd Annual MIT Airline Industry Conference No Ordinary Time: The Airline Industry in 2003
 2nd Annual MIT Airline Industry Conference No Ordinary Time: The Airline Industry in 2003 Growth of Low Fare Carriers William Swelbar Managing Director April 8, 2003 William Swelbar Managing Director Low
SEPTEMBER 2015 BOARD INFORMATION PACKAGE
 SEPTEMBER 2015 BOARD INFORMATION PACKAGE MEMORANDUM TO: Members of the Airport Authority FROM: Lew Bleiweis, Executive Director DATE: September 11, 2015 Financial Report (document) Informational Reports:
2016 Air Service Updates
 Air Service Update September 2016 2016 Air Service Updates February 2016 Pittsburgh new destination, 2x weekly April 2016 Los Angeles new departure, 1x daily Atlanta new departure, 1x daily Jacksonville
air traffic statistics
 September 213 air traffic statistics Prepared by the Office of Finance Department of Internal Controls, Compliance and Financial Strategy Commercial Total Int'l Dom Passengers % Change Air Traffic Summary
PFC Collection Analysis
 PFC Collection Analysis 8:40 9:30am June 11, 2018 2018 BUSINESS OF AIRPORTS Airport/Airline Business Working Group Analysis of declining trend in PFC-paying passengers Background U.S. Airport Infrastructure
Airport Characteristics: Part 2 Prof. Amedeo Odoni
 Airport Characteristics: Part 2 Prof. Amedeo Odoni Istanbul Technical University Air Transportation Management M.Sc. Program Air Transportation Systems and Infrastructure Module 4 May 25, 2015 Outline
CONTACT: Investor Relations Corporate Communications
 NEWS RELEASE CONTACT: Investor Relations Corporate Communications 435.634.3200 435.634.3553 Investor.relations@skywest.com corporate.communications@skywest.com SkyWest, Inc. Announces Second Quarter 2016
Jacksonville Aviation Authority Annual Report The Power Within.
 Jacksonville Aviation Authority Annual Report 2007 The Power Within. Board of Directors & Executive Team Cyrus Jollivette Chairman 1 John D. Clark Executive Director / CEO Jim McCollum Vice-Chairman 2
JULY 2012 BOARD INFORMATION PACKAGE
 JULY 212 BOARD INFORMATION PACKAGE MEMORANDUM TO: Members of the Airport Authority FROM: Lew Bleiweis, Airport Director DATE: July 13, 212 Financial Report (document) Informational Reports: A. May, 212
World Class Airport For A World Class City
 World Class Airport For A World Class City Air Service Update December 2018 2018 Air Service Updates February 2018 Delta Air Lines Seattle new departure, seasonal, 2x weekly Delta Air Lines Boston new
air traffic statistics
 October 213 air traffic statistics Prepared by the Office of Finance Department of Internal Controls, Compliance and Financial Strategy Metropolitan Washington Airports Authority Air Traffic Statistics
Questions regarding the Incentive Program should be directed to Sara Meess at or by phone at
 Ogden-Hinckley New Entrant Incentive Program Request for Letters of Interest Amendment No. 1 The City of Ogden, Utah (the City ) is seeking Letters of Interest from air carriers not currently serving the
Japan Airlines and American Airlines Joint Business Benefits from April 1, January 11, 2011
 Japan Airlines and American Airlines Joint Business Benefits from April 1, 2011 January 11, 2011 October 25, 2010: Signing of Japan-USA Open Skies Agreement Antitrust immunity was granted to airlines operating
LCCs vs. Legacies: Converging Business Models
 LCCs vs. Legacies: Converging Business Models Halifax, Nova Scotia October 18, 2007 strategic transportation & tourism solutions Mark Haneke Vice President, Network & Strategic Planning Vancouver, BC 1
SAN FRANCISCO INTERNATIONAL AIRPORT
 SAN FRANCISCO INTERNATIONAL AIRPORT COMPARATIVE TRAFFIC REPORT December 2004 Fiscal Year-To-Date Dec 2004 Dec 2003 % Change 2004 2003 % Change Flight Operations - Total * Air Carrier Air Taxi Civil Military
2010 FAA Great Lakes Region Annual Conference State of Airport Financing November 3, Marsha Stone, CFO Indianapolis Airport Authority
 2010 FAA Great Lakes Region Annual Conference State of Airport Financing November 3, 2010 Marsha Stone, CFO Indianapolis Airport Authority Economy and Aviation Industry U.S. Aviation Traffic: Signs of
AIRPORT OPERATIONS COUNT FOR THE CALENDAR YEAR ENDED DECEMBER, 2005
 AIRPORT OPERATIONS COUNT FOR THE CALENDAR YEAR ENDED DECEMBER, 2005 ITINERANT(1) LOCAL(2) TOTAL Month-Year AC(a) AT(b) GA(c) MI(d) CI(a) MI(b) Operations (3) January-05 4,452 2,153 1,650 30 8,285 244 0
HISTORICAL OPERATING RESU LTS
 Okaloosa County, Florida Taxable Airport Revenue Bonds, Series 2007, $9,980,000, Dated: December 13, 2007 Okaloosa County, Florida, Airport Revenue Bonds, Series 2003 (AMT), $10,860,000, Dated August 15,
ADDENDUM D Concourse C Enhancement Program Overview
 ADDENDUM D Concourse C Enhancement Program Overview TECHNICAL MEMORANDUM Concourse C Enhancement Program Overview PREPARED FOR: PREPARED BY: Palm Beach County Department of Airports CH2M HILL/Ricondo &
RHODE ISLAND AIRPORT CORPORATION 07/16/08 T. F. GREEN AIRPORT
 RHODE ISLAND AIRPORT CORPORATION 7/16/8 T. F. GREEN AIRPORT JANUARY 25 TOTAL PASSENGERS UA 5% SP 7% January 2,5 Air Georgian Limited 1,6 Air Wisconsin American Airlines 2,561 American Eagle (Flagship)
Airport Incentive Programs: Federal and Other Restrictions and Recent Developments
 Airport Incentive Programs: Federal and Other Restrictions and Recent Developments G. Brian Busey Co-Chair Airports and Aviation Group ACI-NA Spring 2009 Legal Issues Conference May 13, 2009 2009 Morrison
October Air Traffic Statistics. Prepared by the Office of Corporate Risk and Strategy
 October 214 Air Traffic Statistics Prepared by the Office of Corporate Risk and Strategy Metropolitan Washington Airports Authority Air Traffic Statistics Table of Contents Summary Air Traffic Summary...
air traffic statistics
 July 23 air traffic statistics Prepared by the Office of Finance Department of Internal Controls, Compliance and Financial Strategy Air Traffic Summary July 23 Below is a summary of the July 23 Air Traffic
Naples Municipal Airport Master Plan. Joint NAA / NCC Workshop April 30, 2018
 Naples Municipal Airport Master Plan Joint NAA / NCC Workshop April 30, 2018 Airport Master Planning Process Project Initiation Stakeholder and Public Outreach Airport Mapping and AGIS Existing Conditions
OFFICE OF THE AUDITOR
 OFFICE OF THE AUDITOR DEPARTMENT OF AVIATION REVENUE AND CONTRACT COMPLIANCE AUDIT JUNE 2006 Dennis J. Gallagher Auditor Dennis J. Gallagher Auditor City and County of Denver 201 West Colfax Ave., Dept.
Megahubs United States Index 2018
 Published: Sep 2018 Megahubs United States Index 2018 The Most Connected Airports in the US 2018 OAG Aviation Worldwide Limited. All rights reserved About OAG Megahubs US Index 2018 Published alongside
fleet CALENDAR MAY 2018 JUNE 2020 THE MOST INCLUSIVE LUXURY EXPERIENCE
 fleet CALENDAR MAY 2018 JUNE 2020 THE MOST INCLUSIVE LUXURY EXPERIENCE luxury it s all included Our fleet of intimately spacious, all-suite ships are the pinnacles of elegance and grace. They are just
 Existing Conditions AIRPORT PROFILE Passenger Terminal Complex 57 air carrier gates 11,500 structured parking stalls Airfield Operations Area 9,000 North Runway 9L-27R 6,905 Crosswind Runway 13-31 5,276
SouthwestFloridaInternational Airport
 SouthwestFloridaInternational Airport SouthwestFloridaInternationalAirportislocatedinLee CountyalongtheGulfCoastofSouthFlorida,tenmiles southeastofthefortmyerscentralbusinessdistrict. Theprimaryhighwayaccesstotheairportfrom