DEMAND/CAPACITY ANALYSIS St. Petersburg-Clearwater International Airport
|
|
|
- Derrick Melton
- 6 years ago
- Views:
Transcription
1 DEMAND/CAPACITY ANALYSIS St. Petersburg-Clearwater International Airport 5.1 GENERAL OVERVIEW The next step in the Master Plan process is analyzing the capacity of existing airport facilities against forecasted demand. Demand capacity analysis is the comparison of the existing conditions of the Airport as reported in Chapter 2, to growth projections as reported in Chapter 4, from which airport requirements for runways, taxiways, aprons, terminals, and other related facilities to accommodate growth over the short-, intermediate-, and long-term, can be defined. 5.2 DESIGN CRITERIA Airport design standards, as established by the Federal Aviation Administration (FAA) were employed in this Master Plan for developing airport facilities to meet existing and forecast levels of aviation activity Airport Reference Code (ARC) According to FAA Advisory Circular (AC) 150/ , Airport Design, Change 6, the Airport Reference Code (ARC) is a coding system that coordinates airport design criteria with characteristics of the aircraft intended to operate at the airport. Two separate components comprise the ARC, aircraft approach category and airplane design group. The aircraft approach category is an operational characteristic relating to the approach speed of an aircraft. Approach categories are based on a factor of 1.3 times aircraft stall speed in landing configuration at maximum certificated landing weight. Approach categories are represented by a letter designation, as depicted below: Category A Category B Category C Category D Category E Aircraft Approach Speed Categories Speed less than 91 knots Speed 91 knots or more, but less than 121 knots Speed 121 knots or more, but less than 141 knots Speed 141 knots or more, but less than 166 knots Speed 166 knots or more 5 The Airport Reference Code (ARC) is a coding system that coordinates airport design criteria with characteristics of the aircraft intended to operate at the airport. Airplane design group is a physical characteristic defined by an aircraft s wingspan. While approach speeds only affect runway design, wingspan affects the design of taxiways, taxilanes, and aprons. The airplane design group is depicted by a Roman numeral, as described in the following table. 2/19/04 St. Petersburg-Clearwater International Airport Master Plan Update 5-1
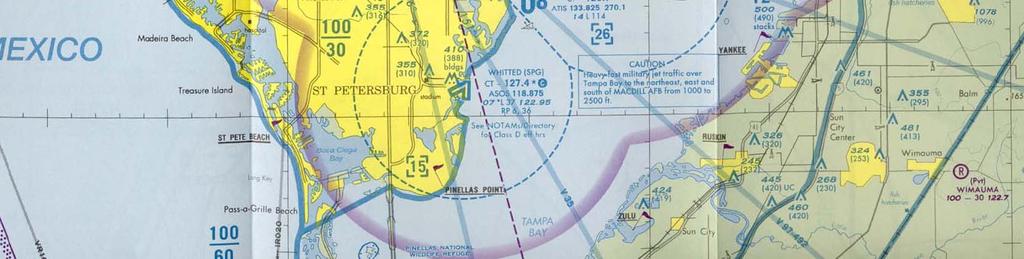
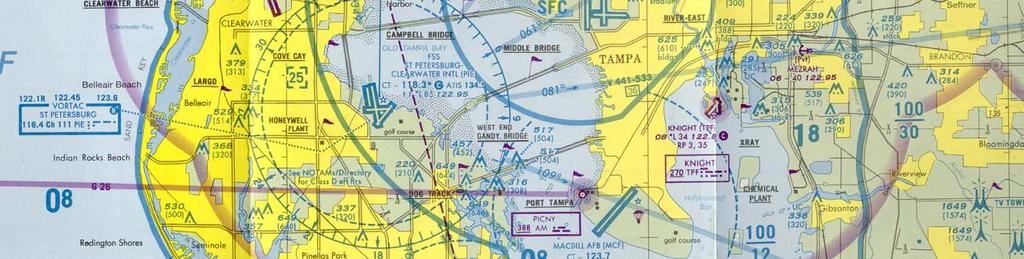
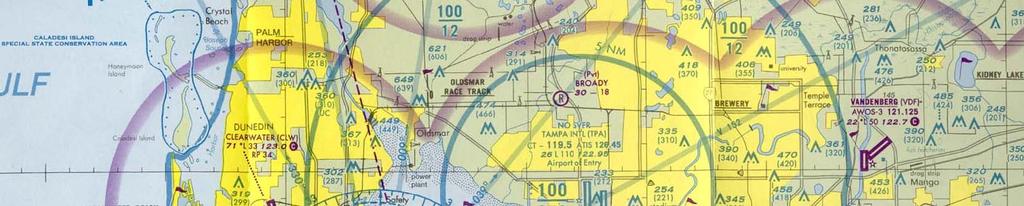
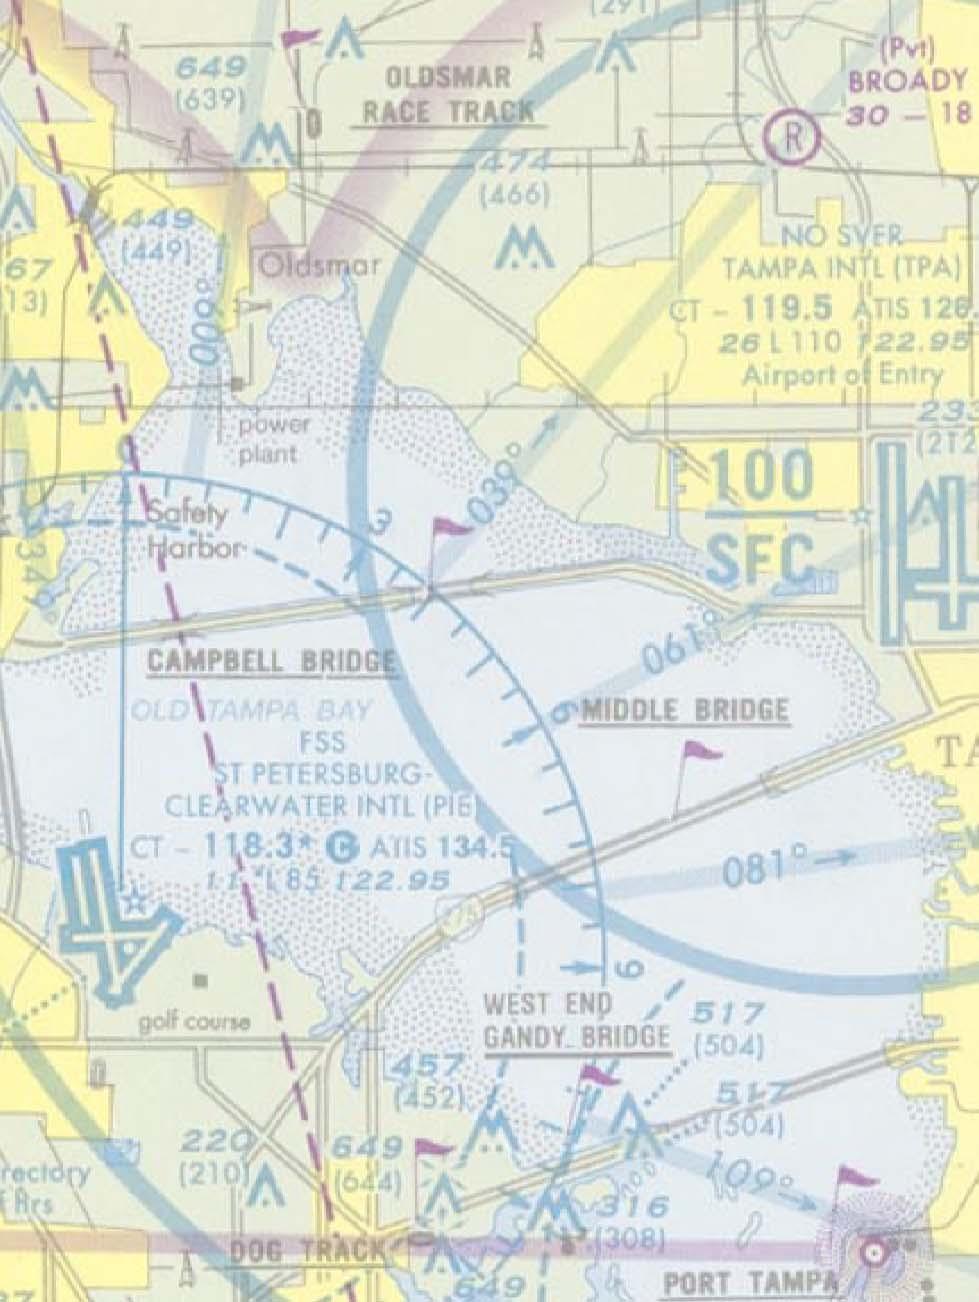
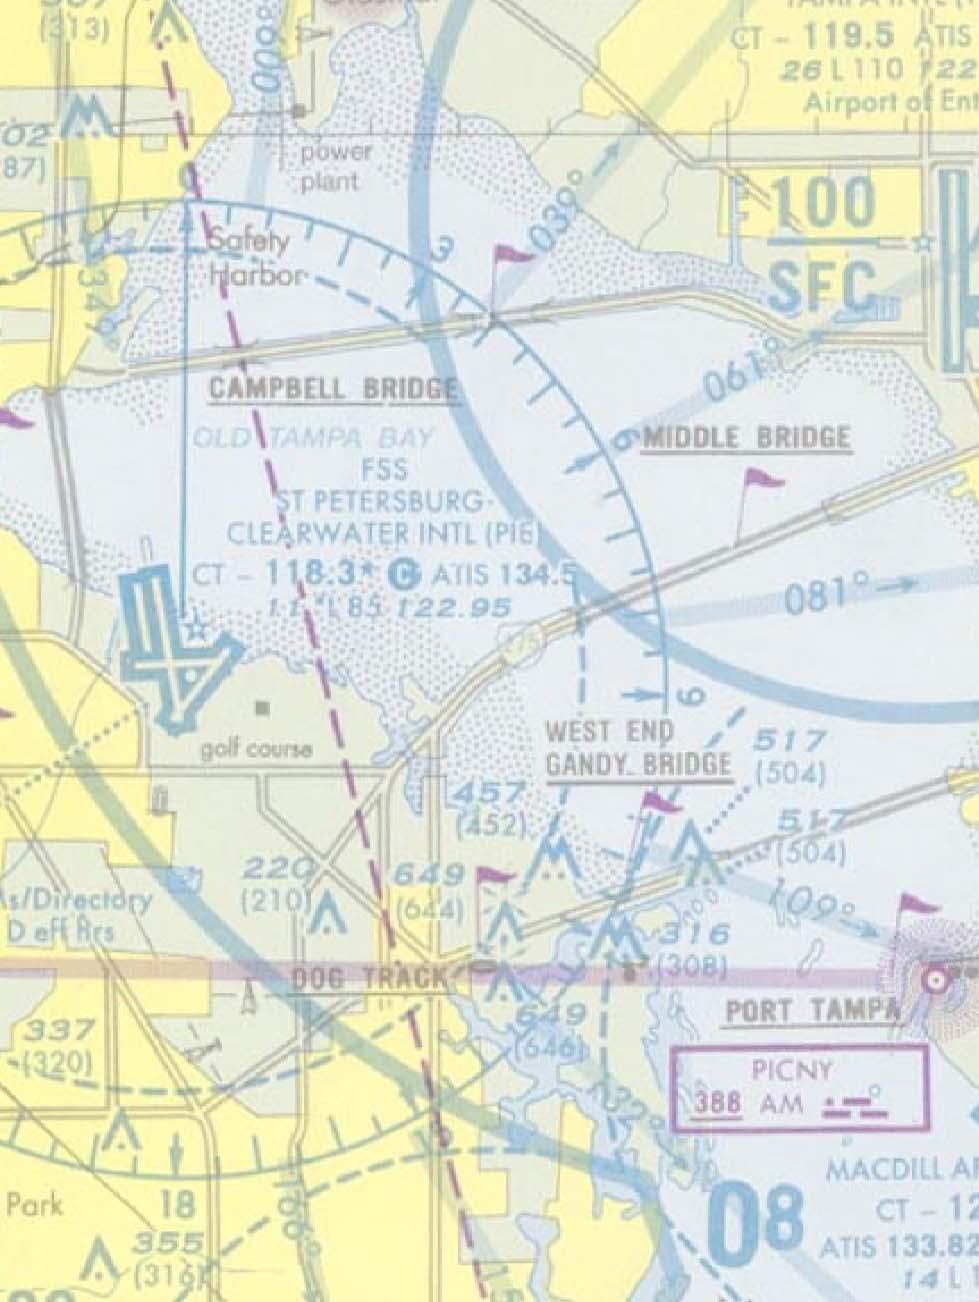
2 Group I Group II Group III Group IV Group V Group VI Airplane Design Group By Wingspan Up to, but not including 49 ft 49 ft up to, but not including 79 ft 79 ft up to, but not including 118 ft 118 ft up to, but not including 171 ft 171 ft up to, but not including 214 ft 214 ft up to, but not including 262 ft Critical Aircraft Determining the critical aircraft is instrumental in developing an airport s design criteria and determining the ARC. The critical aircraft of an airport is based primarily on the most demanding aircraft, with the highest approach speed and longest wingspan, which makes substantial use of the airport on a regular basis. FAA Order C, Field Formation of the National Plan of Integrated Airport Systems (NPIAS), defines substantial use as scheduled commercial service or 500 or more annual itinerant aircraft operations. The current critical aircraft for St. Petersburg-Clearwater International Airport (PIE) is the L , which requires an ARC of C-IV, small-hub, long-haul, primary commercial service airport. The future critical aircraft for PIE is the B , which requires an ARC of D-V. 5.3 AIRSPACE CAPACITY Airspace interaction is defined as the potential for conflicts among aircraft on approach or departure to other airports, and may require adjustment of operating procedures at the affected airports. Airspace and traffic patterns over the Tampa Bay area represent a very complex airspace structure due to the number of airports in close proximity to each other as well as the related volumes and mix of traffic. PIE is directly affected by high performance aircraft from MacDill Air Force Base and Tampa International Airport (TPA) as well as several general aviation (GA) airports, all within a 20-nautical mile (nm) radius from PIE. Thus, the ability to safely and efficiently conduct and control aircraft activity in the region depends upon the extent of airspace compatibility and air traffic control between airports in the area. Airspace capacity at an airport can be significantly impacted when the flight paths of air traffic at nearby airports, local navigational aids (NAVAIDs), and or special use airspace (SUA) interact to affect operations at the study airport. Additionally, obstructions near or in line with the approaches to an airport that require aircraft to alter flight paths can limit the number of aircraft processed, and thus, adversely affect airspace capacity. As a result, a review of the obstructions, airports, airspace, operations, and associated approach and departure procedures that surround PIE was completed to determine airspace capacity. Figure 5-1 illustrates the overall airspace surrounding PIE, as depicted in the FAA Miami Sectional Aeronautical Chart, 70 th Edition (March 2002) Airspace Limitations As discussed in Chapter 2, airspace in the St. Petersburg-Tampa Bay Area is controlled by regional and local air traffic control (ATC) and consists of Class B and D airspace at Tampa International Airport (TPA), Class D and Military Airspace at MacDill Air Force 2/19/04 St. Petersburg-Clearwater International Airport Master Plan Update 5-2
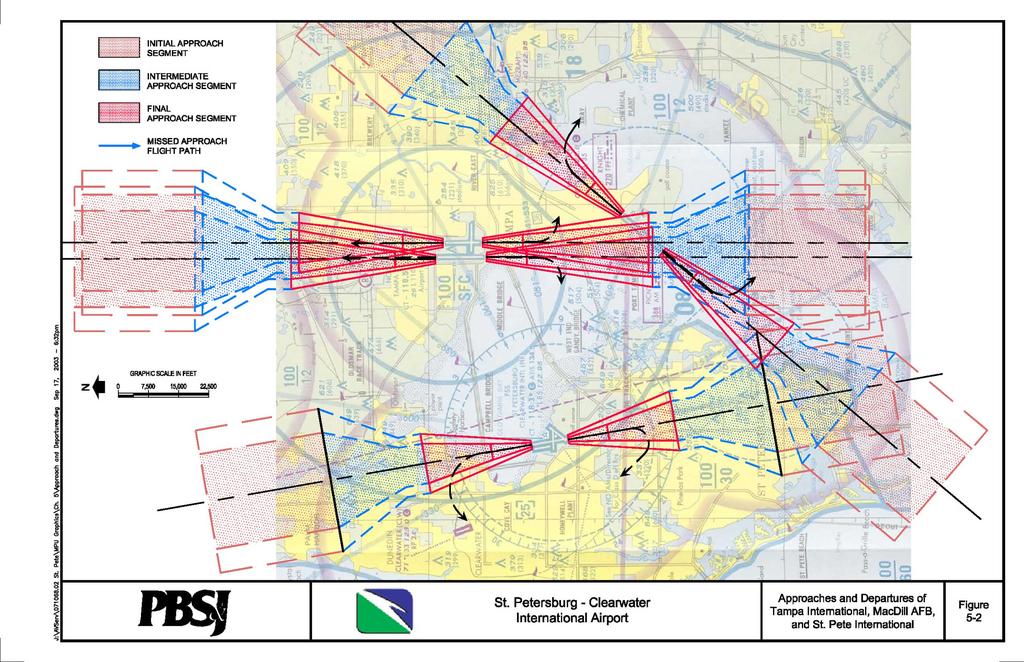
3 Base (MCF), and extended Class C and D airspace at PIE. Aircraft en route to or departing any of these airports often use the same airway routes and/or NAVAIDs, and transverse the same areas at varying altitudes and speeds. The combined level of activity at TPA, MCF, and PIE requires enhanced coordination by ATC at all facilities to ensure safe and efficient flight operations. Still the proximity of these airports and levels of air traffic impacts airspace capacity at PIE. A review of the flight paths to PIE, TPA, and MCF, as well as associated NAVAIDs, was completed to determine the level of impact that TPA and MCF have on the airspace capacity for PIE. Primary arrivals and departures to TPA use runways 18R-36L and 18L- 36R, which are oriented to the north and south, with limited east-west arrivals and departures on PIE s runway orientation is based upon its military heritage since two runways 17L-35R and 17R-35L are oriented in a north-south direction, while runways and are oriented in an east-west and northeast-southwest direction, respectively. MCF s runway is oriented in a northeast-southwest direction (Runway 04-22). Additionally, GA airports located within 20 nm of PIE include: Clearwater Airpark (CLW), Peter O Knight (TPF), Albert Whitted Municipal (SPG), and Vandenberg (X16) Airports, have arrivals and departures flight tracks that are oriented primarily north-south and northeast-southwest. Terminal instrument procedures (TERPS) are in place at all three airports (MCF, PIE, and TPA), and are northeast-southwest and north-south, and north-south respectively. A straight-in precision approach procedure is shown in Figure 5-2 for all runways at PIE, TPA, and MCF that are equipped with an instrument landing system (ILS) based upon Department of Transportation Orders B, United States Standard for Terminal Instrument Procedures (TERPS) and A, Civil Utilization of Microwave Landing System (MLS). A TERPS procedure consists of four segments: an initial approach, intermediate approach, final approach, and missed approach segment. The dimensions of these respective segments are based upon various instrument waypoints. These waypoints provide guidance to aircraft, operating under instrument flight rules (IFR), approaching the Airport. 2/19/04 St. Petersburg-Clearwater International Airport Master Plan Update 5-3
4
5
6 ILS approaches to airports are designated as Category I, II, or III. PIE and TPA are equipped with an ILS Category II on Runways 17L-35R and 18L-36R, respectively. A Category II ILS provides guidance information from the coverage limits of the ILS, to the point at which the localizer course line intersects the glide path, at a height of 50 feet above the horizontal plane containing the runway threshold. This Category II ILS supports landing minimums as low as 100 feet height above touchdown (HAT) and 1,200 feet runway visual range (RVR). TPA and MCF are also equipped with Category III ILS on Runways 18R-36L and 4-22, respectively. Like the Category II ILS, the Category III ILS provides guidance information from the coverage limits of the ILS, with no decision height specified above the horizontal plane, containing the runway threshold. A category III ILS, depending upon if it is designated as a Category III A, B, or C operation, will require different runway visual ranges (RVR). Cat-III A and B require an RVR of greater than 700 feet and greater than 150 feet, respectively. CAT-III C requires an RVR without reliance on external visual reference. Approaches to all airports utilize the TPA and PIE very high omni-directional range (VOR) for en route, terminal area navigation and/or instrument approaches. In addition, aircraft transitioning to or from PIE must meet the designated equipment requirements in order to enter TPA s airspace, or must deviate around the airspace. Figure 5-2 illustrates the TERPS for PIE, TPA, and MCF Military Airspace Limitations The location of MCF, not only to PIE and TPA, but also to other public-use airports in the vicinity requires special ATC procedures in order to avoid any possible conflicts between high-speed military jet aircraft and commercial aircraft operations. Currently, heavy and fast military jet traffic operates from 1,000 to 2,500 feet in the northeastern, eastern, and southern regions of Tampa Bay. Between ( local) universal time clock (UTC) daily, airspace that lies within the Tampa Class B Airspace will be delegated to MCF Air Traffic Control Tower (ATCT) for airport traffic control services, and thus, Class B Airspace services will not be provided within this portion of the Class B Airspace while this area is active. This airspace control will extend from 1,200 ft mean sea level (MSL) up to and including 1,600 ft MSL. Included are the areas south of a line located 1½ miles west of and parallel to MCF s Runway extended runway centerline, within a 4.5 nm radius from the geographical center of MCF (Airport/Facility Directory, Southeast US, 13 June, 2002) Instrument Approach Limitations As discussed in Chapter 2, and further demonstrated above, the airspace surrounding PIE is constrained by the amount of approaches and departures associated with multiple airports. This limits the airspace available for additional instrument approaches to PIE, and ultimately, the number of aircraft that can be processed during peak periods. Additional instrument approaches to PIE on a north-south (Runway 17L-35R) and possibly northeast-southwest (Runway 04-22) alignment could be developed. Northsouth approaches and departures to 17L-35R follow the north-south approaches and departures of TPA s Runway By following the same pattern, ATC maintains adequate separation between aircraft in the area by assigning specific altitudes. Potential future instrument approaches to PIE would need to take into account current and potential operations at TPA and MCF. TPA is currently in the process of adding a 2/19/04 St. Petersburg-Clearwater International Airport Master Plan Update 5-6
7 third north-south parallel runway to the airport infrastructure. Thus, instrument approach altitudes, airspace protection for holding and missed approach procedures, and adequate separation between approach procedures to the Airports are of utmost concern. Additionally, approaches to PIE and TPA would need to be coordinated to ensure safety by avoiding conflicts of aircraft on potential converging courses. Presently, TPA uses terminal radar approach control (TRACON) to control aircraft and monitor the 20 airports within the Tampa Bay region (Refer to Figure 5-2) Noise Abatement Procedures In heavily populated areas, noise abatement procedures are often required to mitigate the potential noise associated with aircraft operations at an airport. In the case of PIE, several noise abatement procedures are in place in order to limit the potential noise associated with turbojet and military aircraft. These procedures often require aircraft to follow set approach or departure paths and altitudes in order to avoid or limit potential overflight of populated communities. Within the vicinity of PIE, there are the noise sensitive areas of Safety Harbor, Del Oro Groves, and Oldsmar, which are approximately five miles north and are in the area of the ILS outmarker (CAPOK). As a result, noise abatement approach procedures have been established to minimize noise exposure from approaches and departures to these noise sensitive areas. In addition, these established noise abatement procedures are extended to private and corporate jet aircraft on a voluntary basis. The St. Pete Two approach, which is also used for Air Carrier turbojet aircraft having a certified gross weight of 60,000 lb or more, requires aircraft to follow the North Bay Visual Approach (Approach and Departure procedures, U.S. Terminal Procedures, Southeast, Volume 3 of 4, 13 June, 2002), weather permitting, in order to comply with the current noise abatement procedures. This approach path, which is restricted to daylight operations only, requires aircraft to proceed visually from over the power plant (PIE R DME fix) on a heading of 190 degrees direct to the causeway bridge, then turning right to intercept the final approach course to Runway 17L (see Figure 5-3). Furthermore, aircraft approaching from the south and southwest towards Runway 35R must maintain an altitude of 1,600 ft. Currently, turbojets departing on either Runway 17L or Runway 35R are required to use the St. Pete Two Departure (Figure 5-4) in order to avoid noise sensitive areas to the north of the Airport. Takeoffs from Runway 35R requires turbojet aircraft to fly departure heading until 1.5 DME, then turn right to heading 030 degrees to intercept and fly outbound on the St. Petersburg R-010. All other aircraft fly runway heading or as assigned by ATC. For all departures, aircraft must maintain 1,600 feet and expect further clearance to the filed altitude ten minutes after departure. (U.S. Terminal Procedures, Southeast, Volume 3 of 4, November 1, 2001). It is important to note that PIE ATC tower s operating hours are from 6:00 a.m. to 11:00 p.m. However, PIE is operational 24-hours per day, including visual meteorological conditions (VMC) and instrument meteorological conditions (IMC) operations. 2/19/04 St. Petersburg-Clearwater International Airport Master Plan Update 5-7
8
9
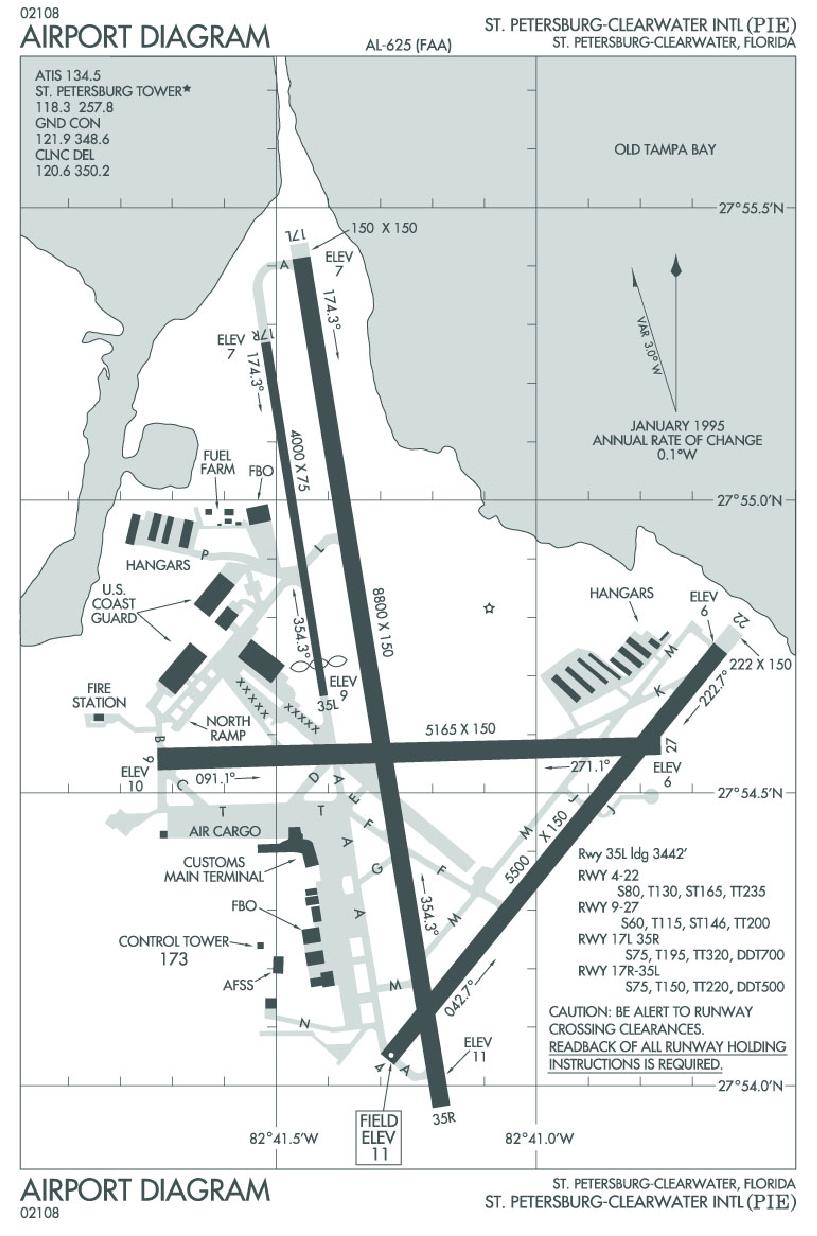
10 These procedures not only limit potential noise associated with aircraft operations, but also limit any potential conflicts associated with aircraft operations at MCF, TPA, or other airports in the area. By maintaining departure and approach paths that are similar to both TPA and MCF, airspace conflicts between aircraft are limited. 5.4 AIRSIDE CAPACITY A demand and capacity analysis of airfield or airside systems and facilities includes calculating hourly capacities for visual flight rules (VFR) and IFR. Additionally, annual service volume (ASV), the total number of aircraft operations that may be accommodated at the airport without excessive delay, is also calculated. As defined by the FAA, ASV is a reasonable estimate of the Airport s annual capacity, accounting for the differences in runway use, aircraft mix, weather conditions, etc., encountered over a year s time. The parameters, assumptions, and calculations required for this analysis are included in the following sections Runway Orientation, Utilization, and Wind Coverage PIE has four active runways. Runways 17L-35R and 17R-35L are oriented in a northsouth alignment, and Runway is oriented in a northeast-southwest configuration, while is oriented in an east-west configuration. It is necessary to analyze the use and configuration of these runways, in conjunction with other variables, to determine the overall capacity of the airfield. By definition, capacity is a measure of the maximum number of aircraft operations, which can be accommodated on an airport or airport component in an hour as well as on an annual basis. In other words, airfield capacity is the sum of all operations, or a combination of total takeoff capacity and total landing capacity. Each operation is defined by wind direction, heading, available instrument approaches, noise abatement procedures, airspace restrictions, and other operating parameters. Since the capacity of an airport component is independent of the capacity of other airport components, it can be calculated separately. Runway utilization is also dependent on weather and winds. The National Oceanic and Atmospheric Administration s (NOAA) National Climatic Data Center (NCDC) in Asheville, North Carolina provides statistical wind data to analyze runway use based on prevailing wind direction and overall weather conditions. The resulting runway utilizations will factor into the capacity calculations for the airfield in later sections. Table 5-1 presents runway utilization in specific weather conditions at PIE. It is important to note that currently Runways 17L-35R and 4-22 are equipped to accommodate IFR conditions. 2/19/04 St. Petersburg-Clearwater International Airport Master Plan Update 5-10
11 Runway Table 5-1. Runway Utilization (2001) Average Day Operations Annual Operations VFR Conditions IFR Conditions 17L , % 35.00% 35R , % 65.00% 17R % 0% 35L 8 2, % 0% , % 0% , % 0% , % 0% , % 0% , % % Source: URS, 2002, NOAA, NCDC, April Wind coverage is the most important element in determining runway orientation. Runway orientation should dictate maximum operations into the wind. Accordingly, the FAA requires crosswind coverage of the airfield to be at least 95 percent. Using Version 4.2D of the FAA s Airport Design for Microcomputers, a wind analysis was completed to include all weather, VFR, IFR, CAT-I, and CAT-II conditions. Crosswind components of 10.5, 13, 16, and 20 knots were applied. Utilizing these assumptions, the all weather and IFR wind roses are depicted in Figure 5-5 and 5-6. Crosswind coverage and maximum crosswind components are typically dependent on the size of aircraft using the runway. A crosswind component of 10.5 knots applies to FAA design Group A aircraft, 13 knots applies to Group B aircraft, 16 knots applies to Group C aircraft, and 20 knots applies to Group D and E aircraft. However, there is very little variation in the all weather analysis for 10.5 knots (99.75%) and 20 knots (100.0%). Since wind coverage is not a major concern for PIE, the most conservative approach using the factors associated with a 10.5 crosswind component were analyzed as aircraft in approach Category A are most susceptible to crosswinds. As mentioned, the analysis yielded a percent wind coverage for all weather conditions, and percent coverage for IFR conditions. Wind coverage during VFR conditions equals percent. These percentages represent the coverage based on usage of all runways. The primary runway, 17L-35R, hosts all categories of arriving and departing traffic including air carrier, GA, and military aircraft. However, GA is the dominant user. The traffic pattern for the runway is northbound the majority of the time, therefore Runway 35R is used most often. Parallel Runway 17R-35L hosts mostly military helicopter operations departing to the south and GA touch and go operations (T&Gs) departing to the north. Runway is used almost exclusively for GA T&Gs, with a small percentage of military operations. The majority of traffic arriving and departing on Runway is attributed to small GA aircraft, with a limited percentage of GA jets, turboprops, and military aircraft. Table 5-2 provides a breakdown of air traffic specific to each individual runway for PIE. For example, Table 5-1 showed that Runway 17L is used 23 percent of the time. Table 5-2 further breaks down runway utilization by aircraft category. Therefore, it is clear that the traffic on Runway 17L is comprised of all aircraft categories, but the majority consists of GA piston aircraft. 2/19/04 St. Petersburg-Clearwater International Airport Master Plan Update 5-11
12
13
14 Table 5-2. Air Traffic by Runway Runway 17L 35R 17R 35L Air Carrier 5.36% 4.61% 0.00% 0.00% 0.00% 0.00% 0.00% 0.00% GA Jet 5.75% 3.95% 0.00% 0.00% 0.00% 0.00% 2.30% 0.00% GA Turbo 1.99% 1.63% 0.00% 0.00% 0.00% 0.00% 2.74% 0.00% GA Piston 78.70% 66.95% 0.00% 0.00% 0.00% 0.00% 75.85% 97.66% Military 1.34% 1.09% % 4.99% 0.64% 0.00% 7.87% 2.34% T&G Piston 2.41% 19.71% 0.00% 95.01% 76.16% 85.39% 9.54% 0.00% T&G Military 4.44% 2.05% 0.00% 0.00% 23.20% 14.61% 1.71% 0.00% % % % % % % % % Source: URS 2002, PBS&J, Airfield Capacity Parameters and Assumptions Airfield capacity is calculated as defined by FAA AC 150/ Airport Capacity and Delay. This document provides detailed methods, parameters, and assumptions necessary for accurate computation. The airfield capacity is computed using varying runway configurations typical of U.S. airports. Airfield capacity calculations consider the highest level of runway utilization in accordance with current air traffic rules, procedures, and guidelines. Because of the unique airfield configuration at PIE, capacity calculations were based on three different configurations. Runways 17L-35R and were analyzed as a crossing formation and Runway was analyzed as a single runway configuration. Additionally, based upon interviews with the PIE ATCT, Land and Hold Short Operations (LAHSO) are employed to maximize airfield utilization and capacity. LASHO operations are used to manage primarily GA and military operations as air carriers operating under FAR Part 121 and GA operators operating under FAR Part 135 are excluded from participating in LASHO. Depending upon wind and weather conditions, up to three runways can be employed utilizing LASHO. The optimum period the ATCT employs LASHO is when the winds are out of the east (25-30 percent of the year), allowing Runway 17L-35R, 4-22, and 9-27 to be employed simultaneously. Therefore, the airfield capacity analysis also included LASHO procedures. As part of the capacity analysis Runway 17R-35L was excluded from the airfield capacity for several reasons. Since the separation of Runway 17L-35R and Runway 17R-35L is less than 700 feet, simultaneous approaches and departures are not permissible and the two runways are considered as one runway. In addition, the utilization and availability of Runway 17R-35L is limited as the runway is a component of Taxiway A, which limits the runway s availability when aircraft are taxiing on Taxiway A Aircraft Mix Index When analyzing demand versus capacity, the FAA classifies an aircraft based on size, weight, and performance (A, B, C, or D), as illustrated by Table 5-3. Evaluating the percentage of operations associated with each aircraft class derives an Airport s fleet mix. The fleet mix is then used to calculate the mix index, which is also significant to the computation of airfield capacity. The mix index is a mathematical expression representing the percent of Class C aircraft plus three times the percent of Class D aircraft, or %C + 3D. 2/19/04 St. Petersburg-Clearwater International Airport Master Plan Update 5-14
15 Table 5-3. FAA Demand/Capacity Aircraft Classifications Aircraft Class A B Max Certified Takeoff Weight (lbs) Under 12,500 Number of Engines Single Multi Wake Turbulence Classification Small (S) C 12,500 to 300,000 Multi Large (L) D Over 300,000 Multi Heavy (H) Source: FAA AC 150/ Airport Capacity and Delay In 2001, the facilities at PIE accommodate aircraft within each of the four categories. The majority of aircraft fall within the A and B category, while categories C and D account for the remaining aircraft. For the purpose of airfield capacity calculations, the mix index percent (C + 3D) is 10.4 percent. In addition, the fleet mix for the years 2002, 2007, 2012, 2017, and 2022 were predicted and mix indices were calculated accordingly. Mix indices will be used to determine the ratio of demand to total capacity for each year and reported in a later section. Table 5-4 identifies existing and projected fleet mix and mix indices relating to airfield capacity calculations. Table 5-4. Fleet Mix and Mix Index Classification 2001 Ops (%) 2002 Ops (%) 2007 Ops (%) 2012 Ops (%) 2017 Ops (%) 2022 Ops (%) A & B 89.8% 89.8% 89.50% 89.58% 89.16% 88.85% C 10.1% 10.1% 10.36% 10.28% 10.66% 10.96% D 0.1% 0.1% 0.14% 0.15% 0.18% 0.22% Mix Index 10.40% 10.40% 10.78% 10.71% 11.19% 11.62% Sources: URS 2002, PBSJ, 2002, Air Nav, and PIE Airline Schedules (March ), PIE Landing Reports, and FAA ATCT data. It was necessary to specify mix indices of all possible runway configurations for VFR and IFR, as suggested in the previous section. Since all C and D category aircraft operating at PIE use Runway 17L-35R or 04-22, it is safe to assume the mix index is equal to 10.4 percent for VFR operations and 32 percent for IFR operations on Runway 17L in the crossing configuration. Runway utilization data shows limited operations of C and D category aircraft in the single configuration of The mix index for the latter configuration is 6.9 percent for VFR and 0 percent for IFR. The mix index for the threerunway configuration using LAHSO is 10.4 percent for VFR operations and 0 percent for IFR operations. It should be noted that the mix index for IFR conditions is only applied to runways with precision ILS approach capabilities (Runway 17L). Therefore, the IFR mix index for all runway capacity configurations that do not include Runway 17L is considered 0.0 percent. Additionally, LAHSO operations cannot be used during periods of IFR weather, thus the mix index for the three-runway LAHSO configuration is also considered to be 0.0 percent. 2/19/04 St. Petersburg-Clearwater International Airport Master Plan Update 5-15
16 Percent Arrivals The percent of arrivals component represents the ratio of arriving aircraft to the total number of operations. It is generally common that total annual arrivals equal total annual departures and average daily arrivals equal average daily departures. Therefore, a factor of 50 percent arrivals was used in the capacity analysis Percent Touch and Go A T&G occurs when an aircraft takes off immediately after it lands and is usually associated with flight training activity. The percentage of T&Gs is the ratio of T&Gs to the total number of annual aircraft operations. Typically, an airport s number of T&G operations will decrease as air carrier operations increase or as weather conditions deteriorate. It is also common for T&G operations to decrease as the demand for service approaches runway capacity. In most cases T&G operations can vary zero to 50 percent of total operations. The majority of T&G operations are attributed to GA, with 62,050 operations recorded in Military fixed-wing aircraft and rotorcraft also conduct T&G operations, with over 13,300 recorded in As seen in Table 5-5, the annual T&G percentage for the Airport is calculated to be 32.9 percent. The T&G factors were also calculated for the three runway configurations. The crossing configuration consisting of 17L-35R and has a T&G percentage of 33, and T&G factors of 1.26 for VFR and 1.00 for IFR. The single runway configuration, consisting of 09-27, has a T&G percentage of 33, and T&G factors of 1.31 for VFR and 1.00 for IFR. The three-runway configuration utilizing LAHSO has a T&G percentage of 33, and T&G factors of 1.31 for VFR and 1.00 for IFR. It should be noted that LAHSO operations are not conducted during times of IFR conditions. Therefore, though the T&G factor for IFR operations in the three-runway LAHSO configuration is presented as 1.0, it is later discounted in the capacity calculation to present actual operational activity. This results in no T&G or other LAHSO associated operations during IFR conditions. The majority of T&G operations are attributed to GA, with 62,050 operations recorded in /19/04 St. Petersburg-Clearwater International Airport Master Plan Update 5-16
17 Table 5-5. Percent Touch and Go Operations Category Annual Ops Touch & Gos Total Ops Air Carrier 7,262 7,262 GA Jet 7,486 7,486 GA Turbojet 3,416 3,416 GA Prop 13, ,647 GA T&G 62,050 62,050 Military C130 1,868 1,868 Military UH60 3,136 3,136 Military T&G C130 3,338 3,338 Military T&G UH60 1,452 1,452 Military T&G UH60 on RW4/22 8,562 8, ,814 75, ,215 % T&G 32.90% Source: FAA AC 150/ Airport Capacity and Delay; URS Taxiway Factors An essential element of an airfield capacity is its location of taxiway entrance and exit locations. Airfield capacity can be enhanced when full-length, parallel taxiways are available with ample entrance and exit taxiways. Runway capacity is negatively impacted when there are numerous taxiway and runway crossings as is typical at PIE. The criteria for taxiway exit factors are derived from the mix index and the distance the taxiways are from the runway thresholds. PIE taxiway factors were calculated for the crossing and single runway configurations. The maximum taxiway exit factor for either VFR or IFR operations is 1.0. Figure 5-7 illustrates the existing taxiway system at PIE. According to FAA AC 150/ Airport Capacity and Delay, if the mix index for the crossing configuration is 10.4 percent, only entrance/exit taxiways spaced at least 750 feet apart and 2,000 to 4,000 ft from a runway s threshold, contribute to the taxiway factor calculation. Based on these standards, two taxiways (Taxiway F and L) fall within the published limits producing a taxiway factor of 0.93 for VFR operations and 1.0 for IFR operations. In the single runway configuration, the mix index is 6.9 percent, so again the entrance/exit taxiways 750 feet apart and spaced 2,000 to 4,000 ft from the runway s threshold applies to the taxiway factor calculation. Therefore, one taxiway (Taxiway E) was identified for this configuration as well. The taxiway exit factor for the single runway configuration is 0.86 for VFR operations and 0.95 for IFR operations. In the optimum LASHO three-runway configuration, the mix index is 10.4 percent. Again the entrance/exit taxiways 750 feet apart and spaced 2,000 to 4,000 ft from the threshold apply to the calculation. Therefore, one taxiway (Taxiway F) was identified for this configuration. The taxiway exit factor for the single runway configuration is 0.86 for VFR operations and 0.98 for IFR operations. 2/19/04 St. Petersburg-Clearwater International Airport Master Plan Update 5-17
18
19 Regardless of the airfield configuration employed there are deficiencies in the existing taxiway system. Future improvements to the runway and taxiway configuration at PIE will be necessary to increase airfield capacity. Thus, an additional capacity scenario will illustrate the benefits of improving the existing taxiway system to a taxiway exit factor of 1.0, where at least four taxiways contribute to airfield capacity. Further suggestions for taxiway system improvements and enhancements will be evaluated in the Alternatives section General Airspace Limitations As discussed in Section 5.2 Airspace Capacity, airspace surrounding PIE is somewhat constrained due to the close proximity of TPA, MCF, and several GA airports in the general vicinity. This level of activity and general congestion has specific impacts on the airspace in the area, and overall capacity of the Airport. The airspace capacity limiting factors that have been identified at PIE include potential restriction on the airspace available for additional instrument approach procedures. Due to ILS approaches at PIE, TPA, and MCF, it is concluded that an instrument approach procedure to Runway 9-27 at PIE would incur potential conflicts with either TPA or MCF operations. Even VFR traffic patterns to Runway 9-27 are limited due to airspace constraints with TPA and MCF. The airspace and overall approach requirements for ILS and other instrument approaches are significant, and the addition of an east-west approach could increase ATC workload as well as the potential for hazardous operations. Furthermore, such an approach would require strict noise mitigation procedures since the approach and departure paths would be over significantly populated areas. Although the airspace surrounding PIE is somewhat constrained by the number of aircraft operations, noise abatement procedures and instrument approach procedures, it is not completely limited by airspace restrictions. Increases in aircraft operations at PIE will not exceed the airspace capacity in its existing configuration. Continued coordination between ATC at the airports in the region will ensure that safe and efficient operations continue, while maintaining the smallest amount of delay possible Runway Instrumentation Capacity calculations for PIE include data for all four runways subdivided into two separate categories. Runways 17L-35R and are analyzed as a crossing formation and Runway is analyzed as a single runway formation. The primary runway (17L- 35R) is equipped with a CAT-I ILS precision approach (currently being upgraded to CAT II capability) to Runway 17L, in addition to GPS, VOR, and NDB approaches. Approaches to Runway 35R include GPS, VOR, and localizer back course (LOC-BC), and the runway is currently being upgraded to CAT-I ILS capability. There is a VOR, approach to Runway 04 as well. Additionally, ATC facilities, equipment, and services are adequate for operating a radar environment. 2/19/04 St. Petersburg-Clearwater International Airport Master Plan Update 5-19
20 Weather Influences An IFR condition exists when either of the following situations occurs: Cloud ceiling is less than 1,000 ft above ground level (AGL). Visibility is equal to ½ mile, but less than 3 miles. Weather data obtained from the NCDC identified that VFR conditions at PIE occur approximately 95.1 percent of the time, while IFR conditions occur 4.2 percent of the time. CAT-I approaches are required approximately 0.2 percent of the time and CAT-II approaches are required approximately 0.3 percent of the time. The Airport is only considered closed approximately 0.2 percent of the time. The ILS approach to Runway 17L is capable of a Category I Approach, which allows IFR landings when ceilings are as low as 200 ft AGL and visibility is between ½ and ¾ mile. The Airport is considered closed to landing aircraft in IFR conditions when cloud ceiling or visibility is below 200 ft and/or less than 1/2 mile. When the CAT II approach to 17L becomes operational in 2004, ILS approaches minimums will be reduced to ceilings less than 200 feet and visibilities less than one half mile Airfield Capacity Calculations Based on FAA AC 150/ Airport Capacity and Delay, this section calculates VFR and IFR hourly capacities as well as determines annual service volume Hourly VFR Capacity The hourly VFR capacity calculation for PIE is based on data from each of the runway configurations, described previously, crossing, single and LASHO. FAA AC 150/ Airport Capacity and Delay formula for VFR hourly capacity multiplies hourly capacity base (C*), T&G factor (T), and the taxiway exit factor (E) to get the hourly VFR capacity for each component. Hourly capacity is derived from the aircraft mix index and the percent arrivals. The T&G factor is derived from the aircraft mix index and the percent T&G. Taxiway exit factor is derived from the aircraft mix index, percent arrivals, and the distance and spacing of taxiways from the threshold of the runway. For the crossing runway configuration, the hourly VFR capacity currently equals 127 operations, using the following data: C* x T x E = Hourly VFR Capacity 108 x 1.26 x.93 = or 127 The single runway configuration is calculated identically. For this component, the hourly VFR capacity currently equals 110 operations, using the following information: C* x T x E = Hourly VFR Capacity x 1.31 x.86 = or 110 2/19/04 St. Petersburg-Clearwater International Airport Master Plan Update 5-20
21 Considering the three-runway configuration utilizing LAHSO, the hourly VFR capacity currently equals 194 operations, using the following information: C* x T x E = Hourly VFR Capacity 172 x 1.31 x.86 = or Hourly IFR Capacity Hourly IFR Capacity is also calculated for each of the runway configurations. However, it is important to note that the only ILS approach currently available is the CAT-I ILS approach to Runway 17L which is included in the crossing configuration. Thus, the crossing configuration is represented as a single runway for the purposes of calculating hourly IFR capacity. Therefore, the actual capacity of the crossing configuration is currently 57 operations an hour, as shown in the following calculation: C* x T x E = Hourly IFR Capacity 60 x 1.00 x 0.95 = Currently, total hourly IFR capacity for the single runway configuration (Runway 9-27) is zero. IFR hourly capacity for the three-runway configuration using LAHSO is also zero since LAHSO operations cannot be conducted during IFR conditions. The hourly VFR and IFR capacities determined above will be used to calculate the ASV for PIE Annual Service Volume ASV is the estimation of an airport s annual capacity. ASV is dependent on differences in runway use, aircraft mix, weather conditions, etc., that would be encountered over a year s time. ASV is based on the parameters and assumptions presented in section 6.4.2, and the hourly capacities for the three runway configurations. Guidance for conducting this estimation is provided by FAA AC 150/ Airport Capacity and Delay. The ASV calculation is representative of the existing airfield capacity in its current configuration (2001). The equation for calculating ASV is: Cw x D x H Cw equals weighted hourly capacity, D equals annual demand divided by daily demand, and H equals daily demand divided by hourly demand. To calculate the Cw, the percent of time each runway-use configuration is utilized, the runway-use that provides maximum capacity, and the ASV weighting factor for each runway configuration are all determined. These factors, along with the hourly capacity factors calculated previously, are entered into a formula to generate the Cw. For PIE, Cw is equal to 120 operations. D is simply the ratio of annual demand to average daily demand of the peak month. D for PIE is equal to a ratio of 382 operations per day. H is the ratio of average daily demand to average peak hour demand during the peak month. H for PIE is equal to a ratio of 5 operations per hour. 2/19/04 St. Petersburg-Clearwater International Airport Master Plan Update 5-21
22 With these components in place, the ASV for PIE is calculated as 231,552 operations per year. Cw x D x H = ASV 120 x 382 x 5 = 231,552 According to the FAA, the following guidelines determine the phased needs as demand reaches certain levels of capacity: 60% of ASV: Planning for capacity improvements should begin. 80% of ASV: Planning for improvements should be complete and construction should begin. 100% of ASV: Demand has reached maximum capacity and delays are inevitable. As presented in the Chapter 4, Aviation Demand, annual operations for 2001, the base year of this study, were 231,283. This total is approximately 99.9 percent of the calculated ASV of 231,552 operations. Therefore, in accordance with FAA guidelines, PIE has reached maximum capacity and needs to initiate immediate plans for capacityenhancing improvements. Delays are already experienced by the ATCT on a regular basis and the ATCT compensates for the less than ideal configuration with LAHSO when able. Table 5-6 and Figure 5-8 illustrate the aviation demand forecast for PIE and its relationship to the Airport s ASV. It is important to note that major changes must be made to the current runway and taxiway system to gain capacity to meet current and increasing demands. Immediate improvements include an additional runway and improvements to the taxiway system. Section 7, Alternative Analysis will explore possible capacity enhancement improvements. Table 5-6. ASV vs. Demand It is important to note that major changes must be made to the current runway and taxiway system to gain capacity to meet increasing demands. DEM-CAP Year Mix Index Operations ASV Ratio % 231, , % % 241, , % % 259, , % % 284, , % % 316, , % Source: PBS&J, /19/04 St. Petersburg-Clearwater International Airport Master Plan Update 5-22
23 Figure 5-8. ASV vs. Demand Annual Operations 350, , , , , ,000 50,000 0 Forecast Operations 60% Capacity 80% Capacity 100% Capacity Year Source: PBS&J, LANDSIDE CAPACITY The ability of an airport to provide efficient landside facilities is essential to the success of the airport, and is especially important for the public who utilize the Airport. This section focuses on landside facilities including the terminal building, automobile parking, ground access, industrial park, and other facilities. The following sections will identify the capacity of each facility and the capability to meet the projected demand, as suggested by Chapter 4 - Aviation Activity Forecast. The demand-capacity analysis for landside facilities will also identify surpluses and deficiencies to reveal where facility improvements may be necessary Terminal Building Renovation and Expansion The passenger terminal at PIE is the interface between ground and air transportation. The Airport, and primarily the terminal building serve as the gateway to the community and form the visitor s first impression of the community. As such, the primary purpose of the terminal is to provide for the safe, efficient, and comfortable transfer of passengers and their baggage to and from aircraft and ground transportation. To accomplish this, essential elements such as ticketing, passenger processing, baggage handling, and security inspections are required. These are supported by food service, car rental, gift shops, rest rooms, airport management and other ancillary facilities. The planning and design of the terminal renovations and expansions are intended to ensure the primary circulation and functional flow relationships are improved, and, where necessary, revised accordingly Terminal Apron Commercial terminal apron space is comprised of the number of gate positions for aircraft parking and the size of aircraft utilizing the positions. Currently, PIE has 14 domestic and international gates in the terminal apron area. The terminal apron area is approximately 41,556 sq yd. As commercial operations and demand for gates and aircraft parking positions increase, additional terminal apron will likely be required. In Chapter 6, Facility Requirements, terminal apron area will be calculated based on the forecast peak hour operations, average parking position occupancy time, and aircraft arrival/departure rates. Total area required, including specific number of gates and 2/19/04 St. Petersburg-Clearwater International Airport Master Plan Update 5-23
24 aircraft parking positions, will be determined for the 20-year planning period. Improvements will be suggested in Chapter 7 - Alternatives Analysis Demand/Capacity Analysis and Terminal Building Requirements Detailed descriptions of historical aviation activity and forecasts of future demand were determined in Chapter 4. The capacity and adequacy of the existing terminal facilities were compared to the future passenger demands that determined the recommendations contained herein for revisions, expansions, or additions to the airport terminal facilities. Capacity requirements were calculated for essentially all aspects of the terminal area at PIE. These calculations, based on various forecast components, should be regarded as generalized planning tools that assume attainment of forecast levels. Should the forecast prove conservative, proposed developments should be advanced in the development schedule. Likewise, if traffic growth materializes at a slower rate than forecast, deferral of expansion would be prudent Existing Terminal Conditions The majority of operations are conducted in the main terminal building that operates continuously throughout the year. This building is a two-level structure and is approximately 143,980 square feet in area. Due to its layout, some areas of the terminal are not useable for passenger services. These areas are unused or leased to nonaviation tenants. The first floor (122,051 sq ft) accommodates five airlines; four rental car agencies; concession areas; 14 gates; two TSA security-screening areas; U.S. Customs; duty-free shop; two concessionaires, including a gift shop and a newsstand; Pinellas County sheriff s offices; and restrooms. The second level (22,819 sq ft) is used exclusively for airport administration offices, non-aviation offices, conference rooms, and a restaurant. With the exception of the baggage claim, the terminal building was not design to provide second level aircraft boarding. Current space utilization of the terminal building is inefficient for the processing of passengers and maximization of revenue generation. Every effort must be made to provide a simplified, efficient, and unobstructed flow of passengers, baggage, vehicles, aircraft, etc., in and about the terminal building and support areas. The existing layout of the terminal is not an example of such a functional flow design. The primary terminal functions and ancillary activities were located over time without respect to the functional relationships necessary for terminals to operate efficiently. For example, security should be consolidated to one area of the terminal. This is an especially critical aspect for consideration since the events of September 11, 2001 and the increase security screening requirements. Similarly, domestic aircraft boarding gates are located throughout the building on either side of the international arrivals area (U.S. Customs) rather than being consolidated so that several gates could be served by a common holdroom(s). Furthermore, a large area of terminal space (former bag claim area) is used essentially as a TV lounge. This existing layout leads to inefficiencies for the Airport, passengers, and tenants, as well as confusion and longer walks for passengers as they 2/19/04 St. Petersburg-Clearwater International Airport Master Plan Update 5-24
25 enter and depart the terminal. Figures 5-9 and 5-10 show circulation and functional relationships recommended for commercial service terminal buildings. Figure 5-11 shows an example of a nonfunctional terminal layout. Figures 5-12 and 5-13 are the layout of the existing first and second floors, respectively, of terminal building at PIE. Figure 5-12 has some similarities to Figure 5-11 in regards to deficiencies in layout and function Evaluation of the Existing Passenger Terminal The existing terminal building is the result of a series of additions that have created a linear terminal that has 860 feet of frontage. The building has four major sections, separated from each other by four-hour and three-hour firewalls. Going from west to east, the first area is the new baggage claim addition that was completed in It is Type II protected construction and has fire sprinklers. The second area is the Wick Wing. It was completed in 1958, is Type IV unprotected construction, and does not have fire sprinklers. There is a small addition at the rear of the Wick Wing that was completed in 1983 that is of the same construction type. The third area is the former baggage claim area, which was completed in 1984, and is the same construction type as the Wick Wing. The fourth area is the original airport terminal, which is of Type II protected construction with fire sprinklers. It has had several renovations and additions, including Federal Inspection Services (F.I.S.) in 1989, additional departure lounges in 1985 and additional ticketing and airline offices in An enclosed walkway was added to the front of the terminal in 1995 to provide for sufficient circulation between the various parts of the terminal and to provide a unified modern appearance. Development of the terminal through renovation of existing areas or expansion through additions has required negotiation with the Pinellas County Building Department to maintain an acceptable level of life safety and protection of building elements. Roof-mounted package units provide heating, ventilation, and air-conditioning (HVAC). Floor to floor access is provided by two elevators, each serving separate second floor areas, four exterior fire stairs, and one interior stair General Terminal Building Sizing Criteria The terminal building and support area will be the element of the Airport most affected by future passenger activity increases. Various planning parameters were analyzed to determine the need for renovation and expansion. The primary facilities that serve scheduled commercial passengers at PIE include the passenger terminal building and the aircraft-parking apron. Individual terminal area facilities are examined in terms of their general spatial requirements to accommodate the future forecasted passenger and aircraft activity levels. Alteration of these facilities may be necessary to meet specific forecast levels. 2/19/04 St. Petersburg-Clearwater International Airport Master Plan Update 5-25
26
27
28
29
30
31 General sizing criteria for terminal buildings have been established over time by various governmental agencies and industry groups. However, the general sizing parameters are not applicable in every situation. The experience of the consultant and adaptation to unique situations is also necessary. The sources for terminal planning guidance include the FAA, International Air Transport Association (IATA), Transportation Research Board (TRB), and the International Civil Aviation Organization (ICAO), to name a few. Some of the documents referenced for this report include the following: IATA Airport Terminals Reference Manual, 7th Edition, January 1, 1989 FAA AC 150/ , Change 1, Planning and Design Guidelines for Airport Terminal Facilities, January 19, 1994 FAA AC 150/5360-9, Planning and Design of Airport Terminal Facilities at Non-hub Locations, April 4, Measuring Airport Landside Capacity, Special Report No. 215, TRB, Using these documents, and the experience and judgment of the consultant, general gross spatial requirements were determined for PIE. Within the terminal building, several independent activities occur which require spatial analysis to accommodate peak-hour activities. These include: ticketing, waiting areas, baggage claim and storage, airline (air carrier and commuter) facilities, security screening stations, airport management and operations facilities, car rental agencies, public rest rooms, and concessions. General guidelines have been used for sizing the gross square foot (sq ft) requirements for terminal facilities based upon the peak hour passengers (PHP). These factors vary depending on the type of annual passengers processed, as shown below: International airport terminals sq ft/php Small to large hub airport terminals 250 to 300 sq ft/php Non-hub commercial airport terminals 150 to 250 sq ft/php General aviation airport terminals 49 to 100 sq ft/php PIE is classified as a small-hub commercial airport for which 150 square feet per PHP will provide sufficient gross area for all of the previously mentioned activities. However, it is assumed that given current international activity at PIE, though much smaller than typical international airports, 200 sq ft per PHP is more appropriate for planning purposes. To refine this general sizing requirement, a detailed calculation of space by activity area was prepared and is presented later in this report. The general overall space requirements for the cardinal years of the forecast period are shown below in Table 5-7. Table 5-7. Gross Terminal Space Requirements Year PHP Sq Ft/PHP Space Required 2002 (Existing) sq ft 104,600 sq ft sq ft 126,000 sq ft sq ft 148,400 sq ft sq ft 172,400 sq ft , sq ft 200,200 sq ft 2/19/04 St. Petersburg-Clearwater International Airport Master Plan Update 5-31
32 Most commercial service terminals have similar tenant and space demands. Each terminal will typically include the following functions by percent of total space: Airline space - 33% Public space - 40% Concession space - 17% Airport management - 4% Utilities - 6% The distribution of the major terminal elements, shown above, results in an even division of revenue and non-revenue spaces. Planning terminal development or expansion should consider the financial aspects to assure the total area of revenue producing space (i.e., airline, concessions) equals or exceeds non-revenue space, to offset the Airport s obligation to finance the expansion of the building. Studies for the expansion of terminal facilities, such as this study, are developed around a 20-year planning period. Forecasts of enplaned passengers, aircraft operations, and terminal sizing requirements are generated in increments of five, ten, and twenty years. However, terminal construction is typically phased in ten-year periods, primarily due to the time and cost of construction and the impacts imposed upon the passengers, airport, and airline operations. Although excess capacity is experienced in the first few years as enplanements increase to the expected demand levels, this is normal. Benefits from initial excess capacity include flexibility to adapt to changing market conditions, such as new entrants into the market. This also allows long periods from intensive construction activities in the terminal area and time to study future terminal expansion before reaching or exceeding peak hour passenger capacity levels Automobile Parking According to FAA AC 150/ Planning and Design Guidelines for Airline Terminal Facilities, 40 to 85 percent of the originating passengers arrive to airports in private automobiles. Consequently, adequate public parking facilities are a valuable part of good terminal design. Automobile parking facilities are not only intended to provide space for passengers, but also for employees, visitors, and car rental agencies. The FAA suggests that for every one million total annual passengers, an airport should supply from 1,000 to 3,300 parking spaces. PIE is currently designated as an origin and destination airport, and automobile-parking capacity had been adequate most of the time with capacity being exceeded during holiday travel periods such as Thanksgiving and Christmas. During these times, PIE employs a remote parking lot located on the west side of Roosevelt Boulevard and a shuttle bus is required to transport passengers to the terminal. However, with changes in airlines, schedules, and destinations, the remote lot is being employed nearly every weekend in addition to holiday travel days. The Airports long-term plan is to close the remote parking lot and make the land area available for lease. However, before the Airport closes this lot, it will need to supplement parking capacity by building parking garages in the terminal area. Until recently (August 2002) parking was free at PIE, and extended parking and nonairport users parking was not discouraged. This may have affected the main parking lot s capacity during peak travel periods. PIE s public parking facility is also accommodating GA employees and customers because of limited parking in the GA areas that will be discussed in later sections. Additionally, 191 spaces in the formerly short-term parking 2/19/04 St. Petersburg-Clearwater International Airport Master Plan Update 5-32
33 lot closest to the terminal building had been closed due to TSA/FAA security regulations, but are now used by rental car companies. Currently, there are 714 public parking spaces, 191 rental car spaces, and 153 employee spaces. An additional 469 public spaces exist in the remote lot, but these spaces will be lost when the remote lot is closed. Based on airport industry standards, a factor of 1,400 parking spaces per million passengers was utilized in determining automobile parking capacity. Industry standards recommended 44 sq yd per space for public parking spaces, and 36 sq yd for rental car spaces. Both of these sizing factors include maneuvering lanes and turning space for each parking space. The demand for automobile parking at PIE is illustrated in Table 5-8. Figure 5-14 shows the current terminal parking areas. Table 5-8. Automobile Parking Demand Total Annual Passengers 638, , , ,720 1,147,528 1,331,490 Parking Space Demand ,173 1,383 1,607 1,864 Required Area (SY) 39,750 43,286 52,126 61,458 71,400 82,848 Source: FAA 150/ Planning and Design Guidelines for Airport Terminal Facilities; PBS&J, Ground Access and Terminal Roads Access to the Airport The highway system in Pinellas County is well developed with Roosevelt Boulevard (SR 686), Ulmerton Road (SR 688), US Highway 19, and US Highway 92 providing regional access in close proximity of PIE. Interstate 275 is located 3 miles east of the Airport, accessible by Ulmerton Road and Roosevelt Boulevard. This system currently provides excellent access to Hillsborough County and through Pinellas County. The Florida Department of Transportation (FDOT) has embarked upon a long range roadway improvement and upgrade program in the vicinity of PIE which will improve service and access to the area by renovating major roadways and intersections at Ulmerton, Roosevelt, and 49 th Street, in addition to providing additional access from I-275 via the CR 296 connector (118 th Street). Also included in this project is the development of Roosevelt into an elevated, limited access highway, which will require alternate access into the Airport Primary Airport Access Roads Terminal Access Roadway System Terminal access roadway systems are made up of several components. First is the primary terminal access roadway, known at PIE as Terminal Boulevard. This road then leads to a terminal access road, in this case, Airport Parkway, which provides access into the general terminal area, the terminal building(s), and parking areas. Terminal access roads are typically one way and flow in a counter-clockwise direction. Terminal frontage roads branch off the terminal access road providing direct access to the terminal curb. Figure 5-15 shows circulation and functional relationships recommended for the commercial service terminal area regarding traffic flows and parking. 2/19/04 St. Petersburg-Clearwater International Airport Master Plan Update 5-33
34
35
36 Terminal Circulation Configuration The PIE terminal access and roadway system is classified as a centralized layout. This is typical of terminal area complexes that consist of a single terminal building and an atgrade terminal roadway system that all passenger-related vehicles normally pass through to access the terminal, parking, and rental cars. Figure 5-16 shows the terminal roadway system Primary Terminal Area Access Roads There are two primary access roads to the terminal area. The first is Terminal Boulevard, a one-lane, at-grade roadway that bisects the terminal parking area. Terminal Boulevard terminates at Airport Parkway. Access is gained directly from Roosevelt Boulevard. (See Figure 5-16.) The second is Airport Parkway, also accessible from Roosevelt at two locations. At its most northern entrance off Roosevelt, it is initially a two-lane, two-way roadway coming into the terminal area, where it becomes a terminal access roadway that bisects the rental car and public parking lots and merges with Terminal Boulevard. At this point, Airport Parkway continues as a one-way, two-lane, counterclockwise terminal access road where it flows by the terminal building and terminal frontage road. The terminal roadway portion terminates where it meets Airport Parkway and ultimately merges with itself where it becomes a two-lane, two-way road again, exiting onto Roosevelt Boulevard. (See Figure 5-16.) Capacity per lane for at-grade primary airport access roadways is 800 vehicles per hour (VPH) for vehicle speeds of less than 30 miles per hour (MPH). Estimating that 80 percent of passengers arrive and depart the Airport by automobile, and the remainder of peak hour passengers arrive by high occupancy vehicles (e.g., buses, limos, vans, etc.), the primary Airport entrance roadways system will exceed capacity before Table 5-9. Primary Airport Access Roadway Capacity Year Peak Month Average Day Peak Hour Passengers 80% Automobile Other Average Day PH Vehicles Existing Roadway Capacity VHP VPH Deficiency , , ,259 1, ,133 1, ,485 1, ,336 1, ,725 1, ,552 1, ,001 1, ,801 1, /19/04 St. Petersburg-Clearwater International Airport Master Plan Update 5-36
37
38 Terminal Area Access Road A portion of Airport Parkway serves as the terminal access roadway from the area it bisects the rental and public parking lots. It begins as one-way once it passes the entrance to the short-term public parking lot. From this point, its circulation is counterclockwise in direction, and provides limited choices to passengers driving through the terminal area, either directing them to the terminal frontage road or parking facilities. (See Figure 5-16.) Terminal access roads should be able to accommodate 1,000 VPH and should consist at a minimum of two 12-foot lanes. The portion of Airport Parkway that serves as the terminal area access road meets these minimum requirements. The capacity calculation of Airport Parkway is similar to primary terminal access roads. Assuming the two-lane Airport Parkway has a capacity of 2,000 VPH and assuming all terminal traffic uses Airport Parkway, capacity of Airport Parkway appears to be adequate for the future Terminal Frontage Road Terminal frontage roads are designed to distribute vehicles directly in front of the terminal building adjacent to the terminal curb. A minimum of two lanes adjacent to the curb is recommended. The inside lane, sized at an eight-foot lane width, is for the loading and unloading of passengers and baggage. This lane has no throughput capacity. The outside lane is used for maneuvering to and from the curb front and should be sized at 12 feet wide to provide a capacity of 300 VPH. Additional 12-foot, 600 VPH capacity through-lanes should be provide to expedite traffic through the terminal frontage area. The terminal frontage roadway system at PIE consists of three lanes, one curbside lane and two through-lanes with a capacity of 900 VPH. (See Figure 5-16.) Assuming 50 percent of vehicles (900 vehicles) access the terminal frontage roadway, capacity will be at 100 percent by Additional capacity should be provided Other Primary Airport Access Roads The Airport is accessible by several primary roadways. Airport Parkway is a dualpurpose, two-lane, at-grade access road accessible at two locations from Roosevelt Boulevard. Airport Parkway s southern entrance from Roosevelt provides access to the FAA s ATCT and Flight Service Station (FSS) facilities as well as the fixed base operators (FBOs). Airport Parkway continues to the intersection with Terminal Boulevard provides access to the parking lots, terminal building frontage road, and UPS, finally terminating at Roosevelt Boulevard. (See Figure 5-16.) As the southern entrance of Airport Parkway is essentially limited to accessing the FAA and FBO facilities, an 800 VPH road capacity is considered adequate for the planning period. Access to the Airport s west and north areas where the U.S. Coast Guard facility (USCG), Pemco, Shelt Air corporate hangar complex, Jet Executive FBO, and the U.S. Army Reserve helicopter training facility (under construction) are located, is provided by Fairchild Drive. Accessible from Roosevelt Drive, Fairchild Drive is a two-lane, two-way road that is inadequate to provide necessary capacity to the tenants on this side of the Airport. During peak demand, especially with the conclusion of the afternoon shift of workers from USCG, backups are frequent. Fairchild Drive is access controlled from Roosevelt, and in the afternoons, Roosevelt Boulevard backs up as well as Fairchild Road traffic exits the Airport. Afternoon traffic congestion on Roosevelt Boulevard is 2/19/04 St. Petersburg-Clearwater International Airport Master Plan Update 5-38
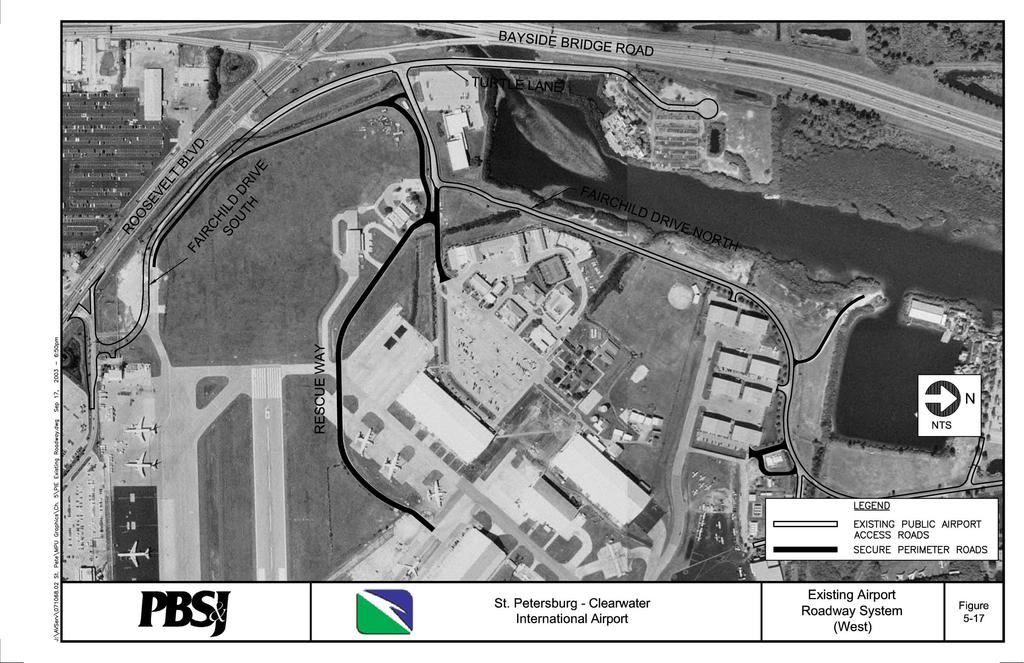
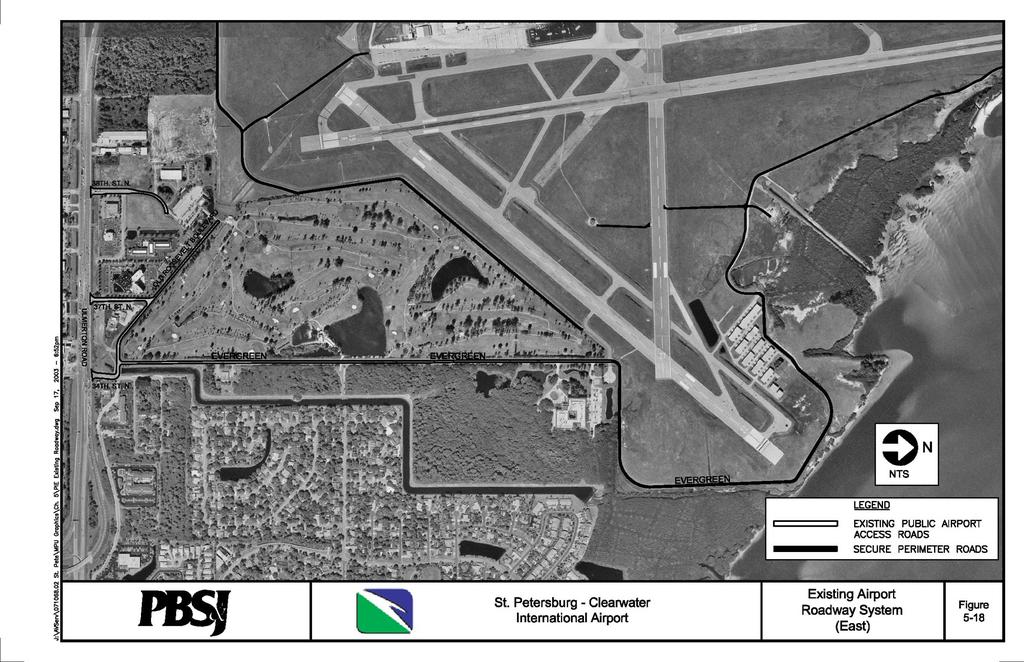
39 further exacerbated by the traffic light at the Airport Parkway s northern terminal entrance, as the two signalized intersections are relatively close to one another. Pinellas County Public Works Department, recognizing the traffic backups on Roosevelt, has designed a realignment of Fairchild Drive that will eliminate the access controlled intersection at Fairchild and Roosevelt Boulevard, and reroute Fairchild Drive on Airport property to the south parallel to Roosevelt Boulevard, establishing an intersection with Airport Parkway. Traffic will still be able to access the west- and north-side facilities from the original Fairchild Drive entrance, which will become one-way onto the airport, but all traffic exiting will be routed to Airport Parkway. Mixing Fairchild traffic with airport terminal traffic on Airport Parkway will result in backups on Fairchild Drive as well as congestion in the terminal area. See Figure On the Airport s east side, 34 th Street North, also known as Evergreen Avenue, provides vehicular access from Ulmerton Road to the Moog Facility and T-Hangar complex north of Runways 4-22 and This two-way, two-lane roadway has relatively light traffic, and will prove to be adequate for access to the T-hangars. However, with the Airport s recent acquirement of the Airco Golf Course, development plans for the golf course, which is accessible by Old Roosevelt Boulevard, may require re-evaluation of access to the Airport s Westside. See Figure Service Roads Service roads are dedicated access roads divided into two categories: those that are non-secure and those that are restricted. Non-secure service roads typically allow access to non-secure areas of an airport, generally for deliveries of goods and services such as fuel, cargo, and the like. At PIE, there are non-dedicated, non-secure service roads functioning as primary access roads, providing this type of accessibility. Secure service roads are those that only badged airport personnel can use. This type of road allows access to the secured airside areas of the Airport such as perimeter roads. PIE has one continuous perimeter road used for security patrols and access to NAVAIDS and other equipment and facilities located on airside. (See Figures 5-17 and 5-18.) Secure service roads should be paved or otherwise stabilized for ease of maintenance and durability. Capacity is not an issue as use and access is limited. 2/19/04 St. Petersburg-Clearwater International Airport Master Plan Update 5-39
40
41
The purpose of this Demand/Capacity. The airfield configuration for SPG. Methods for determining airport AIRPORT DEMAND CAPACITY. Runway Configuration
 Chapter 4 Page 65 AIRPORT DEMAND CAPACITY The purpose of this Demand/Capacity Analysis is to examine the capability of the Albert Whitted Airport (SPG) to meet the needs of its users. In doing so, this
According to FAA Advisory Circular 150/5060-5, Airport Capacity and Delay, the elements that affect airfield capacity include:
 4.1 INTRODUCTION The previous chapters have described the existing facilities and provided planning guidelines as well as a forecast of demand for aviation activity at North Perry Airport. The demand/capacity
CHAPTER 4 DEMAND/CAPACITY ANALYSIS
 CHAPTER DEMAND/CAPACITY ANALYSIS INTRODUCTION The demand/capacity analysis examines the capability of the airfield system at Blue Grass Airport (LEX) to address existing levels of activity as well as determine
Appendix B Ultimate Airport Capacity and Delay Simulation Modeling Analysis
 Appendix B ULTIMATE AIRPORT CAPACITY & DELAY SIMULATION MODELING ANALYSIS B TABLE OF CONTENTS EXHIBITS TABLES B.1 Introduction... 1 B.2 Simulation Modeling Assumption and Methodology... 4 B.2.1 Runway
1.1.3 Taxiways. Figure 1-15: Taxiway Data. DRAFT Inventory TYPICAL PAVEMENT CROSS-SECTION LIGHTING TYPE LENGTH (FEET) WIDTH (FEET) LIGHTING CONDITION
 WIDTH (FEET) LIGHTING CONDITION") 1.1.3 Taxiways EWN has an extensive network of taxiways and taxilanes connecting the terminal, air cargo, and general aviation areas with the runways as listed in Figure 1-15. A 50-foot wide parallel taxiway
1.1.3 Taxiways EWN has an extensive network of taxiways and taxilanes connecting the terminal, air cargo, and general aviation areas with the runways as listed in Figure 1-15. A 50-foot wide parallel taxiway
CATCODE ] CATCODE
![CATCODE ] CATCODE](/thumbs/82/85644630.jpg "CATCODE ] CATCODE") Runways. FAC: 1111 CATCODE: 111111 OPR: AFCEC/COS OCR: AF/A3O-A 1.1. Description. The runway is the paved surface provided for normal aircraft landings and take offs. Runways are classified as either Class
Runways. FAC: 1111 CATCODE: 111111 OPR: AFCEC/COS OCR: AF/A3O-A 1.1. Description. The runway is the paved surface provided for normal aircraft landings and take offs. Runways are classified as either Class
Runway Length Analysis Prescott Municipal Airport
 APPENDIX 2 Runway Length Analysis Prescott Municipal Airport May 11, 2009 Version 2 (draft) Table of Contents Introduction... 1-1 Section 1 Purpose & Need... 1-2 Section 2 Design Standards...1-3 Section
INTRODUCTION. General
 CHAPTER FOUR Airfield Demand/Capacity Analysis & Facility Requirements INTRODUCTION A key step in the master plan process is the determination of airport facility requirements to allow airside and landside
1.0 Project Background Mission Statement and Goals Objectives of this Sustainable Master Plan
 TABLE OF CONTENTS CHAPTER 1 INTRODUCTION 10 Project Background 1-1 11 Mission Statement and Goals 1-1 12 Objectives of this Sustainable Master Plan 1-2 CHAPTER 2 INVENTORY 20 Airport Background 2-1 201
Washington Dulles International Airport (IAD) Aircraft Noise Contour Map Update
 Aircraft Noise Contour Map Update") Washington Dulles International Airport (IAD) Aircraft Noise Contour Map Update Ultimate ASV, Runway Use and Flight Tracks 4th Working Group Briefing 8/13/18 Meeting Purpose Discuss Public Workshop input
Washington Dulles International Airport (IAD) Aircraft Noise Contour Map Update Ultimate ASV, Runway Use and Flight Tracks 4th Working Group Briefing 8/13/18 Meeting Purpose Discuss Public Workshop input
IDENTIFICATION AND EVALUATION OF ALTERNATIVES ST. PETERSBURG-CLEARWATER INTERNATIONAL AIRPORT
 IDENTIFICATION AND EVALUATION OF ALTERNATIVES ST. PETERSBURG-CLEARWATER INTERNATIONAL AIRPORT 7 7.1 GENERAL The primary objective of this chapter is to evaluate potential development alternatives and identify
Executive Summary. MASTER PLAN UPDATE Fort Collins-Loveland Municipal Airport
 Executive Summary MASTER PLAN UPDATE Fort Collins-Loveland Municipal Airport As a general aviation and commercial service airport, Fort Collins- Loveland Municipal Airport serves as an important niche
3.1 Facility Requirements Overview Airfield Facility Requirements... 1
 Table of Contents 3.1 Overview... 1 3.2 Airfield... 1 Airspace Capacity...1 Airside Capacity... 2 Aircraft Mix Index... 3 Arrivals Percentage... 4 Touch-and-Go Percentage... 4 Taxiway Access Factors...
Hartford-Brainard Airport Potential Runway Closure White Paper
 Hartford-Brainard Airport Potential Runway 11-29 Closure White Paper June 2012 In recent years there has been discussion regarding the necessity of Runway 11-29 to the Hartford- Brainard Airport (HFD)
Chapter 5 Facility Requirements
 Chapter 5 Facility Requirements 5.0 INTRODUCTION The Facility Requirements chapter of this Sustainable Master Plan Update describes airside and landside facilities, which are needed to accommodate existing
Source: Chippewa Valley Regional Airport ASOS, Period of Record
 Chapter 1 Inventory Runway wind coverage is the percentage of time a runway can be used without exceeding allowable crosswind velocities. Allowable crosswind velocities vary depending on aircraft size
Table of Contents. Overview Objectives Key Issues Process...1-3
 Table of Contents Chapter One Introduction Overview...1-1 Objectives...1-1 Key Issues...1-2 Process...1-3 Chapter Two Inventory of Existing Conditions Airport Setting...2-1 Locale...2-1 Airport Surroundings...2-5
USE OF RADAR IN THE APPROACH CONTROL SERVICE
 USE OF RADAR IN THE APPROACH CONTROL SERVICE 1. Introduction The indications presented on the ATS surveillance system named radar may be used to perform the aerodrome, approach and en-route control service:
Chapter 5 Facility Requirements
 Chapter 5 Facility Requirements 50 INTRODUCTION This chapter describes the airside and landside facility requirements necessary to accommodate existing and forecasted demand in accordance with Federal
FORT LAUDERDALE-HOLLYWOOD INTERNATIONAL AIRPORT ENVIRONMENTAL IMPACT STATEMENT DRAFT
 D.3 RUNWAY LENGTH ANALYSIS Appendix D Purpose and Need THIS PAGE INTENTIONALLY LEFT BLANK Appendix D Purpose and Need APPENDIX D.3 AIRFIELD GEOMETRIC REQUIREMENTS This information provided in this appendix
APPENDIX D MSP Airfield Simulation Analysis
 APPENDIX D MSP Airfield Simulation Analysis This page is left intentionally blank. MSP Airfield Simulation Analysis Technical Report Prepared by: HNTB November 2011 2020 Improvements Environmental Assessment/
Draft Concept Alternatives Analysis for the Inaugural Airport Program September 2005
 Draft Concept Alternatives Analysis for the Inaugural Airport Program September 2005 Section 1 - Introduction This report describes the development and analysis of concept alternatives that would accommodate
STAFF REPORT. Airport Land Use Plan Consistency Review: Santa Barbara Airport Master Plan. MEETING DATE: November 19, 2015 AGENDA ITEM: 7D
 STAFF REPORT SUBJECT: Airport Land Use Plan Consistency Review: Santa Barbara Airport Master Plan MEETING DATE: AGENDA ITEM: 7D STAFF CONTACT: Peter Imhof, Andrew Orfila RECOMMENDATION: Adopt findings
Draft Concept Alternatives Analysis for the Inaugural Airport Program September 2005
 Draft Concept Alternatives Analysis for the Inaugural Airport Program September 2005 Section 3 - Refinement of the Ultimate Airfield Concept Using the Base Concept identified in Section 2, IDOT re-examined
The demand/capacity analysis was performed utilizing Federal Aviation Administration (FAA) publications, including the following:
 publications, including the following:") Chapter Three To properly plan for the future of Monterey Regional Airport, it is necessary to examine the capacities of the key airport systems. This chapter uses the results of the forecasts prepared
Chapter Three To properly plan for the future of Monterey Regional Airport, it is necessary to examine the capacities of the key airport systems. This chapter uses the results of the forecasts prepared
STUDY WORK GROUP MEETING No. 3. November 29, 2016
 STUDY WORK GROUP MEETING No. 3 November 29, 2016 Agenda Welcome and introductions Update project schedule Brief overview of previous SWG meeting Update on aviation forecasts Introduction to airfield demand/capacity
Appendix C AIRPORT LAYOUT PLANS
 Appendix C AIRPORT LAYOUT PLANS Appendix C AIRPORT LAYOUT PLANS Airport Master Plan Santa Barbara Airport As part of this Airport Master Plan, the Federal Aviation Administration (FAA) requires the development
Airport Master Plan for Montgomery-Gibbs Executive Airport PAC Meeting #3
 Airport Master Plan for Montgomery-Gibbs Executive Airport PAC Meeting #3 Agenda > Introductions > Public Meetings Overview > Working Paper 3 - Facility Requirements > Working Paper 4 - Environmental Baseline
CHAPTER 1 EXECUTIVE SUMMARY
 CHAPTER 1 EXECUTIVE SUMMARY 1 1 EXECUTIVE SUMMARY INTRODUCTION William R. Fairchild International Airport (CLM) is located approximately three miles west of the city of Port Angeles, Washington. The airport
1 DRAFT. General Aviation Terminal Services Aircraft Hangars Aircraft Parking Aprons Airport Support Facilities
 To properly plan for improvements at Dallas Executive Airport, it is necessary to translate forecast aviation demand into the specific types and quantities of facilities that can adequately serve the demand.
CHAPTER 5 - FACILITY REQUIREMENTS
 CHAPTER 5 - FACILITY REQUIREMENTS This chapter identifies the requirements for airfield and landside facilities to accommodate the forecast demand level. Facility requirements have been developed for the
APPENDIX X: RUNWAY LENGTH ANALYSIS
 APPENDIX X: RUNWAY LENGTH ANALYSIS Purpose For this Airport Master Plan study, the FAA has requested a runway length analysis to be completed to current FAA AC 150/5325-4B, Runway Length Requirements for
Las Vegas McCarran International Airport. Capacity Enhancement Plan
 Las Vegas McCarran International Airport Capacity Enhancement Plan Las Vegas McCarran International Airport Capacity Enhancement Plan September 1994 Prepared jointly by the U.S. Department of Transportation,
Prepared By: Mead & Hunt, Inc Port Lansing Road Lansing, MI 48906
 Master Plan The preparation of this document was financed in part through a planning grant from the Federal Aviation Administration (FAA) as provided under Section 505 of the Airport and Airway Improvement
DEPARTMENT: CIVIL ENGINEERING SEMESTER: III SUBJECT CODE / Name: CE2303/ Railway, Airport and Harbors Engineering 2 MARK QUESTIONS AND ANSWERS
 DEPARTMENT: CIVIL ENGINEERING SEMESTER: III SUBJECT CODE / Name: CE2303/ Railway, Airport and Harbors Engineering 2 MARK QUESTIONS AND ANSWERS 1.Define wind Coverage (AUC NOV/DEC 2010),(AUC NOV/DEC 2011)
Chapter 6. Nonradar. Section 1. General DISTANCE
 12/10/15 JO 7110.65W Chapter 6. Nonradar Section 1. General 6 1 1. DISTANCE Use mileage based (DME and/or ATD) procedures and minima only when direct pilot/controller communications are maintained. FIG
Airport Master Plan for. Brown Field Municipal Airport PAC Meeting #3
 Airport Master Plan for Brown Field Municipal Airport PAC Meeting #3 Public Meeting #1 > 8/24/17 from 5:30 to 8:00 pm > 41 attendees signed-in > Comments: > EAA area > Environmental constraints > Focus
Airport Master Plan. Brookings Regional Airport. Runway Runway 17-35
 Runway 17-35 Airport Master Plan Runway 12-30 Brookings Regional Airport Table of Contents Table of Contents Chapter 1: Master Plan Goals... 1-1 1.1. Introduction... 1 1.2. Objective 1 Identify improvements
Key Purpose & Need Issues
 Key Purpose & Need Issues Efficiently meet demand through the 2025 planning horizon 864,000+ annual operations 180-200 operations during peak daytime hours Balance peak hour arrival/departure capability
PORT OF PORTLAND. Chapter Four AVIATION FACILITY REQUIREMENTS
 PORT OF PORTLAND Chapter Four AVIATION FACILITY REQUIREMENTS CHAPTER FOUR PORT OF PORTLAND AVIATION FACILITY REQUIREMENTS In this chapter, existing components of the airport are evaluated to identify the
FACILITY REQUIREMENTS
 FACILITY REQUIREMENTS In order to ensure that Bradley International Airport (BDL) is capable of supporting the expected increase in passenger traffic, care must be taken to ensure that the recommendations
Chapter 3. Demand/Capacity & Facility Requirements
 Chapter 3. Demand/Capacity & Facility Requirements Chapter 3. DEMAND/CAPACITY & FACILITY REQUIREMENTS This chapter provides an assessment of future airport development requirements based upon the forecasts
Chapter III - Demand/Capacity and Facility Requirements
 Chapter III - Demand/Capacity and Facility Requirements The facility requirements identified in this chapter are summarized on Exhibit III.1. The future requirements serve to determine which airport facilities
DEVELOPMENT OF TOE MIDFIELD TERMINAL IROJECT CAPACITY ENHANCEMENT REPORT DEPARTMENT OF AVIATION TOM FOERSTER CHAIRMAN BARBARA HAFER COMMISSIONER
 PETE FLAHERTY COMMISSIONER TOM FOERSTER CHAIRMAN DEPARTMENT OF AVIATION BARBARA HAFER COMMISSIONER STEPHEN A. GEORGE DIRECTOR ROOM M 134, TERMINAL BUILDING GREATER PITTSBURGH INTERNATIONAL AIRPORT PITTSBURGH,
1. Background and Proposed Action
 1. Background and Proposed Action This chapter describes Hillsboro Airport and the planning background for the proposed project. The Port of Portland (the Port) is the sponsor for the Hillsboro Airport
DRAFT MASTER PLAN UPDATE
 DRAFT MASTER PLAN UPDATE CHAPTER VI: AIRPORT LAYOUT PLAN NARRATIVE DRAFT REPORT APRIL 2017 PREPARED BY: Table of Contents WESTCHESTER COUNTY AIRPORT 6 AIRPORT LAYOUT PLAN NARRATIVE REPORT... 6-1 6.1 AGIS
Reliever Airports: NOISE ABATEMENT PLAN Flying Cloud Airport (FCM)
") Reliever Airports: NOISE ABATEMENT PLAN Flying Cloud Airport (FCM) INTRODUCTION The Noise Abatement Plan (FCM Plan) for the Flying Cloud Airport has been prepared in recognition of the need to make the
Reliever Airports: NOISE ABATEMENT PLAN Flying Cloud Airport (FCM) INTRODUCTION The Noise Abatement Plan (FCM Plan) for the Flying Cloud Airport has been prepared in recognition of the need to make the
Facility Requirements
 4. This chapter presents the airside and landside facility requirements necessary to accommodate existing and forecasted demand at Erie International Airport (ERI or the Airport) in accordance with Federal
Special Aircraft Arrival and Departure Procedures in Effect Noon Wednesday, Nov 4 th through Noon Sunday, Nov 8 th AREA OVERVIEW
 Special Aircraft Arrival and Departure Procedures in Effect Noon Wednesday, Nov 4 th through Noon Sunday, Nov 8 th AREA OVERVIEW AOPA is proud to present the 2009 Aviation Summit in Tampa Florida. This
Draft Concept Alternatives Analysis for the Inaugural Airport Program September 2005
 Section 10 Preferred Inaugural Airport Concept 10.0 Introduction The Preferred Inaugural Airport Concept for SSA was developed by adding the preferred support/ancillary facilities selected in Section 9
3.1 CRITICAL AIRCRAFT
 The purpose of the demand capacity analysis is to determine an airport s capacity and its ability to support the forecasted aviation demand. Facility requirements identify development, replacement, and/or
C > Capacity Analysis and Facility Requirements
 Buchanan Field Buchanan Field Airport Master Planning Program C. CAPACITY ANALYSIS & FACILITY REQUIREMENTS C > Capacity Analysis and Facility Requirements INTRODUCTION. The capacity of an airfield is primarily
Agenda: SASP SAC Meeting 3
 Agenda: SASP SAC Meeting 3 Date: 04/12/18 Public Involvement Plan Update Defining the System Recommended Classifications Discussion Break Review current system Outreach what we heard Proposed changes Classification
FACILITY REQUIREMENTS SUMMARY OF KEY ISSUES OVERVIEW
 FACILITY REQUIREMENTS SUMMARY OF KEY ISSUES OVERVIEW This summary is intended to provide a brief overview of the key issues associated with conformance to FAA standards at Methow Valley State Airport.
Planning Horizon Activity Levels Airfield Capacity and Delay Airport Physical Planning Criteria Airfield and Landside Facility Requirements
 Proper airport planning requires the translation of forecast aviation demand into the specific types and quantities of facilities that can adequately serve the identified demand. This chapter will analyze
Capacity Analysis and Facility Requirements
 Capacity Analysis and Facility Requirements Introduction The capacity analysis for Paine Field is composed of two distinct elements: the ability of airport facilities to accommodate existing and projected
Tallahassee International Airport Master Plan. Technical Advisory Committee Meeting #2 October 19, 2016
 Tallahassee International Airport Master Plan Technical Advisory Committee Meeting #2 October 19, 2016 Agenda Welcome / Introductions Master Plan Process and Project Status Forecast of Aviation Demand
B GEORGIA INFRASTRUCTURE REPORT CARD AVIATION RECOMMENDATIONS DEFINITION OF THE ISSUE. Plan and Fund for the Future:
 2014 GEORGIA INFRASTRUCTURE REPORT CARD B + RECOMMENDATIONS Plan and Fund for the Future: While the system continues to enjoy excess capacity and increased accessibility it still needs continued focus
Document prepared by MnDOT Office of Aeronautics and HNTB Corporation. MINNESOTA GO STATE AVIATION SYSTEM PLAN
 LAST UPDATE JULY 2013 Acknowledgements The preparation of this document was financed in part by a grant from the Federal Aviation Administration (Project No: 3-27-0000-07-10), with the financial support
This section sets forth all Los Angeles World Airports (LAWA) noise abatement procedures, restrictions, and regulations involving aircraft operations.
 noise abatement procedures, restrictions, and regulations involving aircraft operations.") This section sets forth all Los Angeles World Airports (LAWA) noise abatement procedures, restrictions, and regulations involving aircraft operations. 13.1. Aircraft Noise Abatement 13.1.1. All aircraft
This section sets forth all Los Angeles World Airports (LAWA) noise abatement procedures, restrictions, and regulations involving aircraft operations. 13.1. Aircraft Noise Abatement 13.1.1. All aircraft
Table of Contents Facility Requirements Overview Airport Capacity and Delay Analysis... 1
 Table of Contents Table of Contents... 2 3.1 Overview... 1 3.2 Airport Capacity and Delay Analysis... 1 Airspace Capacity... 1 Aircraft Mix Index... 3 Arrivals Percentage... 3 Touch-and-Go Percentage...
Addendum - Airport Development Alternatives (Chapter 6)
") Bowers Field Addendum - Airport Development Alternatives (Chapter 6) This addendum to the Airport Development Alternatives chapter includes the preferred airside development alternative and the preliminary
Bowers Field Addendum - Airport Development Alternatives (Chapter 6) This addendum to the Airport Development Alternatives chapter includes the preferred airside development alternative and the preliminary
Merritt Island Airport
 TABLE OF CONTENTS CHAPTER 1 INTRODUCTION... 1-1 INTRODUCTION AND PROJECT OVERVIEW... 1-1 General Guidelines... 1-1 Prior Planning Documentation... 1-2 Key Issues... 1-2 Goals and Objectives... 1-2 Regulatory
4. Demand/Capacity Assessment and Facility Requirements
 4. This chapter presents an evaluation of the existing airfield facilities, buildings, and other facilities at the Airport and an assessment of their potential use under the demand scenarios defined for
AIRSIDE CAPACITY AND FACILITY REQUIREMENTS
 AIRSIDE CAPACITY AND FACILITY REQUIREMENTS This Section investigates the capacity of the airport, its ability to meet current demand, and the facilities required to meet forecasted needs as established
TABLE OF CONTENTS. General Study Objectives Public Involvement Issues to Be Resolved
 TABLE OF CONTENTS Description Page Number LIST OF ACRONYMS... a CHAPTER ONE INTRODUCTION General... 1-1 Study Objectives... 1-1 Public Involvement... 1-2 Issues to Be Resolved... 1-2 CHAPTER TWO EXISTING
Milton. PeterPrinceAirportislocatedinSantaRosaCounty, approximatelythreemileseastofmilton.
 Milton GeneralAviationAirport PeterPrinceAirportislocatedinSantaRosaCounty, approximatelythreemileseastofmilton. Existing Facilities Peter Prince Airport is served by one runway, Runway 18/36, 3,700 feet
AIRFIELD CAPACITY AND FACILITY REQUIREMENTS
 CHAPTER FOUR: AIRFIELD CAPACITY AND FACILITY REQUIREMENTS 4.1 INTRODUCTION A key step in the Airport Master Plan Update (AMPU) process is determining future requirements for airport facilities that will
Airport Obstruction Standards
 Airport Obstruction Standards Dr. Antonio Trani Department of Civil and Environmental Engineering Virginia Tech Outline of this Presentation Obstructions to navigation around airports Discussion of Federal
APPENDIX H 2022 BASELINE NOISE EXPOSURE CONTOUR
 APPENDIX H 2022 BASELINE NOISE EXPOSURE CONTOUR This appendix sets forth the detailed input data that was used to prepare noise exposure contours for 2022 Baseline conditions. H.1 DATA SOURCES AND ASSUMPTIONS
AIRPORT MASTER PLAN UPDATE
 AIRPORT MASTER PLAN UPDATE PENSACOLA INTERNATIONAL AIRPORT Technical Advisory Committee Meeting #2 June 20, 2017 Agenda» Introduction» Facility Requirements Airside Terminal Landside General Aviation Cargo
a. Aeronautical charts DID THIS IN LESSON 2
 AIRMAN CERTIFICATION STANDARDS: REMOTE PILOT SMALL: You will know and be able to explain in writing or oral form the below tasks regarding AIRPORT OPERATIONS Task References Objective Task B. Airport Operations
CHAPTER 5 SEPARATION METHODS AND MINIMA
 CHAPTER 5 SEPARATION METHODS AND MINIMA 5.1 Provision for the separation of controlled traffic 5.1.1 Vertical or horizontal separation shall be provided: a) between IFR flights in Class D and E airspaces
MASTER PLAN UPDATE WORKING PAPER NO. 3. Demand/Capacity Analysis and Facility Requirements. March 18, 2013
 MASTER PLAN UPDATE WORKING PAPER NO. 3 Demand/Capacity Analysis and Facility Requirements March 18, 2013 Contents 4 Demand/Capacity Analysis and Facility Requirements... 4 1 4.1 Summary of Aviation Demand
March 2016 Safety Meeting
 March 2016 Safety Meeting AC 61 98C Subject: Currency Requirements and Guidance for the Flight Review and Instrument Proficiency Check Date: 11/20/15 AC No: 61-98C Initiated by: AFS-800 Supercedes: AC
CHAPTER 1 INTRODUCTION AND BACKGROUND
 CHAPTER 1 INTRODUCTION AND BACKGROUND An Environmental Assessment (EA) evaluates the effects of a proposed Federal action on the surrounding environment and is prepared in compliance with the National
DRAFT FINAL REPORT AIRPORT MASTER PLAN. Rifle Garfield County Airport Revised May 15, 2014
 DRAFT FINAL REPORT AIRPORT MASTER PLAN Rifle Garfield County Airport Revised May 15, 2014 As required by Paragraph 425.B(4) of FAA Order 5100.38C, Airport Improvement Program (AIP) Handbook: The preparation
Facility Requirements
 C H A P T E R T H R E E Facility Requirements 3.0 OVERVIEW Airport planning for facility requirements is based upon addressing any existing issues and accommodating the probable demand that may occur over
BNA Master Plan Update Community Advisory Committee Meeting No. 5
 A Six Sigma Organization BNA Master Plan Update Community Advisory Committee Meeting No. 5 September 19, 2012 Introductions MNAA Staff RW Armstrong Team Albersman & Armstrong, Ltd. Atkins North America,
PART 210 NOISE ABATEMENT AND RUNWAY PROCEDURES NOISE ABATEMENT AND PREFERENTIAL RUNWAY USE PROCEDURES
 PART 210 NOISE ABATEMENT AND RUNWAY PROCEDURES 210.01 NOISE ABATEMENT AND PREFERENTIAL RUNWAY USE PROCEDURES 210.01-1 Establishment Of Procedures; FAA Guidelines This Rule establishes preferential runway
Study Committee Meeting. September 2015
 W ki P T / Working Paper Two/ Study Committee Meeting September 2015 Agenda Introductions and Opening Comments Project Overview, Process, and Schedule Review Materials from Working Paper Two Comments,
MetroAir Virtual Airlines
 MetroAir Virtual Airlines NAVIGATION BASICS V 1.0 NOT FOR REAL WORLD AVIATION GETTING STARTED 2 P a g e Having a good understanding of navigation is critical when you fly online the VATSIM network. ATC
4.0 AIRFIELD CAPACITY & FACILITY REQUIREMENTS
 4.0 AIRFIELD CAPACITY & FACILITY REQUIREMENTS A key step in the Airport Master Plan (AMP) process is determining future requirements for airport facilities that will allow for airside and landside development
CHAPTER 1 BACKGROUND AND PROPOSED ACTION
 CHAPTER 1 BACKGROUND AND PROPOSED ACTION 1.0 INTRODUCTION An Environmental Assessment (EA) evaluates the effects of a proposed Federal action on the surrounding environment and is prepared in compliance
NOISE ABATEMENT PROCEDURES
 1. Introduction NOISE ABATEMENT PROCEDURES Many airports today impose restrictions on aircraft movements. These include: Curfew time Maximum permitted noise levels Noise surcharges Engine run up restrictions
Chapter Six ALP Drawings. Tacoma Narrows Airport. Master Plan Update
 Chapter Six ALP Drawings Master Plan Update The master planning process for the (Airport) has evolved through efforts in the previous chapters to analyze future aviation demand, establish airside and landside
Table of Contents. List of Tables. Cincinnati/Northern Kentucky International Airport 2035 Master Plan Update
 Table of Contents 7.1. Airport Layout Plan (Existing Conditions)... 2 7.2. Airport Layout Plan (Future Conditions)... 3 7.3. Technical Data Sheet... 5 7.4. Commercial Terminal Area Drawing... 5 7.5. East
IFR SEPARATION USING RADAR
 IFR SEPARATION USING RADAR 1. Introduction When flying IFR inside controlled airspace, air traffic controllers either providing a service to an aircraft under their control or to another controller s traffic,
Chapter 4 Airport Facility Requirements
 Chapter 4 Airport Facility Requirements Introduction CHAPTER 4 AIRPORT FACILITY REQUIREMENTS MAY 2013-1 Organization of Materials CHAPTER 4 AIRPORT FACILITY REQUIREMENTS MAY 2013-2 RPZ - ROAD RPZ - NON-AIRPORT
Glossary. Part I Acronyms/Data Terminology. AIFSS -- Automated International Flight Service Station.
 Glossary Part I Acronyms/Data Terminology AC -- Air Carrier. AFSS -- Automated Flight Service Station. AIFSS -- Automated International Flight Service Station. ARTCC -- Air Route Traffic Control Center.
Norfolk International Airport
 Norfolk International Airport Master Plan Update Technical Advisory Committee Meeting #1 Community Advisory Committee Meeting #1 January 24, 2018 Agenda Project Background Introductions Overview of Airport
IFR SEPARATION WITHOUT RADAR
 1. Introduction IFR SEPARATION WITHOUT RADAR When flying IFR inside controlled airspace, air traffic controllers either providing a service to an aircraft under their control or to another controller s
PLAN Anoka County - Blaine Airport
 Reliever Airports: NOISE ABATEMENT PLAN Anoka County - Blaine Airport INTRODUCTION The noise abatement plan for the Anoka County-Blaine Airport was prepared in recognition of the need to make the airport
Dr. Antonio A. Trani Professor of Civil Engineering Virginia Polytechnic Institute and State University. Spring 2015 Blacksburg, Virginia
 CEE 4674 Airport Planning and Design Runway Length Calculations Addendum 1 Dr. Antonio A. Trani Professor of Civil Engineering Virginia Polytechnic Institute and State University Spring 2015 Blacksburg,
CHAPTER 3 FACILITY REQUIREMENTS
 CHAPTER 3 FACILITY REQUIREMENTS 3.1 INTRODUCTION To properly plan for the future requirements of Newport News/Williamsburg International Airport, it is necessary to translate the forecasts of aviation
SIMMOD Simulation Airfield and Airspace Simulation Report. Oakland International Airport Master Plan Preparation Report. Revised: January 6, 2006
 Table of Contents SIMMOD Simulation Airfield and Airspace Simulation Report Oakland International Airport Master Plan Preparation Report Revised: January 6, 2006 Produced For: 1. Simmod PRO! Description...
Chapter 5. Facility Requirements
 Chapter 5 Facility Requirements Chapter 5 Facility Requirements INTRODUCTION The Baseline Forecast was used to determine facility requirements. Chapter 4 produced a forecast of traffic volumes expected
St. Paul Downtown Airport (STP)
") Reliever Airports: NOISE ABATEMENT PLAN St. Paul Downtown Airport (STP) 1 INTRODUCTION The noise abatement plan for the St. Paul Downtown Airport (STP) was prepared in recognition of the need to make the
Reliever Airports: NOISE ABATEMENT PLAN St. Paul Downtown Airport (STP) 1 INTRODUCTION The noise abatement plan for the St. Paul Downtown Airport (STP) was prepared in recognition of the need to make the
Preliminary Findings of Proposed Alternative
 Preliminary Findings of Proposed Alternative The attached drawing provides a schematic layout of the proposed alternative that will be discussed on July 27, 2010. A full report will follow and should be
SAN JOSÉ INTERNATIONAL AIRPORT
 SAN JOSÉ INTERNATIONAL AIRPORT NEAR-TERM TERMINAL CAPACITY ANALYSIS AIRPORT COMMISSION AUGUST 14, 2017 August 14, 2017 AGENDA 1. Forecast Review (with 14 MAP High Case) 2. Gate Requirements and Aircraft