Hawai i Air Service Overview August 2012
|
|
|
- Josephine Armstrong
- 6 years ago
- Views:
Transcription

1 Hawai i Air Service Overview August 2012
2 2 What Are The Big Issues?
 Struggling Carriers OCEANIA Business Model Changes New Markets 3 NORTH AMERICA Consolidation Low Fare Entry LATIN AMERICA Small Market Sizes")
3 Each Region Has Different Concerns EUROPE Need for Nonstop Struggling Carriers JAPAN Capacity Deficit Low Fare Revolution ASIA Catching the Wave (China) Absorbing Capacity (Korea) Airline/Aircraft Fit (HK & SE Asia) Struggling Carriers OCEANIA Business Model Changes New Markets 3 NORTH AMERICA Consolidation Low Fare Entry LATIN AMERICA Small Market Sizes Potential
4 4 The Big Picture
5 The Global Airline Industry Remains Volatile Erratic energy prices equal instability. New business models are causing turmoil. Consolidation occurring through alliances and mergers. Rapid growth and instability in developing markets. Dramatic changes in Japan. Turmoil in Europe. Maturity & relative stability in the U.S. 5
6 6 Domestic Markets
7 The U.S. Domestic Market is Mature Effectively no growth in 2012 and into the future. Bankruptcies and consolidation have reduced the number of carriers and hubs. Carrier revenue performance has been strong. Driven by higher fares and new ancillary revenues. Low Cost Carrier (LCC) growth has stagnated. Rising energy costs have impacted industry economics. Some long haul flights are cost challenged. 7

8 Consolidation in the Domestic Market 83% of all passengers are now carried on just five airlines. Versus eight in Domestic Traffic Share By Carrier YE3Q06 vs. YE3Q12 YE3Q12 WN, 25% AA, 12% DL, 20% UA, 16% US, 10% B6 AS F9 YE3Q06 WN, 18% AA, 14% DL, 13% UA, 12% CO, 8% NW, 8% US, 7% HP B6 AS FLF9 0% 10% 20% 30% 40% 50% 60% 70% 80% 90% 100% Source: Diio Mi/T 100 8


9 Mainline Carriers Have Lost Their Grip Value carriers no longer shy away from large O&D markets. Value Carrier Enplanement Share New York City 1999: 7% 2011: 24% Boston 1999: 5% 2011: 40% Denver 1999: 8% 2011: 46% San Francisco 1999: 9% 2011: 24% Is Hawai i next??? 9 Source: Diio Mi/T 100
10 10 Hawai i Domestic Overview
11 Hawai i Mainland Traffic is Nearly Recovered Hawai'i Local Demand Changes By Domestic Market Sector (four quarter rolling total % change from 2001Q4 base) 60% 50% 40% 30% 20% 10% 0% (10%) (20%) (30%) (40%) 11,278 PDEW "Base" 18,763 PDEW "Base" 14,677 PDEW +30% 13,181 PDEW (30%) 16,760 PDEW +49% Mainland (PDEW = Passengers Daily Each Way ) Inter Island 17,588 PDEW (6%) 13,644 PDEW +21% 15,254 PDEW +35% 12,787 PDEW (32%) Inter Island Markets Mainland Mkts Source: Diio Mi, US DOT 10% Coupon Sample 11
12 20.0% 15.0% 10.0% 5.0% Aug 12 Dec 12 Apr 13 Apr 04 Aug 04 Dec 04 Apr 05 Aug 05 Dec 05 Apr 06 Aug 06 Dec 06 Apr 07 Aug 07 Dec 07 Apr 08 Aug 08 Dec 08 Apr 09 Aug 09 Dec 09 Apr 10 Aug 10 Dec 10 Apr 11 Aug 11 Dec 11 Apr Mainland Seat Capacity is Still Recovering Annualized Mainland Capacity Change (Seats) (rolling 12 month % change versus April, 2004) Impending Growth 0.0% 5.0% Source: Diio Mi T 100 flown seats 4/2004 4/2012; scheduled seats 5/2012 4/2013
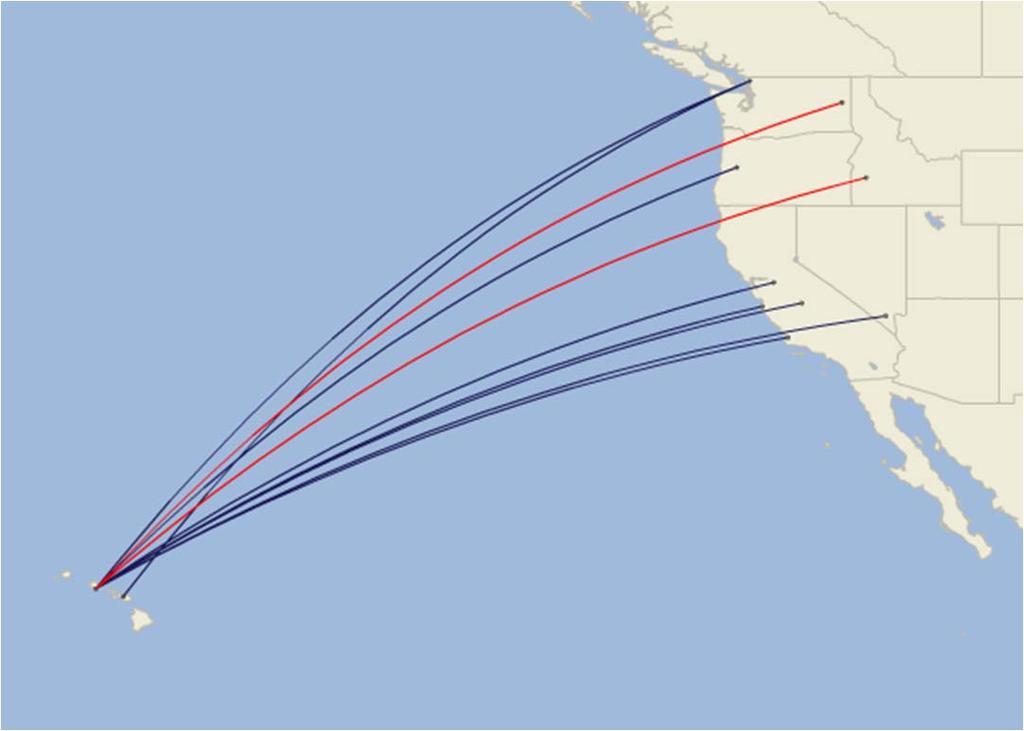
13 Nonstops to Big Island and Kaua i are Big Story 120.0% 100.0% 80.0% 60.0% Annualized Mainland Capacity Change (Seats By Airport) (rolling 12 month % change versus April, 2004) Kaua i (LIH) Big Island (KOA + ITO) 40.0% 20.0% 0.0% O ahu (HNL) Maui (OGG) 20.0% Apr 04 Sep 04 Feb 05 Jul 05 Dec 05 May 06 Oct 06 Mar 07 Aug 07 Jan 08 Jun 08 Nov 08 Apr 09 Sep 09 Feb 10 Jul 10 Dec 10 May 11 Oct 11 Mar 12 Aug 12 Jan 13 Source: Diio Mi, US DOT 10% Coupon Sample 13


14 14 Legacy Carrier Hawai i Ops Are Largely Stable


15 15 Alaska & Allegiant Are New Growth Players


16 Hawaiian Airlines is an Unparalleled Asset Hawaiian s vested interest in the market is an enormous advantage. Strengths: Quality brand. Inter Island dominance. Growing experience. Threats: Smaller global player. LCC growth. Lodging inventory. 16
17 Southwest Airlines Indications that Southwest is planning on entering the Hawai i market. Public statements from CEO. New s are ETOPS qualified. Working with unions. Carrier has recently slowed growth. Hawai i network will likely be focused on West Coast markets that currently have nonstop service. 17

18 Other Players The other two carriers to watch are Virgin America and JetBlue. Neither is capable of serving Hawai i today due to lack of A320 aircraft capability. New variants will address this issue. JetBlue just signed an expanded marketing relationship with Hawaiian. 18
19 19 The Inter Island Market
 Mokulele, 2% Inter Island Carrier Shares (YE 2012Q1) Pacific")

20 Shifting Inter Island Carrier Shares Inter Island Carrier Shares (YE 2007Q1) Mokulele, 2% Inter Island Carrier Shares (YE 2012Q1) Pacific Wings 1% Go!, 10% Aloha, 42% Hawaiian, 47% United 1% Pacific Wings, 1% Island Air, 7% Go!, 9% Hawaiian, 81% Source: Diio Mi, US DOT 10% Coupon Sample 20
21 Higher Costs = Higher Fares = Decreased Demand Hawai i Inter lsland Capacity Growth (Rolling 12 months Average Daily Outbound Seats) 37,000 36,000 35,000 34,000 33,000 32,000 31,000 30,000 29,000 28,000 27,000 26,000 25,000 24,000 23,000 22,000 Growth driven by HA Maui Hub Operation Jan 13 Aug 12 Mar 12 Oct 11 May 11 Dec 10 Jul 10 Feb 10 Sep 09 Apr 09 Nov 08 Jun 08 Jan 08 Aug 07 Mar 07 Oct 06 May 06 Dec 05 Jul 05 Feb 05 Sep 04 Apr 04 Source: Diio Mi, US DOT T
22 Inter Island Capacity by Island 60.0% 50.0% 40.0% 30.0% Maui (OGG + JHM) Big Island (KOA + ITO) 20.0% 10.0% O ahu (HNL) Jan 12 Apr 12 Jul 12 Oct 12 Jan 13 Apr 13 Apr 04 Jul 04 Oct 04 Jan 05 Apr 05 Jul 05 Oct 05 Jan 06 Apr 06 Jul 06 Oct 06 Jan 07 Apr 07 Jul 07 Oct 07 Jan 08 Apr 08 Jul 08 Oct 08 Jan 09 Apr 09 Jul 09 Oct 09 Jan 10 Apr 10 Jul 10 Oct 10 Jan 11 Apr 11 Jul 11 Oct Annualized Inter Island Capacity Change (Seats By Island) (rolling 12 month % change versus April, 2004) 0.0% 10.0% 20.0% 30.0% Kaua i (LIH)


 Avg.")
23 $80 $70 $60 $50 $40 $30 $20 $10 $ Q4 Inter Island Fares Have More Than Doubled Inter Island Revenue & Fare Growth (Rolling four quarters daily each way) +$36 each way $1.0 $0.9 $0.8 $0.7 $0.6 $0.5 $0.4 $0.3 $0.2 $0.1 $ Q Q Q Q Q Q Q Q Q Q Q Q Q Q Q Q Q Q Q Q4 23 RDEW (USD Millions) Avg. Fare Source: Diio Mi, US DOT 10% Coupon Sample
24 24 International Markets
25 Strong Growth Trend Across All Intl Markets 30.0% 25.0% Annualized International Capacity Change (Seats) (rolling 12 month % change versus April, 2004) 26.2% 20.0% 15.0% 14.6% 10.0% 5.0% 0.0% 5.0% 10.0% Apr 04 Sep 04 Feb 05 Jul 05 Dec 05 May 06 Oct 06 Mar 07 Aug 07 Jan 08 Jun 08 Nov 08 Apr 09 Sep 09 Feb 10 Jul 10 Dec 10 May 11 Oct 11 Mar 12 Aug 12 Jan % 20.0% 14.6% Source: Diio Mi T 100 flown seats 4/2004 1/2012; scheduled seats 2/2012 4/
26 26 Canada
27 Canada Capacity Approaching Decade High 50.0% 40.0% 30.0% 20.0% 10.0% Canada Annualized International Capacity Change (Seats) (rolling 12 month % change versus April, 2004) 39.4% 33.0% 0.0% 10.0% Apr 04 Sep 04 Feb 05 Jul 05 Dec 05 May 06 Oct 06 Mar 07 Aug 07 Jan 08 Jun 08 Nov 08 Apr 09 Sep 09 Feb 10 Jul 10 Dec 10 May 11 Oct 11 Mar 12 Aug 12 Jan % 13.7% Source: Diio Mi T 100 flown seats 4/2004 1/2012; scheduled seats 2/2012 4/

28 Air Canada & WestJet Compete heavily out of Vancouver. Air Canada operates a full service model. Fighting significant financial challenges. WestJet is an extremely successful low fare carrier. Operates less than ideal aircraft to Hawai i. 28
29 29 Japan
30 Japan Capacity Has Mostly Recovered 20.0% 15.0% 10.0% 5.0% Japan Annualized International Capacity Change (Seats) (rolling 12 month % change versus April, 2004) 15.3% 9.8% 0.0% 5.0% Apr 04 Sep 04 Feb 05 Jul 05 Dec 05 May 06 Oct 06 Mar 07 Aug 07 Jan 08 Jun 08 Nov 08 Apr 09 Sep 09 Feb 10 Jul 10 Dec 10 May 11 Oct 11 Mar 12 Aug 12 Jan % 15.0% 20.0% 14.9% Source: Diio Mi T 100 flown seats 4/2004 1/2012; scheduled seats 2/2012 4/


31 Japan Market is Now More Diverse Less dependent on JAL and Narita. Japan Hawai i Capacity Share 2007 vs JL, 32% DL, 31% HA, 15% CI, 8% NH, 8% UA, 6% 2007 JL, 48% DL, 25% CI, 6% NH, 6% UA, 15% 0% 10% 20% 30% 40% 50% 60% 70% 80% 90% 100% 31 Source: Diio FMi


32 Other Low Fare Carriers Have a Watchful Eye The Japan Hawai i market is a huge leisure market currently dominated by legacy type airlines. JetStar and Air Asia are in the process of setting up Japanbased regional operations. Skymark acquiring A380 and A330 aircraft. Hawai i will naturally become a market of interest for these carriers long haul affiliates. 32
33 33 China
34 34 China Revenue Is Up More Than 3x Since 09 China Hawai i Demand (Rolling 12 months daily each way) Passengers 0 Mar 09 Apr 09 May 09 Jun 09 Jul 09 Aug 09 Sep 09 Oct 09 Nov 09 Dec 09 Jan 10 Feb 10 Mar 10 Apr 10 May 10 Jun 10 Jul 10 Aug 10 Sep 10 Oct 10 Nov 10 Dec 10 Jan 11 Feb 11 Mar 11 Apr 11 May 11 Jun 11 Jul 11 Aug 11 Sep 11 Oct 11 Nov 11 Dec 11 Jan 12 Feb 12 Mar 12 Apr 12 May 12 Jun 12 Source: Diio FMi

35 Most Traffic Still Travels Via Seoul & Tokyo The majority of passengers traveling between China and Hawai i now transit via Seoul. 82% of Chinese visitors to Hawai i transited a non China gateway. ICN NRT Nonstop Other China Hawai i Demand By Gateway 24% 18% 15% 40% HND 3% 35 Source: Diio FMi


36 China Carrier Overview Chinese carriers have been reluctant to jump into the market for a few reasons: Visa issues. Aircraft constraints. First mover reluctance. China Eastern s entrance was an important first move. Dramatically different conversational tone in 2012 versus past years. Seasonal charter opportunities. 36
37 37 South Korea
38 Visa Waiver a Huge Success for Hawai i 400.0% 350.0% 300.0% 250.0% 200.0% 150.0% 100.0% 50.0% 0.0% 50.0% Apr 04 Sep 04 South Korea Annualized International Capacity Change (Seats) (rolling 12 month % change versus April, 2004) Feb 05 Jul 05 Dec 05 May 06 Oct 06 Mar 07 Aug 07 Jan 08 Jun 08 Nov 08 Apr 09 Sep 09 Feb 10 Jul 10 Dec 10 May 11 Oct % Mar 12 Aug 12 Jan 13 Source: Diio Mi T 100 flown seats 4/2004 1/2012; scheduled seats 2/2012 4/
39 South Korean Market Carrier Overview Revenue has kept pace with traffic growth. Seoul has become the primary transit point for China Hawai i traffic. Korean now at double daily service. New entrants Asiana and Hawaiian already going to daily service. 39
40 40 Taiwan


41 Taiwan Market Carrier Overview Taiwan revenue has been flat for several years. China Airlines current daily service is routed via Tokyo Narita. Impending U.S. visa waiver program likely to lead to substantial growth. 41
42 42 Hong Kong & Southeast Asia
43 43 Hawai i is Ripe for Hong Kong Capacity 70 Hong Kong Hawai i Demand (Rolling 12 months daily each way) Passengers 0 Mar 09 Apr 09 May 09 Jun 09 Jul 09 Aug 09 Sep 09 Oct 09 Nov 09 Dec 09 Jan 10 Feb 10 Mar 10 Apr 10 May 10 Jun 10 Jul 10 Aug 10 Sep 10 Oct 10 Nov 10 Dec 10 Jan 11 Feb 11 Mar 11 Apr 11 May 11 Jun 11 Jul 11 Aug 11 Sep 11 Oct 11 Nov 11 Dec 11 Jan 12 Feb 12 Mar 12 Apr 12 May 12 Jun 12 Source: Diio FMi


44 Hong Kong Market Carrier Overview Carrier related obstacles stand in the way of Hong Kong service. Cathay Pacific operates aircraft capable of operating to Honolulu. However, the carrier operates in the premium segment of the market. Dragonair and Hongkong Airlines are currently operationally precluded from serving Hawai i from Hong Kong. Opportunity for Hawaiian? 44


45 45 SE Asia Carrier Evaluation & Recruitment
46 46 Oceania
47 Oceania Capacity at Record High and Climbing 40.0% 30.0% 20.0% 10.0% Oceania Annualized International Capacity Change (Seats) (rolling 12 month % change versus April, 2004) 14.1% 34.6% 0.0% 10.0% 20.0% Apr 04 Sep 04 Feb 05 Jul 05 Dec 05 May 06 Oct 06 Mar 07 Aug 07 Jan 08 Jun 08 Nov 08 Apr 09 Sep 09 Feb 10 Jul 10 Dec 10 May 11 Oct 11 Mar 12 Aug 12 Jan % 40.0% 50.0% 42.1% Source: Diio Mi T 100 flown seats 4/2004 1/2012; scheduled seats 2/2012 4/

48 Oceania Market Carrier Overview Until now, the Oceania Hawai i market has been concentrated at Sydney. Hawaiian adds Brisbane in November 2012 and Auckland in March JetStar adds Melbourne in December
49 49 International Opportunities
50 Opportunities Are Focused On The Pacific Rim Bang for the buck is greatest in markets reachable nonstop. 4,500 4,000 3,950 Top International Markets By Daily Passengers Each Way (ranked for period YE March, 2012) 3,500 3,000 2,500 2,000 1,500 1,214 1, Source: Diio FMi

51 Opportunities Will be Driven By Fleet Growth Asia/Pacific growth opportunities will be driven by fleet growth. Boeing forecasts 11,450 new airplanes will be delivered in the region by

52 Aircraft Range From HNL Economic factors, along with aircraft capability, limit the markets airlines will choose to deploy aircraft in. 6,000sm 767 A330 7,500sm A350 ETOPS Restrictions Crew Time Fuel Price Aircraft Configuration Aircraft Value vs. Opportunity 52


53 Increasing Premium Traffic is an Important Goal Global competition is increasing and geographic isolation does Hawai i few favors in terms of aircraft economics. Building and retaining a premium airline revenue base is vital to ensuring continued growth. Fewer frequent flyer awards. More business, meeting and convention travel. 53
54 54 Moving Forward

55 Moving Forward Hawaiian Airlines is a precious resource. Stability in the Inter Island market has empowered the carrier to expand internationally. Mainland market growth will likely be driven by newer entrants like Alaska, Allegiant, and others. The most significant growth potential lies in Asia/Pacific markets reachable by nonstop flights. Oceania, China, Taiwan, Korea and Japan. Asian airlines are GROWING. 55

56 Questions? Brad DiFiore Managing Partner Will Berchelmann Managing Partner 56
Hawai i. Air Service Overview. Hawai i Tourism Conference - August 2014
 Hawai i Air Service Overview Hawai i Tourism Conference - August 2014 1 The Most Diverse Air Service Network Ever Region Destinations Dec 2009 Destinations Dec 2014 North America 23 26 Asia 7 12 Oceania
2017 Marketing and Communications Conference. November 6, 2017
 2017 Marketing and Communications Conference November 6, 2017 1 2 Introduction Carrie Kenrick State of the Industry Industry Consolidation Financial Trends Ancillary Product / Customer Segmentation Fleet
HAWAIIAN AIRLINES UPDATE. Peter Ingram, Chief Commercial Officer
 HAWAIIAN AIRLINES UPDATE Peter Ingram, Chief Commercial Officer 1 Hawai i s destination carrier CHINA Beijing Seoul/Incheon SOUTH KOREA Osaka/Kansai Sapporo/Chitose Tokyo/Haneda JAPAN NI IHAU KAUA I Līhu
Outlook for Air Travel
 University of Massachusetts Amherst ScholarWorks@UMass Amherst Tourism Travel and Research Association: Advancing Tourism Research Globally 2014 Marketing Outlook Forum - Outlook for 2015 Outlook for Air
Airline Industry Overview For the Regional Airline Association. December 8, 2010
 Airline Industry Overview For the Regional Airline Association December 8, 2010 Agenda The Airline Industry at Yearend 2010 Financial Recovery Return to Growth Consolidation Alliances Regional Service
Passenger and Cargo Statistics Report
 Passenger and Cargo Statistics Report Reno-Tahoe International Airport December 2014 U.S. DOMESTIC INDUSTRY OVERVIEW FOR DECEMBER 2014 All RNO Carriers Domestic Systemwide year over year comparison Average
Global Airline Trends and Impacts International Aviation Issues Seminar
 Global Airline Trends and Impacts International Aviation Issues Seminar December 2017, Washington D.C. Oliver Lamb Managing Director 1 Around the world in 45 minutes Financial Performance Canada Mexico
Introduction: Airline Industry Overview Dr. Peter Belobaba Presented by: Alex Heiter & Ali Hajiyev
 Introduction: Airline Industry Overview Dr. Peter Belobaba Presented by: Alex Heiter & Ali Hajiyev Istanbul Technical University Air Transportation Management M.Sc. Program Network, Fleet and Schedule
LOUIS ARMSTRONG NEW ORLEANS INTERNATIONAL AIRPORT For the Period Ending September 30, Enplaned Passengers by Airline
 Domestic Scheduled Enplaned Passengers by Airline Alaska Airlines 7,070 4,331 63.2% 59,552 42,265 40.9% 1.2% 1.0% Virgin America 0 803-100.0% 12,231 803 1423.2% 0.3% 0.0% Allegiant Air 1,333 2,063-35.4%
Asia-Pacific Aviation: Growth and Challenges
 Asia-Pacific Aviation: Growth and Challenges A presentation to the ACI-NA International Aviation Issues Seminar Steve Martin Page 1 Page 2 Defining the Asia Pacific We ll call it GMT +5 GMT +12, minus
Inter-Office Memo Reno-Tahoe Airport Authority
 Inter-Office Memo Reno-Tahoe Airport Authority Date: November 30, 2009 To: Statistics Recipients From: Krys T. Bart, A.A.E., President/CEO Subject: RENO-TAHOE INTERNATIONAL AIRPORT PASSENGER STATISTICS
SHORT BUY. Price:$6.04 Target: $4.20. Price: $5.68 Target: $8.00.
 BUY SHORT Price: $5.68 Target: $8.00 Price:$6.04 Target: $4.20 valuehuntr@gmail.com Overview Highest ranked carrier in performance and quality Best safety record (never had a fatal accident in 80 years
MIT ICAT. Price Competition in the Top US Domestic Markets: Revenues and Yield Premium. Nikolas Pyrgiotis Dr P. Belobaba
 Price Competition in the Top US Domestic Markets: Revenues and Yield Premium Nikolas Pyrgiotis Dr P. Belobaba Objectives Perform an analysis of US Domestic markets from years 2000 to 2006 in order to:
October 2013 Passenger and Cargo Traffic Statistics Reno-Tahoe International Airport
 October 2013 Passenger and Cargo Traffic Statistics Reno-Tahoe International Airport December 4, 2013 U.S. DOMESTIC INDUSTRY OVERVIEW FOR OCTOBER 2013 All RNO Carriers Systemwide year over year comparison
TOTAL VISITOR EXPENDITURES IN JULY 2013 ($1.3 BILLION) WAS SIMILAR TO A YEAR AGO WHILE ARRIVALS ROSE 4.6 PERCENT
 WAS SIMILAR TO A YEAR AGO WHILE ARRIVALS ROSE 4.6 PERCENT") For Immediate Release: August 29, 2013 HTA Release (13-27) TOTAL VISITOR EXPENDITURES IN 2013 ($1.3 BILLION) WAS SIMILAR TO A YEAR AGO WHILE ARRIVALS ROSE 4.6 PERCENT HONOLULU Visitors who came to Hawai
For Immediate Release: August 29, 2013 HTA Release (13-27) TOTAL VISITOR EXPENDITURES IN 2013 ($1.3 BILLION) WAS SIMILAR TO A YEAR AGO WHILE ARRIVALS ROSE 4.6 PERCENT HONOLULU Visitors who came to Hawai
Reno-Tahoe Airport Authority U.S. DOMESTIC INDUSTRY OVERVIEW FOR FEBRUARY
 Inter-Office Memo Reno-Tahoe Airport Authority Date: March 30, 2009 To: Statistics Recipients From: Krys T. Bart, A.A.E., President/CEO Subject: RENO-TAHOE INTERNATIONAL AIRPORT PASSENGER STATISTICS U.S.
MIT ICAT. Fares and Competition in US Markets: Changes in Fares and Demand Since Peter Belobaba Celian Geslin Nikolaos Pyrgiotis
 Fares and Competition in US Markets: Changes in Fares and Demand Since 2000 Peter Belobaba Celian Geslin Nikolaos Pyrgiotis Objectives & Approach Objectives Track fare and traffic changes in US domestic
US AIRLINE COST AND PRODUCTIVITY CONVERGENCE: DATA ANALYSIS
 US AIRLINE COST AND PRODUCTIVITY CONVERGENCE: DATA ANALYSIS William S. Swelbar October 25, 2007 0 US AIRLINES: A Tale of Two Sectors US Network Legacy Carriers Mainline domestic capacity (ASMs) is almost
Industry Update. ACI-NA Winter Board of Directors Meeting February 3, 2016 Orlando, FL
 Industry Update ACI-NA Winter Board of Directors Meeting February 3, 2016 Orlando, FL U.S. & Canadian GDP 8% 6% 4% U.S.* Canada** Estimate by BEA as of 02/11/16 2% 0% -2% -4% -6% -8% -10% The U.S. economy
Asian stopovers in Nordic countries Optimistic perspectives. March 2018
 Asian stopovers in Nordic countries Optimistic perspectives March 2018 OUR COMMITMENT IS TO HAVE THE MOST PRECISE, UP-TO-DATE MARKETDATA ON TRAVELLERS JOURNEYS 30.238.647 Travellers monitored each day
November 2013 Passenger and Cargo Traffic Statistics Reno-Tahoe International Airport
 November 2013 Passenger and Cargo Traffic Statistics Reno-Tahoe International Airport December 26, 2013 U.S. DOMESTIC INDUSTRY OVERVIEW FOR NOVEMBER 2013 All RNO Carriers Domestic Systemwide year over
HVCB Market Insights Maui Visitors & Convention Bureau Membership Meeting October 27, Hawai i Tourism Authority (HTA)/Tor Johnson
/Tor Johnson") HVCB Maui Visitors & Convention Bureau Membership Meeting October 27, 2015 Hawai i Tourism Authority (HTA)/Tor Johnson 2015-16: The Road Ahead North America: Following notable increases in 2015, continued
HVCB Maui Visitors & Convention Bureau Membership Meeting October 27, 2015 Hawai i Tourism Authority (HTA)/Tor Johnson 2015-16: The Road Ahead North America: Following notable increases in 2015, continued
August 2014 Passenger and Cargo Traffic Statistics Reno-Tahoe International Airport
 August 2014 Passenger and Cargo Traffic Statistics Reno-Tahoe International Airport October 8, 2014 U.S. DOMESTIC INDUSTRY OVERVIEW FOR AUGUST 2014 All RNO Carriers Domestic Systemwide year over year comparison
May 2011 Passenger and Cargo Traffic Statistics Reno-Tahoe International Airport
 May 2011 Passenger and Cargo Traffic Statistics Reno-Tahoe International Airport July 5, 2011 U.S. DOMESTIC INDUSTRY OVERVIEW FOR MAY 2011 All RNO Carriers Systemwide year over year comparison Average
Airport forecasting is used in master planning to guide future development of the Airport.
 Airport Forecasts Airport forecasting is used in master planning to guide future development of the Airport. 4.1 INTRODUCTION Airport forecasting ensures development is appropriate for passengers, ground
Passenger and Cargo Statistics Report
 Passenger and Cargo Statistics Report RenoTahoe International Airport September 2015 U.S. DOMESTIC INDUSTRY OVERVIEW FOR SEPTEMBER 2015 All RNO Carriers Domestic Systemwide year over year comparison Average
Passenger and Cargo Statistics Report
 Passenger and Cargo Statistics Report RenoTahoe International Airport August 2015 U.S. DOMESTIC INDUSTRY OVERVIEW FOR AUGUST 2015 All RNO Carriers Domestic Systemwide year over year comparison Average
September 2013 Passenger and Cargo Traffic Statistics Reno-Tahoe International Airport
 September 2013 Passenger and Cargo Traffic Statistics Reno-Tahoe International Airport October 31, 2013 U.S. DOMESTIC INDUSTRY OVERVIEW FOR SEPTEMBER 2013 All RNO Carriers Systemwide year over year comparison
December 2013 Passenger and Cargo Traffic Statistics Reno-Tahoe International Airport
 December 2013 Passenger and Cargo Traffic Statistics Reno-Tahoe International Airport January 24, 2014 U.S. DOMESTIC INDUSTRY OVERVIEW FOR DECEMBER 2013 All RNO Carriers Domestic Systemwide year over year
Passenger and Cargo Statistics Report
 Passenger and Cargo Statistics Report RenoTahoe International Airport January 2017 U.S. DOMESTIC INDUSTRY OVERVIEW FOR JANUARY 2017 All RNO Carriers Domestic Systemwide year over year comparison Average
Passenger and Cargo Statistics Report
 Passenger and Cargo Statistics Report RenoTahoe International Airport June 2017 U.S. DOMESTIC INDUSTRY OVERVIEW FOR JUNE 2017 All RNO Carriers Domestic Systemwide year over year comparison Average Load
RENO-TAHOE INTERNATIONAL AIRPORT APRIL 2008 PASSENGER STATISTICS
 Inter-Office Memo Reno-Tahoe Airport Authority Date: June 5, 2008 To: Statistics Recipients From: Tom Medland, Director Air Service Business Development Subject: RENO-TAHOE INTERNATIONAL AIRPORT PASSENGER
March 2014 Passenger and Cargo Traffic Statistics Reno-Tahoe International Airport
 March 2014 Passenger and Cargo Traffic Statistics Reno-Tahoe International Airport April 25, 2014 U.S. DOMESTIC INDUSTRY OVERVIEW FOR MARCH 2014 All RNO Carriers Domestic Systemwide year over year comparison
Japan Airlines and American Airlines Joint Business Benefits from April 1, January 11, 2011
 Japan Airlines and American Airlines Joint Business Benefits from April 1, 2011 January 11, 2011 October 25, 2010: Signing of Japan-USA Open Skies Agreement Antitrust immunity was granted to airlines operating
Passenger and Cargo Statistics Report
 Passenger and Cargo Statistics Report RenoTahoe International Airport July 2018 U.S. DOMESTIC INDUSTRY OVERVIEW FOR JULY 2018 Systemwide RNO Carriers Domestic Flights year over year comparison Average
Passenger and Cargo Statistics Report
 Passenger and Cargo Statistics Report RenoTahoe International Airport April 2018 U.S. DOMESTIC INDUSTRY OVERVIEW FOR APRIL 2018 Systemwide RNO Carriers Domestic Flights year over year comparison Average
Passenger and Cargo Statistics Report
 Passenger and Cargo Statistics Report RenoTahoe International Airport June 2018 U.S. DOMESTIC INDUSTRY OVERVIEW FOR JUNE 2018 Systemwide RNO Carriers Domestic Flights year over year comparison Average
Passenger and Cargo Statistics Report
 Passenger and Cargo Statistics Report RenoTahoe International Airport May 2018 U.S. DOMESTIC INDUSTRY OVERVIEW FOR MAY 2018 Systemwide RNO Carriers Domestic Flights year over year comparison Average Load
August Tourism Conference. August 28
 August Tourism Conference August 28 Korean Market Situation Korea Economic Overview 2015 ECONOMIC GROWTH: 3.1% forecasted for 2015, compared to 3.4% in 2014 4th largest economy in Asia, 15th largest n
MARKET INSIGHTS UPDATE North America
 SPOTLIGHT ON: THE SHOULDER TRAVEL SEASON PG2 A monthly update including relevant information on travel industry trends, consumer and meetings market research, competitive intelligence, and Hawai i s performance
July 2012 Passenger and Cargo Traffic Statistics Reno-Tahoe International Airport
 July 2012 Passenger and Cargo Traffic Statistics Reno-Tahoe International Airport August 31, 2012 U.S. DOMESTIC INDUSTRY OVERVIEW FOR JULY 2012 All RNO Carriers Systemwide year over year comparison Average
May Air Traffic Statistics. Prepared by the Office of Corporate Risk and Strategy
 May 214 Air Traffic Statistics Prepared by the Office of Corporate Risk and Strategy Commercial Total Int'l Dom Air Traffic Summary May 214 Passenger Activity (in Millions) Current Month Year-to-Date Last
Passenger and Cargo Statistics Report
 Passenger and Cargo Statistics Report RenoTahoe International Airport September 2017 U.S. DOMESTIC INDUSTRY OVERVIEW FOR SEPTEMBER 2017 Systemwide RNO Carriers Domestic Flights year over year comparison
Damon Hylton Vice President
 ACI-NA Commissioners Conference Air Service Development in a Tough Market Damon Hylton Vice President May 19, 2008 Today s Agenda Background Now What? Questions and Answers 2 Background 3 Current Industry
AUGUST 2008 MONTHLY PASSENGER AND CARGO STATISTICS
 Inter-Office Memo Reno-Tahoe Airport Authority Date: October 2, 2008 To: Statistics Recipients From: Tom Medland, Director Air Service Business Development Subject: RENO-TAHOE INTERNATIONAL AIRPORT PASSENGER
LOUIS ARMSTRONG NEW ORLEANS INTERNATIONAL AIRPORT For the Period Ending August 31, Enplaned Passengers by Airline
 Enplaned Passengers by Airline Domestic Scheduled Alaska Airlines 3,797 4,077-6.9% 36,538 35,188 3.8% 1.0% 1.0% Allegiant Air 5,698 743 666.9% 41,738 14,843 181.2% 1.1% 0.4% American Airlines (US Air)
Year-to-Date Total Visitor Expenditures and Arrivals Continued to Exceed Last Year
 For Immediate Release: December 27, 2013 HTA Release (13-36) TOTAL VISITOR EXPENDITURES AND ARRIVALS FOR 2013 DECREASED FOR THE THIRD CONSECUTIVE MONTH Year-to-Date Total Visitor Expenditures and Arrivals
Hawai i Visitor Spending Rose 9 Percent in April 2017 Four Largest Visitor Markets Reported Growth in Spending and Arrivals
 For Immediate Release: May 25, 2017 HTA Release (17-16) Hawai i Visitor Spending Rose 9 Percent in April 2017 Four Largest Visitor Markets Reported Growth in Spending and Arrivals HONOLULU Visitors spent
Passenger and Cargo Statistics Report
 Passenger and Cargo Statistics Report RenoTahoe International Airport July 2017 U.S. DOMESTIC INDUSTRY OVERVIEW FOR JULY 2017 Systemwide RNO Carriers Domestic Flights year over year comparison Average
Passenger and Cargo Statistics Report
 Passenger and Cargo Statistics Report RenoTahoe International Airport September 2018 U.S. DOMESTIC INDUSTRY OVERVIEW FOR SEPTEMBER 2018 Systemwide RNO Carriers Domestic Flights year over year comparison
ANDREW WATTERSON Vice President Planning and Revenue Management
 ANDREW WATTERSON Vice President Planning and Revenue Management Safe Harbor Statement The following information contains certain forward looking statements that reflect the Company s current views with
CORPORATE STEVE BOOKING SMITH CHANNELS
 JAPAN AIRLINES: NAVIGATING THE FUTURE Steve Myer, Tokyo September 30, 2016 CORPORATE STEVE BOOKING SMITH CHANNELS VICE PRESIDENT, GLOBAL & STRATEGIC SALES, THE AMERICAS SEPTEMBER 20, 2016 RENO, NEVADA
Passenger and Cargo Statistics Report
 Passenger and Cargo Statistics Report RenoTahoe International Airport September 2016 U.S. DOMESTIC INDUSTRY OVERVIEW FOR SEPTEMBER 2016 All RNO Carriers Domestic Systemwide year over year comparison Average
U.S. DOMESTIC INDUSTRY OVERVIEW FOR MARCH
 Inter-Office Memo Reno-Tahoe Airport Authority Date: April 30, 2009 To: Statistics Recipients From: Krys T. Bart, A.A.E., President/CEO Subject: RENO-TAHOE INTERNATIONAL AIRPORT PASSENGER STATISTICS U.S.
Management Presentation. March 2016
 Management Presentation March 2016 Forward looking statements This presentation as well as oral statements made by officers or directors of Allegiant Travel Company, its advisors and affiliates (collectively
Building A New Silk Road Capacity Planning and Selecting Markets. Greg Kaldahl SVP Resource Management
 Building A New Silk Road Capacity Planning and Selecting Markets Greg Kaldahl SVP Resource Management 1 The Airline Industry Is In A State Of Constant Change Market cap ( bn) as of 1 Jan 1999 10 9.3 NA/EU
Passenger and Cargo Statistics Report
 Passenger and Cargo Statistics Report RenoTahoe International Airport December 2016 U.S. DOMESTIC INDUSTRY OVERVIEW FOR DECEMBER 2016 All RNO Carriers Domestic Systemwide year over year comparison Average
Management Presentation. May 2013
 Management Presentation May 2013 Forward looking statements This presentation as well as oral statements made by officers or directors of Allegiant Travel Company, its advisors and affiliates (collectively
Worldwide Fleet Forecast
 Worldwide Fleet Forecast Presented to: Montreal June 6, 26 DAVID BECKERMAN Director, Consulting Services Agenda State of the Industry Worldwide Fleet Regional Jets Narrowbody Jets Large Widebody Jets Freighter
Passenger and Cargo Statistics Report
 Passenger and Cargo Statistics Report RenoTahoe International Airport January 2018 U.S. DOMESTIC INDUSTRY OVERVIEW FOR JANUARY 2018 Systemwide RNO Carriers Domestic Flights year over year comparison Average
A RECORD 8.3 MILLION VISITORS CAME TO HAWAI I IN 2014 TOTAL VISITOR EXPENDITURES GREW TO $14.7 BILLION
 For Immediate Release: January 29, 2015 HTA Release (15-03) A RECORD 8.3 MILLION VISITORS CAME TO HAWAI I IN 2014 TOTAL VISITOR EXPENDITURES GREW TO $14.7 BILLION HONOLULU A total of 8,282,680 visitors
Passenger and Cargo Statistics Report
 Passenger and Cargo Statistics Report RenoTahoe International Airport February 2018 U.S. DOMESTIC INDUSTRY OVERVIEW FOR FEBRUARY 2018 Systemwide RNO Carriers Domestic Flights year over year comparison
December 2011 Passenger and Cargo Traffic Statistics Reno-Tahoe International Airport
 December 2011 Passenger and Cargo Traffic Statistics Reno-Tahoe International Airport January 27, 2012 U.S. DOMESTIC INDUSTRY OVERVIEW FOR DECEMBER 2011 All RNO Carriers Systemwide year over year comparison
Passenger and Cargo Statistics Report
 Passenger and Cargo Statistics Report Reno-Tahoe International Airport October 2018 U.S. DOMESTIC INDUSTRY OVERVIEW FOR OCTOBER 2018 Systemwide RNO Carriers Domestic Flights year over year comparison Average
Passenger and Cargo Statistics Report
 Passenger and Cargo Statistics Report RenoTahoe International Airport November 2017 U.S. DOMESTIC INDUSTRY OVERVIEW FOR NOVEMBER 2017 Systemwide RNO Carriers Domestic Flights year over year comparison
Airline Performance and Capacity Strategies Dr. Peter Belobaba
 Airline Performance and Capacity Strategies Dr. Peter Belobaba Istanbul Technical University Air Transportation Management M.Sc. Program Network, Fleet and Schedule Strategic Planning Module 18 : 13 March
ANA s Growth Strategy
 ANA s Growth Strategy Shinya Katanozaka Member of the Board of Directors, Senior Executive Vice President All Nippon Airways Co., Ltd. January 08, 2013 ANA s History 2 Rising to the Challenges ~ Always
Management Presentation. November 2011
 Management Presentation November 2011 Forward looking statements This presentation as well as oral statements made by officers or directors of Allegiant Travel Company, its advisors and affiliates (collectively
Commercial aviation. Market outlook, key trends driving growth and implications for airports. Dave Gamrath BCA Marketing.
 Commercial aviation Market outlook, key trends driving growth and implications for airports Dave Gamrath BCA Marketing June 2014 BOEING is a trademark of Boeing Management Company. Copyright 2014 Boeing.
January 2014 Passenger and Cargo Traffic Statistics Reno-Tahoe International Airport
 January 2014 Passenger and Cargo Traffic Statistics Reno-Tahoe International Airport March 12, 2014 U.S. DOMESTIC INDUSTRY OVERVIEW FOR DECEMBER 2013 All RNO Carriers Domestic Systemwide year over year
Passenger and Cargo Statistics Report
 Passenger and Cargo Statistics Report RenoTahoe International Airport December 2015 U.S. DOMESTIC INDUSTRY OVERVIEW FOR DECEMBER 2015 All RNO Carriers Domestic Systemwide year over year comparison Average
2007/08 Full Year Results Investor Briefing
 2007/08 Full Year Results Investor Briefing Highlights of Result Profit before tax up 46% to $1,408 million Up 36% on the reported result Margin improvement $3 billion of Sustainable Future Benefits achieved
Global Airline Capacity Winter 2013/14 Boeing Commercial Airplanes
 Global Airline Capacity Winter 2013/14 Boeing Commercial Airplanes Istanbul Technical University Air Transportation Management M.Sc. Program BOEING is a trademark of Boeing Management Company. Network,
February Air Traffic Statistics. Prepared by the Office of Corporate Risk and Strategy
 February 215 Air Traffic Statistics Prepared by the Office of Corporate Risk and Strategy Commercial Total Dom Int'l Passengers % Change Air Traffic Summary February 215 Passenger Activity (in Millions)
Year-to-Date Total Expenditures and Visitor Arrivals Remained Ahead of Last Year
 For Immediate Release: November 27, 2013 HTA Release (13-35) 2013 TOTAL VISITOR EXPENDITURES AND ARRIVALS DECLINED FOR THE SECOND MONTH Year-to-Date Total Expenditures and Visitor Arrivals Remained Ahead
$ bn. $1.1bn total spend. 340,500 arrivals. 5m total nights. 23% dispersed nights 1. Singapore Market Profile. Performance overview
 Market Profile Performance overview In 2013, Singapore was Australia s 5th largest inbound market for visitor arrivals, seventh largest market for total expenditure and 14th for visitor nights. It was
AFTA Travel Trends. June 2017
 AFTA Travel Trends June 2017 AFTA Travel Trends Report 2017 Inbound and Outbound overview Introduction This snapshot provides an overview of the balance of trade between Inbound and Outbound Travel for
Total Visitor Expenditures Grew 3 percent to $1.3 Billion
 For Immediate Release: May 8, 2015 HTA Release (15-07) TOTAL VISITOR ARRIVALS ROSE 7 PERCENT COMPARED TO 2014 Total Visitor Expenditures Grew 3 percent to $1.3 Billion HONOLULU Total visitor arrivals to
Management Presentation. August 2012
 Management Presentation August 2012 Forward looking statements This presentation as well as oral statements made by officers or directors of Allegiant Travel Company, its advisors and affiliates (collectively
Jumpstart 2017 Lukas Johnson SVP, Commercial. June 2017
 Jumpstart 2017 Lukas Johnson SVP, Commercial June 2017 Forward looking statements This presentation as well as oral statements made by officers or directors of Allegiant Travel Company, its advisors and
Tourism Snapshot. June 2015 Volume 11, Issue 6. A focus on the markets in which Destination Canada (DC) and its partners are active.
 and its partners are active.") Tourism Snapshot Tourism PEI / Paul Baglole A focus on the markets in which Destination Canada (DC) and its partners are active. www.destinationcanada.com June Volume 11, Issue 6 Key highlights Over the
Tourism Snapshot Tourism PEI / Paul Baglole A focus on the markets in which Destination Canada (DC) and its partners are active. www.destinationcanada.com June Volume 11, Issue 6 Key highlights Over the
September Air Traffic Statistics. Prepared by the Office of Marketing & Consumer Strategy
 September 217 Air Traffic Statistics Prepared by the Office of Marketing & Consumer Strategy This report includes only data submitted by airlines as of the date of publication: November 15, 217. Reports
Management Presentation. September 2011
 Management Presentation September 2011 Forward looking statements This presentation as well as oral statements made by officers or directors of Allegiant Travel Company, its advisors and affiliates (collectively
Trends Shaping Houston Airports
 Trends Shaping Houston Airports Ian Wadsworth Chief Commercial Officer April 2014 Our mission is to connect Houston with the world Connect the people, businesses, cultures and economies of the world to
QANTAS HALF YEAR 2015 FINANCIAL RESULTS 1
 QANTAS HALF YEAR 2015 FINANCIAL RESULTS 1 Key points: Underlying Profit Before Tax: $367 million Statutory Profit After Tax: $206 million Transformation benefits: $374 million Comparable unit cost reduction:
TOTAL VISITOR EXPENDITURES DECREASED 2.2 PERCENT IN APRIL 2014 AND 2.9 PERCENT IN THE FIRST FOUR MONTHS OF 2014
 For Immediate Release: May 29, 2014 HTA Release (14-16) TOTAL VISITOR EXPENDITURES DECREASED 2.2 PERCENT IN 2014 AND 2.9 PERCENT IN THE FIRST FOUR MONTHS OF 2014 HONOLULU Total expenditures by visitors
$0.7bn total spend. 141,400 arrivals. 4m total nights. 17% dispersed nights 1. Indonesia Market Profile. Performance overview
 Market Profile Performance overview In 2013, Indonesia was Australia s 12th largest inbound market for visitor arrivals, the 14th largest market for total expenditure, and 19th for visitor nights. It was
Finding Rationality in an Irrational World: The Economics of Successful Hotel Negotiations
 Finding Rationality in an Irrational World: The Economics of Successful Hotel Negotiations Isaac Collazo, Vice President, Performance Strategy & Planning, InterContinental Hotels Group (IHG) Maria Lowry,
2014 Spring Marketing Update. Presented by Ashlee Galea Country Manager Australia
 2014 Spring Marketing Update Presented by Ashlee Galea Country Manager Australia 2014 SPRING MARKETING UPDATE Presentation Overview 2013 RECAP 2014 MARKET CONDITIONS MARKET INSIGHTS AIRLIFT UPDATE 2014
December 2012 Passenger and Cargo Traffic Statistics Reno-Tahoe International Airport
 December 2012 Passenger and Cargo Traffic Statistics Reno-Tahoe International Airport January 29, 2013 U.S. DOMESTIC INDUSTRY OVERVIEW FOR DECEMBER 2012 All RNO Carriers Systemwide year over year comparison
AUCKLAND DESTINATION OVERVIEW
 AUCKLAND DESTINATION OVERVIEW JULY 218 An in-depth overview of Auckland s visitor economy from the latest arrival, accommodation, spend and cruise data through to past five-year commentary. Prepared August
AFTA Travel Trends. July 2017
 AFTA Travel Trends July 2017 AFTA Travel Trends Report 2017 Inbound and Outbound overview Introduction This snapshot provides an overview of the balance of trade between Inbound and Outbound Travel for
airline economic analysis
 February 2012 airline economic analysis By: Bob Hazel Tom Stalnaker Aaron Taylor Table of Contents Summary 1 Carriers Included and Methodology 3 Cost 4 1. System CASM Increase 4 2. Domestic CASM Increase
Tourism Snapshot. A focus on the markets in which the CTC and its partners are active. February 2015 Volume 11, Issue 2.
 Tourism Snapshot Tourism Whistler/Mike Crane A focus on the markets in which the CTC and its partners are active www.canada.travel/corporate February Volume 11, Issue 2 Key highlights The strong beginning
October Air Traffic Statistics. Prepared by the Office of Corporate Risk and Strategy
 October 214 Air Traffic Statistics Prepared by the Office of Corporate Risk and Strategy Metropolitan Washington Airports Authority Air Traffic Statistics Table of Contents Summary Air Traffic Summary...
September Air Traffic Statistics. Prepared by the Office of Corporate Risk and Strategy
 September 214 Air Traffic Statistics Prepared by the Office of Corporate Risk and Strategy Air Traffic Summary September 214 Commercial Total Dom Int'l Passengers % Change Passenger Activity (in Millions)
February Air Traffic Statistics. Prepared by the Office of Marketing & Consumer Strategy
 February 218 Air Traffic Statistics Prepared by the Office of Marketing & Consumer Strategy 1 This report includes only data submitted by airlines as of the date of publication: April 18, 218. Reports
Tim Hunter Chief Executive. CCT Business Partner Update 3 March 2015
 Tim Hunter Chief Executive CCT Business Partner Update 3 March 2015 A Great Summer Strong international arrival growth More flights and more beds Great weather = more visitors doing more Jan-10 Feb-10
AUCKLAND DESTINATION OVERVIEW
 AUCKLAND DESTINATION OVERVIEW JUNE 218 An in-depth overview of Auckland s visitor economy from the latest arrival, accommodation, spend and cruise data through to past five-year commentary. Prepared July
Air China Limited Annual Results. March Under IFRS
 Air China Limited 21 Annual Results Under IFRS March 211 Agenda Part 1 Highlights Part 2 Business Overview Part 3 Financial Overview Part 4 Outlook 2 Part 1 Highlights Steady Economic Growth; Asia Pacific