Helicopter Noise Analysis
|
|
|
- Rosalyn Houston
- 6 years ago
- Views:
Transcription
1 Clark County Department of Aviation Appendix D. Helicopter Noise Analysis D.1 General Characteristics of Helicopter Noise Helicopter noise originates from three components of the helicopter: the rotors, engine, and transmission. Generally speaking helicopters are equipped with two rotors. The main rotor is located on the top of the cabin and is used to generate lift. The other rotor (tail rotor) is located in the tail and is used to produce a sideways force that prevents the body of the helicopter from rotating and is also used to steer the helicopter. Two types of helicopters the AS350 and EC130 are used by Grand Canyon tour operators based in Clark County. Almost all helicopters are equipped with one of two types of tail rotors: a conventional tail rotor or a Fenestron tail rotor. By nature of its construction, the Fenestron tail rotor is quieter than the conventional tail rotor. The AS350 is equipped with a conventional tail rotor and the EC130 is equipped with the Fenestron tail rotor. Power is transferred to the rotors from the engine via a main gearbox. The engine s revolutions per minute (RPMs) are reduced from thousands to hundreds by increasing the torque and slowing the rotation to an acceptable level for the rotors. Noise generated by the engine depends on the type/model of engine powering the helicopter. The transmission drives the mast, which provides direct rotation to the rotors. Noise generated by the transmission depends on the type/model of engine and transmission powering the helicopter. D.2 Definition of Noise Loudness, measured in decibels (db), is the most commonly used characteristic to describe noise. The A-weighted decibel (dba) is used in aircraft 1 noise analyses because it incorporates a frequency-dependent rating scale that more closely associates sounds and sound frequencies with the sensitivity of the human ear. Some common sounds on the dba scale, relative to ordinary conversation, are listed in Table D-1. As shown in the table, the relative perceived loudness of a sound doubles for each increase of 10 dba, although a 10-dBA change corresponds to a factor of 10 in relative sound energy. Generally, sounds with differences of 2 dba or less are not perceived to be noticeably different by most listeners. A noise event produced by a helicopter flyover is usually characterized by a buildup to a maximum noise level as the helicopter approaches, and then a decrease in the noise level through a series of lesser peaks or pulses after the aircraft passes and the noise recedes. 1 As used in report, aircraft includes helicopters. Final EA for a Southern Nevada Regional Heliport D-1 December 2008 Appendix D
2 Clark County Department of Aviation Table D-1 Common Sounds on the A-Weighted Decibel Scale Sound Level Relative Loudness Relative Sound Sound (dba) (approximate) Energy Rock music, with amplifier ,000,000 Thunder, snowmobile (operator) ,000 Boiler shop, power mower ,000 Orchestral crescendo at 25 feet, noisy ,000 kitchen Busy street Interior of department store Ordinary conversation, 3 feet away Quiet automobiles at low speed 50 ½ 0.1 Average office 40 ¼ 0.01 City residence 30 1/ Quiet country residence 20 1/ Rustle of leaves 10 1/ Threshold of hearing 0 1/ Source: U.S. Department of Housing and Urban Development, Aircraft Noise Impact Planning Guidelines for Local Agencies, Prepared by: Ricondo & Associates, Inc., April 2008 D.3 Noise Analysis Methodology The methodology used for this helicopter noise analysis included the: (1) use of noise descriptors developed for helicopter noise analyses, (2) application of a computer model that provides estimates of helicopter noise levels, and (3) development of basic data and assumptions as input to the computer model. D.3.1 Noise Descriptors Noise is measured using a variety of scientific metrics. As a result of extensive research into the characteristics of aircraft noise and human response to that noise, a standard system of descriptors has been developed for use in aircraft noise exposure analyses. These descriptors, as used for this helicopter noise analysis, are described in the following subsections. D A-Weighted Sound Pressure Level The decibel is used to describe sound pressure level. A-weighting approximates the human ear s sensitivity to sounds of different frequencies. Without this filtering, calculated and measured sound levels would include sounds that the human ear cannot hear, such as dog whistles (high frequency) and sounds made by large buildings with changes in temperature and wind (low frequency). D Maximum A-Weighted Sound Level The maximum A-weighted sound level (L max ) is the loudest part of a noise event, measured in decibels. As an aircraft overhead passes an observer, the noise increases to a maximum level and then decreases as the aircraft passes. Some sound level meters measure the maximum, or L max, level. Final EA for a Southern Nevada Regional Heliport D-2 December 2008 Appendix D

3 D Equivalent Sound Level (Leq) Clark County Department of Aviation Leq is a standard measure of sound energy averaged over a specified time period. This metric indicates the constant sound level in decibels which is equivalent to the amount of sound energy produced by a series of events having fluctuating sound levels during the specified time period. D Sound Exposure Level Sound exposure level (SEL) is a time-integrated measure, expressed in decibels, of the sound energy of a single noise event at a reference duration of one second. The sound level is integrated over the period that it exceeds a threshold. Therefore, SEL accounts for both the maximum sound level and the duration of the sound. The SEL for a particular aircraft noise event is a numerically higher value than the (L max ) for the same event. This is because the SEL consolidates the energy of the entire noise event into a reference duration of one second. The SEL is not heard, but is a derived value used for calculation of cumulative aircraft noise exposure as defined by the DNL. SELs for aircraft noise events depend on the location of the aircraft relative to the noise receptor, the type of operation (landing, takeoff, or overflight), and the type of aircraft. The SEL concept is depicted on Exhibit D-1. Exhibit D-1 Sound Exposure Level Concept Source: Prepared by: Ricondo & Associates, Inc. Ricondo & Associates, Inc., April 2008 Final EA for a Southern Nevada Regional Heliport D-3 December 2008 Appendix D
 noise level in the absence of any easily defined noise events, such as those caused by occasional traffic, barking dogs, or aircraft")
4 Clark County Department of Aviation D Background Sound Level (L 90 ) L 90 describes the noise level exceeded 90 percent of the time during the sample period. L 90 is useful for describing the background (or residual) noise level in the absence of any easily defined noise events, such as those caused by occasional traffic, barking dogs, or aircraft overflights. D Day-Night Average Sound Level Day-night average sound level (DNL) is a method used to describe the existing and predicted cumulative noise exposure from aircraft operations in the vicinity of an airport or a heliport. The DNL is expressed in dba and represents the time-weighted average noise level over a 24-hour period. The DNL is used to estimate the effects of specific noise levels on land uses. The U.S. Environmental Protection Agency (EPA) introduced the DNL metric in 1976 as a single number measurement of community noise exposure. The Federal Aviation Administration (FAA) adopted DNL as the noise metric for measuring cumulative aircraft noise under Title 14, Code of Federal Regulations, Part 150 (14 CFR Part 150), Airport Noise Compatibility Planning. DNL has also been adopted for measuring cumulative noise exposure by several other government agencies, including the Department of Housing and Urban Development, the Veterans Administration, the Department of Defense, the Coast Guard, and the Federal Transit Administration. DNL is widely accepted as the best available method to describe aircraft noise exposure and is the noise descriptor required for use in aircraft noise exposure analyses, land use compatibility planning, environmental assessments, and environmental impact statements for airport/heliport improvement projects. Although additional noise metrics may be used to characterize aircraft noise and environmental impacts, neither Clark County nor the State of Nevada mandates the use of metrics other than DNL. In calculating DNL, for each hour during the nighttime period (10:00 p.m. to 6:59 a.m.), sound levels are increased by a 10-decibel-weighting penalty before the 24-hour value is computed. The weighting penalty accounts for the more intrusive nature of noise during nighttime hours. DNL is expressed as an average noise level on the basis of annual aircraft operations for a calendar year, not on the average noise levels associated with different aircraft operations. To calculate the DNL at a specific location, the SELs at that location associated with each aircraft operation (landing or takeoff) are determined. Using the SEL for each noise event and applying the 10-decibel penalty for nighttime operations as appropriate, a partial DNL is then calculated for each aircraft operation. The partial DNLs for each aircraft operation are added logarithmically to determine the total DNL. The logarithmic addition process, whereby the partial DNLs are combined, can be approximated by the following guidelines: Adding the noise from a relatively quiet event (60 dba) to a relatively noisy event (70 dba) results in a value of 70 dba because the quieter event has only one-tenth the sound energy of the noisier Final EA for a Southern Nevada Regional Heliport D-4 December 2008 Appendix D
5 Clark County Department of Aviation event. As a result, the quieter noise event is drowned out by the noisier one, and there is no increase in the overall noise level as perceived by the human ear. DNL is used to describe existing and predicted noise exposure in communities in an airport/heliport vicinity based on the average number of daily operations over the year and the average annual operational conditions at the airport/heliport. Therefore, at a specific location near an airport/heliport, the noise exposure on a particular day is likely to be higher or lower than the annual average noise exposure, depending on the specific operations at the airport/heliport that day. D.3.2 Integrated Noise Model The Integrated Noise Model (INM) was developed by the FAA, and is the computer model required for use in developing aircraft/helicopter noise exposure maps. The INM contains aircraft operational and noise data in a database that reflects average aircraft operating conditions. The INM was originally designed for modeling noise from fixed-wing aircraft. However, with the introduction of Version of the INM, the FAA incorporated the noise modeling capabilities of its Helicopter Noise Model (HNM). INM Version 7.0 is the latest accepted state-of-the-art tool for determining the total effect of aircraft noise at and around airports and heliports, and is the model that was used to determine potential helicopter noise impacts for this analysis Because the DNL is fundamentally based on the noise levels produced by individual aircraft operations, selection of appropriate aircraft-type designations from the INM database is of critical importance. The INM Version 7.0 database contains both of the helicopter types that are used by Grand Canyon tour operators based in Clark County. Those helicopter types are designated within the INM database as the SA350D (AS350) and the EC130. The SA350D and EC130 helicopter types were used without modification to model helicopter noise levels for this analysis. D DNL and Noise Exposure Ranges A noise exposure value of DNL 65 was used as the criterion level for the noise analysis. Two specific ranges of noise exposure were estimated: (1) DNL 65 and higher and (2) DNL 60 to 65. DNL 65 and higher is the FAA s standard threshold for land use compatibility planning purposes in areas surrounding a heliport or airport. Although the FAA considers aircraft noise exposure lower than DNL 65 to be compatible with residential land uses, persons residing outside the DNL 65 noise exposure area may still be annoyed by aircraft noise. However, Clark County agencies use information regarding noise exposure between DNL 60 and DNL 65 for local planning purposes and therefore DNL 60 noise contours are depicted on exhibits in this EA. D The DNL Descriptor The validity and accuracy of DNL calculations depend on the basic information used in the calculations. For future heliport activities, the reliability of DNL calculations is affected by a number of variables: x x Future aviation activity the number of helicopter operations, the types of helicopters in the fleet mix, the times of operations (daytime and nighttime), and helicopter flight tracks are estimates or forecasts, the achievement of which cannot be assured. Although new helicopter types may be introduced in the future, current models were used as input to the INM to estimate future activity. Final EA for a Southern Nevada Regional Heliport D-5 December 2008 Appendix D
6 Clark County Department of Aviation x x The noise descriptors used as the basis for calculating DNL represent typical human response (and reaction) to aircraft/helicopter noise. Because people vary in their responses to noise and because the physical measure of noise accounts for only a portion of an individual s reaction to that noise, DNL can be used only to obtain an average response to aircraft noise that might be expected in a community. Single flight tracks used in computer modeling represent a wider band of actual flight tracks. These uncertainties aside, DNL mapping was developed as a tool to assist in land use planning around airports/heliports. Mapping is best used for comparative purposes rather than to provide absolute values. DNL calculations provide valid comparisons between different potential conditions, so long as consistent assumptions and data are used for all calculations. Thus, sets of DNL calculations can show anticipated changes in aircraft/helicopter noise exposure over time, or can indicate which of a series of simulated situations would be better, and generally how much better, from the standpoint of noise exposure. However, a line drawn on a map is not meant to imply that a particular noise condition exists on one side of that line and not on the other. DNL calculations are a means for comparing noise effects, not for precisely defining them relative to specific parcels of land. Nevertheless, DNL contours can be used to (1) highlight an existing or potential aircraft noise problem that requires attention, (2) assist in the preparation of noise compatibility programs, and (3) provide guidance in developing land use controls, such as zoning ordinances, subdivision regulations, and building codes. DNL has been, and is still, considered to be the best methodology available for depicting aircraft/helicopter noise exposure. D Graphic Representation of DNL Contours are lines on a map that connect points of equal DNLs, much like topographic contour lines are drawn on a map to indicate ground elevations. For example, a contour is drawn to connect all points exposed to DNL 65; another may be drawn to connect all points exposed to DNL 70; and so forth. Generally, noise contours are plotted at 5-DNL intervals. Noise contours were developed for this analysis in conformance with FAA guidelines included in FAA Orders B and E and 14 CFR Part 150. For this analysis, the INM was used to produce DNL 65 and DNL 60 helicopter noise exposure contours. D.3.3 Basic Data and Assumptions for Developing Noise Exposure Maps The primary data required to develop helicopter noise exposure maps using INM Version 7.0 are: x x The existing and forecast number of helicopter operations, by helicopter type, and with daytime or nighttime flight characteristics. Operational information, including use of the runways or touchdown and liftoff areas, location and use of flight tracks (the paths that pilots fly to arrive at and depart from the airport or heliport), departure profiles, and existing noise abatement procedures. Final EA for a Southern Nevada Regional Heliport D-6 December 2008 Appendix D
7 D Helicopter Operations Clark County Department of Aviation To determine existing and projected noise exposure, helicopter operations associated with the average day of the year are used in the INM. Helicopter operations data for an average day in 2004 were used to represent existing conditions in this environmental assessment. The 2004 average annual day condition is based on actual helicopter operations data collected by AirScene 2. Forecasts of operations for the average day in 2011 and 2017 were derived from the annual forecasts presented in Chapter III of this EA. Existing and forecast levels of helicopter operations under the Proposed Action are presented in Table D-2. Existing and forecast levels of helicopter operations under the No Action alternative are presented in Table D-3. As shown in Table D-2, the number of Grand Canyon tour departures at the Heliport site under the Proposed Action is projected to be 29,500 in 2011 and 37,300 in It was assumed that the operators of Las Vegas Strip tours would not relocate to the proposed Heliport site from McCarran. Las Vegas Strip tours would continue to be accommodated at McCarran under the Proposed Action 8,400 annual tour departures in 2011 and 9,100 annual tour departures in Under the Proposed Action there would be 9,800 Grand Canyon tour departures at McCarran in 2011 and 12,400 annual Grand Canyon tour departures in Under the Proposed Action it is anticipated that some helicopter operations, both Grand Canyon tours and Las Vegas Strip tours, would be accommodated at other locations in the region (11,100 annual tour departures in 2011 and 15,600 annual tour departures in 2017). These helicopter movements were not assessed or evaluated in this environmental assessment. As shown in Table D-3, the number of Grand Canyon tour departures at McCarran under the No Action alternative is projected to be 29,500 in 2011 and 37,300 in Las Vegas Strip tours would continue to be accommodated at McCarran under the No Action alternative 8,400 annual tour departures in 2011 and 9,100 annual tour departures in It is anticipated that some helicopter operations, both Grand Canyon tours and Las Vegas Strip tours, would be accommodated at other locations in the region under the No Action alternative (20,900 annual tour departures in 2011 and 28,000 annual tour departures in 2017). 2 AirScene is a proprietary software package developed and licensed by Rannoch Corporation that provides data to the CCDOA regarding aircraft and helicopter operations at McCarran. The CCDOA has used the software package since July Final EA for a Southern Nevada Regional Heliport D-7 December 2008 Appendix D
8 Clark County Department of Aviation Table D-2 Helicopter Air Tour Departures Proposed Action Year Historical McCarran International Airport Annual Grand Canyon Tour Departures Annual Las Vegas Strip Tour Departures Annual Grand Canyon Tour Departures Heliport Site 1/ Annual Las Vegas Strip Tour Departures Annual Grand Canyon Tour Departures Other Facility 2/ Annual Las Vegas Strip Tour Departures Annual Grand Canyon Tour Departures Total Annual Las Vegas Strip Tour Departures ,190 11, ,190 11, ,595 12, ,595 12, ,865 12, ,865 12,045 Forecast ,800 8,500 29,500-4,400 6,700 43,700 15, ,200 8,600 30,700-4,500 7,200 45,400 15, ,600 8,700 31,900-4,700 7,700 47,200 16, ,000 8,800 33,200-4,900 8,300 49,100 17, ,500 8,900 34,500-5,100 8,900 51,100 17, ,900 9,000 35,900-5,300 9,500 53,100 18, ,400 9,100 37,300-5,500 10,100 55,200 19,200 Notes: 1/ It was assumed that Las Vegas Strip tours would not be accommodated at the proposed Heliport site. 2/ Not evaluated in the environmental assessment. Sources: Clark County Department of Aviation using data from AirScene (2004 departures); Ricondo & Associates, Inc. Prepared by: Ricondo & Associates, Inc., April 2008 Table D-3 Helicopter Air Tour Departures No Action Alternative McCarran International Airport Other Facility 1/ Total Annual Grand Annual Las Annual Grand Annual Las Annual Grand Annual Las Canyon Tour Vegas Strip Canyon Tour Vegas Strip Canyon Tour Vegas Strip Year Departures Tour Departures Departures Tour Departures Departures Tour Departures Historical ,190 11, ,190 11, ,595 12, ,595 12, ,865 12, ,865 12,045 Forecast ,500 8,500 14,200 6,700 43,700 15, ,600 8,600 14,800 7,200 45,400 15, ,900 8,700 15,300 7,700 47,200 16, ,100 8,800 16,000 8,300 49,100 17, ,500 8,900 16,600 8,900 51,100 17, ,800 9,000 17,300 9,500 53,100 18, ,300 9,100 17,900 10,100 55,200 19,200 Note: 1/ Not evaluated in the environmental assessment. Sources: Clark County Department of Aviation using data from AirScene (2004 departures); Ricondo & Associates, Inc. Prepared by: Ricondo & Associates, Inc., April 2008 Final EA for a Southern Nevada Regional Heliport D-8 December 2008 Appendix D
9 Helicopter Fleet Mix Clark County Department of Aviation The helicopter fleet mix consists of two helicopter types the AS350 and the EC130. The percentages of departures by helicopter type and year are shown in Table D-4. These fleet mix percentages were applied to the operations data used in the INM analysis for the Proposed Action and No Action alternative. Table D-4 Percentage of Departures by Helicopter Type Helicopter Type Year AS350 EC % 20.0% % 46.8% % 57.1% Source: Ricondo & Associates, Inc., based on helicopter air tour operator surveys. Prepared by: Ricondo & Associates, Inc., April 2008 Time of Day AirScene data were used to determine the number of helicopter operations at McCarran International Airport during the daytime hours (7:00 a.m. to 9:59 p.m.) and nighttime hours (10:00 p.m. to 6:59 a.m.) in These data indicated that 1 percent of helicopter operations occurred during nighttime hours. As mentioned earlier, the calculation of DNL includes a 10-decibel weighting penalty for those operations occurring during the nighttime hours. It was assumed that the split between daytime and nighttime operations for each helicopter type would be the same in 2011 and 2017 as that recorded in D Heliport Operational Information The assumed future uses of the flight tracks to and from the airport or heliport are important in determining where helicopters are flying and, consequently, the noise levels generated on the ground. Helipad Use and Design Criteria Helipad use was determined based on several factors, including: historical wind analysis, conversations with helicopter operators at McCarran International Airport, air traffic control procedures in the vicinity of McCarran, Federal Aviation Regulations pertaining to helicopter operations, FAA Advisory Circulars pertaining to heliports and air traffic patterns, and observations of helicopter activities in the Las Vegas region. Specific criteria that were applied to the airspace analysis around the sites were referenced from FAA Advisory Circular 150/5390-2A, Heliport Design, 14 CFR Part 77 Objects Effecting Navigable Airspace, FAA Order A Helicopter Global Positioning System (GPS) Non-Precision Approach Criteria, and data acquired from the Las Vegas TRACON and the FAA Digital Obstruction File. The wind analysis for the Heliport site utilized historical weather data from January 1992 to January 2001 collected at the McCarran International Airport weather station. Helipad use was calculated by assuming that helicopters would use helipads aligned with prevailing winds when Final EA for a Southern Nevada Regional Heliport D-9 December 2008 Appendix D
10 Clark County Department of Aviation winds are above three knots and would use the helipads providing the most direct route during calm winds. According to FAA criteria, the design of helicopter approach paths should be based on prevailing wind direction, crosswind component (150 degrees minimum), and clear approach and transitional surfaces at the heliport site. The Heliport Approach Surface for each landing area at a heliport is defined in 14 CFR Part 77 as the area beginning at the end of the take off and landing area with the same width, extending outward and upward for a horizontal distance of 4,000 feet, where its width is 500 feet. The slope of the approach surface rises at a ratio of 8 to 1 eight feet horizontal to one foot vertical). The Heliport Transitional Surface is defined in 14 CFR Part 77 as that area that extends outwards and upward from the lateral boundaries of the heliport landing and takeoff area and from the Heliport Approach Surfaces for a distance of 250 feet from the centerline of the approach surface. The slope of this surface is 2 to 1. Design of the heliport landing areas was based on Visual Flight Rules (VFR) operations. However, intermediate and final missed approach design criteria as specified in FAA Order A, Helicopter Global Positioning System Non Precision Approach Criteria, were considered in the design of the approach lighting area orientation in the event that an Instrument Flight Rules (IFR) approach is desired in the future. The optimum design for an instrument approach includes a three-mile intermediate segment, a 3-mile final approach segment, and a clear missed approach area. Planning data for the proposed Heliport is presented on Exhibit D-2. Generalized Aircraft Flight Tracks Flight track information is another important input to the INM. However, inputting the individual tracks for each aircraft operation is not practical and the FAA suggests that flight tracks be consolidated into a set of generalized flight tracks that are representative of all flight tracks into and out of the airport/heliport. Deviations from the generalized flight tracks occur because of weather conditions, pilot technique, air traffic control procedures, and aircraft weight. However, the generalized flight tracks do provide representative tracks for arrivals and departures at the airport/heliport. The potential flight corridors and the local routes for the Heliport site are shown on Exhibits D-3 through D-5. The local routes represent generalized flight paths for transitioning between the site and the flight corridor. Each exhibit depicts the noise model inputs for each flight track scenario within the Proposed Action, including the flight corridors, the percentage of traffic on each corridor, and each local route. Exhibit D-3, Flight Corridors for Heliport site Scenario A (Henderson), shows the Henderson departure flight corridor being used 100 percent of the time. Arrivals are split, with 80 percent arriving via the Henderson flight corridor and 20 percent arriving via the Charleston and Strip Railroad flight corridors. Exhibit D-4, Flight Corridors for Heliport Site Scenario B (McCullough), shows the McCullough departure flight corridor being used 100 percent of the time. Arrivals are split, with 80 percent arriving via the McCullough flight corridor and 20 percent arriving via the Charleston and Strip Railroad flight corridors. Exhibit D-5, Flight Corridors for the Heliport site Scenario C (Jean), shows the Jean flight corridor being used 100 percent of the time. Arrivals are split, with 80 percent arriving via the Jean flight corridor and 20 percent arriving via the Charleston and Strip Railroad flight corridors. Final EA for a Southern Nevada Regional Heliport D-10 December 2008 Appendix D
11
12 This page intentionally left blank
13
14 This page intentionally left blank
15
16 This page intentionally left blank
17
18 This page intentionally left blank
19 D.4 Ambient Noise Level Monitoring Clark County Department of Aviation The ambient noise environment in the vicinity of McCarran International Airport and the Heliport site and in the vicinity of potential helicopter flight corridors associated with each site was evaluated through a noise-monitoring program. Continuous noise monitoring for a minimum of 24 hours was conducted at 10 locations 3 as shown on Exhibit III-5 in Chapter III. Two of the noise-monitoring sites represent alternative heliport sites, noted as McCarran International Airport and South of Sloan (Proposed Action), and eight of the noise monitoring sites are located underneath or near existing or potential helicopter flight corridors, noted as R1 through R8. Exhibits D-6 through D-15 summarize the hourly L max, L eq, and L 90 noise levels measured at each site, along with the measured DNL for the 24-hour noise-monitoring period. A photograph of each noise monitoring site and the noise monitoring equipment set up at each site is included with each exhibit. The exhibits demonstrate that noise levels vary during the day and night, with the lowest noise levels generally occurring during the late night and early morning hours. Ambient noise level measurements were recorded during July and October Noise monitoring equipment consisted of Larson-Davis Laboratories (LDL) Model 820 sound level analyzers equipped with Bruel & Kjaer (B&K) Type inch microphones. The instrumentation was calibrated prior to use with a B&K Type 4230 acoustic calibrator, and complies with applicable requirements of the American National Standards Institute (ANSI) for Type 1 (precision) sound level meters. The LDL Model 820 sound level analyzers run continuously with a sampling rate of 32 per second. The analyzers calculate various statistical descriptors of noise and DNLs for each 24-hour noise measurement period. As discussed previously, DNL is the average sound pressure level in A-weighted decibels for an average day of the year. DNL is calculated using the sound energy generated by individual aircraft operations (arrivals or departures), the number of operations occurring during a theoretical average 24-hour period, and the time of day the operations occur. A 10-dB weighting penalty is added for aircraft or helicopter operations occurring between 10:00 p.m. and 6:59 a.m. In addition to the 10 sites noted above, ambient noise monitoring data from two locations beneath the Overflight Area, from an unrelated project conducted by the Federal Aviation Administration 4, was also evaluated. These two noise monitoring sites, noted as L05 and L07, are also shown on Exhibit II-5 in Chapter III. Exhibits D-16 through D-17 summarize the average hourly L eq and L 90 noise levels measured by the FAA at each site, along with the estimated DNL for the noise-monitoring period. DNL values were estimated based upon average hourly L eq data from the above-referenced FAA study since measured DNL values were not reported in that document. A photograph of FAA sites L05 and L07 and the noise monitoring equipment setup at each of those sites is included with the exhibits. The exhibits demonstrate that noise levels vary during the day and night, with the lowest noise levels generally occurring during the late night and early morning hours. 3 Noise monitoring sites were selected by Brown-Buntin Associates, Inc. with input from the CCDOA and the Bureau of Land Management. 4 FAA, Baseline Ambient Sound Levels in Lake Mead National Recreation Area (DOT-VNTSC-FAA-06-13, April Final EA for a Southern Nevada Regional Heliport D-15 December 2008 Appendix D
20 South of Sloan Site Hourly Noise Levels :00 2:00 4:00 6:00 8:00 10:00 12:00 14:00 16:00 18:00 20:00 22:00 db(a) Lmax Leq L(90) DNL=69.2 July 01, 2004


 DNL=62.")
21 McCarran International Airport Hourly Noise Levels :00 2:00 4:00 6:00 8:00 10:00 12:00 14:00 16:00 18:00 20:00 22:00 db(a) Lmax Leq L(90) DNL=62.2 August 03, 2004
22 Site R1 Hourly Noise Levels :00 2:00 4:00 6:00 8:00 10:00 12:00 14:00 16:00 18:00 20:00 22:00 db(a) Lmax Leq L(90) DNL=50.6 October 13, 2004
 Lmax Leq L(90) DNL=59.")
23 Site R2 Hourly Noise Levels :00 2:00 4:00 6:00 8:00 10:00 12:00 14:00 16:00 18:00 20:00 22:00 db(a) Lmax Leq L(90) DNL=59.7 October 13, 2004
 Lmax Leq L(90) DNL=55.")
24 Site R3 Hourly Noise Levels :00 2:00 4:00 6:00 8:00 10:00 12:00 14:00 16:00 18:00 20:00 22:00 db(a) Lmax Leq L(90) DNL=55.1 October 13, 2004
25 Site R4 Hourly Noise Levels :00 2:00 4:00 6:00 8:00 10:00 12:00 14:00 16:00 18:00 20:00 22:00 db(a) Lmax Leq L(90) DNL=56.2 October 28, 2004
26 Site R5 Hourly Noise Levels :00 2:00 4:00 6:00 8:00 10:00 12:00 14:00 16:00 18:00 20:00 22:00 db(a) Lmax Leq L(90) DNL=50.2 October 28, 2004
27 Site R6 Hourly Noise Levels :00 2:00 4:00 6:00 8:00 10:00 12:00 14:00 16:00 18:00 20:00 22:00 db(a) Lmax Leq L(90) DNL=49.4 October 28, 2004
28 Site R7 Hourly Noise Levels :00 2:00 4:00 6:00 8:00 10:00 12:00 14:00 16:00 18:00 20:00 22:00 db(a) Lmax Leq L(90) DNL=46.8 October 28, 2004
29 Site R8 Hourly Noise Levels :00 2:00 4:00 6:00 8:00 10:00 12:00 14:00 16:00 18:00 20:00 22:00 db(a) Lmax Leq L(90) DNL=45.1 Ocotber 28, 2004

30 Site L05 (LMNRA) Average Hourly Noise Levels db(a) Leq L DNL= :00 2:00 4:00 6:00 8:00 10:00 12:00 14:00 16:00 18:00 20:00 22:00 May 6-22, 2004

31 Site L07 (LMNRA) Average Hourly Noise Levels db(a) Leq L90 30 DNL= :00 2:00 4:00 6:00 8:00 10:00 12:00 14:00 16:00 18:00 20:00 22:00 May 5-21, 2004
32 Clark County Department of Aviation D.5 Noise Grid Analysis for Locations of Interest (LOIs) Cumulative noise exposure near existing and potential helicopter flight corridors was evaluated for the ten noise monitoring locations described in Section D.4, including FAA sites L05 and L07, and at seven supplemental locations representing noise-sensitive locations in the region, such as residential areas, schools, recreation areas, and potential animal habitats. These locations, referred to as grid points, are shown on Exhibit IV-5 in Chapter IV. Table D-5 indicates the land use or receptor represented by the grid points, and summarizes the ranges of predicted helicopter noise exposure for each grid point. These ranges in noise exposure were determined using the INM, and represent helicopter activity levels that would occur under the Proposed Action or No Action alternative. Helicopter noise levels are reported in terms of cumulative (DNL) and single-event (L max ) exposure. The L max is considered a supplementary noise metric, and L max values are reported for informational purposes. Noise exposure underneath or near the existing and potential helicopter flight corridors is dependent partly on the altitude at which the helicopters would be flown. For the purposes of the noise analysis, the lowest altitude analyzed for helicopter flight corridors was 300 feet AGL. This is the minimum altitude above the ground required by 14 CFR Part 135, Operating Requirements: Commuter and On Demand Operations and Rules Governing Persons on Board Such Aircraft. According to the air tour operators, the minimum expected vertical distance between the helicopters and the terrain along the routes during Grand Canyon helicopter air tours would be 500 feet when feasible. This would be a voluntary action on the part of the air tour operators. 5 Helicopter DNL values were calculated at the reference grid points using Version 7.0 of the INM. The calculation procedure consisted of using the INM to determine SEL values for individual overflights by the AS350 and EC130 helicopter types and then combining predicted SEL values with the forecast number of helicopter operations on the closest helicopter flight corridors to the grid points. Calculations were conducted for both the 2011 and 2017 helicopter activity levels. The DNL values reported in Table D-5 represent potential helicopter flight altitudes ranging from 300 to 1500 feet AGL. Typically, for receptors located directly beneath a flight corridor, the highest DNL values would occur when the helicopters are at the lowest potential altitude. However, for receptors located farther away from flight corridors, the highest DNL values may occur when the helicopters are relatively higher above the ground. This occurs because absorption of noise by the ground (referred to as lateral attenuation) increases with distance from the helicopter flight corridor and as the angle of the helicopter above the ground becomes smaller with reference to the receptor location CFR Part 135, Operating Requirements: Commuter and On Demand Operations and Rules Governing Persons on Board Such Aircraft, requires a minimum altitude of 300 feet AGL for helicopter operations when over congested areas; however, the Grand Canyon helicopter tour operators currently attempt to achieve a minimum altitude of 500 feet AGL. Final EA for a Southern Nevada Regional Heliport D-28 December 2008 Appendix D
33 Clark County Department of Aviation Table D-5 Summary of Helicopter Noise Levels at Locations of Interest Nearest Helicopter Distance to Nearest Measured Ambient Predicted Helicopter Noise Levels Predicted Helicopter Noise Predicted Single Event Helicopter Grid Point 1/ Representative Land Use Flight Corridor(s) 2/ Flight Corridor(s) (feet) Noise Level (DNL) 3/ (DNL) No Action Alternative 7/ Levels (DNL) Proposed Action 7/ Noise Levels (L max ) 4/ EC130 SA350D R1 Recreation area (trail) Charleston R2 Abandoned mine Tropicana 3, R3 Undeveloped land Henderson (Inbound/Outbound) 7,600/2, n.a. n.a R4 Undeveloped land Henderson (Inbound/Outbound) 21,580/16, n.a. n.a. <25 <25 <35 <35 R5 Sloan Canyon petroglyphs McCullough (Inbound/Outbound) 8,110/13, n.a. n.a R6 Wilderness area with hiking trails McCullough (Inbound/Outbound) 2,580/2, n.a. n.a R7 Wilderness area with hiking trails Jean (Inbound/Outbound) 3,170/2, n.a. n.a R8 Electric power substation Jean (Inbound/Outbound) 1,810/3, n.a. n.a G1 Residential/school area Charleston 5,300 n.a G2 Recreation area (campsite) Tropicana 1,430 n.a G3 Residential area Henderson (Inbound/Outbound) 8,080/2,880 n.a. n.a. n.a G4 Recreation area (trail) Henderson (Inbound/Outbound) 22,420/17,110 n.a. n.a. n.a. <25 <25 <35 <35 G5 Wilderness/habitat area McCullough (Inbound/Outbound) 3,320/8,730 n.a. n.a. n.a G6 Wilderness/habitat area Jean (Inbound/Outbound) 8,200/13,580 n.a. n.a. n.a G7 Residential area Strip Railroad 0 n.a. n.a. n.a L05 5/ Semi-primitive/natural McCullough/Jean (Outbound) 2, / n.a. n.a L07 5/ High use Charleston 1, / Notes: n.a. = Not applicable DNL = Day-night average sound level, expressed in A-weighted decibels 1/ Grid point locations are shown on Exhibit IV-5. Noise measurements were conducted at Sites R1 through R8 and Sites L05 and L07 in / Existing and potential helicopter flight corridors are shown on Exhibit IV-5. 3/ Ambient noise level data are from Table III-2. Sites G1-G7 are supplemental grid point locations where noise levels were calculated using the INM. Ambient noise measurements were not conducted at those locations. 4/ Predicted L max values are shown as a range for individual overflights by the SA350D and EC130 helicopter types at altitudes ranging from 300 feet to 1500 feet above the observer location (grid point). 5/ FAA ambient noise monitoring site and data as described in Baseline Ambient Sound Levels in Lake Mead National Recreation Area (DOT-VNTSC-FAA-06-13), April / DNL values estimated from hourly L eq data measured by the FAA as referenced in Note 5 above. 7/ Predicted DNL values are for potential helicopter flight altitudes ranging from 300 feet to 1500 feet above the observer location (grid point). Source: Brown-Buntin Associates, Inc. Prepared by: Ricondo & Associates, Inc., December 2008 Final EA for a Southern Nevada Regional Heliport D-29 December 2008 Appendix D
34 This page intentionally left blank
35 Clark County Department of Aviation Based on the INM grid point analysis, it is expected that the highest DNLs would occur at the grid points closest to the existing or potential helicopter flight corridors. The highest DNLs would occur at grid points R1 (recreation area/trail) and G7 (residential area). The lowest DNLs (less than 25 dba) would occur at grid points R4 (undeveloped land) and G4 (recreation area/trail). At all grid points, calculated helicopter DNLs are predicted to be below the FAA s DNL 65 significance threshold. In addition, at Sites R1 through R8, and FAA Sites L05 and L07, predicted DNLs from helicopter operations alone under the Proposed Action for 2011 and 2017 are anticipated to be comparable to or less than existing DNL values as measured during ambient noise level monitoring at the same locations in Similarly, the highest helicopter L max noise levels would also occur at grid points R1 and R7 and the lowest helicopter L max noise levels would also occur at grid points R4 and G4. D.6 Helicopter Single Event Noise Level Measurements Noise from individual helicopter overflights, coordinated directly with the pilot in command to ensure a valid fly-by noise event was captured, was measured at seven of the eight ambient noise monitoring locations discussed in Section D.4. These locations are the same as those used to document existing ambient noise levels from all sources affecting the proposed Heliport site, but the fly-by noise assessment focused on direct helicopter overflight noise levels. These individual (or fly-by ) monitoring sites are shown on Exhibit IV-5. At sites near existing air tour routes (Sites R1 and R2), single event noise was measured during normal scheduled air tour operations. Single event noise was measured during pre-arranged test flights at Sites R4 through R8. (Single event noise was not measured at Site R3 because test flights could not be scheduled that would work within constraints imposed by ongoing fixed wing operations at Henderson Executive Airport. It is believed that single event noise levels at Site R3 are adequately represented by measurements at Sites R1, R2, and R4.) Table D-6 summarizes the results of the single event helicopter noise monitoring at Sites R1 through R8. The mean (average) and range of measured maximum noise (L max ) and SELs for the observed helicopter flights are presented in the table. Table D-6 indicates that mean SELs for measured helicopter noise events ranged from approximately 57 to 85 dba. and that mean L max values for measured helicopter noise events ranged from approximately 43 to 76 dba The variability in measured noise levels was primarily caused by differences in the distance between helicopter flight routes and individual monitoring sites. The highest noise levels were recorded at Sites R6, R7, and R8, where helicopters consistently flew almost directly overhead during the test flights. The lowest noise levels were recorded at Site R5 (Sloan Canyon petroglyphs), where the closest potential helicopter flight corridor is more than a mile to the north. Final EA for a Southern Nevada Regional Heliport D-30 December 2008 Appendix D
36 Clark County Department of Aviation Table D-6 Summary of Measured Single Event Noise Levels of Helicopter Overflights Helicopter Number L max, (dba) SEL (dba) Azimuth 2/ Site 1/ Type Sampled Average (Range) Average (Range) (Degrees) R1 AS ( ) 72.1 ( ) R2 R4 R5 R6 AS ( ) 77.3 ( ) EC ( ) 77.7 ( ) 90 AS ( ) 79.6 ( ) EC ( ) 77.7 ( ) AS ( ) 59.4 ( ) 30 EC ( ) 56.9 ( ) 30 AS ( ) 81.9 ( ) EC ( ) 77.1 ( ) 75 Notes: L max SEL R7 AS ( ) 85.1 ( ) 90 R8 AS ( ) 81.7 ( ) = The maximum A-weighted sound level (L max ) is the loudest part of a noise event, measured in decibels. As an aircraft passes an observer overhead, the noise increases to a maximum level and then decreases. = Sound exposure level (SEL) is a time-integrated measure, expressed in decibels, of the sound energy of a single noise event at a reference duration of one second. 1/ Designations correspond to the monitoring site locations shown on Exhibit IV-5. 2/ The azimuth is the angle between the aircraft flight path and the microphone at the point when the aircraft is closest to the microphone. An azimuth of 90 degrees means that the aircraft passed directly over the microphone. Source: Brown-Buntin Associates, Inc., January 2005 Prepared by: Ricondo & Associates, Inc., December 2008 D.7 Predicted Single Event Noise Levels Beneath or near Helicopter Flight Tracks Exhibits D-18 and D-19 depict SEL values predicted by Version 7.0 of the INM for the AS350 and the EC130 helicopter types, respectively, at a range of flight altitudes and lateral distances from the flight route. Exhibits D-20 and D-21 depict L max values predicted by Version 7.0 of the INM for the AS350 and the EC130 helicopter types, respectively. Based on the information shown on the exhibits, the AS350 helicopter registers approximately 0.2 db higher than the EC130 helicopter when the helicopters are directly overhead. As lateral distance from the helicopter flight route increases, the difference between noise levels generated by the two helicopter types becomes more pronounced. On the left side of the helicopter, the EC130 is approximately 1.0 db quieter than the AS350 at a lateral distance of 3000 feet from the flight route. On the right side of the helicopter, the EC130 is about 3.5 db quieter than the AS350 at a lateral distance of 3000 feet from the flight route. Final EA for a Southern Nevada Regional Heliport D-31 December 2008 Appendix D
37
38
39
40
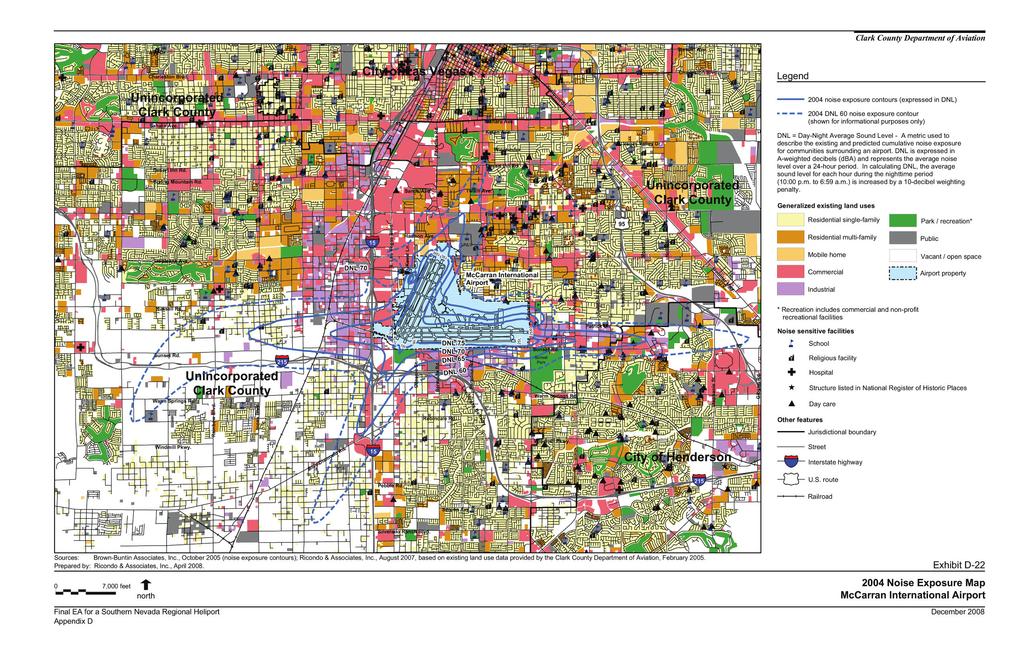
41 Clark County Department of Aviation As shown on Exhibit D-18, the highest predicted SEL for the AS350 helicopter (83.3 dba) would occur when the helicopter is 300 feet AGL and at a location of zero feet horizontally from the center of the flight track. As shown on Exhibit D-19, the highest predicted SEL for the EC130 helicopter (83.1dBA) would also occur when the helicopter is 300 feet AGL and at a location of zero feet horizontally from the center of the flight track. Predicted SEL values shown in Exhibits D-18 and D-19 are comparable to SEL values measured during actual helicopter overflights as described in Table D-6. As shown on Exhibit D-20, the highest predicted L max for the AS350 helicopter (80.0 dba) would occur when the helicopter is 300 feet AGL and at a location of zero feet horizontally from the center of the flight track. As shown on Exhibit D-21, the highest predicted L max for the EC130 helicopter (78.0 dba) would also occur when the helicopter is 300 feet AGL and at a location of zero feet horizontally from the center of the flight track. Predicted L max values shown in Exhibits D-20 and D-21 are comparable to L max values measured during actual helicopter overflights as described in Table D-6. D.8 FAR Part 150 Noise Compatibility Study Update, McCarran International Airport Beginning in 2005 and throughout 2006, the Clark County Department of Aviation conducted an Update to the 14 CFR Part 150 Noise Compatibility Study for McCarran International Airport, located in Las Vegas, Nevada. Four Open Houses were held during the preparation of the 14 CFR Part 150 Study Update (August 2005, October 2005, May 2006, and September 2006). The public comment period for the 14 CFR Part 150 Study Update was from August 29, 2006 through October 6, 2006; a formal Public Hearing was held on October 3, The 14 CFR Part 150 Study Update is comprised of three volumes. Volume 1: Noise Exposure Map Report contains noise exposure maps (NEMs) for 2004, 2011, and 2017 and associated documentation. The 2004, 2011, and 2017 noise exposure maps are included herein as Exhibits D-22 through D-24. The Noise Exposure Map Report was submitted to the FAA in December 2006 for review and acceptance. Volume 2: Noise Compatibility Program (NCP) Report, describes 13 noise abatement measures and nine noise mitigation measures proposed for McCarran. The NCP report was submitted to the FAA in March It is anticipated that the FAA will complete its review of the NCP report in Volume 3 of the 14 CFR Part 150 Study Update includes a compilation of public comments regarding the 14 CFR Part 150 Study Update and responses to those comments, and details the extensive outreach programs undertaken during the development of the 14 CFR Part 150 Study Update. Volume 3 was submitted to the FAA in December Pursuant to Section 107(a) & (b) [Title 49, United States Code, Section 47506] of the Airport Safety and Noise Abatement Act of 1979, as amended, on July 10, 2007, the FAA completed its evaluation of, and has formally accepted, the 2004 and 2011 NEMs included in the Noise Exposure Map Report. Final EA for a Southern Nevada Regional Heliport D-36 December 2008 Appendix D
42 This page intentionally left blank
43
LAX Community Noise Roundtable. Aircraft Noise 101. November 12, 2014
 LAX Community Noise Roundtable Aircraft Noise 101 November 12, 2014 Overview Roles and Responsibilities for Aircraft Noise Relevant Federal Regulations Relevant California Regulations Aircraft Noise Metrics
WELCOME! FORT LAUDERDALE-HOLLYWOOD INTERNATIONAL AIRPORT 14 CFR PART 150 NOISE AND LAND USE COMPATIBILITY STUDY
 WELCOME! FORT LAUDERDALE-HOLLYWOOD INTERNATIONAL AIRPORT 14 CFR PART 150 NOISE AND LAND USE COMPATIBILITY STUDY Public Information Workshop November 2017 1 14 CFR Part 150 Overview Establishes the methodology
Portable Noise Monitor Report
 Portable Noise Monitor Report Chicago O Hare International Airport Site 2117 5843 N. Christiana Avenue, Chicago July 14, 217 through August 2, 217 USH5-ILH15-ILS8-CHI39 Visit the O Hare Noise webpage on
1.0 OUTLINE OF NOISE ANALYSIS...3
 Table of Contents 1.0 OUTLINE OF NOISE ANALYSIS...3 2.0 METHODOLOGY...3 2.1 BACKGROUND...3 2.2 COMPUTER MODELING...3 3.0 EXISTING NOISE ENVIRONMENT...4 3.1 EXISTING SANTA MONICA MUNICIPAL AIRPORT NOISE...4
Portable Noise Monitor Report
 Portable Noise Monitor Report Chicago O Hare International Airport Site 2114 5516 N. Neenah Avenue, Chicago July 12, 217 through August 9, 217 USH5-ILH19-ILS1-CHI45 Visit the O Hare Noise webpage on the
Portable Noise Monitor Report
 Portable Noise Monitor Report Chicago O Hare International Airport Site 299 93 Wilshire Avenue, Elk Grove Village June 27, 217 through July 1, 217 USH8-ILH55-ILS28 Visit the O Hare Noise webpage on the
Portable Noise Monitor Report
 Portable Noise Monitor Report Chicago O Hare International Airport Site 213 475 W. Hutchinson Street, Chicago April 8, 217 through May 3, 217 USH5-ILH19-ILS1-CHI45 Visit the O Hare Noise webpage on the
Portable Noise Monitor Report
 Portable Noise Monitor Report Chicago O Hare International Airport Site 241 61 Grange Road, Elk Grove Village October 3, 215 through October 19, 215 USH8-ILH55-ILS28 Visit the O Hare Noise webpage on the
Portable Noise Monitor Report
 Portable Noise Monitor Report Chicago O Hare International Airport Site 2198 5N67 Rochefort Lane, Wayne May 9, 218 through June 3, 218 USH6-ILH49-ILS25 Visit the O Hare Noise webpage on the Internet at
Part 150 and Part 161: Purpose, Elements, and Process
 Part 150 and Part 161: Purpose, Elements, and Process Presentation to: Noise Compatibility Committee January 29, 2015 Ted Baldwin Part 150, Airport Noise Compatibility Planning FAA created in response
APPENDIX H 2022 BASELINE NOISE EXPOSURE CONTOUR
 APPENDIX H 2022 BASELINE NOISE EXPOSURE CONTOUR This appendix sets forth the detailed input data that was used to prepare noise exposure contours for 2022 Baseline conditions. H.1 DATA SOURCES AND ASSUMPTIONS
> Aircraft Noise. Bankstown Airport Master Plan 2004/05 > 96
 Bankstown Airport Master Plan 2004/05 > 96 24.1 Why Is Aircraft Noise Modelled? Modelling of the noise impact of aircraft operations has been undertaken as part of this MP. Such modelling is undertaken
The purpose of this Demand/Capacity. The airfield configuration for SPG. Methods for determining airport AIRPORT DEMAND CAPACITY. Runway Configuration
 Chapter 4 Page 65 AIRPORT DEMAND CAPACITY The purpose of this Demand/Capacity Analysis is to examine the capability of the Albert Whitted Airport (SPG) to meet the needs of its users. In doing so, this
CHAPTER 6 NOISE EXPOSURE
 CHAPTER 6 NOISE EXPOSURE FAA requires that the NEM submitted for review represent the aircraft noise exposure for the year of submittal (in this case 2008) and for a future year (2013 for OSUA). However,
Washington Dulles International Airport (IAD) Aircraft Noise Contour Map Update
 Aircraft Noise Contour Map Update") Washington Dulles International Airport (IAD) Aircraft Noise Contour Map Update Ultimate ASV, Runway Use and Flight Tracks 4th Working Group Briefing 8/13/18 Meeting Purpose Discuss Public Workshop input
Washington Dulles International Airport (IAD) Aircraft Noise Contour Map Update Ultimate ASV, Runway Use and Flight Tracks 4th Working Group Briefing 8/13/18 Meeting Purpose Discuss Public Workshop input
APA NOISE REPORT. January 2018
 January 2018 [Grab your reader s attention with a great quote from the document or use this space to emphasize a key point. To place this text box anywhere on the page, just drag it.] APA NOISE REPORT
PRELIMINARY WEB DOCUMENT
 APA NOISE REPORT May 2018 [Grab your reader s attention with a great quote from the document or use this space to emphasize a key point. To place this text box anywhere on the page, just drag it.] 1 TABLE
According to FAA Advisory Circular 150/5060-5, Airport Capacity and Delay, the elements that affect airfield capacity include:
 4.1 INTRODUCTION The previous chapters have described the existing facilities and provided planning guidelines as well as a forecast of demand for aviation activity at North Perry Airport. The demand/capacity
APA NOISE REPORT. August 2018
 August 2018 [Grab your reader s attention with a great quote from the document or use this space to emphasize a key point. To place this text box anywhere on the page, just drag it.] APA NOISE REPORT 1
APA NOISE REPORT. August 2017
 August 2017 [Grab your reader s attention with a great quote from the document or use this space to emphasize a key point. To place this text box anywhere on the page, just drag it.] APA NOISE REPORT 1
SAN FRANCISCO INTERNATIONAL AIRPORT CITY & COUNTY OF SAN FRANCISCO MEMORANDUM
 SAN FRANCISCO INTERNATIONAL AIRPORT CITY & COUNTY OF SAN FRANCISCO MEMORANDUM TO: MONTARA COMMUNITY FROM: SAN FRANCISCO INTERNATIONAL AIRPORT AIRCRAFT NOISE ABATEMENT OFFICE SUBJECT: MONTARA SHORT-TERM
STAFF REPORT. Airport Land Use Consistency Determination Betteravia Plaza. MEETING DATE: January 21, 2016 AGENDA ITEM: 8D
 STAFF REPORT SUBJECT: Airport Land Use Consistency Determination Betteravia Plaza MEETING DATE: AGENDA ITEM: 8D STAFF CONTACT: Andrew Orfila RECOMMENDATION: Adopt findings for the Betteravia Plaza project
Ted Stevens Anchorage International Airport FAR Part 150 Study Update Glossary of Common Acoustic and Air Traffic Control Terms
 Ted Stevens Anchorage International Airport FAR Part 150 Study Update Glossary of Common Acoustic and Air Traffic Control Terms ADOT&PF (Alaska Department of Transportation and Public Facilities): The
Welcome to Public Information Workshop 1. San Francisco International Airport FAR Part 150 Study Update Noise Exposure Map Report
 Welcome to Public Information Workshop 1 Chetcuti Room, City of Milbrae 450 Poplar Avenue Milbrae, California 94030 Wednesday, June 4, 2014 5:45 p.m. to 6:45 p.m. PDT The FAA typically uses the airport
Memorandum. Federal Aviation Administration. Date: June 19, Richard Doucette, Environmental Protection Specialist. From: To:
 Federal Aviation Administration Memorandum Date: June 19, 2008 From: To: Subject: Richard Doucette, Environmental Protection Specialist LaVerne Reid, Airports Division Manager John Donnelly, Regional Counsel
Martin County Airport / Witham Field Noise Abatement Departure Profile (NADP) Demonstration Technical Report March 2010
 Demonstration Technical Report March 2010") Martin County Airport / Witham Field Noise Abatement Departure Profile (NADP) Demonstration Technical Report March 2010 Prepared for: Federal Aviation Administration (FAA) Orlando Airport District Office
Martin County Airport / Witham Field Noise Abatement Departure Profile (NADP) Demonstration Technical Report March 2010 Prepared for: Federal Aviation Administration (FAA) Orlando Airport District Office
Portable Noise Monitor Report
 Portable Noise Monitor Report Chicago O Hare International Airport Site 221 5716 N. Virginia Avenue, Chicago July 23, 214 through August 11, 214 Visit the O Hare Noise Management Webpage on the Internet
STAFF REPORT. Airport Land Use Plan Consistency Review: Santa Barbara Airport Master Plan. MEETING DATE: November 19, 2015 AGENDA ITEM: 7D
 STAFF REPORT SUBJECT: Airport Land Use Plan Consistency Review: Santa Barbara Airport Master Plan MEETING DATE: AGENDA ITEM: 7D STAFF CONTACT: Peter Imhof, Andrew Orfila RECOMMENDATION: Adopt findings
Aircraft Noise. Why Aircraft Noise Calculations? Aircraft Noise. SoundPLAN s Aircraft Noise Module
 Aircraft Noise Why Aircraft Noise Calculations? Aircraft Noise Aircraft noise can be measured and simulated with specialized software like SoundPLAN. Noise monitoring and measurement can only measure the
The following criteria shall be applied within the boundaries of the AO District:
 Sec. 419 (a) Purpose AIRPORT OVERLAY DISTRICT (AO) The purpose of the Airport Overlay District is to regulate and restrict the height of structures, objects, or natural growth, regulate the locations of
Appendix A. Meeting Coordination. Appendix A
 Appendix A Meeting Coordination Appendix A Philadelphia International Airport Noise Compatibility Program Update FAR Part 150 Noise Compatibility Program Update Report Prepared by: DMJM Aviation AECOM
Appendix B Ultimate Airport Capacity and Delay Simulation Modeling Analysis
 Appendix B ULTIMATE AIRPORT CAPACITY & DELAY SIMULATION MODELING ANALYSIS B TABLE OF CONTENTS EXHIBITS TABLES B.1 Introduction... 1 B.2 Simulation Modeling Assumption and Methodology... 4 B.2.1 Runway
RTIA Runway Utilization Discussion Paper
 RTIA Runway Utilization Discussion Paper December 2003 1.0 Introduction The Airport Noise Advisory Panel (ANAP) is a voluntary committee formed by the Airport Authority of Washoe County (AAWC) Board of
PUBLIC INFORMATION WORKSHOP #4 / PUBLIC HEARING November 8 / 9, 2006
 PUBLIC INFORMATION WORKSHOP #4 / PUBLIC HEARING November 8 / 9, 2006 A Noise Compatibility Study, prepared under Part 150 of the Federal Aviation Regulations (FAR), is a voluntary program aimed at balancing
Appendix C AIRPORT LAYOUT PLANS
 Appendix C AIRPORT LAYOUT PLANS Appendix C AIRPORT LAYOUT PLANS Airport Master Plan Santa Barbara Airport As part of this Airport Master Plan, the Federal Aviation Administration (FAA) requires the development
Technical Report. Aircraft Overflight and Noise Analysis. Brisbane, California. December Prepared by:
 Aircraft Noise Abatement Office Technical Report Aircraft Overflight and Noise Analysis Brisbane, California Prepared by: P.O. Box 8097 San Francisco, California 94128 (650) 821-5100 Introduction In response
APPENDIX C NOISE ANALYSIS
 APPENDIX C NOISE ANALYSIS KBE Final - 10/11/16 Existing Noise The extent of existing noise resulting from aircraft operations at Central Colorado Regional Airport (AEJ) was determined using the FAA-approved
STAFF REPORT. Airport Land Use Plan Consistency Review: Old Town Village Mixed Use Project City of Goleta. MEETING DATE: June 18, 2015 AGENDA ITEM: 5M
 STAFF REPORT SUBJECT: Airport Land Use Plan Consistency Review: Old Town Village Mixed Use Project City of Goleta MEETING DATE: AGENDA ITEM: 5M STAFF CONTACT: Peter Imhof, Andrew Orfila RECOMMENDATION:
London Biggin Hill Airport Runway 03 Approach A9912 N02 DC. Noise Assessment Extended D Charles 1.0 INTRODUCTION
 Project: File Ref: London Biggin Hill Airport Runway 03 Approach Date: 6 January 2016 Subject: From: Noise Assessment Extended D Charles To: Name Company Will Curtis Peter Mirams Barry Hawkins London Biggin
Northeast Stoney Trail In Calgary, Alberta
 aci Acoustical Consultants Inc. 5031 210 Street Edmonton, Alberta, Canada T6M 0A8 Phone: (780) 414-6373, Fax: (780) 414-6376 www.aciacoustical.com Environmental Noise Computer Modelling For Northeast Stoney
Boston Logan. Airport Noise Study
 Boston Logan International Airport Boston Logan Airport Noise Study Level 3 Screening Analysis December 2012 Prepared by Ricondo & Associates, Inc. Prepared for Federal Aviation Administration in collaboration
TORONTO PEARSON INTERNATIONAL AIRPORT NOISE MANAGEMENT
 TORONTO PEARSON INTERNATIONAL AIRPORT NOISE MANAGEMENT Noise and the GTAA The GTAA is sensitive to the issue of aircraft noise and how it affects our neighbours. Since assuming responsibility for Toronto
APPENDIX D MSP Airfield Simulation Analysis
 APPENDIX D MSP Airfield Simulation Analysis This page is left intentionally blank. MSP Airfield Simulation Analysis Technical Report Prepared by: HNTB November 2011 2020 Improvements Environmental Assessment/
6.C.1 AIRPORT NOISE. Noise Analysis and Land Use Impact Assessment FORT LAUDERDALE-HOLLYWOOD INTERNATIONAL AIRPORT ENVIRONMENTAL IMPACT STATEMENT
 6.C.1 AIRPORT NOISE The existing land uses are described in Chapter Five, Affected Environment. The methodologies used to develop the Geographic Information System (GIS) land use database, the estimated
Session 15 The Law of Airport Noise 101
 Session 15 The Law of Airport Noise 101 31 st Annual AAAE Basics of Airport Law Workshop and 2015 Legal Update November 1-3, 2015 Desk Reference Chapters 1, 17, 18 Catherine van Heuven Kaplan Kirsch &
FORT LAUDERDALE-HOLLYWOOD INTERNATIONAL AIRPORT ENVIRONMENTAL IMPACT STATEMENT DRAFT
 D.3 RUNWAY LENGTH ANALYSIS Appendix D Purpose and Need THIS PAGE INTENTIONALLY LEFT BLANK Appendix D Purpose and Need APPENDIX D.3 AIRFIELD GEOMETRIC REQUIREMENTS This information provided in this appendix
at: Accessed May 4, 2011.
 3.11 SAFETY 3.11.1 Background and Methodology As with other forms of transportation, there is risk associated with aviation activities. This section focuses on risk to those on the ground near airports.
St. Paul Downtown Airport (STP)
") Reliever Airports: NOISE ABATEMENT PLAN St. Paul Downtown Airport (STP) 1 INTRODUCTION The noise abatement plan for the St. Paul Downtown Airport (STP) was prepared in recognition of the need to make the
Reliever Airports: NOISE ABATEMENT PLAN St. Paul Downtown Airport (STP) 1 INTRODUCTION The noise abatement plan for the St. Paul Downtown Airport (STP) was prepared in recognition of the need to make the
Quiet Climb. 26 AERO First-Quarter 2003 January
 Quiet Climb Boeing has developed the Quiet Climb System, an automated avionics feature for quiet procedures that involve thrust cutback after takeoff. By reducing and restoring thrust automatically, the
Pacifica. Short Term Aircraft Noise Monitoring
 Short Term Aircraft Noise Monitoring March March, Pacifica Prepared for the Oddstad Boulevard Park Pacifica Avenue Neighborhoods by San Francisco International Airport Noise Abatement Office P.O. Box 8097
Perth Noise Abatement Procedures - Change to Preferred Runways
 Environmental Analysis Summary Preferred Runways Perth Perth Airport Perth Noise Abatement Procedures - Change to Preferred Runways Environmental Analysis Summary April 2016 1 of 10 Environment Analysis
Airport Noise Modelling ACNCC Meeting October 15, 2009
 ACNCC Meeting October 15, 2009 Prepared by: AECOM Canada Ltd. 2540 Kensington Road NW, Calgary, AB, Canada T2N 3S3 T 403.270.9200 F 403.270.0399 www.aecom.com Project Number: 2759-095-00 Date: November
Buchanan Field. Airport Planning Program. FAR Part 150 Meeting. September 28, Master Plan FAR Part 150 Noise Study Strategic Business Plan
 Airport Planning Program Master Plan FAR Part 150 ise Study Strategic Business Plan FAR Part 150 Meeting September 28, 2006 Agenda Introduction Part 150 Study Working Paper Two Operational Alternatives
Recommendations for Northbound Aircraft Departure Concerns over South Minneapolis
 Recommendations for Northbound Aircraft Departure Concerns over South Minneapolis March 21, 2012 Noise Oversight Committee Agenda Item #4 Minneapolis Council Member John Quincy Background Summer of 2011
Part 150 Noise Compatibility Program Checklist
 Part 150 Noise Compatibility Program Checklist I. IDENTIFICATION AND SUBMISSION OF PROGRAM: Page Number A. Submission is properly identified: 1. 14 C.F.R Part 150 NCP? Yes, Cover, Fly Sheet, Cover Letter
 Burlington )@=8796?;9!-9?5=93?7;938!(7=
 Runway Length Analysis Prescott Municipal Airport
 APPENDIX 2 Runway Length Analysis Prescott Municipal Airport May 11, 2009 Version 2 (draft) Table of Contents Introduction... 1-1 Section 1 Purpose & Need... 1-2 Section 2 Design Standards...1-3 Section
Heathrow Community Noise and Track-keeping Report: Burhill
 Heathrow Community Noise and Track-keeping Report: Burhill This document reports on an 1-day period of continuous noise monitoring from 14 June 211 to 21 September 211 using a Larson Davies LD 87 sound
Portable Noise Monitor Report
 Portable Noise Monitor Report Chicago O Hare and Midway International Airports Site 217 1149 Candlewood Drive, Downers Grove May 17, 214 through May 31, 214 Visit the O Hare and Midway Noise Management
T.F. Green Airport Part 150 Update Noise Exposure Map
 T.F. Green Airport Part 150 Update Noise Exposure Map Draft June 2010 Submitted to: Rhode Island Airport Corporation Submitted by: T.F. Green Airport 14 CFR Part 150 Update 2010 and 2020 NOISE EXPOSURE
Final. Hydroacoustic and Airborne Monitoring at the Naval Station. Mayport Interim Report June 2015
 Final Hydroacoustic and Airborne Monitoring at the Naval Station Submitted to: Naval Facilities Engineering Command Atlantic under HDR Environmental, Operations and Construction, Inc. Contract No. N62470-10-D-3011,
II. Purpose and Need. 2.1 Background
 II. 2.1 Background The Metropolitan Washington Airports Authority is preparing an Environmental Assessment of potential environmental impacts associated with proposed enhancements to the Runway 4-22 and
FRENCH VALLEY AIRPORT (F70) Sky Canyon Dr. Murrieta, CA. Phone: Riverside FAA FSDO Complaint Line: (951)
 Sky Canyon Dr. Murrieta, CA. Phone: Riverside FAA FSDO Complaint Line: (951)") FRENCH VALLEY AIRPORT (F70) 37600 Sky Canyon Dr. Murrieta, CA Phone: 951-600-7297 Riverside FAA FSDO Complaint Line: (951) 276-6701 Visit the F70 website for additional information regarding the airport
FRENCH VALLEY AIRPORT (F70) 37600 Sky Canyon Dr. Murrieta, CA Phone: 951-600-7297 Riverside FAA FSDO Complaint Line: (951) 276-6701 Visit the F70 website for additional information regarding the airport
Van Nuys Airport December 2011 Updated 14 C.F.R. Part 150 Noise Exposure Maps page 1
 Updated 14 C.F.R. Part 150 Noise Exposure Maps page 1 1 INTRODUCTION The federal Airport Safety and Noise Abatement Act of 1979 1 ( ASNA ), as amended, defines procedures under which the federal government,
Forecast of Aviation Activity
 DETROIT METROPOLITAN WAYNE COUNTY AIRPORT FAR PART 150 NOISE COMPATIBILITY STUDY UPDATE CHAPTER B FORECAST OF AVIATION ACTIVITY Forecast of Aviation Activity Introduction This chapter summarizes past aviation
Hartford-Brainard Airport Potential Runway Closure White Paper
 Hartford-Brainard Airport Potential Runway 11-29 Closure White Paper June 2012 In recent years there has been discussion regarding the necessity of Runway 11-29 to the Hartford- Brainard Airport (HFD)
Master Plan & Noise Compatibility Study Update
 Working Document-Subject to Change, March 2010 Master Plan & Noise Compatibility Study Update (14 CFR Part 150) TECHNICAL ADVISORY COMMITTEE March 24, 2010 Working Document-Subject to Change, March 2010
Consideration will be given to other methods of compliance which may be presented to the Authority.
 Advisory Circular AC 139-10 Revision 1 Control of Obstacles 27 April 2007 General Civil Aviation Authority advisory circulars (AC) contain information about standards, practices and procedures that the
Airport Obstruction Standards
 Airport Obstruction Standards Dr. Antonio Trani Department of Civil and Environmental Engineering Virginia Tech Outline of this Presentation Obstructions to navigation around airports Discussion of Federal
TANZANIA CIVIL AVIATION AUTHORITY AIR NAVIGATION SERVICES INSPECTORATE. Title: CONSTRUCTION OF VISUAL AND INSTRUMENT FLIGHT PROCEDURES
 Page 1 of 8 1. PURPOSE 1.1. This Advisory Circular provides guidance to personnel involved in construction of instrument and visual flight procedures for publication in the Aeronautical Information Publication.
WELCOME! FORT LAUDERDALE-HOLLYWOOD INTERNATIONAL AIRPORT 14 CFR PART 150 NOISE AND LAND USE COMPATIBILITY STUDY
 WELCOME! FORT LAUDERDALE-HOLLYWOOD INTERNATIONAL AIRPORT 14 CFR PART 150 NOISE AND LAND USE COMPATIBILITY STUDY Public Information Workshop #2 January 2019 Station 1: Par t 150 Over view 14 CFR Part 150
Noise Issues. Dr. Antonio A. Trani Professor
 Noise Issues CEE 4674 Analysis of Air Transportation Systems Dr. Antonio A. Trani Professor Virginia Tech - Air Transportation Systems Laboratory What is Noise? Many definitions of noise exist Unwanted
Chapter Six ALP Drawings. Tacoma Narrows Airport. Master Plan Update
 Chapter Six ALP Drawings Master Plan Update The master planning process for the (Airport) has evolved through efforts in the previous chapters to analyze future aviation demand, establish airside and landside
Minneapolis-St. Paul International Airport (MSP)
") 2 nd Quarter 2016 Minneapolis-St. Paul International Airport (MSP) Public Input Meeting Metropolitan Airports Commission Noise Program Office April 27, 2016 PUBLIC INPUT MEETING Meeting Goals To hear the
2 nd Quarter 2016 Minneapolis-St. Paul International Airport (MSP) Public Input Meeting Metropolitan Airports Commission Noise Program Office April 27, 2016 PUBLIC INPUT MEETING Meeting Goals To hear the
1. Background and Proposed Action
 1. Background and Proposed Action This chapter describes Hillsboro Airport and the planning background for the proposed project. The Port of Portland (the Port) is the sponsor for the Hillsboro Airport
1.1.3 Taxiways. Figure 1-15: Taxiway Data. DRAFT Inventory TYPICAL PAVEMENT CROSS-SECTION LIGHTING TYPE LENGTH (FEET) WIDTH (FEET) LIGHTING CONDITION
 WIDTH (FEET) LIGHTING CONDITION") 1.1.3 Taxiways EWN has an extensive network of taxiways and taxilanes connecting the terminal, air cargo, and general aviation areas with the runways as listed in Figure 1-15. A 50-foot wide parallel taxiway
1.1.3 Taxiways EWN has an extensive network of taxiways and taxilanes connecting the terminal, air cargo, and general aviation areas with the runways as listed in Figure 1-15. A 50-foot wide parallel taxiway
PLAN Anoka County - Blaine Airport
 Reliever Airports: NOISE ABATEMENT PLAN Anoka County - Blaine Airport INTRODUCTION The noise abatement plan for the Anoka County-Blaine Airport was prepared in recognition of the need to make the airport
REVIEW OF GOLD COAST AIRPORT Noise Abatement Procedures
 REVIEW OF GOLD COAST AIRPORT Noise Abatement Procedures Introduction The purpose of this document is to present an overview of the findings of the review of the Noise Abatement Procedures (NAPs) in place
Part 150 Committee April 24, 2008
 Part 150 Committee April 24, 2008 Part 150 Committee Aircraft Operations Inputs Flight Track and Runway Use Inputs DNL Contour Results SEL Contours Noise Measurement Results Public Comment and Questions
Washington Dulles International Airport (IAD) Noise Contour Map Update. For Publication on MWAA Website April 4, 2018
 Noise Contour Map Update. For Publication on MWAA Website April 4, 2018") Washington Dulles International Airport (IAD) Noise Contour Map Update For Publication on MWAA Website April 4, 2018 Introduction Background Existing Conditions Noise Contours Land Use Compatibility Planning
Washington Dulles International Airport (IAD) Noise Contour Map Update For Publication on MWAA Website April 4, 2018 Introduction Background Existing Conditions Noise Contours Land Use Compatibility Planning
2015 ANNUAL NOISE REPORT
 2015 ANNUAL NOISE REPORT MASSACHUSETTS PORT AUTHORITY L.G. HANSCOM FIELD BEDFORD, MA 01730 PREPARED BY AMBER GOODSPEED SUBMITTED TO HANSCOM FIELD ADVISORY COMMISSION July 2016 Connecting with our communities
Quieter Skies Report. Partnership for. Fort Lauderdale-Hollywood International Airport. Prepared by: Broward County Aviation Department
 Fort Lauderdale-Hollywood International Airport Prepared by: February 2016 Partnership for Quieter Skies Report The Report provides an overview of progress of efforts to reduce the noise impacts of Fort
DEPARTMENT: CIVIL ENGINEERING SEMESTER: III SUBJECT CODE / Name: CE2303/ Railway, Airport and Harbors Engineering 2 MARK QUESTIONS AND ANSWERS
 DEPARTMENT: CIVIL ENGINEERING SEMESTER: III SUBJECT CODE / Name: CE2303/ Railway, Airport and Harbors Engineering 2 MARK QUESTIONS AND ANSWERS 1.Define wind Coverage (AUC NOV/DEC 2010),(AUC NOV/DEC 2011)
PART D: Potential environmental impact of proposals affecting Southport, Formby, Ormskirk, Skelmersdale and surrounding areas
 IRISH SEA AIRSPACE CHANGE PROPOSAL PART D: Potential environmental impact of proposals affecting Southport, Formby, Ormskirk, Skelmersdale and surrounding areas Page D1 of D12 Introduction 1. This part
Analysis of Operational Impacts of Continuous Descent Arrivals (CDA) using runwaysimulator
 using runwaysimulator") Analysis of Operational Impacts of Continuous Descent Arrivals (CDA) using runwaysimulator Camille Shiotsuki Dr. Gene C. Lin Ed Hahn December 5, 2007 Outline Background Objective and Scope Study Approach
Analysis of Operational Impacts of Continuous Descent Arrivals (CDA) using runwaysimulator Camille Shiotsuki Dr. Gene C. Lin Ed Hahn December 5, 2007 Outline Background Objective and Scope Study Approach
ORDINANCE NO. _2013-
 ORDINANCE NO. _2013- AN ORDINANCE OF THE TOWNSHIP OF CONEWAGO, DAUPHIN COUNTY, PENNSYLVANIA, PROVIDING FOR AIRPORT ZONING REGULATIONS WITHIN THE AIRPORT ZONING OVERLAY DISTRICT CREATED BY THIS ORDINANCE
14 CFR PART 150 NOISE AND LAND USE COMPATIBILITY STUDY. Technical Committee Meeting #2 August 23, 2017
 14 CFR PART 150 NOISE AND LAND USE COMPATIBILITY STUDY Technical Committee Meeting #2 August 23, 2017 1 Agenda Introductions Review of the Role of the TC Meeting Facilitator Review of TC Meeting No.1 Data
Glossary of common Acoustic and Air Traffic Control terms
 Glossary of common Acoustic and Air Traffic Control terms A A-WEIGHTED SOUND LEVEL (dba) - The human ear does not respond equally to all sound frequencies. It is less efficient at low and high frequencies
Developing an Aircraft Weight Database for AEDT
 17-02-01 Recommended Allocation: $250,000 ACRP Staff Comments This problem statement was also submitted last year. TRB AV030 supported the research; however, it was not recommended by the review panel,
March 2016 Safety Meeting
 March 2016 Safety Meeting AC 61 98C Subject: Currency Requirements and Guidance for the Flight Review and Instrument Proficiency Check Date: 11/20/15 AC No: 61-98C Initiated by: AFS-800 Supercedes: AC
Arriving and departing aircraft at Edinburgh Airport
 Arriving and departing aircraft at Edinburgh Airport Contents Introduction... 3 Arriving aircraft... 3 The Instrument Landing System (ILS)... 6 Visual Approach... 6 Non Directional Beacon Approach... 6
14 CFR Part 150 Study
 14 CFR Part 150 Study NOISE EXPOSURE MAP and NOISE COMPATIBILITY PROGRAM Volume I Prepared for: CONNECTICUT DEPARTMENT OF TRANSPORTATION Prepared by: HNTB Corporation In association with HMMH Inc. Elvin
Westchester County Airport Aircraft Noise Study
 Westchester County Airport Aircraft Noise Study Prepared for: Westchester County Department of Transportation Prepared by: TAMS Consultants, Inc. Harris Miller Miller & Hans on, Inc. August 2002 EXECUTIVE
CATCODE ] CATCODE
![CATCODE ] CATCODE](/thumbs/82/85644630.jpg "CATCODE ] CATCODE") Runways. FAC: 1111 CATCODE: 111111 OPR: AFCEC/COS OCR: AF/A3O-A 1.1. Description. The runway is the paved surface provided for normal aircraft landings and take offs. Runways are classified as either Class
Runways. FAC: 1111 CATCODE: 111111 OPR: AFCEC/COS OCR: AF/A3O-A 1.1. Description. The runway is the paved surface provided for normal aircraft landings and take offs. Runways are classified as either Class
AIRSPACE PROTECTION. Guidance and considerations for development in the vicinity of Ohio s airports and heliports
 AIRSPACE PROTECTION Guidance and considerations for development in the vicinity of Ohio s airports and heliports UPDATED SPRING 2018 AIRSPACE PROTECTION When construction is proposed near public use airports
Revised National Business Aviation Association (NBAA) Noise Abatement Departure Procedures (NADPs) Noise Compatibility Committee
 Noise Abatement Departure Procedures (NADPs) Noise Compatibility Committee") Revised National Business Aviation Association (NBAA) Noise Abatement Departure Procedures (NADPs) Presentation to: Noise Compatibility Committee October 29, 2015 Ted Baldwin What are NADPs? Departure
Revised National Business Aviation Association (NBAA) Noise Abatement Departure Procedures (NADPs) Presentation to: Noise Compatibility Committee October 29, 2015 Ted Baldwin What are NADPs? Departure
Draft Concept Alternatives Analysis for the Inaugural Airport Program September 2005
 Draft Concept Alternatives Analysis for the Inaugural Airport Program September 2005 Section 3 - Refinement of the Ultimate Airfield Concept Using the Base Concept identified in Section 2, IDOT re-examined
FUTENMA REPLACEMENT FACILITY BILATERAL EXPERTS STUDY GROUP REPORT. August 31, 2010
 FUTENMA REPLACEMENT FACILITY BILATERAL EXPERTS STUDY GROUP REPORT August 31, 2010 MANDATE AND SCOPE OF WORK: In order to achieve the earliest possible relocation of Marine Corps Air Station Futenma, the
Airport Master Plan for. Brown Field Municipal Airport PAC Meeting #3
 Airport Master Plan for Brown Field Municipal Airport PAC Meeting #3 Public Meeting #1 > 8/24/17 from 5:30 to 8:00 pm > 41 attendees signed-in > Comments: > EAA area > Environmental constraints > Focus
TRAINING BULLETIN No. 1
 TRAINING BULLETIN No. 1 Introduction: Hickok & Associates has provided a new charting legend Hickok & Associates Helicopter Instrument Approach and Departure Charts - Charting Format & Legend (Revision2),