Air Arabia Investor Presentation FY / Q4 2016
|
|
|
- Hollie Skinner
- 6 years ago
- Views:
Transcription

1 Air Arabia Investor Presentation FY / Q4 2016

2 The Development of Air Arabia
3 Air Arabia - General Overview Company Overview Launched in October 2003, Air Arabia was the first and is the largest low cost carrier in the Middle East and North Africa. 13 years of consistent growth. 13 year of consistent profitability. Initial Public offering was successfully completed in Operating a total fleet of 46 Airbus 320 aircraft. Operates out of 5 locations: Sharjah, Ras Al Khaima, Egypt, Morocco, and Jordan. More than 122 routes served from 5 hubs. Financially stable with a strong balance sheet Asset Evolution ( ) Asset Values In Billions
4 Business model Leadership First mover advantage The first listed airline in the Arab world (DFM). Truly Independent In Management and Strategic development. Strong support at our home base Air Arabia is by far the largest operator in Sharjah Airport, providing commercially competitive advantages. Brand Name - one of the most recognised brand names in the MENA region. Powerful business model High Aircraft utilization around 15hrs a day, one of the best in the world (A 320). 80%+ Seat factor year round. Low cost principals Constantly driving our costs lower to industry leading levels. Safety The highest operational standards. Young fleet average age around 3 years. Excellent on time performance. Above industry average and improving Best seat pitch in class Comfortable 32 inches. Strong group support JV s and subsidiaries helping to drive economies of scale and profitability.
5 Consistent Growth Destinations Fleet Size Load Factor Total Passengers (Million) 80% 86% 85% 80% 83% 82% 82% 80% 80% 79% 82%


6
7 Group companies Air Arabia (PJSC)- (DFM:AIRARABIA), consists of a group of airlines and companies offering travel and tourism services across the globe. Industry Airlines Companies Ownership Description 100% First & Largest LCC in MENA region covering vast population spreading across Middle East and Indian Subcontinent and CIS region. 41% 49% 49% Morocco's leading LCC extensively covering Europe from various airports across the Kingdom with great potential to spread wings into Africa. Egypt s most innovative LCC, serving GCC the Middle East, Europe and Africa. The latest addition to the low cost carriers industry in Jordan, with a HUB in Queen Alia International Airport and operations to the GCC, Levant, and MENA generally. Ground Handling & MRO Flight Operations 50% 100% 100% SAS is a JV with Sharjah Airport that delivers a comprehensive range of passenger, ramp and cargo handling for airline operators and airport customers. Maintenance Hangar designed to meet all MRO requirements for entire Air Arabia fleet while serving other airlines and aircraft. Providing significant cost saving, this flight simulator facility helps Air Arabia provide world-class training for up to 400 pilots a year. Hospitality 100% 51% 100% 100% Both hotels perfectly situated in Sharjah and Dubai providing Air Arabia with a great expansion into hospitality. JV company that supports and enhances the quality of on-board catering while servicing a niche market for catering and hospitality Tourism Technology 51% 100% Spread across GCC states, Cozmo Travel is a leading travel agency providing a wide range of individual and corporate travel solutions. ISA is a leading IT solutions provider. ISA unique creation is the leading reservations system AcelAero that is now being used by many airlines across the world.


8 MENA Region Still maintains highest growth levels Source: IATA Annual report 2016.

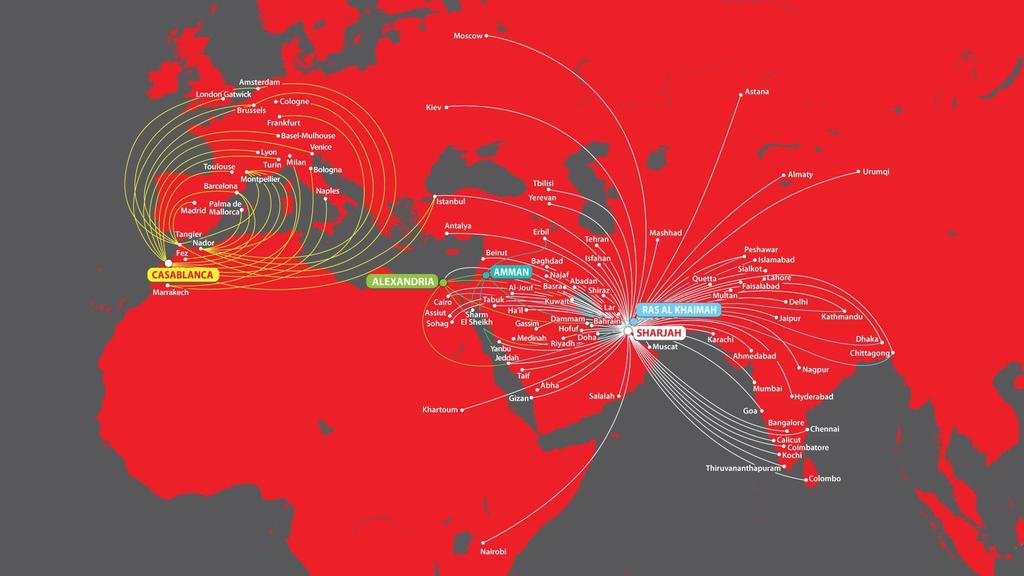
9 Airline Companies 3 Growth in number of destinations at each Hub Air Arabia Maroc 8 2 Air Arabia Egypt Air Arabia UAE Jordan 80 1 Air Arabia UAE Sharjah Air Arabia UAE RAK Strategic bases in key geographical locations serving regions covering a population of over 3 billion: Middle East Africa Indian Subcontinent CIS Region South and Central Asia Europe


10 Strong JV s and Subsidiaries Air Arabia supporting businesses contribute strongly to the Group s bottom-line Stake Revenue (AED MM) FY 15 FY 16 50% % % % % % %
11 Financial Performance
12 FY 2016 Quarterly Performance Financial Highlights (AED Millions) FY 2015 FY 2016 % Change TOTAL REVENUE 3,826 3, % Operating Profit % Operating Profit Margin 15% 9.6% -5.4pts NET PROFIT % Operational Highlights NUMBER OF PAX CARRIED (Millions) AVERAGE LOAD FACTOR % 79.2% +0.6pts
13 Q Quarterly Performance Financial Highlights (AED Millions) Q Q % Change TOTAL REVENUE % Operating Profit 111 (95) -186% Operating Profit Margin 11.5% -11% -22.5pts NET PROFIT % Operational Highlights NUMBER OF PAX CARRIED (Millions) % AVERAGE LOAD FACTOR 77.9% 77.7% -0.2pts
14 (AED MM) (AED MM) FY 2016 o 2016 was a very tough year on aviation industry generally. o Pressure on yields continue to exist and comes from various sources. o Despite that, 2016 witnessed the delivery of 6 new A320s to the fleet. o The number of passengers carried for the year 2016 increased by 10.7% compared to previous year with Air Arabia carrying 8.46 million passengers. o Global network grew in 2016 to reach 122 routes from 5 hubs. o Air Arabia distributed 9% cash dividends for the year o Operational performance and operational margins continue to reflect healthy and efficient management. Revenues (AED) ,500 4,000 3,500 3,000 2,500 2,000 1,500 1, ,283 Net Profits (AED) ,832 3,183 2,434 2,066 1,972 2,080 3,729 3, % 510 Margin % % % 14% 15% 14% 13% 15% 11% 15% % 30% 25% 20% 15% 10% 5% 0%
15 Annual Operating Statistics (Figures in AED) Number of Aircrafts Average Aircraft Destinations Number of Pax (Millions) RPK (Billions) ASK (Billions) Average Load Factor 80% 86% 85% 80% 83% 82% 82% 80% 81% 79% 81%
16 Fuel Hedging positions 64% 65% 73% 79% $55 36% $56 35% $67 $69 27% 21% Hedged Fuel Not Hedged Fuel


17 Corporate Social Responsibility Air Arabia has always give CSR very high consideration, and has been the passion of very member of Air Arabia. Charity Cloud Program Air Arabia s initiative for sustainable development started in 2005 and currently runs schools and medical centres across: Sudan, Sri Lanka, India, Nepal, Yemen, Turkey, Egypt and Bangladesh providing education and health care to thousands. Activities During the year: Staff visit and donation by Air Arabia Maroc staff to the SOS Children village New children s clinic New rehabilitation centre for woman New dialysis center Educational training Center Children s Garden renovation project in Sarajevo Buying new fishing boats Assisting widowed women by distributing necessities in Nador New charity cloud children s school in Sohag Staff participation in an awareness marathon for the57357 children cancer hospital. Water system renovation Medical awareness campaign School bags distribution Morocco Bangladesh Srilanka Egypt Bangladesh Bosnia and Herzegovina Sudan Morocco Egypt Egypt Bosnia and Herzegovina Sudan Sultanate of Oman

18 3 rd on Top 50 Airlines 2016 according to Air Finance Journal
19 Disclaimer Information contained in this presentation is subject to change without notice, its accuracy is not guaranteed and it may not contain all material information concerning the company. Neither we nor our advisors make any representation regarding, and assume no responsibility or liability for, the accuracy or completeness of, or any errors or omissions in, any information contained herein. In addition, the information contains projections and forward-looking statements that reflect the company s current views with respect to future events and financial performance. These views are based on current assumptions which are subject to various risks and which may change over time. No assurance can be given that future events will occur, that projections will be achieved, or that the company s assumptions are correct. Actual results may differ materially from those projected. This presentation is strictly not to be distributed without the explicit consent of Company management under any circumstance.
20 Contact Us For full financials and further information: investor-relations.airarabia.com Tel:
Air Arabia Air Arabia Q Q1 2017
 Air Arabia Air Arabia Q2 2017 Investor Investors Presentation Presentation Q1 2017 The Development of Air Arabia Air Arabia - General Overview Company Overview Launched in October 2003, Air Arabia was
Air Arabia Investor Presentation Q2 2016
 Air Arabia Investor Presentation Q2 2016 The Development of Air Arabia Air Arabia - General Overview Company Overview Launched in October 2003, Air Arabia was the first and is the largest low cost carrier
Air Arabia. Investor Presentation. 1 st Quarter 2015
 Air Arabia Investor Presentation 1 st Quarter 2015 Disclaimer Information contained in this presentation is subject to change without notice, its accuracy is not guaranteed and it may not contain all material
Air Arabia. Investor Presentation. Sharjah, UAE: September 2013
 Air Arabia Investor Presentation Sharjah, UAE: September 2013 Disclaimer Information contained in this presentation is subject to change without notice, its accuracy is not guaranteed and it may not contain
Air Arabia. Investor Presentation. Sharjah, UAE: 3 rd Quarter 2014
 Air Arabia Investor Presentation Sharjah, UAE: 3 rd Quarter 2014 Disclaimer Information contained in this presentation is subject to change without notice, its accuracy is not guaranteed and it may not
Investor Presentation Q2 2011
 Investor Presentation Q2 Disclaimer Information contained in this presentation is subject to change without notice, its accuracy is not guaranteed and it may not contain all material information concerning
VietJet Aviation Joint Stock Company Key Highlights Q1/2017 Business result. Apr 2017
 VietJet Aviation Joint Stock Company Key Highlights Q1/2017 Business result Apr 2017 Disclaimer INFORMATION CONTAINED IN OUR PRESENTATION IS INTENDED SOLELY FOR YOUR REFERENCE. SUCH INFORMATION IS SUBJECT
AIR ARABIA PJSC Q4 AND FULL YEAR COMMENTARY 2017
 AIR ARABIA PJSC Q4 AND FULL YEAR COMMENTARY 2017 Financial highlights Full year 2017 Passengers carried reached 8.53million at a seat factor of 79%. Turnover reached AED 3.74 billion. Yield margin fell
Key Highlights Q2/2018 Business result. July 2018
 Key Highlights Q2/2018 Business result July 2018 Disclaimer INFORMATION CONTAINED IN OUR PRESENTATION IS INTENDED SOLELY FOR YOUR REFERENCE. SUCH INFORMATION IS SUBJECT TO CHANGE WITHOUT NOTICE, ITS ACCURACY
Q3 FY18 Business Highlights
 Q3 FY18 RESULTS Q3 FY18 Business Highlights 1 2 3 4 5 6 7 Record passengers 7.1m, record revenues 423m Investing in growth 24% passenger growth in Q3 Disciplined cost management flat ex-fuel CASK Largest
Vietjet Aviation Joint Stock Company Key Highlights Q1/2018 Business result. April 2018
 Vietjet Aviation Joint Stock Company Key Highlights Q1/2018 Business result April 2018 Disclaimer INFORMATION CONTAINED IN OUR PRESENTATION IS INTENDED SOLELY FOR YOUR REFERENCE. SUCH INFORMATION IS SUBJECT
Cebu Air, Inc. 4 th Quarter and Full Year 2017 Results of Operations. cebupacificair.com
 Cebu Air, Inc. 4 th Quarter and Full Year 2017 Results of Operations cebupacificair.com Disclaimer The information provided in this presentation is provided only for your reference. Such information has
1Q13 R sults esentation
 1Q13 Results Presentation 14 May 2013 Disclaimer The presentation is dated the day it is given. The delivery of this presentation shall not, under any circumstances, create any implication that there has
Thank you for participating in the financial results for fiscal 2014.
 Thank you for participating in the financial results for fiscal 2014. ANA HOLDINGS strongly believes that safety is the most important principle of our air transportation business. The expansion of slots
AACO Members Quick Facts 2013
 2014 AACO Members Quick Facts 2013 Member Airlines 32 Billion $ Revenue (+10.0% over 2012) 49.5 Million Passengers Carried (+7.5% over 2012) 153 Million Tonnes of Cargo (+11.6% over 2012) 4.8 Destinations
2008/09 Interim Results For the six months ended 31 December 2008
 Bossini International Holdings Limited 2008/09 Interim Results For the six months ended 31 December 2008 Corporate Presentation 18 March 2009 0 0 Disclaimer The information contained in this presentation
AirAsia X Berhad First Quarter 2014 Results - Investor and Analyst Briefing -
 AirAsia X Berhad First Quarter 2014 Results - Investor and Analyst Briefing - Disclaimer Information contained in our presentation is intended solely for your reference. Such information is subject to
Corporate Presentation 2015/16 Interim Results
 Corporate Presentation 2015/16 Interim Results 24 February 2016 0 Disclaimer The information contained in this presentation is intended solely for your personal reference. Such information is subject to
Corporate Presentation 2012/13 Interim Results
 Corporate Presentation 2012/13 Interim Results 26 February 2013 0 Disclaimer The information contained in this presentation is intended solely for your personal reference. Such information is subject to
Cebu Air, Inc. 2Q2014 Results of Operation
 Cebu Air, Inc. 2Q2014 Results of Operation 1 Disclaimer This information provided in this presentation is provided only for your reference. Such information has not been independently verified and, as
World Air Transport Statistics. Special AGM Edition WORLD AIR TRANSPORT SUMMIT
 World Air Transport Statistics Special AGM Edition WORLD AIR TRANSPORT SUMMIT 61 st IATA ANNUAL GENERAL MEETING TOKYO, 29-31 MAY 2005 World Air Transport Statistics Ref. No: 9011-AGM 2005 International
John Schubert Managing Director Asia Pacific & India Marketing
 John Schubert Managing Director Asia Pacific & India Marketing September 2017. The statements contained herein are based on good faith assumptions are to be used for general information purposes only.
Introduction: Airline Industry Overview Dr. Peter Belobaba Presented by: Alex Heiter & Ali Hajiyev
 Introduction: Airline Industry Overview Dr. Peter Belobaba Presented by: Alex Heiter & Ali Hajiyev Istanbul Technical University Air Transportation Management M.Sc. Program Network, Fleet and Schedule
MEDIA/ANALYST PRESENTATION FY RESULTS 11 MAY 2007
 MEDIA/ANALYST PRESENTATION FY2006-07 RESULTS 11 MAY 2007 SIA GROUP FY2006-07 07 RESULTS GROUP REVENUE FY2006/07 ($ million) ($ million) 15,000 14,494 14,000 13,000 12,000 11,000 10,515 12,013 13,341 Record
AerCap Holdings N.V. April 11, 2015
 AerCap Holdings N.V. April 11, 2015 Disclaimer Incl. Forward Looking Statements & Safe Harbor This presentation contains certain statements, estimates and forecasts with respect to future performance and
Corporate Presentation
 Corporate Presentation 2010/11 Interim Results 22 February 2011 Bossini International Holdings Limited 堡獅龍國際集團有限公司 Disclaimer The information contained in this presentation is intended solely for your
Kuwait Airline Industry Report-Update
 May 2011 Industry Research Kuwait Airline Industry Report-Update Report Contents Summary Industry Overview GCC Airline Sector Kuwait Airline Sector - Brief about Kuwaiti Airlines - Kuwait Airways - Jazeera
Analyst and Investor Conference Call Q Ulrik Svensson, CFO and Member of the Executive Board
 Analyst and Investor Conference Call Q2 2017 Ulrik Svensson, CFO and Member of the Executive Board Frankfurt, 2 August 2017 Disclaimer The information herein is based on publicly available information.
Quarterly Aviation Industry Performance
 Quarterly Aviation Industry Performance ALAFCO Aviation Lease and Finance Company K.S.C.P. Quarterly Aviation Industry Performance 3Q17 (Updated November 17) Prepared by: Strategic Planning department
2012 Result. Mika Vehviläinen CEO
 2012 Result Mika Vehviläinen CEO 1 Agenda Market environment in Q4 Business performance and strategy execution Outlook Financials 2 Market Environment According to IATA, Global air travel continues to
Finnair Group Interim Report 1 January 30 September 2008
 Finnair Group Interim Report 1 January 30 September 2008 1 31/10/2008 Presentation name / Author Airline industry at a historical turning point Expensive fuel price in the beginning of 2008 has dramatical
Air China Limited Annual Results. March Under IFRS
 Air China Limited 21 Annual Results Under IFRS March 211 Agenda Part 1 Highlights Part 2 Business Overview Part 3 Financial Overview Part 4 Outlook 2 Part 1 Highlights Steady Economic Growth; Asia Pacific
AEROFLOT ANNOUNCES FY 2017 IFRS FINANCIAL RESULTS
 AEROFLOT ANNOUNCES FY 2017 IFRS FINANCIAL RESULTS Moscow, 1 March 2018 Aeroflot Group ( the Group, Moscow Exchange ticker: AFLT) today publishes its audited financial statements in accordance with International
UBS 14 th Global Emerging Markets Conference. New York, November 2016
 UBS 14 th Global Emerging Markets Conference New York, November 2016 This presentation may include forward-looking comments regarding the Company s business outlook and anticipated financial and operating
Tiger Airways Holdings Limited FY11 Results
 Tiger Airways Holdings Limited FY11 Results May 2011 Financial Year Ended 31 March 2011 Disclaimer The information contained in this presentation (the "Information") is provided by Tiger Airways Holdings
OPERATING AND FINANCIAL HIGHLIGHTS
 Copa Holdings Reports Financial Results for the Fourth Quarter of 2018 Excluding special items, adjusted net profit came in at $44.0 million, or Adjusted EPS of $1.04 Panama City, Panama --- February 13,
I AO Chi h e i f E c E on o o n m o i m c i A na n ly l s y is i & P o P l o ilc i y y Se S ctio i n
 Narjess Teyssier ICAO Chief Economic Analysis & Policy Section Montréal 29 September 2010 Content Data Trends Forecasts Impact on stakeholders Monitoring air transport development: Statistics, analysis
Aviation Updates. Mr. John Schubert. Managing Director, Marketing-Asia Pacific & India
 Aviation Updates Mr. John Schubert Managing Director, Marketing-Asia Pacific & India Market Update The statements contained herein are based on good faith assumptions are to be used for general information
OPERATING AND FINANCIAL HIGHLIGHTS
 Copa Holdings Reports Net Income of US$32.0 Million and EPS of US$0.72 for the Second Quarter of 2012 Excluding special items, adjusted net income came in at $58.6 million, or EPS of $1.32 per share Panama
Cathay Pacific Airways Interim Results for the six months ended 30 June 2012
 Cathay Pacific Airways Interim Results for the six months ended 30 June 2012 8 August 2012 1 Interim Result 1H2012 1H2011 Change Group attributable (loss) / profit HK$ million (935) 2,808-133.3% Group
Finnair Group Interim Report 1 January 31 March 2008
 Finnair Group Interim Report 1 January 31 March 2008 1 29/04/2008 Presentation name / Author Outlook for the industry less positive Growth of demand declining due to uncertainty of global economy Growth
Copa Holdings Reports Net Income of $49.9 million and EPS of $1.18 for the Second Quarter of 2018
 Copa Holdings Reports Net Income of $49.9 million and EPS of $1.18 for the Second Quarter of 2018 Panama City, Panama --- Aug 8, 2018. Copa Holdings, S.A. (NYSE: CPA), today announced financial results
OPERATING AND FINANCIAL HIGHLIGHTS. Subsequent Events
 Copa Holdings Reports Financial Results for the First Quarter of 2016 Excluding special items, adjusted net income came in at US$69.9 million, or EPS of US$1.66 per share Panama City, Panama --- May 5,
ANALYST MEETING 3Q2015
 ANALYST MEETING 3Q2015 November 12, 2015 DISCLAIMER The presentation is dated the day it is given. The delivery of this presentation shall not, under any circumstances, create any implication that there
ANA HOLDINGS Announces Mid-Term Corporate Strategy for FY ~Strengthening the foundations of the business and looking into the future~
 ANA HOLDINGS NEWS ANA HOLDINGS Announces Mid-Term Corporate Strategy for FY2018-2022 ~Strengthening the foundations of the business and looking into the future~ TOKYO, February 1, 2018 ANA HOLDINGS (hereinafter
THAI AIRWAYS INTERNATIONAL PCL
 THAI AIRWAYS INTERNATIONAL PCL 2Q2017 analysts briefing 16-Aug-2017 1 DISCLAIMER The information contained herein is intended to represent the Company s operating and financial position at a given point
JAPAN AIRLINES Co., Ltd. Financial Results 1 st Quarter Mar/2017(FY2016) July 29, 2016
 July 29, 2016") JAPAN AIRLINES Co., Ltd. Financial Results Mar/2017(FY2016) July 29, 2016 Today s Topics P.1 P.2 P.13 From the first quarter of this fiscal year, figures for Revenue Passengers Carried, ASK, RPK and Load
JAPAN AIRLINES Co., Ltd. Financial Results Mar/2017(FY2016) July 29, 2016 Today s Topics P.1 P.2 P.13 From the first quarter of this fiscal year, figures for Revenue Passengers Carried, ASK, RPK and Load
Fourth Quarter 2006 Results Presentation February 15, 2007
 Fourth Quarter 2006 Results Presentation February 15, 2007 This presentation may include forward-looking comments regarding the Company s business outlook and anticipated financial and operating results.
OPERATING AND FINANCIAL HIGHLIGHTS
 Copa Holdings Reports Net Income of US$18.6 Million and EPS of US$0.42 for the Second Quarter of 2010 Excluding special items, adjusted net income came in at $26.3 million, or $0.60 per share Panama City,
Leaving the Competition Behind. Second Quarter (Apr-Jun) 2009 Results
 2009 Results") Leaving the Competition Behind Second Quarter (Apr-Jun) 2009 Results 12 Aug 2009 1 Disclaimer Information contained in our presentation is intended solely for your reference. Such information is subject
Leaving the Competition Behind Second Quarter (Apr-Jun) 2009 Results 12 Aug 2009 1 Disclaimer Information contained in our presentation is intended solely for your reference. Such information is subject
Air China Limited Interim Results. August Under IFRS
 Air China Limited 21 Interim Results Under IFRS August 21 1 Agenda 21 Interim Results Overview Business Overview Financial Overview Outlook 2 2 2 21 Interim Results 3 21 Interim Results Overview 4 4 4
Analyst Meeting 1Q/2015
 Analyst Meeting 1Q/2015 DISCLAIMER The presentation is dated the day it is given. The delivery of this presentation shall not, under any circumstances, create any implication that there has been no change
OPERATING AND FINANCIAL HIGHLIGHTS SUBSEQUENT EVENTS
 Copa Holdings Reports Financial Results for the Third Quarter of 2016 Excluding special items, adjusted net income came in at $55.3 million, or adjusted EPS of $1.30 per share Panama City, Panama --- November
Cebu Air, Inc. Annual Stockholders Briefing. 24 June cebupacificair.com
 Cebu Air, Inc. Annual Stockholders Briefing 24 June 2015 cebupacificair.com Business Updates Passengers (M) Operating Statistics 2014: Passenger traffic grew 17.5% to 16.9M. Seat capacity grew 14.8% to
AerCap Holdings N.V. Aengus Kelly, CEO. January 2017
 AerCap Holdings N.V. Aengus Kelly, CEO January 2017 Industry Update Looking Back PASSENGER TRAFFIC GROWTH Air traffic growth in 2016 remained robust, short-haul at 5.6% and long-haul at 6.4% 1 CHINA SLOWING
Leveraging the New Partnership. 19 December 2011
 Leveraging the New Partnership 19 December 2011 2 Transaction Highlights airberlin and Etihad have today agreed on a comprehensive commercial agreement which is highly synergistic for both companies Etihad
Quarterly Aviation Industry Performance
 Quarterly Aviation Industry Performance ALAFCO Aviation Lease and Finance Company K.S.C.P. Quarterly Aviation Industry Performance (March - June 17) Prepared by: Strategic Planning department 1 Quarterly
ETIHAD AIRWAYS ANNOUNCES ORDER FOR UP TO 117 AIRBUS AIRCRAFT
 Sunday 17 November, 2013 ETIHAD AIRWAYS ANNOUNCES ORDER FOR UP TO 117 AIRBUS AIRCRAFT Major purchase to accommodate growth, increase efficiency and refresh fleet First order of new generation A320neo family
Information meeting. Third quarter results. March 2011
 Information meeting Third quarter 2010-11 results 1 March 2011 Agenda 2010-11: recovery in activity and return to profitability Current issues Air France-KLM ambitions for the next three years 2 All businesses
AIRASIA X. Fourth Quarter and Full Year 2015 Financial Results
 AIRASIA X Fourth Quarter and Full Year 2015 Financial Results DISCLAIMER Information contained in our presentation is intended solely for your reference. Such information is subject to change without notice,
OPERATING AND FINANCIAL HIGHLIGHTS
 Copa Holdings Reports Financial Results for the Fourth Quarter of 2015 Excluding special items, adjusted net income came in at $31.7 million, or EPS of $0.73 per share Panama City, Panama --- February
KOREAN AIR 4Q17 FINANCIAL RESULTS
 KOREAN AIR 4Q17 FINANCIAL RESULTS 1 Disclaimer This presentation is for informational purposes only, contains preliminary financial and other information about Korean Air Lines Co., Ltd. and is subject
Vietjet Aviation Joint Stock Company Key Highlights Q3/2017 Business result. October 2017
 Vietjet Aviation Joint Stock Company Key Highlights Q3/2017 Business result October 2017 Disclaimer INFORMATION CONTAINED IN OUR PRESENTATION IS INTENDED SOLELY FOR YOUR REFERENCE. SUCH INFORMATION IS
EMIRATES AIRLINES SWOT & PESTLE ANALYSIS. Barakaat Consulting - An Ezzy IT Consulting Business
 S&P SWOT & PESTLE.com EMIRATES AIRLINES SWOT & PESTLE ANALYSIS Barakaat Consulting - An Ezzy IT Consulting Business This is a licensed product and is not to be photocopied or distributed. All rights reserved.
ANA Reports Record Profits for FY2012
 ANA HOLDINGS NEWS ANA Reports Record Profits for FY2012 TOKYO April 30, 2013 - ANA Holdings today reports consolidated financial for the fiscal year ended March, 2013. Financial and Operational Highlights
Financial Results 1 st Quarter Mar/2016 (FY2015) 30 July, 2015
 30 July, 2015") Financial Results Mar/2016 (FY2015) 30 July, 2015 Today s Topics P.2 P.3 P.15 1 Overview of FY Mar/2016 Financial Results Operating Revenue Operating Profit 320 307.0 +4.9Bn (+1.6%) 312.0 50 +17.6Bn (+94.6%)
Financial Results Mar/2016 (FY2015) 30 July, 2015 Today s Topics P.2 P.3 P.15 1 Overview of FY Mar/2016 Financial Results Operating Revenue Operating Profit 320 307.0 +4.9Bn (+1.6%) 312.0 50 +17.6Bn (+94.6%)
OPERATING AND FINANCIAL HIGHLIGHTS. Subsequent Events
 Copa Holdings Reports Net Income of $103.8 million and EPS of $2.45 for the Third Quarter of 2017 Excluding special items, adjusted net income came in at $100.8 million, or EPS of $2.38 per share Panama
MIRAMAR, Fla., April 29, 2015 (GLOBE NEWSWIRE) -- Spirit Airlines, Inc. (Nasdaq:SAVE) today reported first quarter 2015 financial results.
 -- Spirit Airlines, Inc. (Nasdaq:SAVE) today reported first quarter 2015 financial results.") April 29, 2015 Spirit Airlines Announces First Quarter 2015 Results; Adjusted Net Income Increases 87.1 Percent to $70.7 Million and Pre-Tax Margin Increases 900 Basis Points to 22.7 Percent MIRAMAR, Fla.,
April 29, 2015 Spirit Airlines Announces First Quarter 2015 Results; Adjusted Net Income Increases 87.1 Percent to $70.7 Million and Pre-Tax Margin Increases 900 Basis Points to 22.7 Percent MIRAMAR, Fla.,
Emirates Group Announces $23.9 billion Revenue & 26th Consecutive Year of Profit
 Emirates Group Announces $23.9 billion Revenue & 26th Consecutive Year of Profit The Emirates Group today announced its 26th consecutive year of profit and companywide growth, ending the year in a strong
AIRBUS H Roadshow Presentation. New York July 31 st, 2017
 AIRBUS H1 2017 Roadshow Presentation New York July 31 st, 2017 H1 2017 HIGHLIGHTS 2 Healthy commercial aircraft environment; robust backlog of 6,771 a/c supports ramp-up plans H1 financials reflect delivery
Management Discussions and Analysis for the three-month period ended 31 March 2014 and Executive Summary
 Executive Summary Overview of the global economy during the first quarter of 2015 (Q1/2015) are as following; the US economy has been in recovery mode while rapidly dollar appreciation weighs on net exports
Randy Tinseth Vice President, Marketing Boeing Commercial Airplanes
 Randy Tinseth Vice President, Marketing Boeing Commercial Airplanes June 2017. The statements contained herein are based on good faith assumptions are to be used for general information purposes only.
OPERATING AND FINANCIAL HIGHLIGHTS SUBSEQUENT EVENTS
 Copa Holdings Reports Net Income of US$6.2 Million and EPS of US$0.14 for the Third Quarter of 2015 Excluding special items, adjusted net income came in at $37.4 million, or EPS of $0.85 per share Panama
ANA Holdings Financial Results for FY2013
 ANA HOLDINGS NEWS ANA Holdings Financial Results for FY2013 TOKYO April 30, 2014 - ANA Holdings (hereafter ANA HD ) today reports its consolidated financial for fiscal year 2013 (April, 2013 March, 2014).
Meeting the Demand The Battle for Asia Pacific s Airspace
 Meeting the Demand The Battle for Asia Pacific s Airspace The statements contained herein are based on good faith assumptions and are to be used for general information purposes only. These statements
El Al Israel Airlines announced today its financial results for the second quarter and the first half of 2017.
 August 16, 2017 El Al Israel Airlines announced today its financial results for the second quarter and the first half of 2017. The Company's revenues in the second quarter of 2017 amounted to approx. USD
Copa Holdings Reports Net Income of $57.7 million and EPS of $1.36 for the Third Quarter of 2018
 Copa Holdings Reports Net Income of $57.7 million and EPS of $1.36 for the Third Quarter of 2018 November 14, 2018 PANAMA CITY, Nov. 14, 2018 /PRNewswire/ -- Copa Holdings, S.A. (NYSE: CPA), today announced
2Q Earnings Results Presentation
 2Q Earnings Results Presentation SAFE HARBOR The present document consolidates information from Avianca Holdings S.A. and its subsidiaries, including unaudited financial figures, operational managerial
current market outlook
 current market outlook Randy Tinseth Vice President, Marketing Boeing Commercial Airplanes June 2011 The statements contained herein are based on good faith assumptions and provided for general information
Virgin Australia Holdings Limited (ASX: VAH) H1 FY18 Results 1
 H1 FY18 Results 1") Virgin Australia Holdings Limited (ASX: VAH) H1 FY18 Results 1 Summary of H1 FY18 Group Outcomes 2 Group Underlying Profit Before Tax of $102.5 million up 142.3% Group Statutory Profit After Tax of $4.4
Virgin Australia Holdings Limited (ASX: VAH) H1 FY18 Results 1 Summary of H1 FY18 Group Outcomes 2 Group Underlying Profit Before Tax of $102.5 million up 142.3% Group Statutory Profit After Tax of $4.4
Copa Holdings Reports Net Income of $136.5 million and EPS of $3.22 for the First Quarter of 2018
 Copa Holdings Reports Net Income of $136.5 million and EPS of $3.22 for the First Quarter of 2018 May 9, 2018 PANAMA CITY, May 9, 2018 /PRNewswire/ -- Copa Holdings, S.A. (NYSE: CPA), today announced financial
Passenger: 17.2 Million (+3.9% yoy) OTP: 85.8% SLF: 73.3% Subsidiaries Operating Revenues US$415.2 Million Cargo Carried 219.4K ton (+10.
 OTP: 85.8% SLF: 73.3% Subsidiaries Operating Revenues US$415.2 Million Cargo Carried 219.4K ton (+10.") Value* 14.78 3.36 4.97 Volume** 32.85 9.59 13.43 Last Price 423 342 348 Market Cap.*** 8.74 8.85 9.01 Note: * Average Value in Billion Rupiah ** Average Volume in Million *** Market Capitalization in Trillion
Value* 14.78 3.36 4.97 Volume** 32.85 9.59 13.43 Last Price 423 342 348 Market Cap.*** 8.74 8.85 9.01 Note: * Average Value in Billion Rupiah ** Average Volume in Million *** Market Capitalization in Trillion
An Overview of SATS. Cho Wee Peng, CFO SIAS Corporate Profile & Investment Seminar 30 November 2013
 An Overview of SATS Cho Wee Peng, CFO SIAS Corporate Profile & Investment Seminar 30 November 2013 Forward Looking Statements This presentation may contain forward-looking statements regarding, among other
Avianca Holdings S.A. 1Q 2018 Earnings Presentation 2018
 Avianca Holdings S.A. 1Q 2018 Earnings Presentation 2018 Disclaimer The present document consolidates information from Avianca Holdings S.A. and its subsidiaries, including unaudited financial figures,
Cathay Pacific Airways 2010 Annual Results 9 March 2011
 Cathay Pacific Airways 2010 Annual Results 9 March 2011 1 Annual Result 2010 2009 Change Group Profit/(Loss) HK$14,048m HK$4,694m +199.3% Group Turnover HK$89,524m HK$66,978m +33.7% Profit Margin 15.7%
Bank of America Merrill Lynch Emerging Markets Corporate Conference. Miami, June 2016
 Bank of America Merrill Lynch Emerging Markets Corporate Conference Miami, June 2016 This presentation may include forward-looking comments regarding the Company s business outlook and anticipated financial
2Q 2016 Earnings Results Presentation. B787 Dreamliner
 2Q 2016 Earnings Results Presentation B787 Dreamliner 2 The present document consolidates information from Avianca Holdings SA and its subsidiaries, including unaudited financial figures, operational managerial
Cathay Pacific Airways 2011 Analyst Briefing 23 June 2011
 Cathay Pacific Airways 2011 Analyst Briefing 23 June 2011 1 Airline Strategy Grow our international network, expand frequencies and further develop Hong Kong as one of the world s leading aviation hubs
Asia Pacific Aviation
 Asia Pacific Aviation Industry Perspective Andrew Herdman Director General Association of Asia Pacific Airlines International Aviation Fuel Conference 5 April 2012 Beijing, China Overview Global Mobility
Cathay Pacific Airways Interim Results 04 August Cathay Pacific Airways Interim Results 6 August 2008
 Cathay Pacific Airways 2010 Interim Results 04 August 2010 Cathay Pacific Airways 2008 Interim Results 6 August 2008 Interim Result 1H 2010 1H 2009 Group Profit/(Loss) HK$6,840m HK$812m Group Turnover
Annual revenue crosses US$ 2.5 billion
 MEDIA RELEASE May 10, 2012 Annual revenue crosses US$ 2.5 billion With a growth of 37% The Board of Directors of Apollo Tyres Ltd today approved the company s audited financial results for the 4 th quarter
INVESTOR NEWSLETTER. Full Year 2013 Editions. PT Garuda Indonesia (Persero) Tbk. FY 2012 FY 2013 Change. Summary.
 Tbk. FY 2012 FY 2013 Change. Summary.") INVESTOR NEWSLETTER PT Garuda Indonesia (Persero) Tbk. Full Year 2013 Editions FY 2012 FY 2013 Change Financial Summary (USD Mio) OPERATING REVENUES 3,472 3,716 7.02% OPERATING EXPENSES 3,304 3,660 10.75%
INVESTOR NEWSLETTER PT Garuda Indonesia (Persero) Tbk. Full Year 2013 Editions FY 2012 FY 2013 Change Financial Summary (USD Mio) OPERATING REVENUES 3,472 3,716 7.02% OPERATING EXPENSES 3,304 3,660 10.75%
2019 Airline Economics Growth Frontiers Dublin. Steven F. Udvar-Házy Executive Chairman
 2019 Airline Economics Growth Frontiers Dublin Steven F. Udvar-Házy Executive Chairman January 21, 2019 Forward Looking Statements Statements in this presentation that are not historical facts are hereby
Debra Santos Managing Director Marketing - Europe Region
 Debra Santos Managing Director Marketing - Europe Region November 11, 2016. The statements contained herein are based on good faith assumptions are to be used for general information purposes only. These
Copa Holdings Reports Record Earnings of US$41.8 Million for 4Q06 and US$134.2 Million for Full Year 2006
 Copa Holdings Reports Record Earnings of US$41.8 Million for 4Q06 and US$134.2 Million for Full Year 2006 Panama City, Panama --- March 7, 2007. Copa Holdings, S.A. (NYSE: CPA), parent company of Copa
Financial overview. Adjusted operating cash flow* Annual dividend (excluding special dividend) Dollar movement. Percentage
 Dollar movement. Percentage") 1 Financial overview June 2007 June 2006 Dollar movement Percentage movement Operating revenue $4,297m $3,805m $492m 13% PBUT $268m $150m $118m 79% NPAT $214m $96m $118m 123% Adjusted operating cash flow*
1 Financial overview June 2007 June 2006 Dollar movement Percentage movement Operating revenue $4,297m $3,805m $492m 13% PBUT $268m $150m $118m 79% NPAT $214m $96m $118m 123% Adjusted operating cash flow*
Analysts Briefing. 24 June Cathay Pacific Airways Limited
 Analysts Briefing 24 June 2016 Cathay Pacific Airways Limited Operating performance - overview Challenging business environment. Load factor lower than expectations on weakening passenger demand. Strong
Cathay Pacific Airways 2012 Analyst Briefing 28 June 2012
 Cathay Pacific Airways 2012 Analyst Briefing 28 June 2012 1 Airline Strategy Grow our international network, expand frequencies and further develop Hong Kong as one of the world s leading aviation hubs
Emirates Group announces half-year performance for
 Final Emirates Group announces half-year performance for 2018-19 Group: Revenue up 10% to AED 54.4 billion (US$ 14.8 billion), and profit of AED 1.1 billion (US$ 296 million), down 53%. Results impacted
OPERATING AND FINANCIAL HIGHLIGHTS. Subsequent Events
 Copa Holdings Reports Net Income of US$113.1 Million and EPS of US$2.57 for the First Quarter of 2015 Excluding special items, adjusted net income came in at US$106.0 million, or EPS of US$2.41 per share