Portability: D-cide supports Dynamic Data Exchange (DDE). The results can be exported to Excel for further manipulation or graphing.
|
|
|
- Martin McDonald
- 5 years ago
- Views:
Transcription

1 Tavana : D-cide-1

2 D-cide is a Visual Spreadsheet. It provides an easier and faster way to build, edit and explain a spreadsheet model in a collaborative model-building environment. Tavana : D-cide-2


3 Transparency: Traditional spreadsheet programs hide the logic of the model behind columns and rows of data. D-cide makes it easy to understand how the numbers are generated by using algebraic relationships and natural-language processing instead of cells and formulas. Dependency: Dependencies are hard to see in spreadsheets. The elements of the model in D-cide are visually represented on a page, and the logical and mathematical links between them are shown by connecting arrows. Tavana : D-cide-3
 and the solution (output) side-by-side.")
4 Role: The cells in a spreadsheet all have identical roles expressed by formulas. There is no distinction among the roles of elements in spreadsheets. In D-cide elements have different roles (i.e. Constant, Variable, Self-Reference Variable, and Series). View: Spreadsheets are limited to show either the formulas within the cells or their calculated values at a given time. D-cide shows the model (input) and the solution (output) side-by-side. Complication: When working with large spreadsheets, it is difficult to follow the logic of the model by looking up the formulas in the cells. Editing and refining the model becomes a difficult task. Portability: D-cide supports Dynamic Data Exchange (DDE). The results can be exported to Excel for further manipulation or graphing. Tavana : D-cide-4


5 Tavana : D-cide-5
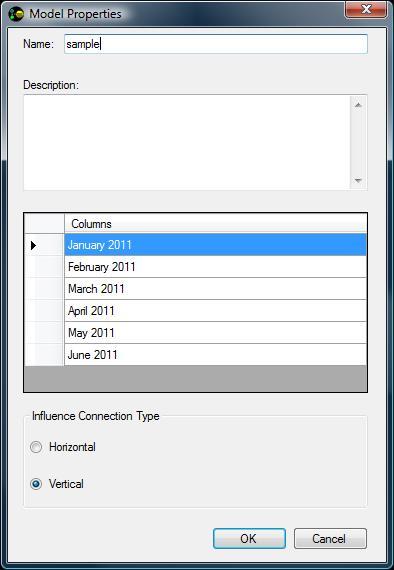
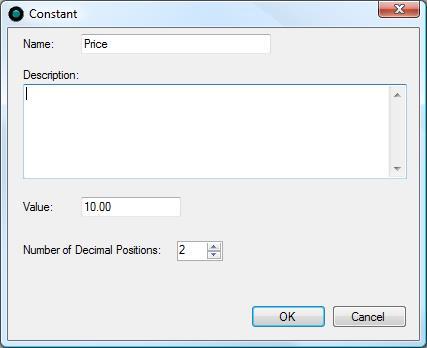
6 Constant: Objects having a single value which remains unchanged through the model. Variable: Objects whose values are defined by formulas such as Revenue and Profit. Self-Reference variable: Objects whose values are defined by self-reference formulas. Series: Objects having a set of values, each referring to one column of the model. Influence: Makes connection between the objects in the model. Tavana : D-cide-6
7 D-cide shows the logic of the model by letting the user manipulate the data with objects connected by arrows. Tavana : D-cide-7

8 Tavana : D-cide-8

9 Tavana : D-cide-9
 Division forward slash ( / ) Caret ( ^ ) Exponentiation")

10 Mathematical Operators Addition Plus sign ( + ) Subtraction Minus sign ( - ) Multiplication Asterisk ( * ) Division forward slash ( / ) Caret ( ^ ) Exponentiation x^y is x to the power of y x^0.5 is square root of x The Order of Operations: 1. Brackets 2. Exponents 3. Division 4. Multiplication 5. Addition 6. Subtraction Tavana : D-cide-10
11 Tavana : D-cide-11

12 Tavana : D-cide-12

13 cost variable cost total cost total cost Tavana : D-cide-13

14 Tavana : D-cide-14
15 Object Jan-11 Feb-11 Mar-11 Apr-11 May-11 Jun-11 Price Total Cost Quantity Revenue Profit Tavana : D-cide-15

16 The PROCOM Corporation is planning its financing for the next six months. PROCOM makes one item, which it sells through the retail shop in the front of the factory. The planning process was started with profit-and-loss computations. Profit is revenue less expenses and revenue is quantity times the unit price. Expenses are made up fixed costs and variable costs. Fixed costs include: rent, salaries, and utilities. Variable costs depend directly on the quantity. These costs are materials and labor. The following represents planning figures for the next six months. Using D-cide find the profit for the next six months and export the results into an excel spreadsheet. Planning period: Six Months Unit Price: $ 500 Quantity: 20,000 Up 5% Monthly Fixed Costs: Rent $ 40,000 Salaries $ 200,000 Utilities $ 50,000 Down 2% Monthly Variable Costs: Unit Material $ 200 Unit Labor $ 100 Up $5 monthly Tavana : D-cide-16

17 Tavana : D-cide-17
18 Object 11-Jan 11-Feb 11-Mar 11-Apr 11-May 11-Jun Unit Price Quantity 20, , , , , , Revenue 10,000, ,500, ,025, ,576, ,155, ,762, Unit Labor Unit Material Unit Variable Cost Variable Costs 6,000, ,405, ,835, ,293, ,779, ,295, Rent 40, , , , , , Salaries 200, , , , , , Utilities 50, , , , , , Fixed Costs 290, , , , , , Total Costs 6,290, ,694, ,123, ,580, ,065, ,581, Profit 3,710, ,806, ,901, ,996, ,089, ,181, Tavana : D-cide-18


19 Thrills R Us is a theme park located in southern New Jersey. They have been experiencing decreasing ticket sales because of increased competition. The management is afraid that unless they take some actions to improve the park, they will be forced to shut down. In order to determine what actions are needed they need to analyze their six month profit-and-loss statement. Some of the financial and pricing information is presented below: Ticket Price $35 Average Food Per Person $12 Number of Guests 6500 per month Fixed Costs Salaries $12,000 up $500 monthly Utilities $25,000 Maintenance $60,000 Variable Costs Unit Food Cost $6 up $.25 monthly Unit Labor Cost $5 Tavana : D-cide-19
20 A. What is monthly profit for the next six months? B. What will happen if ticket prices are increased by $5 without impacting sales. C. Thrills R Us plans to build a new mega coaster. The ride will add $50,000 per month in new ride expense. How does the new ride effect profit over the next six months? D. If the new coaster is a success there is a possibility that roller coaster fanatics from around the country will travel to Thrills R Us. If this happens, ticket sales could increase to as much as What will happen to profits in this best case scenario? Tavana : D-cide-20
21 Tavana : D-cide-21
22 Tavana : D-cide-22
23 Tavana : D-cide-23
24 Gilbert Monzon wants to kick it up a notch and open a new restaurant. In order to do so, he needs to convince Banco Popular that his up-scale restaurant will be profitable. Gilbert wants to use D-cide to model the profit and loss for the next six months. He will use this information in the business plan he plans to present to the CFO of the bank. Gilbert has decided to name his restaurant Parrot Club and he has located the perfect building in San Juan. Rent is $2000 and utilities are $1000 per month. Gilbert estimates that on average the restaurant will be open 20 days each month. The building has capacity for 20 tables with 4 chairs per table. Advertising should cost about $500 per month. The average dollar spent by each patron in the first month is estimated to be $15. Gilbert believes this figure should increase by $1 each month. He estimates traffic to be 75%, 80%, 85%, 90%, 95%, 95% of capacity over the next six months. From his experience he believes miscellaneous expenses (linen, menus, etc.) will add up to $1000 per month, cost of goods sold (food, liquor, etc.) 35% of revenue and payroll 20% of revenue. Finally, he assumes that the tables will turn over twice a day during the first month, three times during the second and third months and four times per day during the fourth, fifth and sixth months. What are his estimated profit for the next six months. Tavana : D-cide-24
25 Tavana : D-cide-25
26 Tavana : D-cide-26
. The average one-way fare for this route is $69.")
27 Herb Keheller, the CEO of Southwest, has asked for a profit analysis of the Oakland-Los Angeles route for the next 12 weeks. Southwest completes 25 round trip flights per day between the two cities with a distance of 338 miles (one way). The average one-way fare for this route is $69. Southwest like other airlines uses Load Factor as a determination of the number of paying customers per flight. Load factor is the percentage of available seats occupied by paying customers. A load factor of 50% means that 68.5 seats are filled with paying customers. The anticipated load factor for the next 12 weeks are 59%, 59%, 64%, 67%, 68%, 73%, 75%, 82%, 77%, 74%, 67%, and 63%. Southwest flies only Boeing 737s with 137 seats in this route. Airport Fees are currently running $7,000 per day while the maintenance fees are $6,000 per day. Southwest uses Available Seat Mile (ASM) to calculate variable costs. ASM is determined by multiplying the total miles flown by the total number of seats (1 mile times 137 seats = 137 ASMs). Variable costs are currently $ per ASM. What is the weekly profit for this route in the next 12 weeks? Tavana : D-cide-27
28 Tavana : D-cide-28
29 Tavana : D-cide-29

30 Joe owns and operates Pick Your Own farm where people can come and pick their own fruit. He has strawberries in May and June, blueberries in July, peaches in August and Apples in September and October. Joe s along with his expected average pounds picked per person is given below: Strawberries Blueberries Peaches Apples Price Per Pound Pounds Picked Joe owns four tractors and each tractor can carry 20 people out to the fields. He has four drivers who are paid 3 dollars per trip. The expected number of trips per driver along with the average capacity for the season is given next: Tavana : D-cide-30
31 Trips Capacity May % June % July % August % September % October % Two full time workers maintain the fields during the harvest season at Pick Your Own. They are paid $2,500 dollars a month each and have a full benefit package that is 20% of their monthly pay. It costs 300 dollars a month to fertilize and 400 dollars a month to irrigate the fields. Fuel and maintenance expenses are estimated at 40 cents per tractor per trip. Joe pays $120,000 per year for leasing the land and $30,000 a year for utilities. Estimate Joe s profit over for the next harvesting season. Tavana : D-cide-31
32 Tavana : D-cide-32
33 Tavana : D-cide-33

34 Jungle Jim runs a company offering Jeep tours into the African Grasslands in Kenya. He has recently increased his fleet to 10 jeeps, 10 drivers and 10 guides. Each Jeep can carry 8 tourists plus the driver and the guide. The ticket prices for a full-day tour are 175 dollars a person and a half-day tour is 100 dollars per person. Five jeeps run two half-day tours and the remaining five run full-day tours. Jim s insurance company charges him 20 dollars per tourist regardless of the tour length. Each jeep consumes 50 dollars in fuel per day. Jim believes fuel expenses will increase 2.5% each month for the next six months. He anticipates a 2 dollar increase per ticket for full-day tours and a 1 dollar increase per ticket for half-day tours to cover the increase in fuel expenses. Jim also pays a semi-annual licensing fee of 3000 dollars to the Kenyan government. The 10 jeeps are leased through Kenyan Motors for 100 dollars per month per jeep. Each half-day guide is paid 50 dollars a tour while each full-day guide is paid 80 dollars a tour. Drivers are paid 60 dollars for a full-day tour and 30 dollars for a half-day tour. Jim believes each jeep to be 70%, 85%, 90%, 90%, 80%, and 75% full over the next six months. Help Jim estimate his profit for the next six months assuming he runs his tours 20 days each month. Tavana : D-cide-34
35 Tavana : D-cide-35
36 Tavana : D-cide-36
Key Performance Indicators
 Key Performance Indicators The first section of this document looks at key performance indicators (KPIs) that are relevant in SkyChess. KPIs are useful as a measure of productivity, which can be sub-divided
Management Presentation. November 2011
 Management Presentation November 2011 Forward looking statements This presentation as well as oral statements made by officers or directors of Allegiant Travel Company, its advisors and affiliates (collectively
Long Haul load factors for the month remained strong relative to last February s statistics, but both Domestic and Tasman/PI were lower:
 MONTHLY INVESTOR UPDATE: 27 March 2008 CONTENTS - February market conditions - New aircraft deliveries - Company announcements - Operating statistics table MARKET CONDITIONS Passengers carried across the
Chapter 16 Revenue Management
 Chapter 16 Revenue Management Airline Performance Protection Levels and Booking Limits Overbooking Implementation of Revenue Management Southwest Airlines Southwest Airlines focus on short haul flights
Management Presentation. September 2011
 Management Presentation September 2011 Forward looking statements This presentation as well as oral statements made by officers or directors of Allegiant Travel Company, its advisors and affiliates (collectively
Management Presentation. November 2018
 Management Presentation November 2018 Forward looking statements This presentation as well as oral statements made by officers or directors of Allegiant Travel Company, its advisors and affiliates (collectively
Management Presentation. March 2016
 Management Presentation March 2016 Forward looking statements This presentation as well as oral statements made by officers or directors of Allegiant Travel Company, its advisors and affiliates (collectively
Compustat. Data Navigator. White Paper: Airline Industry-Specifi c
 Compustat Data Navigator White Paper: Airline Industry-Specifi c April 2008 Data Navigator: Airline Industry-Specific Data There are several metrics essential to airline analysis that are unavailable on
Evaluation of Alternative Aircraft Types Dr. Peter Belobaba
 Evaluation of Alternative Aircraft Types Dr. Peter Belobaba Istanbul Technical University Air Transportation Management M.Sc. Program Network, Fleet and Schedule Strategic Planning Module 5: 10 March 2014
September 2013 Passenger and Cargo Traffic Statistics Reno-Tahoe International Airport
 September 2013 Passenger and Cargo Traffic Statistics Reno-Tahoe International Airport October 31, 2013 U.S. DOMESTIC INDUSTRY OVERVIEW FOR SEPTEMBER 2013 All RNO Carriers Systemwide year over year comparison
Link btwn Oper & Finance
 Link btwn Oper & Finance 2016 Fall - SOM Lecture Topic 3 Dohoon Kim Value Equation Why firms? or why invest? (economic) Value creation Economic Value (EV) = investment x (ROIC WACC) ROIC (Return On Invested
Unit Activity Answer Sheet
 Probability and Statistics Unit Activity Answer Sheet Unit: Applying Probability The Lesson Activities will help you meet these educational goals: Mathematical Practices You will make sense of problems
NOTES ON COST AND COST ESTIMATION by D. Gillen
 NOTES ON COST AND COST ESTIMATION by D. Gillen The basic unit of the cost analysis is the flight segment. In describing the carrier s cost we distinguish costs which vary by segment and those which vary
Gulf Carrier Profitability on U.S. Routes
 GRA, Incorporated Economic Counsel to the Transportation Industry Gulf Carrier Profitability on U.S. Routes November 11, 2015 Prepared for: Wilmer Hale Prepared by: GRA, Incorporated 115 West Avenue Suite
Online Case. Practice case. Slides HTS de préparation - fev 2016_rev HC.pptx Draft for discussion only
 Copyright 2016 by The Boston Co onsulting Group, Inc. All rights reserved. Online Case Practice case Slides HTS de préparation - fev 2016_rev HC.pptx Draft for discussion only 0 INSTRUCTIONS (1/3) During
BRAZIL INTERNATIONAL INBOUND TRAVEL MARKET PROFILE (2011) Copyright 2012 by the U.S. Travel Association. All Rights Reserved.
 Copyright 2012 by the U.S. Travel Association. All Rights Reserved.") BRAZIL INTERNATIONAL INBOUND TRAVEL MARKET PROFILE (211) Copyright 212 by the U.S. Travel Association. All Rights Reserved. EXECUTIVE SUMMARY With a population of nearly 2 million and a GDP exceeding $2
BRAZIL INTERNATIONAL INBOUND TRAVEL MARKET PROFILE (211) Copyright 212 by the U.S. Travel Association. All Rights Reserved. EXECUTIVE SUMMARY With a population of nearly 2 million and a GDP exceeding $2
Airline Costs and Financial Measurements. B. Ben Baldanza
 Airline Costs and Financial Measurements B. Ben Baldanza Background Eleven years as CEO of Spirit Airlines Six Years as SVP of US Airways Three Years as President of TACA Three Years as SVP of Continental
Q Fast growth continued, Comparable operating result at record high levels Pekka Vauramo
 2018 Fast growth continued, Comparable operating result at record high levels 17.7.2018 Pekka Vauramo 2 A good - Comparable operating result increased to new seasonal high Revenue Comparable operating
PERFORMANCE MEASURE INFORMATION SHEET #16
 PERFORMANCE MEASURE INFORMATION SHEET #16 ARROW LAKES RESERVOIR: RECREATION Objective / Location Recreation/Arrow Lakes Reservoir Performance Measure Access Days Units Description MSIC 1) # Access Days
Joshua Koshy, Executive Vice President & CFO. Changing the Game
 Joshua Koshy, Executive Vice President & CFO Changing the Game Changing the Game Canada s #1 domestic, trans-border and international airline Strong brand recognition Innovative revenue model driving customer
The Economic Impact of Travel in Kansas. Tourism Satellite Account Calendar Year 2013
 The Economic Impact of Travel in Kansas Tourism Satellite Account Calendar Year 2013 Who we are Tourism Economics Union of industry expertise and economic disciplines Real world insights based on quantitative
2009 Muskoka Airport Economic Impact Study
 2009 Muskoka Airport Economic Impact Study November 4, 2009 Prepared by The District of Muskoka Planning and Economic Development Department BACKGROUND The Muskoka Airport is situated at the north end
Quarter 3 Interim management Statement
 Quarter 3 Interim management Statement 3 months to 30 th June 2012 25 th July 2012 1 1 Strong Q3 performance - in a difficult market Revenue growth in line with expectations Constant currency RPS growth
Management Presentation. August 2012
 Management Presentation August 2012 Forward looking statements This presentation as well as oral statements made by officers or directors of Allegiant Travel Company, its advisors and affiliates (collectively
TRANSPORT AFFORDABILITY INDEX
 TRANSPORT AFFORDABILITY INDEX Report - December 2016 AAA 1 AAA 2 Table of contents Foreword 4 Section One Overview 6 Section Two Summary of Results 7 Section Three Detailed Results 9 Section Four City
Federal Income Tax Treatment of Personal Use of Aircraft
 Aviation Tax Law Webinar Federal Income Tax Treatment of Personal Use of Aircraft December 3, 2013 1 Troy A. Rolf, Esq. 700 Twelve Oaks Center Dr Suite 700 Wayzata, Minnesota 55391 Telephone: (952) 449-8817
Airline Scheduling: An Overview
 Airline Scheduling: An Overview Crew Scheduling Time-shared Jet Scheduling (Case Study) Airline Scheduling: An Overview Flight Schedule Development Fleet Assignment Crew Scheduling Daily Problem Weekly
a group airfare marketplace administered by AI
 a group airfare marketplace administered by AI Bacarai is an online marketplace where airlines can use independent AI agents to manage their group travel programs, ditching the call center model of the
Do Not Write Below Question Maximum Possible Points Score Total Points = 100
 University of Toronto Department of Economics ECO 204 Summer 2012 Ajaz Hussain TEST 3 SOLUTIONS TIME: 1 HOUR AND 50 MINUTES YOU CANNOT LEAVE THE EXAM ROOM DURING THE LAST 10 MINUTES OF THE TEST. PLEASE
November 2013 Passenger and Cargo Traffic Statistics Reno-Tahoe International Airport
 November 2013 Passenger and Cargo Traffic Statistics Reno-Tahoe International Airport December 26, 2013 U.S. DOMESTIC INDUSTRY OVERVIEW FOR NOVEMBER 2013 All RNO Carriers Domestic Systemwide year over
U.S. DOMESTIC INDUSTRY OVERVIEW FOR OCTOBER 2010 All RNO Carriers Systemwide year over year comparison
 Inter-Office Memo Reno-Tahoe Airport Authority Date: November 22, 2010 To: Chairman and Board of Trustees From: Krys T. Bart, A.A.E., President/CEO Subject: RENO-TAHOE INTERNATIONAL AIRPORT OCTOBER 2010
Inter-Office Memo Reno-Tahoe Airport Authority
 Inter-Office Memo Reno-Tahoe Airport Authority Date: November 30, 2009 To: Statistics Recipients From: Krys T. Bart, A.A.E., President/CEO Subject: RENO-TAHOE INTERNATIONAL AIRPORT PASSENGER STATISTICS
Scotia Capital Transportation & Aerospace Conference. June 5, 2007
 Scotia Capital Transportation & Aerospace Conference June 5, 2007 1 2 Changing the Game Changing the Game Canada s #1 domestic, trans-border and international airline Strong brand recognition Innovative
Cathay Pacific Airways Analyst Briefing. 21 November 2014
 Cathay Pacific Airways Analyst Briefing 21 November 2014 Operating Performance Passenger demand remains strong, although growth in North America is significantly short of increase in capacity. Demand for
AGENDA GUEMES ISLAND FERRY OPERATIONS PUBLIC FORUM
 AGENDA GUEMES ISLAND FERRY OPERATIONS PUBLIC FORUM Wednesday, August 17, 211 6: p.m. Guemes Island Community Hall ~ 7549 Guemes Island Road Thank you for attending the second Annual Public Forum in 211.
Oct-17 Nov-17. Travel is expected to grow over the coming 6 months; at a slower rate
 Analysis provided by TRAVEL TRENDS INDEX OCTOBER 2018 CTI reading of 51.6 in October 2018 indicates that travel to or within the U.S. grew 3.2% in October 2018 compared to October 2017. LTI predicts travel
Results 2Q17. August 9, 2017
 Results 2Q17 August 9, 2017 2Q17 Highlights Indicators 2Q17 Var. x 2Q16 ASK (BN) 10.4-3.0% Traffic (000) 7,261-1.3% RPK (BN) 8.1 +0.5% Load Factor 77.9% +2.7 p.p. Yield (R$ cents) 23.2 +4.8% Pax Revenue
International Airport Concession Briefing Package
 International Airport Concession Briefing Package RMD Financial Corporation 2300 W. 29th Ave., Denver, Colorado 80205 720-436-4832 Fax 720-262-8994 www.rmdfc.net generalmail@rmdfc.net International Airport
AUGUST 2008 MONTHLY PASSENGER AND CARGO STATISTICS
 Inter-Office Memo Reno-Tahoe Airport Authority Date: October 2, 2008 To: Statistics Recipients From: Tom Medland, Director Air Service Business Development Subject: RENO-TAHOE INTERNATIONAL AIRPORT PASSENGER
Abstract. Introduction
 COMPARISON OF EFFICIENCY OF SLOT ALLOCATION BY CONGESTION PRICING AND RATION BY SCHEDULE Saba Neyshaboury,Vivek Kumar, Lance Sherry, Karla Hoffman Center for Air Transportation Systems Research (CATSR)
Impacts of Visitor Spending on the Local Economy: George Washington Birthplace National Monument, 2004
 Impacts of Visitor Spending on the Local Economy: George Washington Birthplace National Monument, 2004 Daniel J. Stynes Department of Community, Agriculture, Recreation and Resource Studies Michigan State
Maximization of an Airline s Profit
 Maximization of an Airline s Profit Team 8 Wei Jin Bong Liwen Lee Justin Tompkins WIN 15 Abstract This project aims to maximize the profit of an airline. Three subsystems will be considered Price and Demand,
 1 2 23 24 15 16 7 8 9 Ancillary Revenue target per pax RM55 10 Online 365 11 212 13 14 14 Quarter Ended: 31 March RM'000 Revenue 2,068,227 Operating expenses: - Staff costs (286,663) - Depreciation
3. Aviation Activity Forecasts
 3. Aviation Activity Forecasts This section presents forecasts of aviation activity for the Airport through 2029. Forecasts were developed for enplaned passengers, air carrier and regional/commuter airline
Management Presentation. May 2013
 Management Presentation May 2013 Forward looking statements This presentation as well as oral statements made by officers or directors of Allegiant Travel Company, its advisors and affiliates (collectively
THE FUNDAMENTALS OF ROUTE DEVELOPMENT UNDERSTANDING AIRLINES MODULE 3
 THE FUNDAMENTALS OF ROUTE DEVELOPMENT UNDERSTANDING AIRLINES AIRLINE ISSUES Low margins Fuel price uncertainty Vulnerability to economic downturn Unpredictable one-time events High profits of airports
Oct-17 Nov-17. Sep-17. Travel is expected to grow over the coming 6 months; at a slightly faster rate
 Analysis provided by TRAVEL TRENDS INDEX SEPTEMBER 2018 CTI reading of.8 in September 2018 indicates that travel to or within the U.S. grew 1.6% in September 2018 compared to September 2017. LTI predicts
2017/ Q1 Performance Measures Report
 2017/2018 - Q1 Performance Measures Report Contents Ridership & Revenue... 1 Historical Revenue & Ridership... 1 Revenue Actual vs. Planned... 3 Mean Distance Between Failures... 5 Maintenance Cost Quarter
26 October 2017 Icelandair Group Interim Report NET PROFIT USD 101 MILLION IN THIRD QUARTER
 NET PROFIT USD 101 MILLION IN THIRD QUARTER Total income in Q3 up by 10% between years, to USD 536.0 million Passenger revenue higher than expected EBITDA unchanged year on year, at USD 161.1 million Passenger
= 21,60,000. = Solution to Q. 2 Working Notes:
 C.A. FINAL Solution to Q. 1 1) Calculation of total kms. for the year Kms. per round trip Round trips per day Days per month No. of months p.a. (30 2) 6 25 12 1,08,000 kms. 2) Calculation of total passenger
Investor Update July 22, 2008
 JetBlue Airways Investor Relations Lisa Studness (718) 709-2202 ir@jetblue.com Investor Update July 22, 2008 This investor update provides our investor guidance for the third quarter ending September 30,
HCPI COMESA Monthly News Release
 HCPI COMESA Monthly News Release Is sue No. 84 March 2018 Common Market for Eastern and Southern Africa (COMESA) Macroeconomic Indicators COMESA region annual inflation rate stood at 19.4% in March 2018
Transit Performance Report FY (JUNE 30, 2007)
") Transit Performance Report FY 2006-2007 (JUNE 30, 2007) J ANUARY 2008 TRANSIT PERFORMANCE REPORT FY 2006 2007 (JUNE 30, 2007) Transit Performance Report I SSUED: JANUARY 2008 The Transit Performance Report
Transit Performance Report FY 2006-2007 (JUNE 30, 2007) J ANUARY 2008 TRANSIT PERFORMANCE REPORT FY 2006 2007 (JUNE 30, 2007) Transit Performance Report I SSUED: JANUARY 2008 The Transit Performance Report
Citation XLS Analysis - Owner & Charter Hour Contributions. Prepared March 31, 2017
 Citation XLS Analysis - Owner & Charter Hour Contributions Prepared March 31, 2017 Aviation's Most Real World Operating Cost Application. Annual & Hourly Cost Detail Cessna Citation XLS Min Crew / Max
SECOND QUARTER RESULTS 2018
 SECOND QUARTER RESULTS 2018 KEY RESULTS In the 2Q18 Interjet total revenues added $ 5,781.9 million pesos that represented an increase of 9.6% over the revenue generated in the 2Q17. In the 2Q18, operating
USD thousand Q Q Change % Change 12M 2015
 EBITDA POSITIVE IN FIRST-QUARTER EBITDA positive by USD 1.1 million, as compared to a negative outcome of USD 2.3 million last year Positive impact of low fuel prices on performance 21% increase in passenger
Holiday Cruise Lines. Spreadsheet Design Introduction: Dealing With Costs & Revenues 1.011
 Holiday Cruise Lines Spreadsheet Design Introduction: Dealing With Costs & Revenues February 4, 2005 Jodie Misiak 1.011 Basic Details About HCL Holiday Cruise Lines (HCL) has been operating out of Pierpoint
Measuring the Business of the NAS
 Measuring the Business of the NAS Presented at: Moving Metrics: A Performance Oriented View of the Aviation Infrastructure NEXTOR Conference Pacific Grove, CA Richard Golaszewski 115 West Avenue Jenkintown,
Today: using MATLAB to model LTI systems
 Today: using MATLAB to model LTI systems 2 nd order system example: DC motor with inductance derivation of the transfer function transient responses using MATLAB open loop closed loop (with feedback) Effect
BOEING : DUTY PERIODS, FLIGHT TIME, AND REST REQUIREMENTS
 BOEING 747-400: DUTY PERIODS, FLIGHT TIME, AND REST REQUIREMENTS GENERAL > means greater than. < means less than. > means greater than or equal to. < means less than or equal to. Scheduled flights: Are
THE ECONOMIC IMPACT OF NEW CONNECTIONS TO CHINA
 THE ECONOMIC IMPACT OF NEW CONNECTIONS TO CHINA A note prepared for Heathrow March 2018 Three Chinese airlines are currently in discussions with Heathrow about adding new direct connections between Heathrow
Oakland A s Gondola Economic Impact
 January 2019 Oakland A s Gondola Economic Impact KEY FINDING: The proposed gondola system, which will connect the A s planned stadium to downtown Oakland, will generate $685 million in total economic benefit
Asset Manager s Report to the DRA Board
 Asset Manager s Report to the DRA Board March 2013 HILTON VANCOUVER WASHINGTON DASHBOARD SUMMARY MARCH 2013 1 PERFORMANCE RELATIVE TO THE COMPETITIVE SET The following table summarizes the Hotel s revenue
2012 Business Travel Forecast. Understanding the Present & Analyzing the Past
 2012 Business Travel Forecast 2012 Predicting the Future by Understanding the Present & Analyzing the Past 2012 Industry Overview Although travel suppliers will continue to increase domestic rates slightly
Service Cost Estimate for Route 10 only
 2009-2011 Service Cost Estimate for Route 10 only The City of Ashland buys down the fare on Route 10 for each passenger riding in Ashland, therefore service cost estimates are based on recent ridership
Fixed-Route Operational and Financial Review
 Chapter II CHAPTER II Fixed-Route Operational and Financial Review Chapter II presents an overview of route operations and financial information for KeyLine Transit. This information will be used to develop
Airline Operating Costs Dr. Peter Belobaba
 Airline Operating Costs Dr. Peter Belobaba Istanbul Technical University Air Transportation Management M.Sc. Program Network, Fleet and Schedule Strategic Planning Module 12: 30 March 2016 Lecture Outline
Seventh Grade 2003 pg. 4
 Seventh Grade 2003 pg. 4 MARS Tasks - Grade 7 Page 3 Seventh Grade 2003 pg. 14 MARS Tasks - Grade 7 Page 6 Seventh Grade 2003 pg. 15 MARS Tasks - Grade 7 Page 7 Seventh Grade 2003 pg. 30 MARS Tasks - Grade
Spirit Airlines Reports Fourth Quarter and Full Year 2016 Results
 Spirit Airlines Reports Fourth Quarter and Full Year 2016 Results MIRAMAR, FL. (February 7, 2017) - Spirit Airlines, Inc. (NASDAQ: SAVE) today reported fourth quarter and full year 2016 financial results.
Statistics of Air, Water, and Land Transport Statistics of Air, Water, and Land. Transport Released Date: August 2015
 Statistics of Air, Water, and Land Transport 2014 2013 1 Released Date: August 2015 Table of Contents Introduction... 4 Key Points... 5 1. Air Transport... 6 1.1 Aircraft movements... 6 1.2 Number of passengers...
The 2001 Economic Impact of Connecticut s Travel and Tourism Industry
 The 2001 Economic Impact of Connecticut s Travel and Tourism Industry EXECUTIVE SUMMARY Fred V. Carstensen, Director Stan McMillen, Manager, Research Projects Murat Arik, Research Associate Hulya Varol,
Jan-18. Dec-17. Travel is expected to grow over the coming 6 months; at a slower rate
 Analysis provided by TRAVEL TRENDS INDEX DECEMBER 2018 CTI reading of 51.8 in December 2018 indicates that travel to or within the U.S. grew 3.6% in December 2018 compared to December 2017. LTI predicts
Aviation Tax Law Webinar. December 12, 2017
 Aviation Tax Law Webinar Federal Income Tax Treatment of Personal Use of Aircraft December 12, 2017 Keith Swirsky, President GKG Law, P.C. 1055 Thomas Jefferson Street, N.W., Suite 500 Washington DC 20007
Australian Casino Association ECONOMIC REPORT. Prepared for. Australian Casino Association. June Finance and Economics
 Australian Casino Association ECONOMIC REPORT Prepared for Australian Casino Association June 2004 Finance and Economics Contents Executive Summary--------------------------------------------------------------------------------------------
Concur Travel: View More Air Fares
 Concur Travel: View More Air Fares Travel Service Guide Applies to Concur Travel: Professional/Premium edition TMC Partners Direct Customers Standard edition TMC Partners Direct Customers Contents View
STEM FUTURES. Air Travel STEM. Works! Using Maths Tasks. About the Industry. About Your Task
 STEM FUTURES Using Maths Tasks STEM Works! Air Travel In these activities, you work in the aviation industry. You will need to use your mathematical skills to help your team solve some problems. About
49 May-17. Jun-17. Travel is expected to grow over the coming 6 months; at a slower rate
 Analysis provided by TRAVEL TRENDS INDEX MAY 2018 CTI reading of 51.7 in May 2018 shows that travel to or within the U.S. grew 3.4% in May 2018 compared to May 2017. LTI predicts moderating travel growth
Copa Holdings Reports Record Earnings of US$41.8 Million for 4Q06 and US$134.2 Million for Full Year 2006
 Copa Holdings Reports Record Earnings of US$41.8 Million for 4Q06 and US$134.2 Million for Full Year 2006 Panama City, Panama --- March 7, 2007. Copa Holdings, S.A. (NYSE: CPA), parent company of Copa
Industry Update. ACI-NA Winter Board of Directors Meeting February 3, 2016 Orlando, FL
 Industry Update ACI-NA Winter Board of Directors Meeting February 3, 2016 Orlando, FL U.S. & Canadian GDP 8% 6% 4% U.S.* Canada** Estimate by BEA as of 02/11/16 2% 0% -2% -4% -6% -8% -10% The U.S. economy
Economic Impacts of Campgrounds in New York State
 Economic Impacts of Campgrounds in New York State June 2017 Report Submitted to: Executive Summary Executive Summary New York State is home to approximately 350 privately owned campgrounds with 30,000
Aviation Economics & Finance
 Aviation Economics & Finance Professor David Gillen (University of British Columbia )& Professor Tuba Toru-Delibasi (Bahcesehir University) Istanbul Technical University Air Transportation Management M.Sc.
LEAVING THE RED Creating a profitable airline
 Despite airline industry growth over decades, the majority of airline businesses remain consistently unprofitable over an entire business cycle. - Ganna Demydyuk, Choosing financial KPI in the Airline
Allegiant Travel Company Reports First Quarter 2009 Financial Results
 Allegiant Travel Company Reports First Quarter 2009 Financial Results --NET INCOME INCREASES 191%, OPERATING MARGIN EXCEEDS 31% LAS VEGAS, April 19, 2009 /PRNewswire-FirstCall via COMTEX News Network/
AIR NEW ZEALAND ANNUAL RESULTS ANNUAL RESULTS
 AIR NEW ZEALAND ANNUAL RESULTS 2008 1 HIGHLIGHTS Record operating revenue, up 9% Normalised earnings* $197m Net cash position of $1.3bn Launched direct service to Vancouver and Beijing Award winning product
Economic Impact of Aviation in Arizona
 Economic Impact of Aviation in Arizona Presented by: Arizona Department of Transportation Aeronautics Division May 5, 2004 Aviation Contributes $38.5 Billion to the Arizona Economy PRIMARY IMPACT Economic
FOURTH QUARTER RESULTS 2017
 FOURTH QUARTER RESULTS 2017 KEY RESULTS In the 4Q17 Interjet total revenues added $5,824.8 million pesos that represented an increase of 10.8% over the revenue generated in the 4Q16. In the 4Q17, operating
Financial overview. Adjusted operating cash flow* Annual dividend (excluding special dividend) Dollar movement. Percentage
 Dollar movement. Percentage") 1 Financial overview June 2007 June 2006 Dollar movement Percentage movement Operating revenue $4,297m $3,805m $492m 13% PBUT $268m $150m $118m 79% NPAT $214m $96m $118m 123% Adjusted operating cash flow*
1 Financial overview June 2007 June 2006 Dollar movement Percentage movement Operating revenue $4,297m $3,805m $492m 13% PBUT $268m $150m $118m 79% NPAT $214m $96m $118m 123% Adjusted operating cash flow*
Mathcad Prime 3.0. Curriculum Guide
 Mathcad Prime 3.0 Curriculum Guide Live Classroom Curriculum Guide Mathcad Prime 3.0 Essentials Advanced Functionality using Mathcad Prime 3.0 Mathcad Prime 3.0 Essentials Overview Course Code Course Length
Analysts Briefing. 18 March Cathay Pacific Airways Limited
 Analysts Briefing 18 March 2015 Cathay Pacific Airways Limited Annual Results 2014 2013 Change Group attributable profit HK$m 3,150 2,620 +20.2% Group turnover HK$m 105,991 100,484 +5.5% Profit margin
SOLUTIONS TO ASSIGNMENT PROBLEMS. Problem No.1
 SOLUTIONS TO ASSIGNMENT PROBLEMS Problem No.1 3. OPERATING COSTING Calculation of passenger km: Onward: 25 days x 3 trips x 20 km x 12 months 18,000 x 40 passengers 7,20,000 pass. Km. Return: 25 days x
TRAFFIC COMMERCIAL AIR CARRIERS
 INTERNATIONAL CIVIL AVIATION ORGANIZATION AIR TRANSPORT REPORTING FORM (01/00) Page of Contact person for inquiries: Organization: Tel.: Fax: E-mail: State: Air carrier: Month(s): Year: 20 TOTAL ALL SERVICES
ROLLER COASTER POLYNOMIALS Due: Thursday, March 30th
 ROLLER COASTER POLYNOMIALS Due: Thursday, March 30th Purpose: In real life, polynomial functions are used to design roller coaster rides. In this project, you will apply skills acquired in Unit 3 to analyze
SIA GROUP FINANCIAL RESULTS
 FINANCIAL RESULTS For Ended 30 June 2018 197200078R Operating Result Q1 Q1 Better/ FY18/19 FY17/18 R1 (Worse) ($M) ($M) (%) Total Revenue 3,844 3,864 (0.5) Q1 Better/ FY17/18 R2 (Worse) ($M) (%) 3,689
Management Presentation. May 2012
 Management Presentation May 2012 Forward looking statements This presentation as well as oral statements made by officers or directors of Allegiant Travel Company, its advisors and affiliates (collectively
Ref. PE004/ May Subject: Management Discussion and Analysis for the First Quarter of 2018
 Ref. PE004/2561 10 May 2018 Subject: Management Discussion and Analysis for the First Quarter of 2018 Attention: President The Stock Exchange of Thailand According to the financial reports of Nok Airlines
METROBUS SERVICE GUIDELINES
 METROBUS SERVICE GUIDELINES In the late 1990's when stabilization of bus service was accomplished between WMATA and the local jurisdictional bus systems, the need for service planning processes and procedures
NORWEGIAN AIR SHUTTLE ASA QUARTERLY REPORT FIRST QUARTER 2004 [This document is a translation from the original Norwegian version]
![NORWEGIAN AIR SHUTTLE ASA QUARTERLY REPORT FIRST QUARTER 2004 [This document is a translation from the original Norwegian version]](/thumbs/87/95085804.jpg "NORWEGIAN AIR SHUTTLE ASA QUARTERLY REPORT FIRST QUARTER 2004 [This document is a translation from the original Norwegian version]") NORWEGIAN AIR SHUTTLE ASA QUARTERLY REPORT 2004 IN BRIEF At the start of 2003, Norwegian has become a pure low-fare airline. The Fokker F-50 operations have been terminated, and during the quarter the
NORWEGIAN AIR SHUTTLE ASA QUARTERLY REPORT 2004 IN BRIEF At the start of 2003, Norwegian has become a pure low-fare airline. The Fokker F-50 operations have been terminated, and during the quarter the
Sound Transit Operations January 2017 Service Performance Report. Ridership. Total Boardings by Mode
 January 217 Service Performance Report Ridership ST Express Sounder Tacoma Link Link Paratransit Jan-16 Jan-17 % 1,433,7 1,3,33 4.9% 331,27 7,121 98,411 3,633 Total Boardings by Mode 363,6 74,823 1,76,914
VERY GOOD RESULTS IN OUR MOST IMPORTANT QUARTER
 VERY GOOD RESULTS IN OUR MOST IMPORTANT QUARTER Q3 EBITDA USD 161.8 million, as compared to USD 155.6 million in the corresponding quarter last year 19% increase in passenger numbers on international flights
BUSINESS BAROMETER December 2018
 Credit: Chris Orange BUSINESS BAROMETER December Credit: Nigel Moore 1 Contents Summary of findings 3 Annual monthly performance: visitor attractions..4 Visit Herts Team update 5 National context.8 Visitor