This presentation is given on behalf of Auckland International Airport Limited (NZX: AIA; ASX: AIA; ADR: AUKNY). Information in this presentation:
|
|
|
- Garey Hines
- 5 years ago
- Views:
Transcription
1
2 Important notice Disclaimer This presentation is given on behalf of Auckland International Airport Limited (NZX: AIA; ASX: AIA; ADR: AUKNY). Information in this presentation: is provided for general information purposes only, and is not an offer or invitation for subscription, purchase, or recommendation of securities in Auckland International Airport Limited (Auckland Airport); should be read in conjunction with, and is subject to, Auckland Airport s unaudited Interim Report for the six months ended 31 December 2018, prior annual and interim reports and Auckland Airport's market releases on the NZX and ASX; includes forward-looking statements about Auckland Airport and the environment in which Auckland Airport operates which are subject to uncertainties and contingencies outside of Auckland Airport's control. Auckland Airport's actual results or may differ materially from these statements; includes statements relating to past, which should not be regarded as a reliable indicator of future ; and may contain information from third parties believed to be reliable; however, no representations or warranties are made as to the accuracy or completeness of such information. All information in this presentation is current at the date of this presentation, unless otherwise stated. Auckland Airport is not under any obligation to update this presentation at any time after its release, whether as a result of new information, future events or otherwise. All currency amounts are in New Zealand dollars unless otherwise stated and figures, including percentage movements, are subject to rounding. Refer page 34 for a glossary of the key terms used in this presentation. 2
3
4 Results at a glance Revenue $370.6m Underlying profit $136.9m Passenger movements 10.6m Operating cashflow $155.1m 11.5% 2.9% 3.7% 5.2% EBITDAFI $277.1m Earnings per share* 11.4c Aircraft movements 90,877 Capital investment $132.3m 10.8% 2.1% 3.1% 36.5% 4 * Underlying earnings
5 Growth across the business Aeronautical $157.6m revenue 5.8% Moderating passenger growth: 4.4% International 4.0% Domestic (5.2)% Transits Retail $110.8m revenue 24.6% Footprint expansion almost complete: 26 new store concepts $19.94 income per passenger 5.8% international PSR uplift Transport $32.9m revenue 4.8% Replacement capacity delivered: 108 net car park spaces added 1.9% ARPS increase Property $43.3m revenue 14.6% Development momentum continues: 8,000m 2 completed 104,000m 2 under construction Hotels $19.8m revenue* 2.9% Ongoing strong demand: ~92% occupancy Queenstown $25.3m revenue 9.1% Strong passenger growth: 6.7% International 10.5% Domestic 5 * Includes ibis Budget Hotel and 100% of Novotel Hotel revenues
6
7 Solid growth in revenue and EBITDA For the six months ended 31 December ($m) Change Revenue % Expenses % Earnings before interest, taxation, depreciation, fair value adjustments and investments in associates (EBITDAFI) % Share of profit from associates (2.2%) Share of profit from associate held for sale (100.0%) Derivative fair value (decrease)/increase 0.2 (3.0) (106.7%) Investment property revaluation (73.3%) Depreciation expense % Interest expense % Taxation expense % Reported profit after tax (11.3%) Underlying profit after tax* % 7 * A reconciliation between reported profit after tax and underlying profit after tax is included in the Appendix
8 Revenue growth across the business For the six months ended 31 December ($m) Change Airfield income % Passenger services charge % Retail income % Car park income % Investment property rental income % Other rental income % Other income (1.2%) Total revenue % Aeronautical revenue increase driven by growing passenger volumes and runway movements, partially offset by a price reduction in international aeronautical charges. In addition, airfield parking charge income uplift also contributed to the 7.3% increase in airfield income Retail income rose reflecting the full six month effect from the expanded Duty Free area as well as the launch of our luxury high street product during the period. Destination stores, the Collection Point and Strata Lounge also delivered strong income growth Parking revenue rose ahead of PAX growth with demand across the product range 8 Investment property rental income grew in the period reflecting the development of new properties, rental growth in existing portfolio rental with new benchmarks being set, as well as continued solid ibis budget hotel
9 Passenger growth moderating For the six months ended 31 December Change International arrivals 2,724,021 2,592, % International departures 2,570,486 2,477, % International passengers excluding transits 5,294,507 5,070, % Transit passengers* 533, ,616 (5.2%) Total international passengers 5,827,707 5,632, % Domestic passengers 4,816,706 4,630, % Total passengers 10,644,413 10,263, % Total passenger volumes growth of 3.7% driven by capacity additions International passenger growth of 4.4% reflecting increased airline capacity, primarily on Asian, Pacific Island and North American routes Domestic passenger volumes increased by 4.0% partly driven by increase in capacity on the main trunk routes Transit passengers were down 5.2% following the introduction of direct services to San Francisco and Santiago from Melbourne with the transit losses offset by more direct passengers on the Auckland - Santiago service 9 * In June 2018 Auckland Airport restated transit passenger information following Immigration New Zealand's review of its data PCP also restated.
10 Steady growth in movements and MCTOW For the six months ended 31 December Change Aircraft movements International aircraft movements 29,101 27, % Domestic aircraft movements 61,776 60, % Total aircraft movements 90,877 88, % MCTOW (tonnes) International MCTOW 3,003,550 2,907, % Domestic MCTOW 1,203,153 1,184, % Total MCTOW 4,206,703 4,092, % International aircraft movements increased 4.0% in the first half of FY19, ahead of International MCTOW, particularly on the Tasman as a result of Emirates withdrawal (backfilled by other carriers with smaller aircraft) and engine maintenance on Air NZ's B787 Dreamliner aircraft (replaced with smaller A320s) Domestic aircraft movements increased 2.7%, ahead of Domestic MCTOW reflecting Air New Zealand and Jetstar increasing frequency on their regional services 10
11 Expenses driven by business growth For the six months ended 31 December ($m) Change Staff % Asset management, maintenance and airport operations % Rates and insurance % Marketing and promotions % Professional services and levies (14.0%) Other % Total operating expenses % Depreciation % Interest % EBITDA margin of 74.8% in 1H19 declined vs PCP reflecting increases in staff and higher asset maintenance costs, as well as the ongoing costs associated with outsourcing business technology Staff costs increase driven by higher headcount in Airport Development & Delivery, Retail and Property plus additional specialist roles in Airport Operations. We also completed a pay equity review in the period resulting in some increases to ensure pan-business equity Asset management, maintenance and operations increase driven by investment in technology, additional variable costs to drive revenue growth (Strata Lounge, Valet) as well as servicing the increased terminal footprint Rates and insurance increase reflected the rise in insurance premiums from a full six months of the Fire Service Levy rise from last year, as well as servicing the increased terminal footprint 11
12 Associates For the six months ended 31 December ($m) Change Queenstown Airport* Total Revenue % EBITDA % Underlying Earnings (Auckland Airport share) (4.5%) Domestic Passengers 829, , % International Passengers 355, , % Aircraft movements 9,086 8, % Novotel Tainui Holdings** Total Revenue % EBITDA (1.6%) Underlying Earnings (Auckland Airport share) (4.5%) Average occupancy 91.8% 92.3% Average room rate increase 2.4% 10.1% Auckland Airport sold its investment in North Queensland Airports to a consortium of existing investors in March 2018 for A$370 million 12 * 24.99% ownership ** Novotel ownership increased from to 40.00% in February 2017
13 Funding Total borrowings at 31 December increased to $2,148m, 4.3% up on 30 June Committed undrawn facility headroom at 31 December of c.$374m Committed to our A- credit rating Dividend policy of paying ~100% of underlying NPAT Dividend reinvestment plan remains in place for the interim dividend and offered at a 2.5% discount to market price Debt maturity profile less than 1 year 1 to 3 years 3 to 5 years greater than 5 years $m Commercial paper Bank facilities Floating bonds Fixed bonds AMTN USPP Credit metrics Sources of funding For the period ended Dec 2018 Jun 2018 Debt/Debt + market value of equity 20.0% 20.4% Funds from operations interest cover Funds from operations to net debt 18.3% 18.4% Weighted average interest cost 4.29% 4.24% Average debt maturity profile Percentage of fixed borrowings 60.1% 54.7% Commercial paper (4.6%) Bank facilities (8.9%) Floating bonds (7.4%) Fixed bonds (40.8%) AMTN (14.1%) USPP (24.2%) 13
14 Our continuing

15 Strategic priority: Growing travel and trade markets Variable growth from traveller source markets in the six months to December 2018 Middle East Capacity 3.4% Passengers 1.0% North Asia Capacity 0.8% Passengers 0.1% China Capacity 6.3% Passengers 7.2% North America Capacity 6.9% Passengers 5.1% South East Asia Capacity 49.3% Passengers 38.6% Pacific Capacity 6.7% Passengers 6.7% Tasman Capacity 3.3% Passengers 1.5% Domestic Capacity 2.2% Passengers 4.0% South America Capacity 2.4% Passengers 0.5% Long haul seat capacity growth continues to unlock passenger source markets, providing more convenient direct flight routings to key Asia Pacific and Middle East hubs New direct routes to Taipei and Chicago launched during the period unlocking new traveller source markets, whilst growth continued on existing routes Restructure of the Tasman aviation market post alliance changes with three scale competitors and the further rationalisation of fifth freedom airline operators 15 * Data reflects direct flights to Auckland
16 Strategic priority: Growing travel and trade markets Theme Observation Implication Our aeronautical market is also more diversified than a few years ago, with more destinations served Number of destinations served Number of airlines operating Our network is maturing with indirect services being replaced with point to point travel Increased depth and breadth of the network is adding resilience to our passenger flows The depth of our aeronautical market has increased in recent years with increased frequencies on many routes New Zealand outbound and domestic remains strong but showing signs of slowing down Chinese PAX 3 year CAGR Direct via AUS 20% -5% North American market deepening airlines 2 5 destinations Number of NZ PAX s 3.8m 4.5m Additional capacity has stimulated increased travel through greater choice and lower prices Emerging markets continue to grow, with India, Malaysia, Thailand and Brazil PAX up >10%, albeit off a low base Routes more sustainable with the number of next generation aircraft operating out of Auckland continuing to increase number of next generation aircraft operating out of Auckland continues to increase 16


17 Strategic priority: Invest for future growth Customers are seeing the benefits of our infrastructure programme Terminal The international outbound expansion (Phase 3) project reached practical completion in February 2019 refurbishing or extending 36,000m² of the international terminal Phase 3, together with other recently completed elements of the international terminal development programme have added 55,000m² of new or refurbished terminal space in the last 12 months including: emigration and security processing area; passenger decompression area; retail space; and passenger amenities Sun showers by Eric Rieger aka HOTTEA 17 Transport Completed the Landing Road intersection upgrade and the Nixon Road bypass These projects deliver substantial improvements in traffic flow across the precinct reduced average times from the international and domestic terminals to The Landing by 38% and 50%, respectively, vs last year s summer peak 85% reduction in heavy vehicles transiting south through the airport precinct since the opening of the bypass Newly opened International Terminal departures pre-screening area

18 Strategic priority: Invest for future growth Our seven anchor projects Northern stands & taxiways Northern runway New cargo terminal New international arrivals PUDO & MSCP1 Northern road network Domestic rejuvenation New domestic jet facility Anchor projects Eight anchor projects create significant additional aeronautical capacity to cater for future growth Since setting pricing for PSE3 we have been consulting with key stakeholders around the design of many of these projects and their construction This consultation process has resulted in us revisiting a number of the design elements to ensure they meet the needs of customers Given the increased scale of these projects we have also revisited the timing and sequencing to ensure the anchor projects: provide the right level of headroom to enable construction to occur; and minimise disruption to customers Reference image only, actual design will vary


19 Terminal Terminal Terminal Terminal Strategic priority: Invest for future growth 1H19 2H19 FY20 and beyond Phase 3 Extended outbound processing & dwell New domestic jet facility Principal design elements established Detailed consultation on function and process Design elements refined Procurement model to be developed Finalise concept design and consultation with stakeholders and airlines Continue enabling works Complete detailed design New international arrivals Completed concept design Agreed key elements with border agencies and airlines Awarded and commenced next phase of design Continue design Commence construction enabling works Commence procurement Complete enabling works Commence civil works Domestic rejuvenation Expansion of foodcourt and security area commenced Further follow-on feasibility studies commenced for additional works Follow-on projects design completed Expanded foodcourt and security area opens Commence civil and major airfield and in-terminal works Industry study complete Location confirmed Consultation with industry stakeholders underway Commence concept design Commence civil works and construction New cargo terminal 19


20 Transport Transport Airfield Airfield Strategic priority: Invest for future growth 1H19 2H19 FY20 and beyond Northern stands & taxiways Finalised detailed design Agreed design and acceleration of project with stakeholders and airlines Tenders issued and received Tender evaluation and award Commencement of enabling and civil works Taxiway Mike and Lima testing Stand earthworks completed Commence construction of drainage and pavement Northern runway NOR decision issued Feasibility design complete Concept design commenced Consultation with stakeholders and airlines Updating work on timing for the northern runway Concept design complete Procurement model agreed Detailed design underway Earthworks construction forecast to begin in FY21, subject to triggers Completion forecast FY28 PUDO and MSCP1 Completed concept design Agreed key elements with stakeholders and airline Commenced preliminary design Complete preliminary design Commence enabling works Procurement model to be developed Final stages of design, procurement and preparation for main works Northern road network Continued detailed design Consultation with stakeholders and airlines Commenced procurement for physical works Finalise detailed design Construction contract awarded Construction commenced Stage 1 GBMD* widening and two-way north/south by-pass complete Terminal exit road opened 20 * George Bolt Memorial Drive


21 Strategic priority: Invest for future growth Continued momentum with 14.6% growth in rental income Development momentum maintained. Strong preleasing activity and new rental benchmarks set Completed developments include: 7,000m 2 DSV Logistics warehouse and office at The Landing 6,700m 2 facility for Sheppard Cycles and Early Settler Projects under construction progressing well: Foodstuffs civil works complete 6 weeks ahead of programme 1,200m 2 office development for Airways 11,000m 2 speculative warehouse facility pre-let 6 months prior to completion Two speculative warehouse projects totaling 16,000m 2 in design Design and procurement for Hotel 4 and the Pullman ongoing. Construction on track to commence in 2019 $94.0m 97.7% 246 Investment property rent roll Occupancy in the portfolio 9.6 years WALT DSV Logistics hectares of land available for development Ignite Urban Design Award: Best Property Team 21

22 Passenger experience improvements Passenger experience improvements Capacity and effectiveness Capacity and effectiveness Strategic priority: Be fast, efficient and effective In the first six months we have Agreed pathway with ACE* forum to increase air traffic movements to 47 per hour by 1H20 and 50 per hour by 2022 Doubled the number kiosks at the international terminal and added more airlines to the service ~70% of international passengers now use self-service kiosks Added four new mobile airbridges providing customers with a safer, faster and more comfortable experience Rolled out 4,000 new braked baggage trolleys Added improved wayfinding in international arrivals Launched real-time border agencies queue times feature in the Auckland Airport app Upgraded the WiFi network enabling improved service and extended the free period to 2 hours Over the next six months we are Undertaking a check-in-to-gate biometrics trial Improving the international transit experience Enhance international passenger screening Refurbishing Pier A to enlarge gate lounges Upgrading the Auckland Airport app to add new features, including home-to-gate and real time customer feedback Developing a dedicated One World Alliance check-in area 22 * Airfield Capacity Enhancement New Auckland Airport app real-time queue feature
23 Kiosk score by terminal ASQ score by terminal Strategic priority: Be fast, efficient and effective We are focused on overall system Our quality of service is improving across both terminals Baggage reclaim time in 1H19 continues to improve in an environment of growing pax DTB New facilities and focus on service delivery is resulting in improved customer feedback H18 1H19 ITB Jul-18 Aug-18 Sep-18 Oct-18 Nov-18 Dec-18 Number of bussed operations International baggage claim 11:31 10:05 08:38 07:12 05:46 04:19 02:53 01:26 00:00 Total number of bussed international flights has declined circa 35% on 1H Jul Aug Sep Oct Nov Dec * December 2018 baggage reclaim processing time increase was due to the 8 December fire incident Jul Aug Sep Oct Nov Dec 10.0% 8.0% 6.0% 4.0% 2.0% 0.0% 23 ITB DTB % of Flight Movements

24 Strategic priority: Strengthen our consumer business Improved retail experience driving ongoing growth Retail income up 24.6% and income per passenger grew by 19.9%* as a result of the expansion to duty free and new stores opening New store openings deliver a broader choice and better overall experience for passengers International terminal retail sales were up 10.4% while PSR increased 5.8%, with duty free and luxury the biggest contributors % 19.9% * Per international passenger New retail concepts opened during the year Increase in retail income Increase in retail income per passenger* Duty Free PSR grew 10.4%, led by cosmetics & skincare, electronics and NZ health & wellbeing products 24 Luxury stores have grown overall retail sales without cannibalising other segments Continued strong s from the Collection Point, and Strata Lounge, both up in double-digits Technology and additional destination products added to The Mall product range with overall ATV c.25% higher than physical stores Retail income expected to moderate in future periods as we cycle recent store expansion Launched a WeChat mini-store for Chinese customers, an extension of the Mall


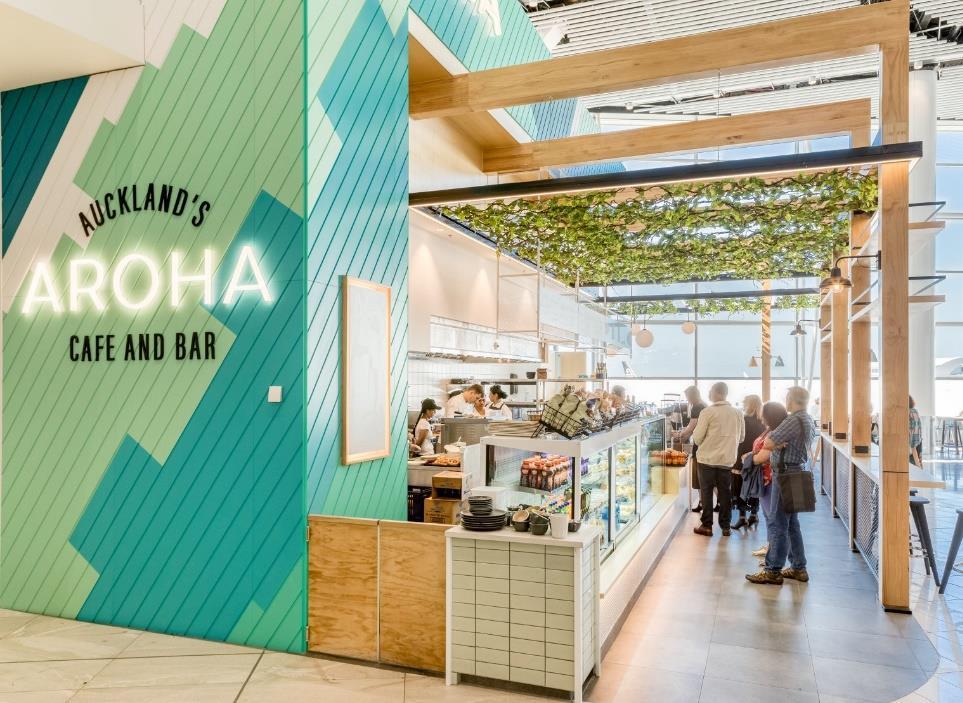
25 New retail outlets enhancing the experience

26 Strategic priority: Strengthen our consumer business Parking revenue up in line with passenger growth despite capacity disruptions Parking income up 4.8%, with ARPS also up 1.9% as a result of continued demand and customer receptiveness to higher value products Valet revenue increased by 28.2% Completed the demolition and repurposing of the Cargo Central building into domestic car parking 36% Increase in Valet exits 46% Online booking as % of total car parking income Added 700 (108 net) new parking spaces in the period Construction of the 1,000 (500 net) bay multistorey car park progressing to plan and is expected to complete in June 2019 Finalising design of the 3,000 space multi-storey car park to be located outside the future domestic jet terminal New 1,000 bay multi-storey car park under construction Business-casing a significant Park & Ride expansion, with a capacity of ~ 4,000 spaces 26

27 People, place and community We are continuing to prioritise safety and play our part in the community 27 Community 12 days of Christmas initiative in its 10 th year Expanded the Auckland Airport Education Scholarships programme to 10 local secondary school students assisting with tertiary studies and employment transition Granted $345,781 to the Auckland Airport Community Trust to support learning, literacy and life skills in South Auckland Thirty $1,000 grants to local charities and organisations People, safety and sustainability Total passenger and public injuries down in 1H19 Over the last three years, the employee recordable injury rate declined 36% but it is up 9% on prior year Helped to plant 40,000 native trees at a Million Trees / Matariki Tu Rākau community event Updated parental leave policy providing support in excess of the minimum legislative provisions Completed a pay equity review resulting in positive changes that ensure we maintain an equitable remuneration system Employment Created 279 training opportunities and placed 159 people into new jobs in 1H19 31% 9.0% 5.6% Reduction in total passenger and public injuries in 1H Increase in the employee recordable injury rate Increase in the number of reported safety observations* * Including hazards and near-misses 2018 Award for Community Engagement
28 and guidance

29 update On 1 November 2018, the Commerce Commission published its final report on Auckland Airport's aeronautical pricing for PSE3 (FY18-22), concluding that part of our targeted return over and above its 6.41% airport-sector mid-point estimate is excessive We believe that our published PSE3 aeronautical pricing and the target return were fair and we provided considerable Auckland Airport-specific evidence in support But we are respectful of the important role that the Commission plays in overseeing the economic regulation for New Zealand airports Blue Sky 18 pan-agency emergency response exercise Our Board has therefore decided to provide a discount to Auckland Airport's published prices for FY20, FY21 and FY22, so as to reduce our target return over the entire five year PSE3 period from 6.99% (equivalent to the Commission's 65th percentile airport-sector WACC estimate) to 6.62% (55th percentile) We are looking forward to moving on from the three year PSE3 aeronautical pricing process culminating in today s pricing response announcement and are now turning our focus back on efficiently running the business and on delivering the very large aeronautical capex programme that will deliver considerable benefits to our airlines, passengers and the wider New Zealand economy 29
30 $m Capital expenditure update Capital spend decreased in 1H19 to $132.3m Historical capital expenditure Some anchor PSE3 projects are taking longer as concept design and consultation continues with the interdependencies and complexity of projects extending timelines Northern stands and taxiways project accelerated with support of key customers due to capacity and sequencing requirements Construction market presents challenges, but we are looking to reduce this risk through procurement Total commissioned capex during PSE3 is still forecast to be broadly consistent with the original pricing forecasts Property development Infrastructure and other Aeronautical Car Parking Retail 1H

31 Outlook Guidance We now expect total capital expenditure in FY19 of between $280m and $330m We expect underlying net profit after tax (excluding any fair value changes and other one-off items) in FY19 to be between $265m and $275m This guidance is subject to any material adverse events, significant one-off expenses, non-cash fair value changes to property and any deterioration due to global market conditions or other unforeseeable circumstances 31
32 Questions
33 Appendix: Underlying profit reconciliation For the six months ended 31 December ($m) Reported profit Adjustments Underlying profit Reported profit Adjustments Underlying profit EBITDAFI per Income Statement Share of profit of associates 4.3 (0.1) Share or profit of associate held for sale Derivative fair value movement 0.2 (0.2) - (3.0) Investment property fair value increases 11.1 (11.1) (41.5) - Property plant and equipment revaluation Depreciation (50.0) - (50.0) (40.7) - (40.7) Interest expense and other finance costs (40.1) - (40.1) (38.6) - (38.6) Taxation expense (55.4) 1.1 (54.3) (54.5) 5.6 (48.9) Profit after tax (10.3) (32.8) We have made the following adjustments to show underlying profit after tax for the six months ended 31 December 2018 and 31 December 2017: reversed out the impact of revaluations of investment property in 2018 and An investor should monitor changes in investment property over time as a measure of growing value. However, a change in one particular year is too short to measure long term. Changes between years can be volatile and, consequently, will impact comparisons. Finally, the revaluation is unrealised and, therefore, is not considered when determining dividends in accordance with the dividend policy. None of the property, plant and equipment revaluation in 2018 affected reported profit. Therefore, no underlying profit adjustment was required in 2018, nor in 2017 in which there was no property, plant and equipment revaluation; the group recognises gains or losses in the income statement arising from valuation movements in interest rate derivatives which are not hedge accounted and where the counterparty credit risk on derivatives impacts accounting hedging relationships. These gains or losses, like investment property, are unrealised and interest rate derivative valuation movements are expected to reverse out over their lives; to be consistent, we have also reversed the revaluations of investment property and financial derivatives that are contained within the share of profit of associates in 2018 and 2017; and 33 reversed the taxation impacts of the above movements in both 2018 and 2017.
34 Glossary ACE ARPS ATV EBITDAFI GBMD MCTOW PAX PSE3 PSR WALT Airfield Capacity Enhancement Average revenue per parking space Average transaction value Earnings before interest, taxation, depreciation, fair value adjustments and investments in associates George Bolt Memorial Drive Maximum certified take off weight Passenger FY18-FY22 Passenger spend rate Weighted average lease term 34
Auckland International Airport FY19 Interim Results: Positive start to year as airport progresses anchor infrastructure projects
 Media Release 22 February 2019 Auckland International Airport FY19 Interim Results: Positive start to year as airport progresses anchor infrastructure projects Auckland Airport today announced its financial
Interim Results Adrian Littlewood Chief Executive. Philip Neutze Chief Financial Officer
 Interim Results 2018 Adrian Littlewood Chief Executive Philip Neutze Chief Officer FY18 interim results Adrian Littlewood, chief executive Results at a glance Revenue 6.9% $332.4m Passenger movements 6.4%
2015 Annual Results. Delivering for the future
 Delivering for the future Annual Report 2015 This annual results presentation dated 24 August 2015 provides additional comment on the media and financial materials released before the market opened on
Aeronautical pricing. July 2017 June Adrian Littlewood Chief Executive. Philip Neutze Chief Financial Officer
 Aeronautical pricing July 2017 June 2022 Adrian Littlewood Chief Executive Philip Neutze Chief Financial Officer New pricing summary Reasonable price path and strong infrastructure investment 30-year Master
Heathrow (SP) Limited
 Limited") Draft v2.0 10 Feb Heathrow (SP) Limited Results for year ended 31 December 2013 24 February 2014 Strong operational and financial performance in 2013 Passenger satisfaction at record high and over 72 million
Draft v2.0 10 Feb Heathrow (SP) Limited Results for year ended 31 December 2013 24 February 2014 Strong operational and financial performance in 2013 Passenger satisfaction at record high and over 72 million
Heathrow (SP) Limited
 Limited") 28 April 2014 Heathrow (SP) Limited Results for three months ended 31 March 2014 Strong operational and financial performance at the outset of the new regulatory period Highest ever passenger satisfaction
28 April 2014 Heathrow (SP) Limited Results for three months ended 31 March 2014 Strong operational and financial performance at the outset of the new regulatory period Highest ever passenger satisfaction
2007/08 Full Year Results Investor Briefing
 2007/08 Full Year Results Investor Briefing Highlights of Result Profit before tax up 46% to $1,408 million Up 36% on the reported result Margin improvement $3 billion of Sustainable Future Benefits achieved
For personal use only
 Sydney Airport Holdings Limited ABN 85 075 295 760 AFSL 236875 Central Terrace Building 10 Arrivals Court Sydney International Airport New South Wales 2020 T 1800 181 895 or +61 2 9667 9871 F +61 2 9667
MACQUARIE AIRPORTS FULL YEAR & FOURTH QUARTER 2008 RESULTS FOR SYDNEY AIRPORT
 Macquarie Airports Management Limited ABN 85 075 295 760 AFS Licence No. 236875 A Member of the Macquarie Group of Companies No. 1 Martin Place SYDNEY NSW 2000 GPO Box 4294 SYDNEY NSW 1164 AUSTRALIA Telephone
QANTAS DELIVERS STRONG FIRST HALF RESULT DESPITE HIGHER FUEL BILL
 ASX and Media Release Sydney, 21 February 2019 QANTAS DELIVERS STRONG FIRST HALF RESULT DESPITE HIGHER FUEL BILL Underlying Profit Before Tax: $780 million (down $179 million) Statutory Profit Before Tax:
For personal use only
 HELLOWORLD TRAVEL LIMITED RESULTS ANNOUNCEMENT Highlights for the year ended 30 June 2018 Total Transaction Value (TTV) growth of 3.5% to $6.1 billion, underpinned by strong air ticket sales volume growth.
2012 Result. Mika Vehviläinen CEO
 2012 Result Mika Vehviläinen CEO 1 Agenda Market environment in Q4 Business performance and strategy execution Outlook Financials 2 Market Environment According to IATA, Global air travel continues to
Media Release 23 August 2011
 Media Release 23 August 2011 Auckland Airport announces annual results for year ending 30 June 2011 Underlying profit up 15.1% from previous year Growth in passengers across all four airports Retail division
Copa Holdings Reports Record Earnings of US$41.8 Million for 4Q06 and US$134.2 Million for Full Year 2006
 Copa Holdings Reports Record Earnings of US$41.8 Million for 4Q06 and US$134.2 Million for Full Year 2006 Panama City, Panama --- March 7, 2007. Copa Holdings, S.A. (NYSE: CPA), parent company of Copa
KERRIE MATHER MANAGING DIRECTOR AND CHIEF EXECUTIVE OFFICER. Macquarie Conference 4 MAY 2016
 KERRIE MATHER MANAGING DIRECTOR AND CHIEF EXECUTIVE OFFICER Macquarie Conference 4 MAY 2016 Disclaimer General securities warning This presentation has been prepared by Sydney Airport Limited (ACN 165
Media Release. Qantas Group Full Year 2017 Financial Result 1. Sydney, 25 August 2017
 Media Release Qantas Group Full Year 2017 Financial Result 1 Sydney, 25 August 2017 Underlying Profit Before Tax: $1,401 million (second highest in Qantas history) Statutory Profit Before Tax: $1,181 million
BAA (SP) Limited Results for six months ended 30 June July 2011
 Limited Results for six months ended 30 June July 2011") BAA (SP) Limited Results for six months ended 30 June 2011 July 2011 Record Q2 Heathrow traffic Good overall service standards Strong financial results Successful dollar and sterling financings H1 2011
BAA (SP) Limited Results for six months ended 30 June 2011 July 2011 Record Q2 Heathrow traffic Good overall service standards Strong financial results Successful dollar and sterling financings H1 2011
Virgin Australia Holdings Limited (ASX: VAH) H1 FY18 Results 1
 H1 FY18 Results 1") Virgin Australia Holdings Limited (ASX: VAH) H1 FY18 Results 1 Summary of H1 FY18 Group Outcomes 2 Group Underlying Profit Before Tax of $102.5 million up 142.3% Group Statutory Profit After Tax of $4.4
Virgin Australia Holdings Limited (ASX: VAH) H1 FY18 Results 1 Summary of H1 FY18 Group Outcomes 2 Group Underlying Profit Before Tax of $102.5 million up 142.3% Group Statutory Profit After Tax of $4.4
For personal use only
 ASX and Media Release QANTAS DELIVERS RECORD FIRST HALF PROFIT, INVESTS IN AIRCRAFT AND TRAINING Sydney, 22 February 2018 Underlying Profit Before Tax: $976 million (up 15%) Record results for Qantas Domestic,
Highlights from the Annual Results December 2007
 Highlights from the Annual Results December 2007 Disclaimer The information in this document is taken from the BAA 2007 Annual Results ( the Results ) which were published on 11 March 2008 and other public
Helloworld Travel Limited results announcement Half year ended 31 December 2017
 Helloworld Travel Limited results announcement Half year ended 31 December 2017 HIGHLIGHTS FOR THE HALF YEAR ENDED 31 DECEMBER 2017 Total Transaction Value (TTV) growth of 2.7% to $2.968 billion. Earnings
INVESTOR PRESENTATION. Imperial Capital Global Opportunities Conference September 2015
 INVESTOR PRESENTATION Imperial Capital Global Opportunities Conference September 2015 Forward-looking Statements This presentation contains forward-looking statements within the meaning of the Private
OPERATING AND FINANCIAL HIGHLIGHTS SUBSEQUENT EVENTS
 Copa Holdings Reports Net Income of US$6.2 Million and EPS of US$0.14 for the Third Quarter of 2015 Excluding special items, adjusted net income came in at $37.4 million, or EPS of $0.85 per share Panama
STANSTED AIRPORT LIMITED REGULATORY ACCOUNTS PERFORMANCE REPORT FOR THE YEAR ENDED 31 MARCH Financial Review...1. Performance Report...
 PERFORMANCE REPORT CONTENTS Page Financial Review...1 Performance Report...3 Notes to the Performance Report...4 Stansted Regulatory Accounts PERFORMANCE REPORT Financial Review General overview Stansted
Air China Limited Annual Results. March Under IFRS
 Air China Limited 21 Annual Results Under IFRS March 211 Agenda Part 1 Highlights Part 2 Business Overview Part 3 Financial Overview Part 4 Outlook 2 Part 1 Highlights Steady Economic Growth; Asia Pacific
OPERATING AND FINANCIAL HIGHLIGHTS
 Copa Holdings Reports Net Income of US$18.6 Million and EPS of US$0.42 for the Second Quarter of 2010 Excluding special items, adjusted net income came in at $26.3 million, or $0.60 per share Panama City,
OPERATING AND FINANCIAL HIGHLIGHTS
 Copa Holdings Reports Net Income of US$32.0 Million and EPS of US$0.72 for the Second Quarter of 2012 Excluding special items, adjusted net income came in at $58.6 million, or EPS of $1.32 per share Panama
Sydney Airport delivers another year of strong performance and is well positioned for growth
 21 February 2018 Sydney Airport delivers another year of strong performance and is well positioned for growth Growth across all businesses with total revenue increasing 8.7% Record passenger numbers of
Overview. > Normalised earnings* before taxation of, up 30% > Statutory earnings before taxation of, up 40% > Statutory net profit after taxation of
 1 Overview > Normalised earnings* before taxation of, up 30% > Statutory earnings before taxation of, up 40% > Statutory net profit after taxation of > Operating revenue of > Strong operating cash flow
Copa Holdings Reports Fourth Quarter and Full Year 2007 Results
 Copa Holdings Reports Fourth Quarter and Full Year 2007 Results Panama City, Panama --- February 21, 2008. Copa Holdings, S.A. (NYSE: CPA), parent company of Copa Airlines and Aero Republica, today announced
OPERATING AND FINANCIAL HIGHLIGHTS. Subsequent Events
 Copa Holdings Reports Net Income of US$113.1 Million and EPS of US$2.57 for the First Quarter of 2015 Excluding special items, adjusted net income came in at US$106.0 million, or EPS of US$2.41 per share
Annual Results Air New Zealand
 Annual Results 2011 Air New Zealand Highlights Normalised earnings* $75m Net cash position of $860m Operating cash flow down 5% Gearingat467% at 46.7% Final dividend 2.5 cents per share (unimputed) New
OPERATING AND FINANCIAL HIGHLIGHTS SUBSEQUENT EVENTS
 Copa Holdings Reports Financial Results for the Third Quarter of 2016 Excluding special items, adjusted net income came in at $55.3 million, or adjusted EPS of $1.30 per share Panama City, Panama --- November
AEROFLOT ANNOUNCES FY 2017 IFRS FINANCIAL RESULTS
 AEROFLOT ANNOUNCES FY 2017 IFRS FINANCIAL RESULTS Moscow, 1 March 2018 Aeroflot Group ( the Group, Moscow Exchange ticker: AFLT) today publishes its audited financial statements in accordance with International
OPERATING AND FINANCIAL HIGHLIGHTS
 Copa Holdings Reports Financial Results for the Fourth Quarter of 2015 Excluding special items, adjusted net income came in at $31.7 million, or EPS of $0.73 per share Panama City, Panama --- February
Crown Resorts Limited
 Crown Resorts Limited 2015 Full Year Results Presentation 13 August 2015 1 Crown Resorts Limited Results Overview Crown Resorts Limited (Crown) performance: Overall, the results for Crown s portfolio of
QANTAS ANNOUNCES PROFIT RESULT YEAR ENDED 30 JUNE 2009
 QANTAS ANNOUNCES PROFIT RESULT YEAR ENDED 30 JUNE 2009 HIGHLIGHTS Profit before tax of $181 million, in a year when the International Air Transport Association forecast US$9 billion in losses for global
Forward looking statements
 Forward looking statements This presentation contains forward-looking statements. Forward-looking statements often include words such as anticipate", "expect", "intend", "plan", "believe, continue or similar
Forward looking statements
 1 Forward looking statements This presentation contains forward-looking statements. Forward-looking statements often include words such as anticipate", "expect", "intend", "plan", "believe, continue or
Qantas Group - Positioned for Growth and Sustainable Returns
 Qantas Group - Positioned for Growth and Sustainable Returns Tino La Spina, Qantas Group Chief Financial Officer Macquarie Australia Conference 3 May 2018 Third Quarter 1 FY18 Trading Update Q3 trading
INVESTOR PRESENTATION. May 2015
 INVESTOR PRESENTATION May 2015 Forward-looking Statements This presentation contains forward-looking statements within the meaning of the Private Securities Litigation Reform Act of 1995 that reflect the
Annual Profile
 Annual Profile 2016 2017 About Queenstown Airport Queenstown Airport is the gateway to stunning southern New Zealand. Auckland 1 As New Zealand s fourth busiest airport by passenger numbers, it is a strategic
Schiphol Group. Annual Report
 Schiphol Group Annual Report 2013 Business model Business model Schiphol Group distinguishes four core activities: Aviation, Consumer Products and Services, Real Estate, and Alliances and Participations.
Portfolio. income at ANZ income was up. With. first-half. share
 NZX and media announcement 19 February 2013 Precinct announces improvedi result and positive outlook Performance for six months to 31 December 2012 Financial Performance Net profit after tax: $23.6 millionn
Thank you for participating in the financial results for fiscal 2014.
 Thank you for participating in the financial results for fiscal 2014. ANA HOLDINGS strongly believes that safety is the most important principle of our air transportation business. The expansion of slots
Analyst Presentation Schiphol Group 2006 Interim Financial Results
 Analyst Presentation Schiphol Group 2006 Interim Financial Results 24 August 2006 Interim Results Disclaimer This release may contain certain forward-looking statements with respect to the financial condition,
Airways New Zealand Queenstown lights proposal Public submissions document
 Airways New Zealand Queenstown lights proposal 2014 Public submissions document Version 1.0 12 December, 2014 Contents 1 Introduction... 3 2 Purpose... 3 3 Air New Zealand Limited... 4 3.1 Proposed changes
JAPAN AIRLINES Co., Ltd. Financial Results 1 st Quarter Mar/2017(FY2016) July 29, 2016
 July 29, 2016") JAPAN AIRLINES Co., Ltd. Financial Results Mar/2017(FY2016) July 29, 2016 Today s Topics P.1 P.2 P.13 From the first quarter of this fiscal year, figures for Revenue Passengers Carried, ASK, RPK and Load
JAPAN AIRLINES Co., Ltd. Financial Results Mar/2017(FY2016) July 29, 2016 Today s Topics P.1 P.2 P.13 From the first quarter of this fiscal year, figures for Revenue Passengers Carried, ASK, RPK and Load
RESEARCH NOTE. Qantas Group Ltd Neutral
 1 RESEARCH NOTE Qantas Group Ltd Neutral Price: A$5.80 Price Target: A$6.17 ASX: QAN 18 September 2017 Myer Holdings (MYR) reported disappointing FY17 results and guided to a weak start to the FY18 year,
2003/04 Full Year Results Presentation to Investors
 2003/04 Full Year Results Presentation to Investors 19 August 2004 Geoff Dixon Chief Executive Officer Highlights 12 months to June 2004 12 months to June 2003 Increase/ (decrease) % Sales and operating
Copa Holdings Reports Net Income of $49.9 million and EPS of $1.18 for the Second Quarter of 2018
 Copa Holdings Reports Net Income of $49.9 million and EPS of $1.18 for the Second Quarter of 2018 Panama City, Panama --- Aug 8, 2018. Copa Holdings, S.A. (NYSE: CPA), today announced financial results
Air China Limited Interim Results. August Under IFRS
 Air China Limited 21 Interim Results Under IFRS August 21 1 Agenda 21 Interim Results Overview Business Overview Financial Overview Outlook 2 2 2 21 Interim Results 3 21 Interim Results Overview 4 4 4
OPERATING AND FINANCIAL HIGHLIGHTS. Subsequent Events
 Copa Holdings Reports Net Income of $103.8 million and EPS of $2.45 for the Third Quarter of 2017 Excluding special items, adjusted net income came in at $100.8 million, or EPS of $2.38 per share Panama
OPERATING AND FINANCIAL HIGHLIGHTS
 Copa Holdings Reports Financial Results for the Fourth Quarter of 2018 Excluding special items, adjusted net profit came in at $44.0 million, or Adjusted EPS of $1.04 Panama City, Panama --- February 13,
SIA ANALYST/MEDIA BRIEFING Q2 and 1H FY17/18 Results 8 November 2017
 SIA ANALYST/MEDIA BRIEFING Q2 and 1H FY17/18 Results 8 November 2017 THE PARENT AIRLINE Q2 AND 1H FY17/18 RESULTS THE PARENT AIRLINE COMPANY OPERATING PERFORMANCE Q2 % 1H % FY17/18 Change FY17/18 Change
QANTAS HALF YEAR 2015 FINANCIAL RESULTS 1
 QANTAS HALF YEAR 2015 FINANCIAL RESULTS 1 Key points: Underlying Profit Before Tax: $367 million Statutory Profit After Tax: $206 million Transformation benefits: $374 million Comparable unit cost reduction:
Media Release QANTAS RESULTS FOR THE HALF YEAR ENDED 31 DECEMBER 2004 HIGHLIGHTS. Fully franked interim dividend of 10 cents per share
 Media Release QANTAS RESULTS FOR THE HALF YEAR ENDED 31 DECEMBER 2004 HIGHLIGHTS Profit before tax of $601.3 million Net profit after tax of $458.4 million Revenue of $6.4 billion Fully franked interim
AIR NEW ZEALAND ANNUAL RESULTS ANNUAL RESULTS
 AIR NEW ZEALAND ANNUAL RESULTS 2008 1 HIGHLIGHTS Record operating revenue, up 9% Normalised earnings* $197m Net cash position of $1.3bn Launched direct service to Vancouver and Beijing Award winning product
FULL YEAR OPERATING PROFIT RISES TO $259 MILLION 25 CENTS SPECIAL DIVIDEND PROPOSED OUTLOOK REMAINS CHALLENGING
 8 May 2014 Page 1 of 5 No. 02/14 8 May 2014 FULL YEAR OPERATING PROFIT RISES TO $259 MILLION 25 CENTS SPECIAL DIVIDEND PROPOSED OUTLOOK REMAINS CHALLENGING GROUP FINANCIAL PERFORMANCE Financial Year 2013-14
OPERATING AND FINANCIAL HIGHLIGHTS. Subsequent Events
 Copa Holdings Reports Financial Results for the First Quarter of 2016 Excluding special items, adjusted net income came in at US$69.9 million, or EPS of US$1.66 per share Panama City, Panama --- May 5,
For personal use only
 HELLOWORLD ANNOUNCES RESULTS FOR THE YEAR ENDED 30 JUNE 2014 HIGHLIGHTS Total Transaction Value (TTV) of $4.9 billion Adjusted EBITDAI (1) of $40.6 million Loss before tax of $61.2 million includes the
PROFIT OF $1.24b ON STRONG REVENUE GAINS BUT FUEL COSTS REMAIN GREATEST CHALLENGE
 PROFIT OF $1.24b ON STRONG REVENUE GAINS BUT FUEL COSTS REMAIN GREATEST CHALLENGE HIGHLIGHTS OF THE GROUP S PERFORMANCE Financial Year 2005-06 4th Quarter 2005-06 Apr 2005 Mar 2006 Year-on-Year % Change
Analysts Briefing. 18 March Cathay Pacific Airways Limited
 Analysts Briefing 18 March 2015 Cathay Pacific Airways Limited Annual Results 2014 2013 Change Group attributable profit HK$m 3,150 2,620 +20.2% Group turnover HK$m 105,991 100,484 +5.5% Profit margin
Managing through disruption
 28 July 2016 Third quarter results for the three months ended 30 June 2016 Managing through disruption 3 months ended Like-for-like (ii) m (unless otherwise stated) Change 30 June 2016 30 June 2015 change
Santander 22 nd Annual Latin American Conference. Cancun, January 2018
 Santander 22 nd Annual Latin American Conference Cancun, January 2018 This presentation may include forward-looking comments regarding the Company s business outlook and anticipated financial and operating
FIRST QUARTER OPERATING PROFIT RISES TO $281 MILLION
 27 July 2017 Page 1 of 5 No. 03/17 27 July 2017 FIRST QUARTER OPERATING PROFIT RISES TO $281 MILLION Revenue improvement seen for all SIA Group airlines, but pressure on yields remains Earnings supported
RESULTS RELEASE 20 August GENTING HONG KONG GROUP ANNOUNCES FIRST HALF RESULTS FOR 2015 Highlights
 RESULTS RELEASE 20 August 2015 FOR IMMEDIATE RELEASE INTERNATIONAL GENTING HONG KONG GROUP ANNOUNCES FIRST HALF RESULTS FOR 2015 Highlights The commentary below is prepared based on a comparison of the
Qantas Airways Limited Alan Joyce, CEO Qantas Airways. Macquarie Australia Conference 3 May 2013
 Qantas Airways Limited Alan Joyce, CEO Qantas Airways Macquarie Australia Conference 3 May 2013 Qantas Group: April 2013 2 Delivering on the Group s Strategic Priorities Turning around Qantas International
Airport forecasting is used in master planning to guide future development of the Airport.
 Airport Forecasts Airport forecasting is used in master planning to guide future development of the Airport. 4.1 INTRODUCTION Airport forecasting ensures development is appropriate for passengers, ground
Analyst and Investor Conference Call Q Ulrik Svensson, CFO and Member of the Executive Board
 Analyst and Investor Conference Call Q2 2017 Ulrik Svensson, CFO and Member of the Executive Board Frankfurt, 2 August 2017 Disclaimer The information herein is based on publicly available information.
HIGH FUEL PRICES DRIVE HALF YEAR PROFIT DOWN 62% AMIDST CHALLENGING ENVIRONMENT
 3 November 2011 Page 1 of 4 No. 06/11 03 November 2011 HIGH FUEL PRICES DRIVE HALF YEAR PROFIT DOWN 62% AMIDST CHALLENGING ENVIRONMENT GROUP FINANCIAL PERFORMANCE First Half 2011-12 The Group made a net
Media Release l 20 February 2015
 Media Release l 20 February 2015 Auckland Airport announces strong interim result for 2015 financial year Auckland Airport has today announced its interim results for the six months to 31 December 2014.
Singapore Airlines Group Analyst/Media Briefing HALF YEAR FY RESULTS 5 NOVEMBER 2012 THE PARENT AIRLINE 1H FY2012/13 RESULTS
 Singapore Airlines Group Analyst/Media Briefing HALF YEAR FY2012-13 13 RESULTS 5 NOVEMBER 2012 THE PARENT AIRLINE 1H FY2012/13 RESULTS THE PARENT AIRLINE COMPANY RESULTS 2Q & 1H FY12/13 2Q/12 $million
Ramsay Health Care Limited Results Briefing Half Year ended 31 December 2018
 Ramsay Health Care Limited Results Briefing Half Year ended 31 December 2018 Craig McNally, Group Managing Director & Bruce Soden, Group Finance Director 28 February 2019 ramsayhealth.com Agenda Group
QANTAS ANNOUNCES PROFIT RESULT HALF-YEAR ENDED 31 DECEMBER 2009
 QANTAS ANNOUNCES PROFIT RESULT HALF-YEAR ENDED 31 DECEMBER 2009 HIGHLIGHTS TWO BRAND STRATEGY DELIVERS RESILIENCE AND CONTAINS COSTS Statutory Net Profit Before Tax of $90 million Underlying Profit Before
Finnair Group Interim Report 1 January 30 June 2008
 Finnair Group Interim Report 1 January 30 June 2008 1 08/08/2008 Presentation name / Author Airline industry at a historical turning point Fuel price has a stranglehold on the business Average ticket prices
Interim results. 11 May 2010
 Interim results 11 May 2010 Introduction Andy Harrison Chief Executive Officer Strong performance despite disruption Improvement in revenue, margins and cash Continued network improvement has driven better
Copa Holdings Reports Net Income of US$51.9 Million for the Fourth Quarter of 2008 and US$152.2 Million for Full Year 2008
 Copa Holdings Reports Net Income of US$51.9 Million for the Fourth Quarter of 2008 and US$152.2 Million for Full Year 2008 Panama City, Panama --- February 19, 2009. Copa Holdings, S.A. (NYSE: CPA), parent
Copa Holdings Reports Earnings of US$30.3 Million and EPS of US$0.70 for 3Q08
 Copa Holdings Reports Earnings of US$30.3 Million and EPS of US$0.70 for 3Q08 Panama City, Panama --- November 13, 2008. Copa Holdings, S.A. (NYSE: CPA), parent company of Copa Airlines and Aero Republica,
Tiger Airways Holdings Limited FY11 Results
 Tiger Airways Holdings Limited FY11 Results May 2011 Financial Year Ended 31 March 2011 Disclaimer The information contained in this presentation (the "Information") is provided by Tiger Airways Holdings
GATWICK AIRPORT LIMITED RESULTS FOR THE YEAR ENDED 31 MARCH 2014
 GATWICK AIRPORT LIMITED RESULTS FOR THE YEAR ENDED 31 MARCH 2014 OPERATIONAL AND FINANCIAL PERFORMANCE HIGHLIGHTS TRAFFIC GROWTH EBITDA GROWTH PROFIT FOR THE YEAR CAPITAL EXPENDITURE RAB* SENIOR NET DEBT*
Copa Holdings Reports Net Income of US$113.9 Million for the Fourth Quarter of 2013
 Copa Holdings Reports Net Income of US$113.9 Million for the Fourth Quarter of 2013 Panama City, Panama --- February 12, 2014. Copa Holdings, S.A. (NYSE: CPA), today announced financial results for the
The Qantas Group A Strong, Sustainable Future Alan Joyce, CEO Qantas Airways. Macquarie Australia Conference 4 May 2012
 The Qantas Group A Strong, Sustainable Future Alan Joyce, CEO Qantas Airways Macquarie Australia Conference 4 May 2012 Overview Fleet renewal now substantially complete FY13 capital expenditure reduced
CROWN ANNOUNCES 2010 FULL YEAR RESULTS
 ASX / MEDIA RELEASE FOR IMMEDIATE RELEASE 26 August 2010 CROWN ANNOUNCES 2010 FULL YEAR RESULTS MELBOURNE: Crown Limited (ASX: CWN) today announced its results for the full year ended 30 June 2010: Normalised
Finnair Group Interim Report 1 January 31 March 2008
 Finnair Group Interim Report 1 January 31 March 2008 1 29/04/2008 Presentation name / Author Outlook for the industry less positive Growth of demand declining due to uncertainty of global economy Growth
28 MARCH 2019 AIR NEW ZEALAND 2019 INTERIM RESULT
 28 MARCH 2019 Forward-looking statements This presentation contains forward-looking statements. Forward-looking statements often include words such as anticipate, expect, intend, plan, believe, continue
Copa Holdings Reports Net Income of $57.7 million and EPS of $1.36 for the Third Quarter of 2018
 Copa Holdings Reports Net Income of $57.7 million and EPS of $1.36 for the Third Quarter of 2018 November 14, 2018 PANAMA CITY, Nov. 14, 2018 /PRNewswire/ -- Copa Holdings, S.A. (NYSE: CPA), today announced
Investor Briefings First-Half FY2016 Financial Results
 Cedar Woods Properties Limited Investor Briefings First-Half FY2016 Financial Results 26 February 2016 Cedar Woods Presentation 2 Snapshot of Achievements in FY2016 Extensive portfolio of residential estates
CROWN ANNOUNCES 2014 FULL YEAR RESULTS. MELBOURNE: Crown Resorts Limited (ASX: CWN) today announced its results for the full year ended 30 June 2014:
 today announced its results for the full year ended 30 June 2014:") ASX / MEDIA RELEASE FOR IMMEDIATE RELEASE 14 August 2014 CROWN ANNOUNCES 2014 FULL YEAR RESULTS MELBOURNE: Crown Resorts Limited (ASX: CWN) today announced its results for the full year ended 30 : Crown
ASX / MEDIA RELEASE FOR IMMEDIATE RELEASE 14 August 2014 CROWN ANNOUNCES 2014 FULL YEAR RESULTS MELBOURNE: Crown Resorts Limited (ASX: CWN) today announced its results for the full year ended 30 : Crown
Analysts and Investors conference call. Q results. 15 May 2013
 Analysts and Investors conference call Q1 2013 results 15 May 2013 Management summary Key messages of Q1 2013 +6% +9% +3.3%p. Q1 2013 operational KPIs are in line with 109.7 116.2 6.5 7.1 82.3 85.6 expectations,
Air China Limited Announces 2009 Annual Results
 Air China Limited Announces 2009 Annual Results Record Operating Profit in Complex Market Environment Strengthened Position to Capture Growth Opportunities Hong Kong April 22, 2010 Air China Limited (
QANTAS RESULTS FOR THE HALF YEAR ENDED 31 DECEMBER 2005 HIGHLIGHTS
 Media Release QANTAS RESULTS FOR THE HALF YEAR ENDED 31 DECEMBER 2005 HIGHLIGHTS Profit before tax of $483.5 million Net profit after tax of $352.6 million Revenue of $6.8 billion Interim dividend of 11
Cathay Pacific Airways Interim Results for the six months ended 30 June 2012
 Cathay Pacific Airways Interim Results for the six months ended 30 June 2012 8 August 2012 1 Interim Result 1H2012 1H2011 Change Group attributable (loss) / profit HK$ million (935) 2,808-133.3% Group
Cathay Pacific Airways 2013 Analyst Briefing 25 June Cathay Pacific Airways Analyst Briefing 27 November 2013
 Cathay Pacific Airways 2013 Analyst Briefing 25 June 2013 Cathay Pacific Airways Analyst Briefing 27 November 2013 2013 Operating Performance to date: Passenger yield and load factor growth on lower ASKs.
Gatwick Airport Limited. Results for six months ended 30 September 2012
 Gatwick Airport Limited Results for six months ended 30 September 2012 28 November 2012 Operational and financial performance Highlights Traffic growth + 1.2% EBITDA + 4.8% Capital expenditure 119.1m Despite
Crown Limited Full Year. Results Presentation. 25 August 2011
 Crown Limited 2011 Full Year Results Presentation 25 August 2011 1 Crown Limited Overview Normalised 1 NPAT up 18.0% to $340.3 million, Reported NPAT $335.9 million, up 14.9% Australian casinos performance:
ANA HOLDINGS Financial Results for the Three Months Ended June 30, 2018
 ANA HOLDINGS NEWS ANA HOLDINGS Financial Results for the Three Months Ended June 30, 2018 TOKYO, July 31, 2018 ANA HOLDINGS INC. (hereinafter ANA HD ) today reports its financial results for the three
Financial Results 1 st Quarter Mar/2016 (FY2015) 30 July, 2015
 30 July, 2015") Financial Results Mar/2016 (FY2015) 30 July, 2015 Today s Topics P.2 P.3 P.15 1 Overview of FY Mar/2016 Financial Results Operating Revenue Operating Profit 320 307.0 +4.9Bn (+1.6%) 312.0 50 +17.6Bn (+94.6%)
Financial Results Mar/2016 (FY2015) 30 July, 2015 Today s Topics P.2 P.3 P.15 1 Overview of FY Mar/2016 Financial Results Operating Revenue Operating Profit 320 307.0 +4.9Bn (+1.6%) 312.0 50 +17.6Bn (+94.6%)
Management Presentation. November 2011
 Management Presentation November 2011 Forward looking statements This presentation as well as oral statements made by officers or directors of Allegiant Travel Company, its advisors and affiliates (collectively
2011 Full Year Result
 2011 Full Year Result 23 February 2012 CEO Brett Chenoweth CFO Peter Myers 1 Financial results for 2011 FY 2011 AUD millions 2011 2010 Δ% Revenue 1,072.4 1,059.1 1% EBITDA* 208.9 244.3 (14%) EBIT* 171.4