Essential Air Service Provide by Charter Air Transport (CAT docket #DOT-OST ) and Aviation Technologies, Inc. DBA Public Charters (P1)
|
|
|
- Ethel Carroll
- 5 years ago
- Views:
Transcription
 Dated: 08/17/2009 Docket DOT-OST-2006-23929; DOT-OST-2000-7881; DOT-OST-2003-14492 Introduction: CAT is a current Air Taxi Operator with a fleet of five 30 seat Turbo Prop")
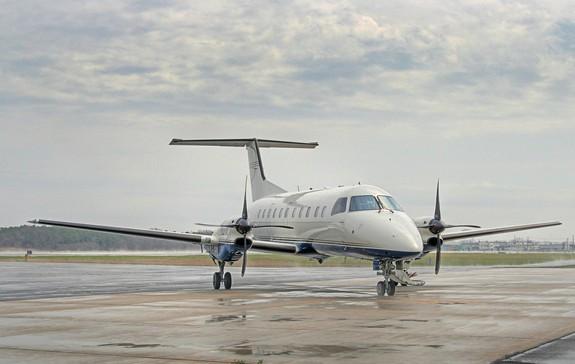
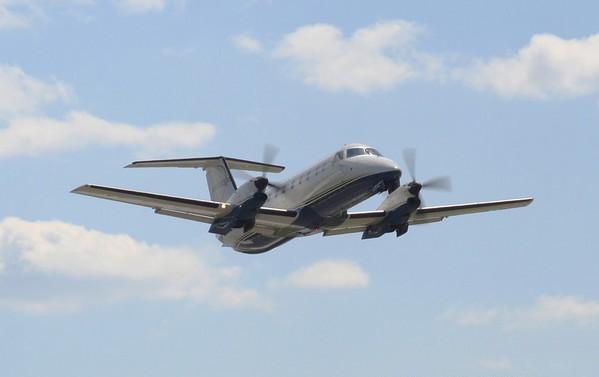
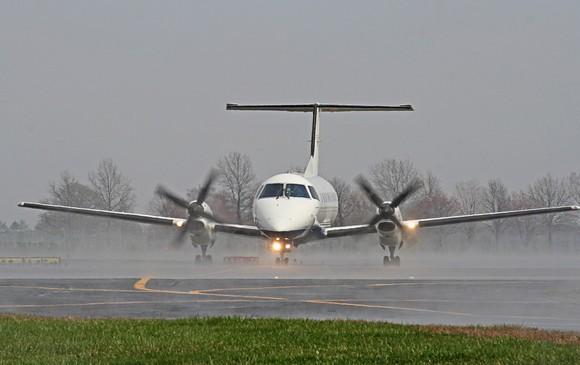
1 Essential Air Service Provide by Charter Air Transport (CAT docket #DOT-OST ) and Aviation Technologies, Inc. DBA Public Charters (P1) Dated: 08/17/2009 Docket DOT-OST ; DOT-OST ; DOT-OST Introduction: CAT is a current Air Taxi Operator with a fleet of five 30 seat Turbo Prop EMB-120 aircraft. CAT also operates aircraft including Hawker Jet, Citation, Beech Jet, and manages King Air- 200 equipment. CAT is an operator that truly provides the most flexibility within it s current fleet and expansion capabilities to operated aircraft and grow with each airport they serve. For the purposes of this proposal we will be identifying the Beech King Air -200 with an airliner conversion (CAT PASS) as the initial type equipment for the EAS communities. While we have the capabilities of operating and have and will consider alternate aircraft like the BAE- 3100/ 3200 (Jet Stream models); At this time; considering the current daily enplanements YTD; CAT and P1 will present the King Air-200 for consideration to the above Docket RFP. The airliner converted King Air -200 is a turbine powered 13 seat aircraft that provides comfort and reliability to each passenger on-board. It is equipped with Pratt and Whitney PT6A turbine engines with decades of experience. The aircraft continues to be a top seller in corporate aviation and with so many aircraft still in operation; there is no short supply of support, spares, or airworthy aircraft to maintain the proposed flight schedules presented for each community. Usually, In the event of scheduled or unscheduled maintenance; one can usually find a local King Air operator on most air fields with adequate back up support for our operations. Since an Air Taxi operator can operate into the same field up to 4x weekly; this expands our opportunity and reliability buy being able to sub-contract the same type aircraft without sacrificing any standard during planned and unplanned maintenance dates. In addition; CAT, has available several additional aircraft within their fleet to support our operations, boasting, that we will supply a 100 flight completion factor; except weather exceptions during the term of contract. P1 is an IATA certified GDS system that interfaces Operator inventory currently to Sabre and Amadeus GDS systems. These systems are commonly used by Travel Agencies worldwide and are the portal of sales for large clearing houses like Travelocity and Expedia. While the origin of P1 was designed for part 380 Public Charters; our technology enables us to distribute seat inventory for operators like CAT; seamlessly through the GDS systems by settling our sales through ARC. (Airline Reporting Company) We commonly file our flight inventory (additionally) through the Public Charter venue as an added means of distribution and security by directing all ticket sale revenue into a DOT certified escrow bank that is bonded and held until flight completion. This added layer is voluntary and in no means limits ticket sales, but actually enhances the distribution and security by both clearing sales into Escrow and being placed into our national distribution contacts with large wholesale clearing houses including Travelocity and Expedia. All flights appear with the information statement operated by Charter Air Transport 1
2 so that the public is ensured whom is the Operating Carrier for the Essential Air Service routes. P1 is a Internet based CRS system that will provide an Internet portal for ticket sales in addition to the GDS sales, coupled with both Travelocity and Expedia. We publish the CAT schedules with OAG and file fares with ATPCO for worldwide distribution and visibility. Incorporated into our CRS system is a Local DCS (Departure Control System) product for managing PNR Data (Passenger Name Record) and a complete baggage and ticketing system for a convenient check-in process. P1 is a certified E-Ticketing with both Sabre and Amadeus; and have plans to implement with Travelport (Worldspan) in the near future. This will enable our inventory to also be picked up by Orbitz and Price Line for additional distribution opportunities. We continue to work with several major airlines for Interline and Ticketing agreement, and are confident that; with our current business practices; that the travel experience will be practical, expeditious, and convenient for each passenger. Aviation Technologies, Inc.; as the Parent of P1, also offers some of the latest security technologies that are used for TSA screening including compliance with Secure Flight and CBP AQQ communication for International APIS transmissions. You can visit our security web-site at The combined partnership between CAT and P1 was designed to fit each market need; providing enhanced ticket sale distribution, along with being able to provide additional aircraft capacities in order to grow with each community we serve. Summary: CAT and P1 would like to face the challenge of providing service to EAS communities, mainly by identifying better, but more condensed schedules that serve a larger part of community traffic for O&D routes. While we continue to work on our Interlining agreement, getting passengers to their final destination conveniently and more efficiently has always been the goal. As an Internet based company; we are able to provide on-site check-in s with any connecting Carrier that permits Internet check-ins as part of their web-site services. Once we get the passengers delivered to the sterile gate areas; they would already have their connecting boarding cards and we would arrange a local transfer of baggage either directly to the gate or through a local baggage arrangement with each carrier. We use a color coded Disney style baggage coding for convenient recognition of interlined baggage both for out bound and inbound flight baggage retrieval. We require that each passenger keep these color coded tags attached to their bags for the duration of their travel and we offer additional bag tags for each passenger s convenience at check-in which are provided as part of the ticket jacket/ boarding card package that each passenger receives. Our aviation philosophy toward interlining is simple how can a connecting carrier NOT receive a passenger or a bag from someone travelling on their airline? We have been encouraged by carriers like Southwest Airlines; that if a passenger is carrying a Southwest Boarding card or has a Southwest ticket, they will be treated like a Southwest passenger. We think this should be true for all major airlines and also adhere that there are several regulations that expect carriers to accommodate interlining traffic for feeder service. One of our Mottos Go with Us so that we can Grow with You! Cat and P1 offer 2x daily service X6 for any EAS route that is up to 150 nautical miles point to pint from the origination city to the destination city. While we recognize that communities want more frequency and larger aircraft; the statistics and history have dictated that these routes need to be revamped and rebuilt to meet the true community need. We offer Prime Time departures and arrivals including an early morning departure and late afternoon departure to optimize both the O&D 2
3 and potential connecting passenger. Our tentative schedules are included in example for DEC, but will be subject to final gate and slot approval for each airport we serve. Our goal is to provide the community service to an airport that will provide the most vantage point for connecting into the National Transportation System at large. Pricing: ADD ON fares typically range for most carriers from local airport to hub at approximately $99 each way. * Note: This does not include the trend in recent surcharges that are imposed at the airport for baggage and convenience for many carriers. ** Note: CAT and P1 collect NO surcharges. Our goal is to provide $49 fares for most EAS communities; exceptions being only that of the higher congested hub airports including Chicago, New York, Los Angeles, St. Louis, and Atlanta. Fares for these airports would range to as high as $69 each way. Add On fares need to be priced moderately so that connecting passenger still receive a value in their travel experience by adding the low price Add On fare to the Thru Fare that they receive from the next connecting Carrier. It is our opinion that EAS subsidy money does two things; one: provides subsidy to help establish a Carrier and Route in a marketplace; and two: lowers your ticket price to be an advantageous Add On fare. These combined scenarios should optimize the travel experience and cost for each passenger. Currently CAT and P1 have been working with ORD and MDW for operational space and gate/slot availability. While we are not limited to operating into these airports; statistical analysis dictates that DEC would benefit with service to either Chicago airport. We understand that other communities may have preference or may rely on service to different hub airports. CAT and P1 will evaluate each city request individually with regard to the economic data that would support service into any hub airport that requests reasonable and due diligent service options for each community. With many EAS communities showing historical data with average daily enplanements of less that 6 passengers; it is difficult for us to offer higher daily frequencies with the larger 30 seat turbo prop aircraft. Remember our Motto, evaluate the various exhibits contained within this Response to service and please do not hesitate to contact Cat or P1 with any questions: Proposals Included: DEC-MDW-DEC, UIN-STL-UIN, MWA-STL-MWA DEC: Requested Subsidy year 1: $1,436,172 Requested Subsidy year 2: $1,394,436 MWA: Requested Subsidy year 1: $1,255,985 Requested Subsidy year 2: $1,224,528 UIN: Requested Subsidy year 1: $1,255,985 Requested Subsidy year 2: $1,224,528 For CAT: For P1: Peter Billman Jim Gallagher Phone: Phone: (EST) Fax: Fax: PBillman@CharterAirTransport.com JG727@aol.com See attached exhibits for schedule and pricing details 3
4 PublicCharters.com Lancaster, PA DOCKET DOT-OST /4 hour segment Non-Stop TurboProp Service Route Block Turbo-prop sevice w 13 seats DEC-MDW* 0.75 Start Date 12/01/ /30/2010 *MDW-DEC 0.75 Dual Pilot Daily Example Schedule Arrive Gateway Depart Aircraft based in Origination City DEC 6:00 AM * ORD may be substituted for MDW 6:45 AM *MDW 9:15 AM 10:00 AM DEC 12:00 PM 12:45 PM *MDW 3:00 PM 3:45 PM DEC Flat Rate fares $ PRO FORMA Pre-Flight Item DEC JAN FEB MAR APR MAY JUN JUL AUG SEP OCT NOV Year Total Operational weeks Days operated per week Aircraft Departures per week Departures per month Aircraft Block Hours Total Aircraft Block Hours Load Factor 50.0% 50.0% 50.0% 50.0% 50.0% 50.0% 60.0% 60.0% 60.0% 60.0% 60.0% 60.0% Seats Per Flight Passengers Per Flight Average Passenger Fare $69.00 $69.00 $69.00 $69.00 $69.00 $69.00 $69.00 $69.00 $69.00 $69.00 $69.00 $69.00 Total monthly passengers ,288 Passenger ticket revenue $49,846 $49,846 $49,846 $49,846 $49,846 $49,846 $56,966 $56,966 $56,966 $56,966 $56,966 $56, ,872 Less Credit card discount -$1,745 -$1,745 -$1,745 -$1,745 -$1,745 -$1,745 -$1,994 -$1,994 -$1,994 -$1,994 -$1,994 -$1,994 -$22, % -$3,738 -$3,738 -$3,738 -$3,738 -$3,738 -$3,738 -$4,272 -$4,272 -$4,272 -$4,272 -$4,272 -$4,272 -$48,065 Less travel agent commissions -$2,991 -$2,991 -$2,991 -$2,991 -$2,991 -$2,991 -$3,418 -$3,418 -$3,418 -$3,418 -$3,418 -$3,418 -$38,452 Total operating revenues $41,372 $41,372 $41,372 $41,372 $41,372 $41,372 $47,282 $47,282 $47,282 $47,282 $47,282 $47,282 $531,924 DIRECT OPERATING COST Aircraft (ACMI) $82,818 $82,818 $82,818 $82,818 $82,818 $82,818 $82,818 $82,818 $82,818 $82,818 $82,818 $82,818 $993,816 Aircraft fuel $24,381 $24,381 $24,381 $24,381 $24,381 $24,381 $24,381 $24,381 $24,381 $24,381 $24,381 $24,381 $292,572 Aircraft - airport turn expenses $36,120 $36,120 $36,120 $36,120 $36,120 $36,120 $36,120 $36,120 $36,120 $36,120 $36,120 $36,120 $433,440 Catering $722 $722 $722 $722 $722 $722 $826 $826 $826 $826 $826 $826 $9,288 Total Direct Operating Cost $144,041 $144,041 $144,041 $144,041 $144,041 $144,041 $144,145 $144,145 $144,145 $144,145 $144,145 $144,145 $1,729,116 Indirect Operating Cost Advertising $1,805 $1,805 $1,805 $1,805 $1,805 $1,805 $2,065 $2,065 $2,065 $2,065 $2,065 $2,065 $23,220 Reservations $14,440 $14,440 $14,440 $14,440 $14,440 $14,440 $16,520 $16,520 $16,520 $16,520 $16,520 $16,520 $185,760 Miscellaneous, $ 2,500 $ 2,500 $ 2,500 $ 2,500 $ 2,500 $ 2,500 $ 2,500 $ 2,500 $ 2,500 $ 2,500 $ 2,500 $ 2,500 $30,000 Total Indirect Operating Cost $18,745 $18,745 $18,745 $18,745 $18,745 $18,745 $21,085 $21,085 $21,085 $21,085 $21,085 $21,085 $238,980 TOTAL OPERATING COST $162,786 $162,786 $162,786 $162,786 $162,786 $162,786 $165,230 $165,230 $165,230 $165,230 $165,230 $165,230 $1,968,096 OPERATING PROFIT (LOSS) ($121,414) ($121,414) ($121,414) ($121,414) ($121,414) ($121,414) ($117,948) ($117,948) ($117,948) ($117,948) ($117,948) ($117,948) ($1,436,172) Cumulative P/L $ (121,414) $ (242,828) $ (242,828) $ (242,828) $ (242,828) $ (242,828) $ (239,362) $ (235,896) $ (235,896) $ (235,896) $ (235,896) $ (235,896) Cost per departure $1,577 $1,577 $1,577 $1,577 $1,577 $1,577 $1,601 $1,601 $1,601 $1,601 $1,601 $1,601 Revenue per departure $401 $401 $401 $401 $401 $401 $458 $458 $458 $458 $458 $458 ACMI rate $ 1,070 Destination Airport/ Ground Fees $ 350 Origination Airport/ Parking / Ground Fees $ 350 Fuel burn/hour $ 105 Fuel price/gallon $ 3.00 Advertising per passenger (r/t) $ 3 Credit card discount Percent travel agent sales 60% Block hours each segment 0.75 Catering - per pax $ 1.00 Departures per week (r/t) 18 Reservation cost/segment $ Seats per flight 13
5 3/4 hour segment Non-Stop TurboProp Service Route Block Turbo-porp sevice w 13 seats DEC-MDW* 0.75 Start Date 12/01/ /30/2011 *MDW-DEC 0.75 Dual Pilot Daily Example Schedule Arrive Gateway Depart Aircraft based in Origination City DEC 6:00 AM * ORD may be substituted for MDW 6:45 AM *MDW 9:15 AM 10:00 AM DEC 12:00 PM 12:45 PM *MDW 3:00 PM 3:45 PM DEC Flat Rate fares $ PRO FORMA Pre-Flight Item DEC JAN FEB MAR APR MAY JUN JUL AUG SEP OCT NOV Year Total Operational weeks Days operated per week Aircraft Departures per week Departures per month Aircraft Block Hours Total Aircraft Block Hours Load Factor 60.0% 60.0% 60.0% 60.0% 60.0% 60.0% 70.0% 70.0% 70.0% 70.0% 70.0% 70.0% Seats Per Flight Passengers Per Flight Average Passenger Fare $69.00 $69.00 $69.00 $69.00 $69.00 $69.00 $69.00 $69.00 $69.00 $69.00 $69.00 $69.00 Total monthly passengers ,530 Passenger ticket revenue $56,966 $56,966 $56,966 $56,966 $56,966 $56,966 $64,087 $64,087 $64,087 $64,087 $64,087 $64, ,322 Less Credit card discount -$1,994 -$1,994 -$1,994 -$1,994 -$1,994 -$1,994 -$2,243 -$2,243 -$2,243 -$2,243 -$2,243 -$2,243 -$25, % -$4,272 -$4,272 -$4,272 -$4,272 -$4,272 -$4,272 -$4,807 -$4,807 -$4,807 -$4,807 -$4,807 -$4,807 -$54,474 Less travel agent commissions -$3,418 -$3,418 -$3,418 -$3,418 -$3,418 -$3,418 -$3,845 -$3,845 -$3,845 -$3,845 -$3,845 -$3,845 -$43,579 Total operating revenues $47,282 $47,282 $47,282 $47,282 $47,282 $47,282 $53,192 $53,192 $53,192 $53,192 $53,192 $53,192 $602,847 DIRECT OPERATING COST Aircraft (ACMI) $82,818 $82,818 $82,818 $82,818 $82,818 $82,818 $82,818 $82,818 $82,818 $82,818 $82,818 $82,818 $993,816 Aircraft fuel $24,381 $24,381 $24,381 $24,381 $24,381 $24,381 $24,381 $24,381 $24,381 $24,381 $24,381 $24,381 $292,572 Aircraft - airport turn expenses $36,120 $36,120 $36,120 $36,120 $36,120 $36,120 $36,120 $36,120 $36,120 $36,120 $36,120 $36,120 $433,440 Catering $826 $826 $826 $826 $826 $826 $929 $929 $929 $929 $929 $929 $10,530 Total Direct Operating Cost $144,145 $144,145 $144,145 $144,145 $144,145 $144,145 $144,248 $144,248 $144,248 $144,248 $144,248 $144,248 $1,730,358 Indirect Operating Cost Advertising $2,065 $2,065 $2,065 $2,065 $2,065 $2,065 $2,323 $2,323 $2,323 $2,323 $2,323 $2,323 $26,325 Reservations $16,520 $16,520 $16,520 $16,520 $16,520 $16,520 $18,580 $18,580 $18,580 $18,580 $18,580 $18,580 $210,600 Miscellaneous, $ 2,500 $ 2,500 $ 2,500 $ 2,500 $ 2,500 $ 2,500 $ 2,500 $ 2,500 $ 2,500 $ 2,500 $ 2,500 $ 2,500 $30,000 Total Indirect Operating Cost $21,085 $21,085 $21,085 $21,085 $21,085 $21,085 $23,403 $23,403 $23,403 $23,403 $23,403 $23,403 $266,925 TOTAL OPERATING COST $165,230 $165,230 $165,230 $165,230 $165,230 $165,230 $167,651 $167,651 $167,651 $167,651 $167,651 $167,651 $1,997,283 OPERATING PROFIT (LOSS) ($117,948) ($117,948) ($117,948) ($117,948) ($117,948) ($117,948) ($114,458) ($114,458) ($114,458) ($114,458) ($114,458) ($114,458) ($1,394,436) Cumulative P/L $ (117,948) $ (235,896) $ (235,896) $ (235,896) $ (235,896) $ (235,896) $ (232,406) $ (228,916) $ (228,916) $ (228,916) $ (228,916) $ (228,916) Cost per departure $1,601 $1,601 $1,601 $1,601 $1,601 $1,601 $1,625 $1,625 $1,625 $1,625 $1,625 $1,625 Revenue per departure $458 $458 $458 $458 $458 $458 $515 $515 $515 $515 $515 $515 ACMI rate $ 1,070 Destination Airport/ Ground Fees $ 350 Origination Airport/ Parking / Ground Fees $ 350 Fuel burn/hour $ 105 Fuel price/gallon $ 3.00 Advertising per passenger (r/t) $ 3 Credit card discount Percent travel agent sales 60% Block hours each segment 0.75 Catering - per pax $ 1.00 Departures per week (r/t) 18 Reservation cost/segment $ Seats per flight 13
6 .7 hour segment Non-Stop Turboprop Service Route Block Turbo-prop sevice w 13 seats UIN-STL 0.7 Start Date 12/01/ /30/2010 STL-UIN 0.7 Dual Pilot Daily Example Schedule Arrive Gateway Depart Aircraft based in Origination City UIN 6:00 AM 6:40 AM STL 10:00 AM 10:40 AM UIN 2:00 PM 2:40 PM STL 5:00 PM 5:40 PM UIN Flat Rate fares $ PRO FORMA Pre-Flight Item DEC JAN FEB MAR APR MAY JUN JUL AUG SEP OCT NOV Year Total Operational weeks Days operated per week Aircraft Departures per week Departures per month Aircraft Block Hours Total Aircraft Block Hours Load Factor 50.0% 50.0% 50.0% 50.0% 50.0% 50.0% 60.0% 60.0% 60.0% 60.0% 60.0% 60.0% Seats Per Flight Passengers Per Flight Average Passenger Fare $59.00 $59.00 $59.00 $59.00 $59.00 $59.00 $59.00 $59.00 $59.00 $59.00 $59.00 $59.00 Total monthly passengers ,288 Passenger ticket revenue $42,622 $42,622 $42,622 $42,622 $42,622 $42,622 $48,710 $48,710 $48,710 $48,710 $48,710 $48, ,992 Less Credit card discount -$1,492 -$1,492 -$1,492 -$1,492 -$1,492 -$1,492 -$1,705 -$1,705 -$1,705 -$1,705 -$1,705 -$1,705 -$19, % -$3,197 -$3,197 -$3,197 -$3,197 -$3,197 -$3,197 -$3,653 -$3,653 -$3,653 -$3,653 -$3,653 -$3,653 -$41,099 Less travel agent commissions -$2,557 -$2,557 -$2,557 -$2,557 -$2,557 -$2,557 -$2,923 -$2,923 -$2,923 -$2,923 -$2,923 -$2,923 -$32,880 Total operating revenues $35,376 $35,376 $35,376 $35,376 $35,376 $35,376 $40,430 $40,430 $40,430 $40,430 $40,430 $40,430 $454,833 DIRECT OPERATING COST Aircraft (ACMI) $66,254 $66,254 $66,254 $66,254 $66,254 $66,254 $66,254 $66,254 $66,254 $66,254 $66,254 $66,254 $795,053 Aircraft fuel $19,505 $19,505 $19,505 $19,505 $19,505 $19,505 $19,505 $19,505 $19,505 $19,505 $19,505 $19,505 $234,058 Aircraft - airport turn expenses $36,120 $36,120 $36,120 $36,120 $36,120 $36,120 $36,120 $36,120 $36,120 $36,120 $36,120 $36,120 $433,440 Catering $722 $722 $722 $722 $722 $722 $826 $826 $826 $826 $826 $826 $9,288 Total Direct Operating Cost $122,601 $122,601 $122,601 $122,601 $122,601 $122,601 $122,705 $122,705 $122,705 $122,705 $122,705 $122,705 $1,471,838 Indirect Operating Cost Advertising $1,805 $1,805 $1,805 $1,805 $1,805 $1,805 $2,065 $2,065 $2,065 $2,065 $2,065 $2,065 $23,220 Reservations $14,440 $14,440 $14,440 $14,440 $14,440 $14,440 $16,520 $16,520 $16,520 $16,520 $16,520 $16,520 $185,760 Miscellaneous, $ 2,500 $ 2,500 $ 2,500 $ 2,500 $ 2,500 $ 2,500 $ 2,500 $ 2,500 $ 2,500 $ 2,500 $ 2,500 $ 2,500 $30,000 Total Indirect Operating Cost $18,745 $18,745 $18,745 $18,745 $18,745 $18,745 $21,085 $21,085 $21,085 $21,085 $21,085 $21,085 $238,980 TOTAL OPERATING COST $141,346 $141,346 $141,346 $141,346 $141,346 $141,346 $143,790 $143,790 $143,790 $143,790 $143,790 $143,790 $1,710,818 OPERATING PROFIT (LOSS) ($105,970) ($105,970) ($105,970) ($105,970) ($105,970) ($105,970) ($103,361) ($103,361) ($103,361) ($103,361) ($103,361) ($103,361) ($1,255,985) Cumulative P/L $ (105,970) $ (211,941) $ (211,941) $ (211,941) $ (211,941) $ (211,941) $ (209,331) $ (206,721) $ (206,721) $ (206,721) $ (206,721) $ (206,721) Cost per departure $1,370 $1,370 $1,370 $1,370 $1,370 $1,370 $1,393 $1,393 $1,393 $1,393 $1,393 $1,393 Revenue per departure $343 $343 $343 $343 $343 $343 $392 $392 $392 $392 $392 $392 ACMI rate $ 1,070 Destination Airport/ Ground Fees $ 350 Origination Airport/ Parking / Ground Fees $ 350 Fuel burn/hour $ 105 Fuel price/gallon $ 3.00 Advertising per passenger (r/t) $ 3 Credit card discount Percent travel agent sales 60% Block hours each segment 0.75 Catering - per pax $ 1.00 Departures per week (r/t) 18 Reservation cost/segment $ Seats per flight 13
7 .7 hour segment Non-Stop TurboProp Service Route Block Turbo-prop sevice w 13 seats UIN-STL 0.7 Start Date 12/01/ /30/2010 STL-UIN 0.7 Dual Pilot Daily Example Schedule Arrive Gateway Depart Aircraft based in Origination City UIN 6:00 AM 6:40 AM STL 10:00 AM 10:40 AM UIN 2:00 PM 2:40 PM STL 5:00 PM 5:40 PM UIN Flat Rate fares $ PRO FORMA Pre-Flight Item DEC JAN FEB MAR APR MAY JUN JUL AUG SEP OCT NOV Year Total Operational weeks Days operated per week Aircraft Departures per week Departures per month Aircraft Block Hours Total Aircraft Block Hours Load Factor 60.0% 60.0% 60.0% 60.0% 60.0% 60.0% 70.0% 70.0% 70.0% 70.0% 70.0% 70.0% Seats Per Flight Passengers Per Flight Average Passenger Fare $59.00 $59.00 $59.00 $59.00 $59.00 $59.00 $59.00 $59.00 $59.00 $59.00 $59.00 $59.00 Total monthly passengers ,530 Passenger ticket revenue $48,710 $48,710 $48,710 $48,710 $48,710 $48,710 $54,799 $54,799 $54,799 $54,799 $54,799 $54, ,058 Less Credit card discount -$1,705 -$1,705 -$1,705 -$1,705 -$1,705 -$1,705 -$1,918 -$1,918 -$1,918 -$1,918 -$1,918 -$1,918 -$21, % -$3,653 -$3,653 -$3,653 -$3,653 -$3,653 -$3,653 -$4,110 -$4,110 -$4,110 -$4,110 -$4,110 -$4,110 -$46,579 Less travel agent commissions -$2,923 -$2,923 -$2,923 -$2,923 -$2,923 -$2,923 -$3,288 -$3,288 -$3,288 -$3,288 -$3,288 -$3,288 -$37,263 Total operating revenues $40,430 $40,430 $40,430 $40,430 $40,430 $40,430 $45,483 $45,483 $45,483 $45,483 $45,483 $45,483 $515,478 DIRECT OPERATING COST Aircraft (ACMI) $66,254 $66,254 $66,254 $66,254 $66,254 $66,254 $66,254 $66,254 $66,254 $66,254 $66,254 $66,254 $795,053 Aircraft fuel $19,505 $19,505 $19,505 $19,505 $19,505 $19,505 $19,505 $19,505 $19,505 $19,505 $19,505 $19,505 $234,058 Aircraft - airport turn expenses $36,120 $36,120 $36,120 $36,120 $36,120 $36,120 $36,120 $36,120 $36,120 $36,120 $36,120 $36,120 $433,440 Catering $826 $826 $826 $826 $826 $826 $929 $929 $929 $929 $929 $929 $10,530 Total Direct Operating Cost $122,705 $122,705 $122,705 $122,705 $122,705 $122,705 $122,808 $122,808 $122,808 $122,808 $122,808 $122,808 $1,473,080 Indirect Operating Cost Advertising $2,065 $2,065 $2,065 $2,065 $2,065 $2,065 $2,323 $2,323 $2,323 $2,323 $2,323 $2,323 $26,325 Reservations $16,520 $16,520 $16,520 $16,520 $16,520 $16,520 $18,580 $18,580 $18,580 $18,580 $18,580 $18,580 $210,600 Miscellaneous, $ 2,500 $ 2,500 $ 2,500 $ 2,500 $ 2,500 $ 2,500 $ 2,500 $ 2,500 $ 2,500 $ 2,500 $ 2,500 $ 2,500 $30,000 Total Indirect Operating Cost $21,085 $21,085 $21,085 $21,085 $21,085 $21,085 $23,403 $23,403 $23,403 $23,403 $23,403 $23,403 $266,925 TOTAL OPERATING COST $143,790 $143,790 $143,790 $143,790 $143,790 $143,790 $146,211 $146,211 $146,211 $146,211 $146,211 $146,211 $1,740,005 OPERATING PROFIT (LOSS) ($103,361) ($103,361) ($103,361) ($103,361) ($103,361) ($103,361) ($100,727) ($100,727) ($100,727) ($100,727) ($100,727) ($100,727) ($1,224,528) Cumulative P/L $ (103,361) $ (206,721) $ (206,721) $ (206,721) $ (206,721) $ (206,721) $ (204,088) $ (201,455) $ (201,455) $ (201,455) $ (201,455) $ (201,455) Cost per departure $1,393 $1,393 $1,393 $1,393 $1,393 $1,393 $1,417 $1,417 $1,417 $1,417 $1,417 $1,417 Revenue per departure $392 $392 $392 $392 $392 $392 $441 $441 $441 $441 $441 $441 ACMI rate $ 1,070 Destination Airport/ Ground Fees $ 350 Origination Airport/ Parking / Ground Fees $ 350 Fuel burn/hour $ 105 Fuel price/gallon $ 3.00 Advertising per passenger (r/t) $ 3 Credit card discount Percent travel agent sales 60% Block hours each segment 0.75 Catering - per pax $ 1.00 Departures per week (r/t) 18 Reservation cost/segment $ Seats per flight 13
8 .7 hour segment Non-Stop TurboProp Service Route Block Turbo-prop sevice w 13 seats MWA-STL 0.7 Start Date 12/01/ /30/2010 STL-MWA 0.7 Dual Pilot Daily Example Schedule Arrive Gateway Depart Aircraft based in Origination City MWA 6:00 AM 6:40 AM STL 10:00 AM 10:40 AM MWA 2:00 PM 2:40 PM STL 5:00 PM 5:40 PM MWA Flat Rate fares $ PRO FORMA Pre-Flight Item DEC JAN FEB MAR APR MAY JUN JUL AUG SEP OCT NOV Year Total Operational weeks Days operated per week Aircraft Departures per week Departures per month Aircraft Block Hours Total Aircraft Block Hours Load Factor 50.0% 50.0% 50.0% 50.0% 50.0% 50.0% 60.0% 60.0% 60.0% 60.0% 60.0% 60.0% Seats Per Flight Passengers Per Flight Average Passenger Fare $59.00 $59.00 $59.00 $59.00 $59.00 $59.00 $59.00 $59.00 $59.00 $59.00 $59.00 $59.00 Total monthly passengers ,288 Passenger ticket revenue $42,622 $42,622 $42,622 $42,622 $42,622 $42,622 $48,710 $48,710 $48,710 $48,710 $48,710 $48, ,992 Less Credit card discount -$1,492 -$1,492 -$1,492 -$1,492 -$1,492 -$1,492 -$1,705 -$1,705 -$1,705 -$1,705 -$1,705 -$1,705 -$19, % -$3,197 -$3,197 -$3,197 -$3,197 -$3,197 -$3,197 -$3,653 -$3,653 -$3,653 -$3,653 -$3,653 -$3,653 -$41,099 Less travel agent commissions -$2,557 -$2,557 -$2,557 -$2,557 -$2,557 -$2,557 -$2,923 -$2,923 -$2,923 -$2,923 -$2,923 -$2,923 -$32,880 Total operating revenues $35,376 $35,376 $35,376 $35,376 $35,376 $35,376 $40,430 $40,430 $40,430 $40,430 $40,430 $40,430 $454,833 DIRECT OPERATING COST Aircraft (ACMI) $66,254 $66,254 $66,254 $66,254 $66,254 $66,254 $66,254 $66,254 $66,254 $66,254 $66,254 $66,254 $795,053 Aircraft fuel $19,505 $19,505 $19,505 $19,505 $19,505 $19,505 $19,505 $19,505 $19,505 $19,505 $19,505 $19,505 $234,058 Aircraft - airport turn expenses $36,120 $36,120 $36,120 $36,120 $36,120 $36,120 $36,120 $36,120 $36,120 $36,120 $36,120 $36,120 $433,440 Catering $722 $722 $722 $722 $722 $722 $826 $826 $826 $826 $826 $826 $9,288 Total Direct Operating Cost $122,601 $122,601 $122,601 $122,601 $122,601 $122,601 $122,705 $122,705 $122,705 $122,705 $122,705 $122,705 $1,471,838 Indirect Operating Cost Advertising $1,805 $1,805 $1,805 $1,805 $1,805 $1,805 $2,065 $2,065 $2,065 $2,065 $2,065 $2,065 $23,220 Reservations $14,440 $14,440 $14,440 $14,440 $14,440 $14,440 $16,520 $16,520 $16,520 $16,520 $16,520 $16,520 $185,760 Miscellaneous, $ 2,500 $ 2,500 $ 2,500 $ 2,500 $ 2,500 $ 2,500 $ 2,500 $ 2,500 $ 2,500 $ 2,500 $ 2,500 $ 2,500 $30,000 Total Indirect Operating Cost $18,745 $18,745 $18,745 $18,745 $18,745 $18,745 $21,085 $21,085 $21,085 $21,085 $21,085 $21,085 $238,980 TOTAL OPERATING COST $141,346 $141,346 $141,346 $141,346 $141,346 $141,346 $143,790 $143,790 $143,790 $143,790 $143,790 $143,790 $1,710,818 OPERATING PROFIT (LOSS) ($105,970) ($105,970) ($105,970) ($105,970) ($105,970) ($105,970) ($103,361) ($103,361) ($103,361) ($103,361) ($103,361) ($103,361) ($1,255,985) Cumulative P/L $ (105,970) $ (211,941) $ (211,941) $ (211,941) $ (211,941) $ (211,941) $ (209,331) $ (206,721) $ (206,721) $ (206,721) $ (206,721) $ (206,721) Cost per departure $1,370 $1,370 $1,370 $1,370 $1,370 $1,370 $1,393 $1,393 $1,393 $1,393 $1,393 $1,393 Revenue per departure $343 $343 $343 $343 $343 $343 $392 $392 $392 $392 $392 $392 ACMI rate $ 1,070 Destination Airport/ Ground Fees $ 350 Origination Airport/ Parking / Ground Fees $ 350 Fuel burn/hour $ 105 Fuel price/gallon $ 3.00 Advertising per passenger (r/t) $ 3 Credit card discount Percent travel agent sales 60% Block hours each segment 0.75 Catering - per pax $ 1.00 Departures per week (r/t) 18 Reservation cost/segment $ Seats per flight 13
9 .7 hour segment Non-Stop TurboProp Service Route Block Turbo-prop sevice w 13 seats MWA-STL 0.7 Start Date 12/01/ /30/2010 STL-MWA 0.7 Dual Pilot Daily Example Schedule Arrive Gateway Depart Aircraft based in Origination City MWA 6:00 AM 6:40 AM STL 10:00 AM 10:40 AM MWA 2:00 PM 2:40 PM STL 5:00 PM 5:40 PM MWA Flat Rate fares $ PRO FORMA Pre-Flight Item DEC JAN FEB MAR APR MAY JUN JUL AUG SEP OCT NOV Year Total Operational weeks Days operated per week Aircraft Departures per week Departures per month Aircraft Block Hours Total Aircraft Block Hours Load Factor 60.0% 60.0% 60.0% 60.0% 60.0% 60.0% 70.0% 70.0% 70.0% 70.0% 70.0% 70.0% Seats Per Flight Passengers Per Flight Average Passenger Fare $59.00 $59.00 $59.00 $59.00 $59.00 $59.00 $59.00 $59.00 $59.00 $59.00 $59.00 $59.00 Total monthly passengers ,530 Passenger ticket revenue $48,710 $48,710 $48,710 $48,710 $48,710 $48,710 $54,799 $54,799 $54,799 $54,799 $54,799 $54, ,058 Less Credit card discount -$1,705 -$1,705 -$1,705 -$1,705 -$1,705 -$1,705 -$1,918 -$1,918 -$1,918 -$1,918 -$1,918 -$1,918 -$21, % -$3,653 -$3,653 -$3,653 -$3,653 -$3,653 -$3,653 -$4,110 -$4,110 -$4,110 -$4,110 -$4,110 -$4,110 -$46,579 Less travel agent commissions -$2,923 -$2,923 -$2,923 -$2,923 -$2,923 -$2,923 -$3,288 -$3,288 -$3,288 -$3,288 -$3,288 -$3,288 -$37,263 Total operating revenues $40,430 $40,430 $40,430 $40,430 $40,430 $40,430 $45,483 $45,483 $45,483 $45,483 $45,483 $45,483 $515,478 DIRECT OPERATING COST Aircraft (ACMI) $66,254 $66,254 $66,254 $66,254 $66,254 $66,254 $66,254 $66,254 $66,254 $66,254 $66,254 $66,254 $795,053 Aircraft fuel $19,505 $19,505 $19,505 $19,505 $19,505 $19,505 $19,505 $19,505 $19,505 $19,505 $19,505 $19,505 $234,058 Aircraft - airport turn expenses $36,120 $36,120 $36,120 $36,120 $36,120 $36,120 $36,120 $36,120 $36,120 $36,120 $36,120 $36,120 $433,440 Catering $826 $826 $826 $826 $826 $826 $929 $929 $929 $929 $929 $929 $10,530 Total Direct Operating Cost $122,705 $122,705 $122,705 $122,705 $122,705 $122,705 $122,808 $122,808 $122,808 $122,808 $122,808 $122,808 $1,473,080 Indirect Operating Cost Advertising $2,065 $2,065 $2,065 $2,065 $2,065 $2,065 $2,323 $2,323 $2,323 $2,323 $2,323 $2,323 $26,325 Reservations $16,520 $16,520 $16,520 $16,520 $16,520 $16,520 $18,580 $18,580 $18,580 $18,580 $18,580 $18,580 $210,600 Miscellaneous, $ 2,500 $ 2,500 $ 2,500 $ 2,500 $ 2,500 $ 2,500 $ 2,500 $ 2,500 $ 2,500 $ 2,500 $ 2,500 $ 2,500 $30,000 Total Indirect Operating Cost $21,085 $21,085 $21,085 $21,085 $21,085 $21,085 $23,403 $23,403 $23,403 $23,403 $23,403 $23,403 $266,925 TOTAL OPERATING COST $143,790 $143,790 $143,790 $143,790 $143,790 $143,790 $146,211 $146,211 $146,211 $146,211 $146,211 $146,211 $1,740,005 OPERATING PROFIT (LOSS) ($103,361) ($103,361) ($103,361) ($103,361) ($103,361) ($103,361) ($100,727) ($100,727) ($100,727) ($100,727) ($100,727) ($100,727) ($1,224,528) Cumulative P/L $ (103,361) $ (206,721) $ (206,721) $ (206,721) $ (206,721) $ (206,721) $ (204,088) $ (201,455) $ (201,455) $ (201,455) $ (201,455) $ (201,455) Cost per departure $1,393 $1,393 $1,393 $1,393 $1,393 $1,393 $1,417 $1,417 $1,417 $1,417 $1,417 $1,417 Revenue per departure $392 $392 $392 $392 $392 $392 $441 $441 $441 $441 $441 $441 ACMI rate $ 1,070 Destination Airport/ Ground Fees $ 350 Origination Airport/ Parking / Ground Fees $ 350 Fuel burn/hour $ 105 Fuel price/gallon $ 3.00 Advertising per passenger (r/t) $ 3 Credit card discount Percent travel agent sales 60% Block hours each segment 0.75 Catering - per pax $ 1.00 Departures per week (r/t) 18 Reservation cost/segment $ Seats per flight 13

10 Charter Air Transport, Inc. Overview October 2008 Air Carrier Certificate #GNOA005I

11 CAT Offers the Best Value With Charter Air Transport (CAT), you travel faster with fewer hassles enjoying the same level of service as the most elite private aircraft customers! CAT delivers exceptional customer service to all travelers!

12 CAT Gives You Faster Door-to-Door Travel Times CAT flies the Embraer EMB-120ER ADVANCED Brasilia Aircraft: 300 mph standard cruise; 345 mph fast cruise speeds Consumes approximately 180 gallons of fuel on a 1-hour flight 5,100 foot average runway take-off requirement CAT s operations of the Brasilia are covered under the TSA s Twelve-Five Standard Security Program, resulting in fewer mandatory security screening burdens CAT can bring travelers in and out of executive airports, greatly reducing door-todoor travel times and eliminating many hassles for passengers and crews, coupled with lower fuel and ground support costs! CAT s Brasilias are Fast and Fuel Efficient!

13 CAT Transports You in Comfortable, Well-Maintained Airliners 30-seat passenger interiors 2006/7 new exterior paint and interior improvements 5 9 Cabin Height Cargo hold can accommodate 222 cubic feet/ 1,200 pounds of baggage Galley for hot + cold beverages and snacks $200,000,000 liability insurance standard Professional Flight Attendant on every trip! CAT s Brasilia Fleet Features Leather Reclining Passenger Seats
14 You Can Have CAT s Aircraft When and Where You Want Them CAT s Brasilia Fleet is Focused on the Northeastern USA: Major operations base at Republic Airport Farmingdale, NY (2 Brasilias at this location on most days) 4 Brasilias in service today Able to quickly expand our fleet to meet growing demand CAT has both forward galley aircraft and aft galley aircraft

15 CAT s Brasilias Can Fly Non-Stop to Many of Your Destinations Less than 1 Hour Flight Time to: Boston, Philadelphia, Washington, D.C. 1.5 Hours Flight Time to: Toronto, Richmond, VA Pittsburgh Farmingdale 2 Hours* Flight Time to: Columbus, OH, Winston-Salem, NC *Flights 2 hours and longer may require load factors below 80% or fuel stops
16 CAT s People Deliver the Best Service CAT has been awarded a GOLD rating by ARG/US! See our profile at: CAT s President/CEO spent 15 years as Chief Pilot for Standard Oil/BP and is an expert in delivering the level of customer service demanded by the executives of giant multi-national corporations. CAT s Director of Operations is the former Chief Pilot of Comair Airlines. CAT s Chief Maintenance Inspector is a former Embraer factory engineer who supported the EMB-120 program in the USA for 15 years. CAT s Brasilia Captains average over 9,100 hours of total flight time and over 1,200 hours time in type! CAT s Director of Charter Sales and Marketing brings great talents and abilities to enhance the business model with ethical standards and excellent customer service.
17


18 CAT is Your One-Stop Resource for Aviation Services Business Jet Charter Sales of Scheduled Charter Flights By the Seat (Provided through our affiliate, Destination One, LLC USDOT Public Charter # PC06-088) Flight Department Services and Aircraft Management (Provided by our parent company, Business Aircraft Group, Inc.) CAT also operates business jets such as Cessna Citation II N530P pictured above

19 CAT KING AIR - 200
 2301 North Marginal Road Cleveland, Ohio 44114 216-348-1415 (voice) 216-348-1432 (fax) Operations and Maintenance Offices:")
20 Call Us - We re Ready to Get Started on Your Program! Sales and Administrative Offices: Burke Lakefront Airport (BKL) 2301 North Marginal Road Cleveland, Ohio (voice) (fax) Operations and Maintenance Offices: Orlando-Sanford International Airport (SFB) 100 Starport Way Sanford, Florida (voice) (fax) Charter Air Transport, Inc. - Air Carrier Certificate #GNOA005I - Operations Conducted Under 14 CFR Part 135

21 Aviation technologies, inc. doing business as
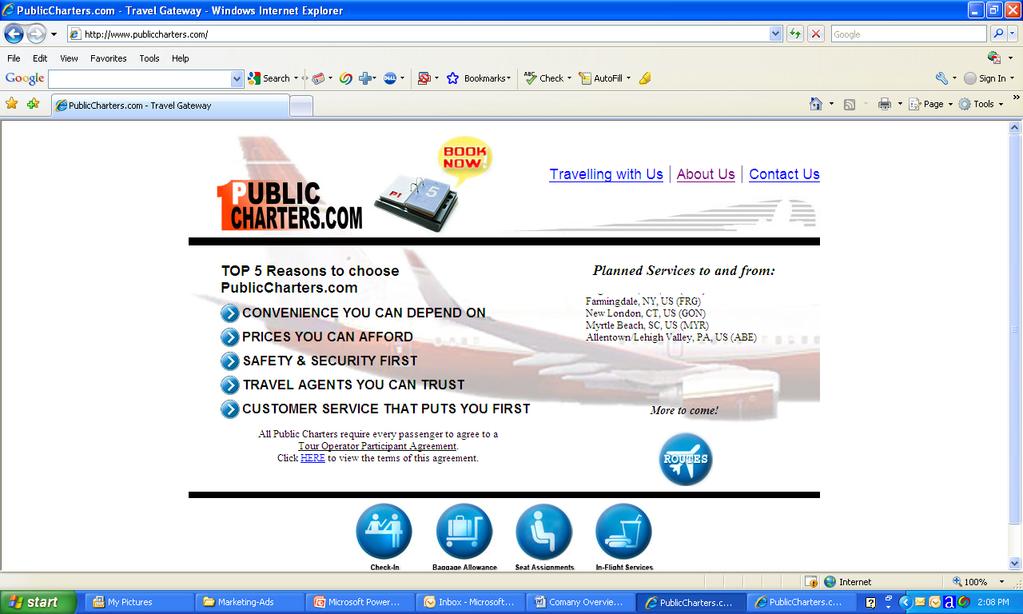
22 Publiccharters.com web-site


23 Central reservation system PublicCharters.com was fully funded in house to develop a CRS system that was GDS compliant to manage and bring together the large aircraft route network that has been operating in the charter industry for decades. In March of 2005, IATA awarded PubicCharters.com its own two letter code P1 identifying us as a CRS system. In February of 2008, we were assigned our 3 numeric Accounting Code from IATA. In December of 2008 we were approved for an ARC membership and are officially the first Charter Company in ARC history to be approved to settle ticket sales through the clearing house. We are currently displaying inventory in the Sabre and Amadeus GDS on an e ticketing platform and are being picked up by Expeida.com and are finalizing agreements with Travel ociity.com.
24 For Immediate Release Contact: Allan Mutén, ARC Pioneers New Carrier Participant Category Aviation Technologies, Inc. dba PublicCharters.com to be first Indirect Air Carrier (Public Charter Operator) to sell and settle directly with ARC-accredited travel agents Arlington, December 18, 2008 ARC s Board of Directors this month approved the addition of a supplementary agreement to the Carrier Services Agreement that will allow ticketing and settlement of transactions for Indirect Air Carriers (Public Charter Operators). The first such entity to join ARC as a carrier is PublicCharters.com (P1/351), effective with sales on December 29, PublicCharters.com is based in Northeastern Pennsylvania and currently serves Southern Florida, the Caribbean and select U.S. regional markets. Their business model uses chartered aircraft to serve routes lacking scheduled service, and includes plans to make seats available to the traveling public on corporate jet aircraft. Through ARC, travel agents can further meet niche market demand with new and unique Public Charter Operator content. Inventory can be bundled using segment select functions within various GDSs and with schedules identifying operating carriers and equipment. With scheduled traffic reduced or eliminated to many smaller markets, travel professionals opportunity to serve the customer has been impacted, says Mike Premo, ARC s vice president of marketing, sales, and customer care. However, by adding the Indirect Air Carrier category to the existing selection of more than 170 scheduled carriers, ARC has provided travel agents with a unique opportunity to fill a potential gap with new content, adds Premo.

25 e-ticket platform

26 On Line Reservation System

27 P1 Inventory on expedia.com

28 P1 Inventory on travelocity.com
29 Automated security solutions In March of 2006, we launched a Security Screening automation system called CheckTSA.com as a bi product of CRS Manager. This system allows for the required TSA screening and vetting of passenger, crew and employee names against the Government s No Fly/Selectee lists as well as the collection and remittance of data (APIS) for passengers boarding any International Flights for the US Customs and Boarder Control. In March of 2008, we were given Approval from the US Customs & Boarder Control allowing us to transmit passenger data for APIS under the new AQQ (APIS Quick Query) regulations that all Air Carriers operating flight into and out of the United States are required to follow. In late October of 2008, we became the first company to test with Secure Flight on behalf of two Air Carriers who use CheckTSA.com for their Passenger and Employee Name Vetting against the TSA Watch Lists. This will allow us to transmit on behalf of our customers, their Passenger and Employee data for Watch List vetting under the new Secure Flight Ruling.

30 Checktsa web-site
Multi-Aero Inc. d/b/a Air Choice One
 Multi-Aero Inc. d/b/a Air Choice One Proposal to Provide Essential Air Service at Owensboro, Kentucky Docket DOT-OST-2000-7855 Direct Inquiries Regarding this Proposal to: Shane Storz, CEO Air Choice One
Essential Air Service Proposal
 Essential Air Service Proposal Cape Girardeau, MO Quincy, IL DOT-OST-1996-1559 DOT-OST-2003-14492 June 15, 2017 About Boutique Air Our Story Headquartered in San Francisco, California, Boutique Air has
Essential Air Service Proposal. Massena, NY DOT-OST
 Essential Air Service Proposal Massena, NY DOT-OST-2012-0163 November 9th, 2016 About Boutique Air Our Story Headquartered in San Francisco, California, Boutique Air has been in operation since 2007. We
Essential Air Service Proposal
 Essential Air Service Proposal Bar Harbor, ME DOT-OST-2011-0185 April 5, 2018 About Boutique Air Our Story Headquartered in San Francisco, California, Boutique Air has been in operation since 2007. We
Essential Air Service Proposal
 Essential Air Service Proposal Bar Harbor, ME DOT-OST-2011-0185 January 3, 2018 About Boutique Air Our Story Headquartered in San Francisco, California, Boutique Air has been in operation since 2007. We
Silver City, New Mexico
 Proposal of Pacific Wings L.L.C. dba New Mexico Airlines to provide subsidized Essential Air Service for: Silver City, New Mexico Pacific Wings, L.L.C. P.O. Box 20280 Mesa, AZ 85277 Order 2014-7-6 Docket
Response to Order: Order: UNITED STATES OF AMERICA Department Of Transportation. Proposal to Provide EAS at PAGE, ARIZONA
 Response to Order: Order: 2016-9-4 UNITED STATES OF AMERICA Department Of Transportation DOT-OST-1997-2694 Proposal to Provide EAS at PAGE, ARIZONA OCTOBER 6, 2016 UNITED STATES OF AMERICA DEPARTMENT OF
Essential Air Service Proposal
 Essential Air Service Proposal Crescent City, CA DOT-OST-1997-2649 September 12th, 2017 About Boutique Air Our Story Headquartered in San Francisco, California, Boutique Air has been in operation since
Essential Air Service Proposal
 Essential Air Service Proposal Jackson, TN DOT-OST-2000-7857 December 15th, 2016 About Boutique Air Our Story Headquartered in San Francisco, California, Boutique Air has been in operation since 2007.
BOUTIQUE AIR 548 Market St San Francisco, CA t f
 About Boutique Air Our Story Headquartered in San Francisco, California, Boutique Air has been in operation since 2007. We began by flying fire surveillance missions for the U.S. Forestry Service and Bureau
BOUTIQUE AIR 548 Market St San Francisco, CA t f
 About Boutique Air Our Story Headquartered in San Francisco, California, Boutique Air has been in operation since 2007. We began by flying fire surveillance missions for the U.S. Forestry Service and Bureau
BOUTIQUE AIR 548 Market St San Francisco, CA t f
 About Boutique Air Our Story Headquartered in San Francisco, California, Boutique Air has been in operation since 2007. We began by flying fire surveillance missions for the U.S. Forestry Service and Bureau
Table of Contents PAGE
 DECEMBER 2018 EL PASO INTERNATIONAL AIRPORT MONTHLY ACTIVITY REPORT December 2018 Table of Contents PAGE AIRPORT ACTIVITY OVERVIEW 1 NONSTOP DESTINATION ANALYSIS 2 MAP OF NONSTOP DESTINATIONS 3 FLIGHT
Table of Contents PAGE
 NOVEMBER 2018 EL PASO INTERNATIONAL AIRPORT MONTHLY ACTIVITY REPORT November 2018 Table of Contents PAGE AIRPORT ACTIVITY OVERVIEW 1 NONSTOP DESTINATION ANALYSIS 2 MAP OF NONSTOP DESTINATIONS 3 FLIGHT
Table of Contents PAGE
 OCTOBER 2018 EL PASO INTERNATIONAL AIRPORT MONTHLY ACTIVITY REPORT October 2018 Table of Contents PAGE AIRPORT ACTIVITY OVERVIEW 1 NONSTOP DESTINATION ANALYSIS 2 MAP OF NONSTOP DESTINATIONS 3 FLIGHT SCHEDULE
Non-stop to/from Lambert - St. Louis International Airport 3x Daily
 Proposal of Hyannis Air Service, Inc. dba Cape Air to provide subsidized Essential Air Service for: Kirksville, Missouri Docket DOT-OST-1997-2515 Non-stop to/from Lambert - St. Louis International Airport
Table of Contents PAGE
 FEBRUARY 2018 EL PASO INTERNATIONAL AIRPORT MONTHLY ACTIVITY REPORT February 2018 Table of Contents PAGE AIRPORT ACTIVITY OVERVIEW 1 NONSTOP DESTINATION ANALYSIS 2 MAP OF NONSTOP DESTINATIONS 3 FLIGHT
AIR TRANSPORT MANAGEMENT Universidade Lusofona January 2008
 AIR TRANSPORT MANAGEMENT Universidade Lusofona Introduction to airline network planning: John Strickland, Director JLS Consulting Contents 1. What kind of airlines? 2. Network Planning Data Generic / traditional
Evolution of passenger reservation: PSS OF NEW GENERATION
 Evolution of passenger reservation: PSS OF NEW GENERATION AGENDA 1 Sirena-Travel: facts and figures 2 Leonardo PSS 3 Wide range of solutions: facts and figures DCS Astra Loyalty E-Commerce (B2C/B2B) RMS
Ticketing and Booking Data
 Ticketing and Booking Data Jim Ogden January 9, 2018 Agenda The booking and ticketing process What s available in the booking and ticketing data How to use booking and ticketing data? Summary The booking
May 2011 Passenger and Cargo Traffic Statistics Reno-Tahoe International Airport
 May 2011 Passenger and Cargo Traffic Statistics Reno-Tahoe International Airport July 5, 2011 U.S. DOMESTIC INDUSTRY OVERVIEW FOR MAY 2011 All RNO Carriers Systemwide year over year comparison Average
MOKULELE FLIGHT SERVICE, INC. MOKULELE AIRLINES DOCKET OST
 Essential Air Service at Kamuela, HI Docket OST 1997-2833 under 49 USC 41731 et seq. MOKULELE FLIGHT SERVICE, INC. D/B/A MOKULELE AIRLINES RENEWED PROPOSAL TO PROVIDE ESSENTIAL AIR SERVICE AT KAMUELA,
Ft. Leonard Wood, Missouri
 Proposal of Hyannis Air Service, Inc. dba Cape Air to provide subsidized Essential Air Service for: Ft. Leonard Wood, Missouri DOCKET DOT-OST-1996-1167 Four daily non-stop flights to/from Lambert - St.
Before the United States Department of Transportation January 31, 2014
 Before the United States Department of Transportation Proposal to Provide Essential Air Service at McCook, Nebraska Docket Under 49 U.S.C. 41731 et seq. Proposal of SeaPort Airlines, Inc. to Provide Essential
Inter-Office Memo Reno-Tahoe Airport Authority
 Inter-Office Memo Reno-Tahoe Airport Authority Date: November 30, 2009 To: Statistics Recipients From: Krys T. Bart, A.A.E., President/CEO Subject: RENO-TAHOE INTERNATIONAL AIRPORT PASSENGER STATISTICS
ABOUT US A Truly Exclusive Flying Experience. WHY CHOOSE US? We Take Care of Everything
 ABOUT US A Truly Exclusive Flying Experience Premium Charter Service is an air charter broker based in Tanzania. We offer our valued clients a truly exclusive flying experience, one that combines luxury
U.S. DOMESTIC INDUSTRY OVERVIEW FOR MAY 2009
 Inter-Office Memo Reno-Tahoe Airport Authority Date: June 30, 2009 To: Statistics Recipients From: Krys T. Bart, A.A.E., President/CEO Subject: RENO-TAHOE INTERNATIONAL AIRPORT PASSENGER STATISTICS U.S.
December 2011 Passenger and Cargo Traffic Statistics Reno-Tahoe International Airport
 December 2011 Passenger and Cargo Traffic Statistics Reno-Tahoe International Airport January 27, 2012 U.S. DOMESTIC INDUSTRY OVERVIEW FOR DECEMBER 2011 All RNO Carriers Systemwide year over year comparison
March 2014 Passenger and Cargo Traffic Statistics Reno-Tahoe International Airport
 March 2014 Passenger and Cargo Traffic Statistics Reno-Tahoe International Airport April 25, 2014 U.S. DOMESTIC INDUSTRY OVERVIEW FOR MARCH 2014 All RNO Carriers Domestic Systemwide year over year comparison
Gulf Carrier Profitability on U.S. Routes
 GRA, Incorporated Economic Counsel to the Transportation Industry Gulf Carrier Profitability on U.S. Routes November 11, 2015 Prepared for: Wilmer Hale Prepared by: GRA, Incorporated 115 West Avenue Suite
Great Lakes Aviation, Ltd.
 Provider of Essential Air Service for over 32 years throughout Midwest and Western regions of the United States. Meet Our Fleet Beechcraft 1900D 28 aircraft 19 and 9 seat turboprop EMB120 Brasilia 6 aircraft
January 2018 Air Traffic Activity Summary
 January 2018 Air Traffic Activity Summary Jan-2018 Jan-2017 CY-2018 CY-2017 Passengers 528,947 505,421 4.7% 528,947 505,421 4.7% Passengers 537,332 515,787 4.2% 537,332 515,787 4.2% Passengers 1,066,279
Passenger and Cargo Statistics Report
 Passenger and Cargo Statistics Report RenoTahoe International Airport November 2017 U.S. DOMESTIC INDUSTRY OVERVIEW FOR NOVEMBER 2017 Systemwide RNO Carriers Domestic Flights year over year comparison
WHAT CAN YOU DO IN A DAY? For full flight schedules, visit
 VIP Jet Travel to WHAT CAN YOU DO IN A DAY? For full flight schedules, visit http://ultimateairshuttle.com/destinations/. WHAT CAN YOU DO IN A DAY? For full flight schedules, visit http://ultimateairshuttle.com/destinations/.
December 2012 Passenger and Cargo Traffic Statistics Reno-Tahoe International Airport
 December 2012 Passenger and Cargo Traffic Statistics Reno-Tahoe International Airport January 29, 2013 U.S. DOMESTIC INDUSTRY OVERVIEW FOR DECEMBER 2012 All RNO Carriers Systemwide year over year comparison
Oct-17 Nov-17. Sep-17. Travel is expected to grow over the coming 6 months; at a slightly faster rate
 Analysis provided by TRAVEL TRENDS INDEX SEPTEMBER 2018 CTI reading of.8 in September 2018 indicates that travel to or within the U.S. grew 1.6% in September 2018 compared to September 2017. LTI predicts
September 2013 Passenger and Cargo Traffic Statistics Reno-Tahoe International Airport
 September 2013 Passenger and Cargo Traffic Statistics Reno-Tahoe International Airport October 31, 2013 U.S. DOMESTIC INDUSTRY OVERVIEW FOR SEPTEMBER 2013 All RNO Carriers Systemwide year over year comparison
August 2014 Passenger and Cargo Traffic Statistics Reno-Tahoe International Airport
 August 2014 Passenger and Cargo Traffic Statistics Reno-Tahoe International Airport October 8, 2014 U.S. DOMESTIC INDUSTRY OVERVIEW FOR AUGUST 2014 All RNO Carriers Domestic Systemwide year over year comparison
Jan-18. Dec-17. Travel is expected to grow over the coming 6 months; at a slower rate
 Analysis provided by TRAVEL TRENDS INDEX DECEMBER 2018 CTI reading of 51.8 in December 2018 indicates that travel to or within the U.S. grew 3.6% in December 2018 compared to December 2017. LTI predicts
Managing And Understand The Impact Of Of The Air Air Traffic System: United Airline s Perspective
 Managing And Understand The Impact Of Of The Air Air Traffic System: United Airline s Perspective NEXTOR NEXTOR Moving Moving Metrics: Metrics: A Performance-Oriented View View of of the the Aviation Aviation
November 2013 Passenger and Cargo Traffic Statistics Reno-Tahoe International Airport
 November 2013 Passenger and Cargo Traffic Statistics Reno-Tahoe International Airport December 26, 2013 U.S. DOMESTIC INDUSTRY OVERVIEW FOR NOVEMBER 2013 All RNO Carriers Domestic Systemwide year over
Table of Contents PAGE
 April 2015 EL PASO INTERNATIONAL AIRPORT MONTHLY ACTIVITY REPORT April 2015 Table of Contents PAGE AIRPORT ACTIVITY OVERVIEW 1 NONSTOP DESTINATION ANALYSIS 2 MAP OF NONSTOP DESTINATIONS 3 FLIGHT SCHEDULE
WHAT CAN YOU DO IN A DAY?
 VIP Travel to WHAT CAN YOU DO IN A DAY? ALL INCLUSIVE Means No Booking Fees, No Baggage Fees, No Parking Costs What You See is What You Pay With deals and seasonal specials throughout the year! NYC FLIGHT
2017 Marketing and Communications Conference. November 6, 2017
 2017 Marketing and Communications Conference November 6, 2017 1 2 Introduction Carrie Kenrick State of the Industry Industry Consolidation Financial Trends Ancillary Product / Customer Segmentation Fleet
49 May-17. Jun-17. Travel is expected to grow over the coming 6 months; at a slower rate
 Analysis provided by TRAVEL TRENDS INDEX MAY 2018 CTI reading of 51.7 in May 2018 shows that travel to or within the U.S. grew 3.4% in May 2018 compared to May 2017. LTI predicts moderating travel growth
Oct-17 Nov-17. Travel is expected to grow over the coming 6 months; at a slower rate
 Analysis provided by TRAVEL TRENDS INDEX OCTOBER 2018 CTI reading of 51.6 in October 2018 indicates that travel to or within the U.S. grew 3.2% in October 2018 compared to October 2017. LTI predicts travel
U.S. DOMESTIC INDUSTRY OVERVIEW FOR MARCH
 Inter-Office Memo Reno-Tahoe Airport Authority Date: April 30, 2009 To: Statistics Recipients From: Krys T. Bart, A.A.E., President/CEO Subject: RENO-TAHOE INTERNATIONAL AIRPORT PASSENGER STATISTICS U.S.
Aircraft Management Comprehensive Ownership, Operation and Maintenance Management Services
 Aircraft Management Comprehensive Ownership, Operation and Maintenance Management Services Aircraft Management Founded upon a heritage of service, Jet Aviation has a unique perspective that has developed
Passenger and Cargo Statistics Report
 Passenger and Cargo Statistics Report Reno-Tahoe International Airport December 2014 U.S. DOMESTIC INDUSTRY OVERVIEW FOR DECEMBER 2014 All RNO Carriers Domestic Systemwide year over year comparison Average
Hector International Airport
 Hector International Airport Data Acquired via OAG on October 2, 216 Volume 3-17 April 216 thru March 217 (Scheduled Flights Only) October 2, 216 1.% 5.% 5.8% 5.% 3.5% 5.% 6.8%.5%.% -5.% -3.9% -1.4% -2.9%
Richard Schuman. July 11, Dear Sir/Madam:
 130 Iolana Place, Honolulu, Hawaii 96819 July 11, 2014 Dear Sir/Madam: Please find enclosed our proposal to provide Essential Air Services to the community of Visalia, California, under Order 2014 5 9.
October 2013 Passenger and Cargo Traffic Statistics Reno-Tahoe International Airport
 October 2013 Passenger and Cargo Traffic Statistics Reno-Tahoe International Airport December 4, 2013 U.S. DOMESTIC INDUSTRY OVERVIEW FOR OCTOBER 2013 All RNO Carriers Systemwide year over year comparison
AUGUST 2008 MONTHLY PASSENGER AND CARGO STATISTICS
 Inter-Office Memo Reno-Tahoe Airport Authority Date: October 2, 2008 To: Statistics Recipients From: Tom Medland, Director Air Service Business Development Subject: RENO-TAHOE INTERNATIONAL AIRPORT PASSENGER
Airline Industry Overview For the Regional Airline Association. December 8, 2010
 Airline Industry Overview For the Regional Airline Association December 8, 2010 Agenda The Airline Industry at Yearend 2010 Financial Recovery Return to Growth Consolidation Alliances Regional Service
OCTOBER Tallahassee Regional Airport. International Airport Study. Executive Summary
 OCTOBER 2014 Tallahassee Regional Airport International Airport Study Executive Summary Why should Tallahassee Regional Airport consider becoming International? As smaller airports are developing International
Management Presentation. May 2013
 Management Presentation May 2013 Forward looking statements This presentation as well as oral statements made by officers or directors of Allegiant Travel Company, its advisors and affiliates (collectively
Trends Shaping Houston Airports
 Trends Shaping Houston Airports Ian Wadsworth Chief Commercial Officer April 2014 Our mission is to connect Houston with the world Connect the people, businesses, cultures and economies of the world to
SAl has been HAZMAT approved and will be working in conjunction with hospitals to expedite various HAZMAT materials that they need to transport.
 "r- -.. - I' '-' :,r-"-:t'-'i"'i,
Passenger and Cargo Statistics Report
 Passenger and Cargo Statistics Report RenoTahoe International Airport September 2016 U.S. DOMESTIC INDUSTRY OVERVIEW FOR SEPTEMBER 2016 All RNO Carriers Domestic Systemwide year over year comparison Average
CUSTOM COMFORT AND ENHANCED PRODUCTIVITY A NEW CLASS OF AMENITIES
 KING AIR 250 EXPAND YOUR BUSINESS The most popular business turboprop in the world, the Beechcraft King Air 250, now provides better performance and payload to deliver more people to more places in comfort
December 2013 Passenger and Cargo Traffic Statistics Reno-Tahoe International Airport
 December 2013 Passenger and Cargo Traffic Statistics Reno-Tahoe International Airport January 24, 2014 U.S. DOMESTIC INDUSTRY OVERVIEW FOR DECEMBER 2013 All RNO Carriers Domestic Systemwide year over year
Interim Management Report First Half Results 2010/11. October 29, 2010
 Interim Management Report First Half Results 2010/11 October 29, 2010 Disclaimer Certain information included in these statements is forward-looking and involves risks and uncertainties that could cause
Amadeus Multi channel distribution for hotels. Distribution & Content. Make the right moves. & conquer new markets
 Amadeus Multi channel distribution for hotels Distribution & Content Make the right moves & conquer new markets 2 Multi channel distribution for hotels Multi channel distribution for hotels 3 Be where
The Economic Impact of Emirates in the United States. Prepared by:
 Prepared by: www.av-econ.com Alexandria, Virginia July 2017 EXECUTIVE SUMMARY About Emirates Emirates Airline (Emirates), based in Dubai, United Arab Emirates (U.A.E.), was established in 1985 and since
Passenger and Cargo Statistics Report
 Passenger and Cargo Statistics Report Reno-Tahoe International Airport October 2018 U.S. DOMESTIC INDUSTRY OVERVIEW FOR OCTOBER 2018 Systemwide RNO Carriers Domestic Flights year over year comparison Average
in private jet travel
 ANNOUNCING A MAJOR BREAKTHROUGH in private jet travel Introducing The Jet Time Program provided by Marquis Jet Provided by Marquis Jet Announcing an exclusive new benefit for Centurion Card members JOHN
US Aviation Regulatory Update: A Review of 2010, and Issues to Watch
 US Aviation Regulatory Update: A Review of 2010, and Issues to Watch Anita Mosner Partner, Holland & Knight LLP IATA Legal Symposium 14 February 2010 New Developments - 2010 Many new developments. Among
The NESCAUM Method of Estimating Aircraft Emissions
 The NESCAUM Method of Estimating Aircraft Emissions Presentation to the OTC Mobile Source Committee December 5, 2001 Baltimore-Washington International Airport Ingrid Ulbrich Environmental Analyst NESCAUM
SIA ANALYST/MEDIA BRIEFING Q2 and 1H FY17/18 Results 8 November 2017
 SIA ANALYST/MEDIA BRIEFING Q2 and 1H FY17/18 Results 8 November 2017 THE PARENT AIRLINE Q2 AND 1H FY17/18 RESULTS THE PARENT AIRLINE COMPANY OPERATING PERFORMANCE Q2 % 1H % FY17/18 Change FY17/18 Change
Passenger and Cargo Statistics Report
 Passenger and Cargo Statistics Report RenoTahoe International Airport September 2018 U.S. DOMESTIC INDUSTRY OVERVIEW FOR SEPTEMBER 2018 Systemwide RNO Carriers Domestic Flights year over year comparison
NOVEMBER YEAR III LATIN AMERICA&CARIBBEAN MID-MARKETS: OPPORTUNITIES IN THE REGION
 NOVEMBER 2011 - YEAR III MARKETWATCH LATIN AMERICA&CARIBBEAN MID-MARKETS: OPPORTUNITIES IN THE REGION THE REGION IN PERSPECTIVE LAC in Perspective - 2011 Facts % of the world 595 mi people 9,3 $ 5,8 tri
Rutland, Vermont To/From Boston Docket DOT-OST
 Proposal of Hyannis Air Service, Inc. dba Cape Air to provide subsidized Essential Air Service for: Rutland, Vermont To/From Boston Docket DOT-OST-2005-21681 With codeshare of: May 8, 2017 Cape Air is
BUSINESS AVIATION SUPPORT SERVICES AIRCRAFT MANAGEMENT. Taking You Under Our Wing
 BUSINESS AVIATION SUPPORT SERVICES AIRCRAFT MANAGEMENT ACASS provides a full range of Aircraft Management services built upon its broad experience in the business aviation industry. Our IS-BAO certified
Passenger and Cargo Statistics Report
 Passenger and Cargo Statistics Report RenoTahoe International Airport August 2015 U.S. DOMESTIC INDUSTRY OVERVIEW FOR AUGUST 2015 All RNO Carriers Domestic Systemwide year over year comparison Average
July 2012 Passenger and Cargo Traffic Statistics Reno-Tahoe International Airport
 July 2012 Passenger and Cargo Traffic Statistics Reno-Tahoe International Airport August 31, 2012 U.S. DOMESTIC INDUSTRY OVERVIEW FOR JULY 2012 All RNO Carriers Systemwide year over year comparison Average
air traffic statistics
 December 213 air traffic statistics Prepared by the Office of Finance Department of Internal Controls, Compliance and Financial Strategy Commercial Total Dom Int'l Passengers % Change Air Traffic Summary
THAI AIRWAYS INTERNATIONAL PCL
 THAI AIRWAYS INTERNATIONAL PCL 2Q2017 analysts briefing 16-Aug-2017 1 DISCLAIMER The information contained herein is intended to represent the Company s operating and financial position at a given point
Impact of Advance Purchase and Length-of-Stay on Average Ticket Prices in Top Business Destinations
 Impact of Advance Purchase and Length-of-Stay on Average Ticket Prices in Top Business Destinations Research Summary Average ticket prices continue to trend downward in 2016, but since 2014 there have
January 2014 Passenger and Cargo Traffic Statistics Reno-Tahoe International Airport
 January 2014 Passenger and Cargo Traffic Statistics Reno-Tahoe International Airport March 12, 2014 U.S. DOMESTIC INDUSTRY OVERVIEW FOR DECEMBER 2013 All RNO Carriers Domestic Systemwide year over year
Passenger and Cargo Statistics Report
 Passenger and Cargo Statistics Report RenoTahoe International Airport September 2017 U.S. DOMESTIC INDUSTRY OVERVIEW FOR SEPTEMBER 2017 Systemwide RNO Carriers Domestic Flights year over year comparison
New Distribu,on Capability
 New Distribu,on Capability IATA, Sébas,en Touraine Traveltrend Seminar - NBTA 2. September 2013 OSLO To represent, lead and serve the airline industry Outlook for profitability is improving slowly % revenues
Passenger and Cargo Statistics Report
 Passenger and Cargo Statistics Report RenoTahoe International Airport July 2018 U.S. DOMESTIC INDUSTRY OVERVIEW FOR JULY 2018 Systemwide RNO Carriers Domestic Flights year over year comparison Average
ACI-NA Small Airports Committee Meeting June 4, Tom Rafter, A.A.E.
 ACI-NA Small Airports Committee Meeting June 4, 2017 Tom Rafter, A.A.E. Nantucket Memorial Airport Today s Discussion Nantucket Overview The Island The Airport Unique Air Service Characteristics Impacts
ATPCO. Intended positioning on the market
 Company profile Founded in 1965 Head Office address USA (Washington Dulles International Airport) Countries with offices 3 countries (USA, UK, Singapore) Main activities Number of employees Countries with
General Aviation Economic Footprint Measurement
 General Aviation Economic Footprint Measurement Round Table Discussions ATAC, Ottawa Thursday, March 1 st, 2007 Presentation Outline Electronic Collection of Air Transportation Statistics (ECATS) at Transport
Passenger and Cargo Statistics Report
 Passenger and Cargo Statistics Report RenoTahoe International Airport June 2018 U.S. DOMESTIC INDUSTRY OVERVIEW FOR JUNE 2018 Systemwide RNO Carriers Domestic Flights year over year comparison Average
New Distribution Capability (NDC)
") Together Let s Build Airline Retailing Accountable Document Validated official document (such as any type of an airline ticket, or a Standard Traffic Document (STD) or payment voucher) that has a value
Together Let s Build Airline Retailing Accountable Document Validated official document (such as any type of an airline ticket, or a Standard Traffic Document (STD) or payment voucher) that has a value
JANUARY 2018 BOARD INFORMATION PACKAGE
 JANUARY 2018 BOARD INFORMATION PACKAGE MEMORANDUM TO: Members of the Airport Authority FROM: Lew Bleiweis, Executive Director DATE: January 19, 2018 Financial Report (document) Informational Reports: A.
Aruba Airport Full Year. Industry Update
 Aruba Airport Full Year 2018 Industry Update Airport Traffic Statistics Traffic Results Full Year 2018 Total Departing PAX 1,518,385 +6% Total Seat Cap - Outbound 1,837,202 +3% Departing PAX USA & CAN
Passenger and Cargo Statistics Report
 Passenger and Cargo Statistics Report RenoTahoe International Airport April 2018 U.S. DOMESTIC INDUSTRY OVERVIEW FOR APRIL 2018 Systemwide RNO Carriers Domestic Flights year over year comparison Average
Passenger and Cargo Statistics Report
 Passenger and Cargo Statistics Report RenoTahoe International Airport May 2018 U.S. DOMESTIC INDUSTRY OVERVIEW FOR MAY 2018 Systemwide RNO Carriers Domestic Flights year over year comparison Average Load
Passenger and Cargo Statistics Report
 Passenger and Cargo Statistics Report RenoTahoe International Airport September 2015 U.S. DOMESTIC INDUSTRY OVERVIEW FOR SEPTEMBER 2015 All RNO Carriers Domestic Systemwide year over year comparison Average
Jazz Air Income Fund. presented by Allan Rowe, Senior Vice President and Chief Financial Officer
 Jazz Air Income Fund presented by Allan Rowe, Senior Vice President and Chief Financial Officer BMO Capital Markets 2007 Income Trust Conference Toronto, November 20, 2007 Hello. 1 Forward Looking Statement
APPENDIX E AVIATION ACTIVITY FORECASTS
 APPENDIX E AVIATION ACTIVITY FORECASTS E.1 PURPOSE AND CONTEXT This appendix presents the St. George Airport (SGU) aviation activity forecasts for the period of 2003 through 2020. Among the components
Passenger and Cargo Statistics Report
 Passenger and Cargo Statistics Report RenoTahoe International Airport July 2017 U.S. DOMESTIC INDUSTRY OVERVIEW FOR JULY 2017 Systemwide RNO Carriers Domestic Flights year over year comparison Average
Management Presentation. November 2011
 Management Presentation November 2011 Forward looking statements This presentation as well as oral statements made by officers or directors of Allegiant Travel Company, its advisors and affiliates (collectively
Passenger and Cargo Statistics Report
 Passenger and Cargo Statistics Report RenoTahoe International Airport June 2017 U.S. DOMESTIC INDUSTRY OVERVIEW FOR JUNE 2017 All RNO Carriers Domestic Systemwide year over year comparison Average Load
What s Happening with Airline Ancillary Fees?
 WHAT TRAVEL PAYMENT IS ALL ABOUT. What s Happening with Airline Ancillary Fees? June, 2011 OVBTA Education Day Aaron Kelling, Executive Vice President for AirPlus International Ancillary Fees - 2010 P.
BEFORE THE DEPARTMENT OF TRANSPORTATION WASHINGTON, D.C.
 BEFORE THE DEPARTMENT OF TRANSPORTATION WASHINGTON, D.C. Essential Air Service at ) ) BRADFORD, PENNSYLVANIA ) Docket OST-2003-14528 DUBOIS, PENNSYLVANIA ) Docket OST-2004-17617 FRANKLIN/OIL CITY, PENNSYLVANIA
Passenger and Cargo Statistics Report
 Passenger and Cargo Statistics Report RenoTahoe International Airport December 2016 U.S. DOMESTIC INDUSTRY OVERVIEW FOR DECEMBER 2016 All RNO Carriers Domestic Systemwide year over year comparison Average