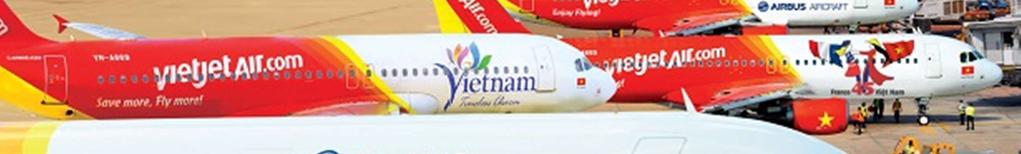
Key Highlights Q2/2018 Business result. July 2018
|
|
|
- Natalie Young
- 5 years ago
- Views:
Transcription


1 Key Highlights Q2/2018 Business result July 2018
2 Disclaimer INFORMATION CONTAINED IN OUR PRESENTATION IS INTENDED SOLELY FOR YOUR REFERENCE. SUCH INFORMATION IS SUBJECT TO CHANGE WITHOUT NOTICE, ITS ACCURACY IS NOT GUARANTEED AND IT MAY NOT CONTAIN ALL MATERIAL INFORMATION CONCERNING THE COMPANY. NEITHER WE NOR OUR ADVISOR MAKES ANY REPRESENTATION REGARDING, AND ASSUMES NO RESPONSIBILITY OR LIABILITY FOR, THE ABILITY, THE ACCURACY OR COMPLETENESS OF, ANY ERRORS OR OMISSION IN, ANY INFORMATION CONTAINED HEREIN. IN ADDITION, THE INFORMATION MAY CONTAIN PROJECTIONS AND FORWARD-LOOKING STATEMENT THAT REFLECTS THE COMPANY'S CURRENT VIEWS WITH RESPECT TO FUTURE EVENTS AND FINANCIAL PERFORMANCE. THESE VIEW ARE BASED ON CURRENT ASSUMPTIONS WHICH ARE SUBJECT TO VARIOUS RISK FACTORS AND WHICH MAY CHANGE OVER TIME. NO ASSURANCE CAN BE GIVEN THAT FUTURE EVENTS WILL OCCURS, THAT PROJECTIONS WILL BE ACHIEVED, OR THAT COMPANY ASSUMPTIONS ARE CORRECT. ACTUAL RESULT MAY DIFFER MATERIALLY FROM THOSE PROJECTED. THIS PRESENTATION IS STRICTLY NOT TO BE DISTRIBUTED WITHOUT THE EXPLICIT CONSENT OF THE COMPANY'S MANAGEMENT UNDER ANY CIRCUMSTANCES. 1
3 Key Highlights Carried m passengers in Q2 2018, an increase of 28.9% compared with Q (Total Passenger carried in Q was mil) Capacity in Q is 6.67m seat flown, increase 29.8 % compared with Q Vietjet operate 94 routes in Q including 38 Domestic routes and 56 International routes, compared with 37 Domestic routes and 36 International routes in Q Total Operating Revenue in Q is 8,588.3 billion VND, increased 52.06% compared with Q Operating Profit in Q reached VND billion, 26.3% higher than that in Q with VND billion. Load Factor is maintained at high figure with nearly 87.1% in Q2 2018, slightly lower than 87.71% in Q Achieved the highest technical reliability of 99.64% among top Airlines in Asia Pacific region. Foreign Exchange rate as at 30/06/2018 is 22,650 VND/USD, compared with 22,431 VND/USD in 30/06/2017. Fuel price Jet A1 (MOPS) in June 2018 is USD/barrel, 7.8% increased compared with that in June
4 Operating Statistics Modern and young fleet with average age of 2.95 years comprising 24 TOTAL ROUTES OPERATED Airbus A320s and 30 A321s and 1 A321NEO as of 30/06/2018. Up to 30/06/2018, VJC has total 219 aircraft on order with Airbus and Boeing in which the company received 43 aircraft. Pax Carried: m passengers in Q Q2-17 Q2-18 Operated an extensive network of 38 domestic routes and 56 international routes, services up to 30/06/2018. Passengers & Aircraft growth Vietjet operated a total of 31,114 flights in Q Passengers (m) Total aircraft Aircraft utilization 14.4 block hours per aircraft a day Safety indicators of ground operations and Flight operations are also highest in the region On-time performance ratio of 83.4% in Q Q2-17 Q
5 Passenger Growth To More Than 40% Per Annum 50,000 Total Passengers ( 000 pax) 45,000 43,000 40,000 35,000 30,000 34,000 36,000 39,000 30,000 25,000 24,100 20,000 15,000 14,051 17,110 10,000 5,000 3,156 5,562 9,


6 Flight network extension The number of Routes: 94 routes (includes: 38 domestic routes and 56 international routes 5


7 Vietjet opened direct flights connecting Hanoi & Ho Chi Minh City to Osaka (Japan) 6 6


8 Products - Services Reasonable and economical price with varied ticket types for choosing. Added services were offered, such as check-in priority, boarding priority, hot meals, pre-ordered beverages, and much more, were made available. 12pm, It s time to Vietjet promotion campaign offered millions of tickets from VND0 to bring flying opportunities for domestic and foreign passengers Travel insurance products to minimize travel risks were adjusted and sold to passengers via Our Skyshop continued to improve its services. Apart from hot meals and typical Vietjet souvenirs, many seasonal products were purchased onboard by passengers, for example, summertime products, wintertime products, Tet holiday products, and more. Duty-free products proved popular on Vietjet s international flights; a wide-range of cosmetics, perfumes, alcohols, cigarettes, and more, were sold at reasonable prices 7
9 Products - Services At all airport, areas serving Vietjet's inbound and outbound flights are synchronously designed, equipped with modern equipment and prominent branding signs to facilitate customers. Operated international flights at new terminal T2 in Cam Ranh and transfered flight operation to Terminal T1 - Yangon International Airport (Myanmar) with modern facilities and many utility services for passengers. Cam Ranh International Airport Yangon International Airport (Myanmar) 8
 Conference Opened direct")
10 Typical events of the Q Organized Annual General Shareholders Meeting 2018 successfully. Strengthened cooperation at the ACMECS 2018 Economic Cooperation Strategy Summit and 2018 CLMV Summit Attended the 74 th International Air Transport Association (IATA) Conference Opened direct flights from Hanoi, Ho Chi Minh City to Osaka (Japan) Boeing and Vietjet ink deal for 100 new aircraft Vietjet and Vietnam Youth Union s Central Committee, National Volunteer Centre launched Let s clean up the ocean
11 Vietjet Academy In the second quarter, Vietjet has finished the construction of Aviation Academy in cooperation with Airbus, which been installing equipment to be in operation in the next quarter, ensuring a stable training, reducing time and cost of regular pilot training


12 Awards Listed at the top companies of Nhip cau Dau tu Magazine Vietnam s 50 Best performing Companies 2017, being on the Billion-Dollar Club of companies which have market capitalization of over USD1 billion. Being honored as one of the Vietnam's 50 best listed companies in 2018 by Forbes Top Airlines by Absolute Passenger Growth in Southeast Asia Award Received Vietnam s excellent brand award being voted by Vietnam Economic Times 11
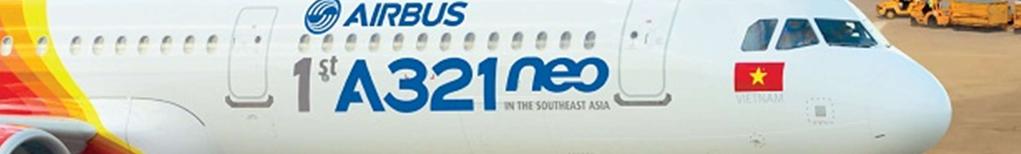
13 Fleet Expansion Vietjet s aircraft fleet by 30 th June, 2018 stood at 55 aircraft including 24 Airbus A320s and 31 Airbus A321s with the average age of 2.95 years. The fleet of aircraft has seat configuration from 180 to seats and the designs are in tune with the low cost airline business model. Vietjet made an order of 171 Airbus A320/321 aircraft and an order of another MAX 200 aircraft with Boeing. The orders with Airbus and Boeing will be completed at the end of


14 Lively fleet of Vietjet 13
15 Young, modern and Fuel Efficient Fleet AC Type Vietjet Air Asia (AK) Indigo Jetstar (JQ) easyjet (U2) A319 ( 156 seats) 91 A A321 ( 230 seats) 31 8 Ryanair B737 NG 436 Avg. Age (y) Total A321 deliver cost & revenue benefits 14


16 Cost, cost & cost! A strong focus on cost 15
17 FLEET EXPANSION Young, modern and Fuel Efficient Fleet A320 A Max8 1H A A Max Total


18 Daegu - the fourth largest city of South Korea is the new destination of Vietjet in this beautiful country 17


19 Comprehensive fuel saving program Applying advanced technology and environment friendly solution in daily operation is one of the top priorities of Vietjet. By analyzing both operational and maintenance aspects, Safran s SFCO2 service develops procedures and recommendations to address airlines need for greater fuel efficiency which can reduce Vietjet fuel consumption up to 5% By 1H 2018, the SFCO2 program saved 1,197,920 kg of fuel. 18


20 Safety and Quality activities of the 1Q2018 Continue working with Airbus Nablue to enhance Monitoring. Flight Data Working with Airbus to study more about Skywise digital aviation data platform which aims to become the single platform of reference used by all major aviation players to improve operational performance and business results. 19
21 Best In Class Cost Structure With Room For Improvement Vietjet Air Airasia group Ryanair Cebu Pacific Spirit Indigo Norwegian Air Jetstar Allegiant SpiceJet Gol Linhas Southwest Nok RASK CASK - ex fuel CASK Lowest CASK-Ex fuel. There is still headroom for cost structure improvement to further decrease both CASK & CASK ex-fuel Source: Bloomberg, Company Financial Statement Vietjet s results are based on Q Financial Statement. Other peers results are based on full year 2017 number. 20

22 The latest orders to purchase more 100 Boeing and 50 Airbus aircraft will help Vietjet 21 developing our airline alliances across the Asia Pacific region and worldwide
23 Best Class In Operating Performance (Seperated Fs) Total Revenue: increased 52.1% from 5,648 VND billion in Q to 8,588 VND billion in Q Operating Profit grew up 26.3% to VND billion in Q compared to same period in Profit before tax increased 25.5% to 837 VND billion in Q2 2018, compared to 667 VND billion in Q TOTAL REVENUE (VND bil) 8,588 5,648 Q2-17 Q2-18 PROFIT BEFORE TAX (VND bil) OPERATING PROFIT (VND bil) Q2-17 Q2-18 Cash and Cash Equivalent( VND bil/%) Cash and Cash Equivalent increased 104.3% to 5,388 VND billion in Q2 2018, compared to 2,637 VND billion in Q Q2-17 Q2-18 Q2-17 Q


24 Solid Growth In Ancillary Ancillary revenue per pax: increased 6.3% from 14.2 USD/pax in Q2/2017 to 15.1 USD/pax in Q2/2018. Total Ancillary revenue as % of Total Operation Revenue slightly decreased to 22% in Q2/2018 compare to Q2/2017 Ancillary revenue per pax USD/pax Q2-17 Q2-18 Ancillary revenue % of Total Operation Revenue 25.3% 22.0% Q Q
25 Excellent Financial Performance (Consolidated Fs) Revenue per ASK increased 11% YoY due to strong growth from passenger carried (up 28.9%) and high load factor at 87.1%. RASK (US Cents) CASK (US Cents) Cost per ASK impacted by higher fuel price (up 6.6%) Q2-17 Q2-18 Q2-17 Q2-18 Cost per ASK (excluded fuel) up 0.12 US.cent from 2.14 to CASK EX-FUEL (US Cents) RASK - CASK (US Cents) RASK CASK: up 39.6% YoY Q2-17 Q2-18 Q2-17 Q
26 Excellent Financial Performance (Consolidated Fs) TOTAL ASSETS (VND Bil) TOTAL EQUITY (VND bil) Total assets: increased 40% from 24,945 VNDbil in Q2-17 to 34,891 VNDbil in Q2-18. Total Equity increased 48.7% to 11,842 VND bil in Q2-18 due to strong Retained Earnings from 1H Cash and Cash equivalent increased 103.6% to 5,395 VND bil in Q2-18 due to strong cash flow from sales in 1H ,891 24,945 Q2-17 Q2-18 CASH & CASH EQUIVALENT (VND bil) 11,842 7,964 Q2-17 Q2-18 Net Debt/ Equity Net Debt/ Equity decreased from 0.6x to 0.2x in Q2-18 due to substantial growth in equity and strong cash balance showing the better financial position of the Company. 6,000 5,000 4,000 3,000 2,000 1,000-5,395 2,650 Q2-17 Q x 0.6x 0.5x 0.4x 0.3x 0.2x 0.1x 0.0x 0.6x 0.2x Q Q Net Debt / Equity 25
 per Available Seat Kilometer. Total Cost (excluding cost of aircraft sold, fuel) per Available Seat Kilometer.")
27 Definitions And Abbreviations Term ASK CASK CASK ex-fuel RASK EBITDA EBITDAR Load Factor LCC OTP RPK Capacity Aircraft Utilization Description Available Seat Kilometer Total Cost (excluding cost of aircraft sold) per Available Seat Kilometer. Total Cost (excluding cost of aircraft sold, fuel) per Available Seat Kilometer. Total Revenue (excluding Revenue from sale aircraft) per Available Seat Kilometer. Earning before Interest, Tax, Depreciation and Amortization. Earning before Interest, Tax, Depreciation and Amortization, and Rent. Passenger Carried / Capacity. Low Cost Carrier On Time Performance. Revenue Passenger Kilometer. Available seat Average numbers of hours during each 24-hour period that an aircraft is actually in flight 26

28 THANK YOU 27
Vietjet Aviation Joint Stock Company Key Highlights Q1/2018 Business result. April 2018
 Vietjet Aviation Joint Stock Company Key Highlights Q1/2018 Business result April 2018 Disclaimer INFORMATION CONTAINED IN OUR PRESENTATION IS INTENDED SOLELY FOR YOUR REFERENCE. SUCH INFORMATION IS SUBJECT
Key Highlights Q4/2018 Business result. Dec,2018
 Key Highlights Q4/2018 Business result Dec,2018 Disclaimer INFORMATION CONTAINED IN OUR PRESENTATION IS INTENDED SOLELY FOR YOUR REFERENCE. SUCH INFORMATION IS SUBJECT TO CHANGE WITHOUT NOTICE, ITS ACCURACY
Vietjet Aviation Joint Stock Company Key Highlights Q3/2017 Business result. October 2017
 Vietjet Aviation Joint Stock Company Key Highlights Q3/2017 Business result October 2017 Disclaimer INFORMATION CONTAINED IN OUR PRESENTATION IS INTENDED SOLELY FOR YOUR REFERENCE. SUCH INFORMATION IS
VietJet Aviation Joint Stock Company Key Highlights Q1/2017 Business result. Apr 2017
 VietJet Aviation Joint Stock Company Key Highlights Q1/2017 Business result Apr 2017 Disclaimer INFORMATION CONTAINED IN OUR PRESENTATION IS INTENDED SOLELY FOR YOUR REFERENCE. SUCH INFORMATION IS SUBJECT
Vietjet Aviation Joint Stock Company Key Highlights 2018 Business results
 Vietjet Aviation Joint Stock Company Key Highlights 2018 Business results Disclaimer INFORMATION CONTAINED IN OUR PRESENTATION IS INTENDED SOLELY FOR YOUR REFERENCE. SUCH INFORMATION IS SUBJECT TO CHANGE
1Q13 R sults esentation
 1Q13 Results Presentation 14 May 2013 Disclaimer The presentation is dated the day it is given. The delivery of this presentation shall not, under any circumstances, create any implication that there has
AirAsia X Berhad First Quarter 2014 Results - Investor and Analyst Briefing -
 AirAsia X Berhad First Quarter 2014 Results - Investor and Analyst Briefing - Disclaimer Information contained in our presentation is intended solely for your reference. Such information is subject to
Cebu Air, Inc. 2Q2014 Results of Operation
 Cebu Air, Inc. 2Q2014 Results of Operation 1 Disclaimer This information provided in this presentation is provided only for your reference. Such information has not been independently verified and, as
Investor Presentation Q2 2011
 Investor Presentation Q2 Disclaimer Information contained in this presentation is subject to change without notice, its accuracy is not guaranteed and it may not contain all material information concerning
Key Highlights 9M/2018 Business results Oct 2018
 Key Highlights 9M/2018 Business results Oct 2018 Disclaimer INFORMATION CONTAINED IN OUR PRESENTATION IS INTENDED SOLELY FOR YOUR REFERENCE. SUCH INFORMATION IS SUBJECT TO CHANGE WITHOUT NOTICE, ITS ACCURACY
Analyst Meeting 1Q/2015
 Analyst Meeting 1Q/2015 DISCLAIMER The presentation is dated the day it is given. The delivery of this presentation shall not, under any circumstances, create any implication that there has been no change
Cebu Air, Inc. 4 th Quarter and Full Year 2017 Results of Operations. cebupacificair.com
 Cebu Air, Inc. 4 th Quarter and Full Year 2017 Results of Operations cebupacificair.com Disclaimer The information provided in this presentation is provided only for your reference. Such information has
ANALYST MEETING 3Q2015
 ANALYST MEETING 3Q2015 November 12, 2015 DISCLAIMER The presentation is dated the day it is given. The delivery of this presentation shall not, under any circumstances, create any implication that there
THIRD QUARTER RESULTS 2017
 THIRD QUARTER RESULTS 2017 KEY RESULTS In the 3Q17 Interjet total revenues added $5,835.1 million pesos that represented an increase of 22.0% over the revenue generated in the 3Q16. In the 3Q17, operating
FOURTH QUARTER RESULTS 2017
 FOURTH QUARTER RESULTS 2017 KEY RESULTS In the 4Q17 Interjet total revenues added $5,824.8 million pesos that represented an increase of 10.8% over the revenue generated in the 4Q16. In the 4Q17, operating
PRESS RELEASE. First Half 2017 Financial Results Higher Load Factors and traffic lead to a significant rebound in second quarter profitability
 PRESS RELEASE First Half 2017 Financial Results Higher Load Factors and traffic lead to a significant rebound in second quarter profitability Kifissia, 12 September 2017 AEGEAN announces first half 2017
Korean Air Q Financial Results. Jul 28, 2011
 Korean Air 2011 2Q Financial Results Jul 28, 2011 Disclaimer This presentation is for informational purposes only, contains preliminary financial and other information about Korean Air Lines Co., Ltd.
Air Arabia. Investor Presentation. 1 st Quarter 2015
 Air Arabia Investor Presentation 1 st Quarter 2015 Disclaimer Information contained in this presentation is subject to change without notice, its accuracy is not guaranteed and it may not contain all material
Air Arabia Air Arabia Q Q1 2017
 Air Arabia Air Arabia Q2 2017 Investor Investors Presentation Presentation Q1 2017 The Development of Air Arabia Air Arabia - General Overview Company Overview Launched in October 2003, Air Arabia was
PRESS RELEASE Financial Results. Rising passenger traffic at 12.5m Exceeding 1bn in consolidated revenue
 PRESS RELEASE 2016 Financial Results Rising passenger traffic at 12.5m Exceeding 1bn in consolidated revenue Kifissia, 23 March 2017 AEGEAN reports full year 2016 results with consolidated revenue at 1,020m,
Air Arabia. Investor Presentation. Sharjah, UAE: September 2013
 Air Arabia Investor Presentation Sharjah, UAE: September 2013 Disclaimer Information contained in this presentation is subject to change without notice, its accuracy is not guaranteed and it may not contain
Q3 FY18 Business Highlights
 Q3 FY18 RESULTS Q3 FY18 Business Highlights 1 2 3 4 5 6 7 Record passengers 7.1m, record revenues 423m Investing in growth 24% passenger growth in Q3 Disciplined cost management flat ex-fuel CASK Largest
Air Arabia Investor Presentation Q2 2016
 Air Arabia Investor Presentation Q2 2016 The Development of Air Arabia Air Arabia - General Overview Company Overview Launched in October 2003, Air Arabia was the first and is the largest low cost carrier
Financial Position (consolidated)
") 2013. 8. 14. Disclaimer This presentation is for informational purposes only, contains preliminary financial and other information about Korean Air Lines Co., Ltd. and is subject to updating, revision,
2013. 8. 14. Disclaimer This presentation is for informational purposes only, contains preliminary financial and other information about Korean Air Lines Co., Ltd. and is subject to updating, revision,
Air Arabia Investor Presentation FY / Q4 2016
 Air Arabia Investor Presentation FY / Q4 2016 The Development of Air Arabia Air Arabia - General Overview Company Overview Launched in October 2003, Air Arabia was the first and is the largest low cost
1Q 2014 Edition. Share Information. Daily Share Price Movements
 1Q 2014 Edition 1Q 2013 1Q 2014 Change Financial Summary (USD Mio) OPERATING REVENUES 807 807 0.01% OPERATING EXPENSES 827 1,000 20.86% OTHERS (INCOME) 4 25 460.80% INCOME (LOSS) FROM OPERATIONS -20-193
SECOND QUARTER RESULTS 2018
 SECOND QUARTER RESULTS 2018 KEY RESULTS In the 2Q18 Interjet total revenues added $ 5,781.9 million pesos that represented an increase of 9.6% over the revenue generated in the 2Q17. In the 2Q18, operating
Grupo Viva Aerobus announces results for the third quarter of 2016
 Earnings Earnings Report Report 3 rd rd Quarter Quarter 2016 2016 Grupo Grupo Viva Viva Aerobus Aerobus Grupo Viva Aerobus announces results for the third quarter of 2016 Mexico City, Mexico, October 27,
THIRD QUARTER AND NINE MONTHS OF 2014 KEY RESULTS
 THIRD QUARTER AND NINE MONTHS OF 2014 KEY RESULTS In 3Q14 INTERJET total revenues were $ 3,643.4 million, representing an increase of 9.9% on revenues generated in the 3Q13. Accumulated 9M14 INTERJET total
Earnings Report 1 st Quarter 2016 Grupo Viva Aerobus
 Earnings Report 1 st Quarter 2016 Grupo Viva Aerobus Grupo Viva Aerobus announces results for the first quarter of 2016 Mexico City, Mexico, April 29, 2016- Grupo Viva Aerobus S.A. de C.V. ( Grupo Viva
Tiger Airways Holdings Limited FY11 Results
 Tiger Airways Holdings Limited FY11 Results May 2011 Financial Year Ended 31 March 2011 Disclaimer The information contained in this presentation (the "Information") is provided by Tiger Airways Holdings
FIRST QUARTER RESULTS 2017
 FIRST QUARTER RESULTS 2017 KEY RESULTS In the 1Q17 Interjet total revenues added $4,421.5 million pesos that represented an increase of 14.8% over the income generated in the 1Q16. In the 1Q17, operating
Management Discussions and Analysis for the three-month period ended 31 March 2014 and Executive Summary
 Executive Summary Overview of the global economy during the first quarter of 2015 (Q1/2015) are as following; the US economy has been in recovery mode while rapidly dollar appreciation weighs on net exports
AIRASIA X. Fourth Quarter and Full Year 2015 Financial Results
 AIRASIA X Fourth Quarter and Full Year 2015 Financial Results DISCLAIMER Information contained in our presentation is intended solely for your reference. Such information is subject to change without notice,
KOREAN AIR 4Q17 FINANCIAL RESULTS
 KOREAN AIR 4Q17 FINANCIAL RESULTS 1 Disclaimer This presentation is for informational purposes only, contains preliminary financial and other information about Korean Air Lines Co., Ltd. and is subject
Q Fast growth continued, Comparable operating result at record high levels Pekka Vauramo
 2018 Fast growth continued, Comparable operating result at record high levels 17.7.2018 Pekka Vauramo 2 A good - Comparable operating result increased to new seasonal high Revenue Comparable operating
THIRD QUARTER RESULTS 2018
 THIRD QUARTER RESULTS 2018 KEY RESULTS In the 3Q18 Interjet total revenues added $ 6,244.8 million pesos that represented an increase of 7.0% over the revenue generated in the 3Q17. In the 3Q18, operating
Leaving the Competition Behind. Second Quarter (Apr-Jun) 2009 Results
 2009 Results") Leaving the Competition Behind Second Quarter (Apr-Jun) 2009 Results 12 Aug 2009 1 Disclaimer Information contained in our presentation is intended solely for your reference. Such information is subject
Leaving the Competition Behind Second Quarter (Apr-Jun) 2009 Results 12 Aug 2009 1 Disclaimer Information contained in our presentation is intended solely for your reference. Such information is subject
Air Arabia. Investor Presentation. Sharjah, UAE: 3 rd Quarter 2014
 Air Arabia Investor Presentation Sharjah, UAE: 3 rd Quarter 2014 Disclaimer Information contained in this presentation is subject to change without notice, its accuracy is not guaranteed and it may not
FIRST QUARTER RESULTS 2016
 FIRST QUARTER RESULTS 2016 KEY RESULTS In 1Q16 Interjet total revenues added $3,850.8 million pesos that represented an increase of 21.9% over the income generated in the 1Q15. In 1Q16 total passengers
Korean Air Lines Q Results & 2011 Business Plan. 27 Feb 2011
 Korean Air Lines 2010 4Q Results & 2011 Business Plan 27 Feb 2011 Disclaimer This presentation is for informational purposes only, contains preliminary financial and other information about Korean Air
Thank you for participating in the financial results for fiscal 2014.
 Thank you for participating in the financial results for fiscal 2014. ANA HOLDINGS strongly believes that safety is the most important principle of our air transportation business. The expansion of slots
Results 2Q17. August 9, 2017
 Results 2Q17 August 9, 2017 2Q17 Highlights Indicators 2Q17 Var. x 2Q16 ASK (BN) 10.4-3.0% Traffic (000) 7,261-1.3% RPK (BN) 8.1 +0.5% Load Factor 77.9% +2.7 p.p. Yield (R$ cents) 23.2 +4.8% Pax Revenue
Q Finnair s growth continued Pekka Vähähyyppä
 2018 Finnair s growth continued 25.10.2018 Pekka Vähähyyppä 1 We continued to develop our services and network New route to Los Angeles in 2019, two daily flights to Hong Kong New digital service for exploring
NORWEGIAN AIR SHUTTLE ASA QUARTERLY REPORT SECOND QUARTER 2006 [This document is a translation from the original Norwegian version]
![NORWEGIAN AIR SHUTTLE ASA QUARTERLY REPORT SECOND QUARTER 2006 [This document is a translation from the original Norwegian version]](/thumbs/74/71229964.jpg "NORWEGIAN AIR SHUTTLE ASA QUARTERLY REPORT SECOND QUARTER 2006 [This document is a translation from the original Norwegian version]") NORWEGIAN AIR SHUTTLE ASA QUARTERLY REPORT SECOND QUARTER 2006 SECOND QUARTER IN BRIEF had earnings before tax of MNOK 24.8 (20.6) in the second quarter. The operating revenue increased by 44 % this quarter,
NORWEGIAN AIR SHUTTLE ASA QUARTERLY REPORT SECOND QUARTER 2006 SECOND QUARTER IN BRIEF had earnings before tax of MNOK 24.8 (20.6) in the second quarter. The operating revenue increased by 44 % this quarter,
Financial Position (consolidated)
") May 14 th, 2015 Disclaimer This presentation is for informational purposes only, contains preliminary financial and other information about Korean Air Lines Co., Ltd. and is subject to updating, revision,
May 14 th, 2015 Disclaimer This presentation is for informational purposes only, contains preliminary financial and other information about Korean Air Lines Co., Ltd. and is subject to updating, revision,
Ref. PE004/ May Subject: Management Discussion and Analysis for the First Quarter of 2018
 Ref. PE004/2561 10 May 2018 Subject: Management Discussion and Analysis for the First Quarter of 2018 Attention: President The Stock Exchange of Thailand According to the financial reports of Nok Airlines
JAPAN AIRLINES Co., Ltd. Financial Results 1 st Quarter Mar/2017(FY2016) July 29, 2016
 July 29, 2016") JAPAN AIRLINES Co., Ltd. Financial Results Mar/2017(FY2016) July 29, 2016 Today s Topics P.1 P.2 P.13 From the first quarter of this fiscal year, figures for Revenue Passengers Carried, ASK, RPK and Load
JAPAN AIRLINES Co., Ltd. Financial Results Mar/2017(FY2016) July 29, 2016 Today s Topics P.1 P.2 P.13 From the first quarter of this fiscal year, figures for Revenue Passengers Carried, ASK, RPK and Load
INVESTOR RELATIONS Earnings Release
 INVESTOR RELATIONS 2017 2017 Earnings Release 1 Disclaimer This document contains parent results for 2017 based on K-IFRS. These statements involve risks and uncertainties, and actual results may differ.
Finnair Q Result
 Finnair Q1 2015 Result 7 May 2015 CEO Pekka Vauramo, Interim CFO Mika Stirkkinen 1 Turbulent market environment The weakness of the Finnish economy continued to be reflected in the demand in the first
Analyst and Investor Conference Call Q Ulrik Svensson, CFO and Member of the Executive Board
 Analyst and Investor Conference Call Q2 2017 Ulrik Svensson, CFO and Member of the Executive Board Frankfurt, 2 August 2017 Disclaimer The information herein is based on publicly available information.
Conference Call 1Q14 Results. Investor Relations May 15, 2014
 Conference Call Results Investor Relations May 15, 2014 1 Highlights 2 Highlights Net revenues of R$2.5 billion in the quarter, an increase of 20% or R$411 million quarter-over-quarter; EBIT totaled R$144
UBS 14 th Global Emerging Markets Conference. New York, November 2016
 UBS 14 th Global Emerging Markets Conference New York, November 2016 This presentation may include forward-looking comments regarding the Company s business outlook and anticipated financial and operating
AVIATION INDUSTRY REPORT, Q3/2018
 AVIATION INDUSTRY REPORT, Q3/2018 1 Content Abbreviation 3 3 Vietnam aviation industry 36 Executive summary 4 3.1 Development history of the industry 36 1 Business environment 6 3.2 Value chain of aviation
Enhancing air travel options through a strong focus on profitability and innovation. 4 th Quarter 2017 Earnings Report Grupo Viva Aerobus
 4 th Quarter 2017 Earnings Report Grupo Viva Aerobus Enhancing air travel options through a strong focus on profitability and innovation 1 VIVA AEROBUS REPORTS GROWTH OF 17.9% IN TOTAL OPERATING REVENUE
Passenger: 17.2 Million (+3.9% yoy) OTP: 85.8% SLF: 73.3% Subsidiaries Operating Revenues US$415.2 Million Cargo Carried 219.4K ton (+10.
 OTP: 85.8% SLF: 73.3% Subsidiaries Operating Revenues US$415.2 Million Cargo Carried 219.4K ton (+10.") Value* 14.78 3.36 4.97 Volume** 32.85 9.59 13.43 Last Price 423 342 348 Market Cap.*** 8.74 8.85 9.01 Note: * Average Value in Billion Rupiah ** Average Volume in Million *** Market Capitalization in Trillion
Value* 14.78 3.36 4.97 Volume** 32.85 9.59 13.43 Last Price 423 342 348 Market Cap.*** 8.74 8.85 9.01 Note: * Average Value in Billion Rupiah ** Average Volume in Million *** Market Capitalization in Trillion
Virgin Australia Holdings Limited (ASX: VAH) H1 FY18 Results 1
 H1 FY18 Results 1") Virgin Australia Holdings Limited (ASX: VAH) H1 FY18 Results 1 Summary of H1 FY18 Group Outcomes 2 Group Underlying Profit Before Tax of $102.5 million up 142.3% Group Statutory Profit After Tax of $4.4
Virgin Australia Holdings Limited (ASX: VAH) H1 FY18 Results 1 Summary of H1 FY18 Group Outcomes 2 Group Underlying Profit Before Tax of $102.5 million up 142.3% Group Statutory Profit After Tax of $4.4
AIR CANADA REPORTS 2010 THIRD QUARTER RESULTS; Operating Income improved $259 million or 381 per cent from previous year s quarter
 AIR CANADA REPORTS 2010 THIRD QUARTER RESULTS; Operating Income improved $259 million or 381 per cent from previous year s quarter MONTRÉAL, November 4, 2010 Air Canada today reported operating income
OPERATING AND FINANCIAL HIGHLIGHTS
 Copa Holdings Reports Net Income of US$32.0 Million and EPS of US$0.72 for the Second Quarter of 2012 Excluding special items, adjusted net income came in at $58.6 million, or EPS of $1.32 per share Panama
NORWEGIAN AIR SHUTTLE ASA QUARTERLY REPORT FIRST QUARTER 2004 [This document is a translation from the original Norwegian version]
![NORWEGIAN AIR SHUTTLE ASA QUARTERLY REPORT FIRST QUARTER 2004 [This document is a translation from the original Norwegian version]](/thumbs/87/95085804.jpg "NORWEGIAN AIR SHUTTLE ASA QUARTERLY REPORT FIRST QUARTER 2004 [This document is a translation from the original Norwegian version]") NORWEGIAN AIR SHUTTLE ASA QUARTERLY REPORT 2004 IN BRIEF At the start of 2003, Norwegian has become a pure low-fare airline. The Fokker F-50 operations have been terminated, and during the quarter the
NORWEGIAN AIR SHUTTLE ASA QUARTERLY REPORT 2004 IN BRIEF At the start of 2003, Norwegian has become a pure low-fare airline. The Fokker F-50 operations have been terminated, and during the quarter the
Avianca Holdings S.A. 1Q 2018 Earnings Presentation 2018
 Avianca Holdings S.A. 1Q 2018 Earnings Presentation 2018 Disclaimer The present document consolidates information from Avianca Holdings S.A. and its subsidiaries, including unaudited financial figures,
Gerry Laderman SVP Finance, Procurement and Treasurer
 Gerry Laderman SVP Finance, Procurement and Treasurer Safe Harbor Statement Certain statements included in this release are forward-looking and thus reflect our current expectations and beliefs with respect
Management Presentation. March 2016
 Management Presentation March 2016 Forward looking statements This presentation as well as oral statements made by officers or directors of Allegiant Travel Company, its advisors and affiliates (collectively
Finnair Q Result
 Finnair Q2 2015 Result 14 August 2015 CEO Pekka Vauramo, Interim CFO Mika Stirkkinen 1 Market environment shows signs of improvement There were signs of a recovery in the demand for consumer and business
Financial Results Q3 FY16
 Financial Results Q3 FY16 6 February 2016 Agenda Key performance highlights Jet Airways performance highlights JetLite performance highlights 2 Key highlights Highest ever quarterly and period profit Jet
--- Disclosure A uirements) A~ulatlons October 24, 2018 IGAUSECT / /1 0
 A~ulatlons October 24, 2018 IGAUSECT / /1 0") October 24, 2018 IGAUSECT /1 0-1 8/1 0 To National Stock Exchange of India limited Exchange Plaza, C - 1, Block G Sandra Kurla Complex Sandra - (E) Mumbai - 400 051 Symbol: INDIGO To Department of Corporate
October 24, 2018 IGAUSECT /1 0-1 8/1 0 To National Stock Exchange of India limited Exchange Plaza, C - 1, Block G Sandra Kurla Complex Sandra - (E) Mumbai - 400 051 Symbol: INDIGO To Department of Corporate
SECURITIES AND EXCHANGE COMMISSION Washington, D.C FORM 6-K
 6-K 1 gol20190104_6k1.htm GOL20190104_6K1 SECURITIES AND EXCHANGE COMMISSION Washington, D.C. 20549 FORM 6-K REPORT OF FOREIGN ISSUER PURSUANT TO RULE 13a-16 OR 15d-16 OF THE SECURITIES EXCHANGE ACT OF
INVESTOR PRESENTATION. Imperial Capital Global Opportunities Conference September 2015
 INVESTOR PRESENTATION Imperial Capital Global Opportunities Conference September 2015 Forward-looking Statements This presentation contains forward-looking statements within the meaning of the Private
Management Presentation. November 2018
 Management Presentation November 2018 Forward looking statements This presentation as well as oral statements made by officers or directors of Allegiant Travel Company, its advisors and affiliates (collectively
Copa Holdings Reports Net Income of $49.9 million and EPS of $1.18 for the Second Quarter of 2018
 Copa Holdings Reports Net Income of $49.9 million and EPS of $1.18 for the Second Quarter of 2018 Panama City, Panama --- Aug 8, 2018. Copa Holdings, S.A. (NYSE: CPA), today announced financial results
Financial Results 1 st Quarter Mar/2016 (FY2015) 30 July, 2015
 30 July, 2015") Financial Results Mar/2016 (FY2015) 30 July, 2015 Today s Topics P.2 P.3 P.15 1 Overview of FY Mar/2016 Financial Results Operating Revenue Operating Profit 320 307.0 +4.9Bn (+1.6%) 312.0 50 +17.6Bn (+94.6%)
Financial Results Mar/2016 (FY2015) 30 July, 2015 Today s Topics P.2 P.3 P.15 1 Overview of FY Mar/2016 Financial Results Operating Revenue Operating Profit 320 307.0 +4.9Bn (+1.6%) 312.0 50 +17.6Bn (+94.6%)
ALAFCO Aviation Lease And Finance Co. KSCC
 Information MEMORANDUM ALAFCO Aviation Lease And Finance Co. KSCC Mr. Abulqasim Abdulghaffar Redha Acting Chief Executive Officer The 5th Forum for Listed Companies and Analysts Kuwait 20 May 2013 Why
Air China Limited Interim Results. August Under IFRS
 Air China Limited 21 Interim Results Under IFRS August 21 1 Agenda 21 Interim Results Overview Business Overview Financial Overview Outlook 2 2 2 21 Interim Results 3 21 Interim Results Overview 4 4 4
Enhancing air travel options through a strong focus on profitability and innovation innovation
 2 nd Quarter 2018 Earnings Report Grupo Viva Aerobus Enhancing air travel options through a strong focus on profitability and innovation innovation 1 VIVA AEROBUS REPORTS GROWTH OF 32.3% IN EBITDAR AND
Volaris Reports Strong First Quarter 2015: 32% Adjusted EBITDAR Margin, 9% Operating Margin
 Volaris Reports Strong First Quarter 2015: 32% Adjusted EBITDAR Margin, 9% Operating Margin Mexico City, Mexico, April 22, 2015 Volaris* (NYSE: VLRS and BMV: VOLAR), the ultra-low-cost airline serving
2012 Result. Mika Vehviläinen CEO
 2012 Result Mika Vehviläinen CEO 1 Agenda Market environment in Q4 Business performance and strategy execution Outlook Financials 2 Market Environment According to IATA, Global air travel continues to
OPERATING AND FINANCIAL HIGHLIGHTS. Subsequent Events
 Copa Holdings Reports Net Income of $103.8 million and EPS of $2.45 for the Third Quarter of 2017 Excluding special items, adjusted net income came in at $100.8 million, or EPS of $2.38 per share Panama
INVESTOR PRESENTATION. May 2015
 INVESTOR PRESENTATION May 2015 Forward-looking Statements This presentation contains forward-looking statements within the meaning of the Private Securities Litigation Reform Act of 1995 that reflect the
Part 1 Performance Highlights. Part 2 Business Overview. Part 3 Financial Review
 August 216 1 Part 1 Performance Highlights Part 2 Business Overview Part 3 Financial Review Part 4 Outlook 2 Under IFRS 3 Part 1 Performance Highlights Performance Highlights - Key Operational Metrics
Adjusted net income of $115 million versus an adjusted net loss of $7 million in the second quarter of 2012, an improvement of $122 million
 Air Canada Reports Record Second Quarter 2013 Results Highest Adjusted Net Income, Operating Income and EBITDAR Results for Second Quarter in Air Canada s History Adjusted net income of $115 million versus
Financial Results Q1 FY September 2017
 Financial Results Q1 FY18 12 September 2017 2 Key Highlights Q1FY18 Net profit after tax of INR 58cr Ninth successive profitable quarter for the Group Gross debt reduced by INR 398cr and net debt almost
OPERATING AND FINANCIAL HIGHLIGHTS
 Copa Holdings Reports Financial Results for the Fourth Quarter of 2018 Excluding special items, adjusted net profit came in at $44.0 million, or Adjusted EPS of $1.04 Panama City, Panama --- February 13,
Half Year F1 Results. November 4, 2015
 Half Year F1 Results November 4, 2015 F17 Q1 Results 20 JULY 2016 Q1 BUSINESS HIGHLIGHTS Passenger growth of 18% to 5.8m pax on 17% seat growth Record underlying profit of 38.6m (+14%) despite Easter effect
Air China Limited Annual Results. March Under IFRS
 Air China Limited 21 Annual Results Under IFRS March 211 Agenda Part 1 Highlights Part 2 Business Overview Part 3 Financial Overview Part 4 Outlook 2 Part 1 Highlights Steady Economic Growth; Asia Pacific
OPERATING AND FINANCIAL HIGHLIGHTS SUBSEQUENT EVENTS
 Copa Holdings Reports Financial Results for the Third Quarter of 2016 Excluding special items, adjusted net income came in at $55.3 million, or adjusted EPS of $1.30 per share Panama City, Panama --- November
3M 2013 Edition. Share Information : GIAA.IJ / GIAA.JK. Daily Share Price Movements
 3M 2013 Edition 3M 2012 3M 2013 Change Financial Summary (USD Mio) OPERATING REVENUES 717 807 12.51% OPERATING EXPENSES 734 827 12.70% INCOME (LOSS) FROM OPERATIONS (17) (20) 20.68% INCOME (LOSS) BEFORE
Asia-Pacific Aviation: Growth and Challenges
 Asia-Pacific Aviation: Growth and Challenges A presentation to the ACI-NA International Aviation Issues Seminar Steve Martin Page 1 Page 2 Defining the Asia Pacific We ll call it GMT +5 GMT +12, minus
OPERATING AND FINANCIAL HIGHLIGHTS SUBSEQUENT EVENTS
 Copa Holdings Reports Net Income of US$6.2 Million and EPS of US$0.14 for the Third Quarter of 2015 Excluding special items, adjusted net income came in at $37.4 million, or EPS of $0.85 per share Panama
MIRAMAR, Fla., April 29, 2015 (GLOBE NEWSWIRE) -- Spirit Airlines, Inc. (Nasdaq:SAVE) today reported first quarter 2015 financial results.
 -- Spirit Airlines, Inc. (Nasdaq:SAVE) today reported first quarter 2015 financial results.") April 29, 2015 Spirit Airlines Announces First Quarter 2015 Results; Adjusted Net Income Increases 87.1 Percent to $70.7 Million and Pre-Tax Margin Increases 900 Basis Points to 22.7 Percent MIRAMAR, Fla.,
April 29, 2015 Spirit Airlines Announces First Quarter 2015 Results; Adjusted Net Income Increases 87.1 Percent to $70.7 Million and Pre-Tax Margin Increases 900 Basis Points to 22.7 Percent MIRAMAR, Fla.,
Quarterly Interim Management Statement. Three Months to June 30, 2015
 Quarterly Interim Management Statement Three Months to June 30, 2015 BUSINESS HIGHLIGHTS FOR Q1 Record Q1 profitability despite negative Easter effect Lower unit costs further increasing our cost advantage
2Q Earnings Results Presentation
 2Q Earnings Results Presentation SAFE HARBOR The present document consolidates information from Avianca Holdings S.A. and its subsidiaries, including unaudited financial figures, operational managerial
INVESTOR NEWSLETTER. Full Year 2013 Editions. PT Garuda Indonesia (Persero) Tbk. FY 2012 FY 2013 Change. Summary.
 Tbk. FY 2012 FY 2013 Change. Summary.") INVESTOR NEWSLETTER PT Garuda Indonesia (Persero) Tbk. Full Year 2013 Editions FY 2012 FY 2013 Change Financial Summary (USD Mio) OPERATING REVENUES 3,472 3,716 7.02% OPERATING EXPENSES 3,304 3,660 10.75%
INVESTOR NEWSLETTER PT Garuda Indonesia (Persero) Tbk. Full Year 2013 Editions FY 2012 FY 2013 Change Financial Summary (USD Mio) OPERATING REVENUES 3,472 3,716 7.02% OPERATING EXPENSES 3,304 3,660 10.75%
John Schubert Managing Director Asia Pacific & India Marketing
 John Schubert Managing Director Asia Pacific & India Marketing September 2017. The statements contained herein are based on good faith assumptions are to be used for general information purposes only.
Cebu Air, Inc. Annual Stockholders Briefing. 24 June cebupacificair.com
 Cebu Air, Inc. Annual Stockholders Briefing 24 June 2015 cebupacificair.com Business Updates Passengers (M) Operating Statistics 2014: Passenger traffic grew 17.5% to 16.9M. Seat capacity grew 14.8% to
Copa Holdings Reports Net Income of US$113.9 Million for the Fourth Quarter of 2013
 Copa Holdings Reports Net Income of US$113.9 Million for the Fourth Quarter of 2013 Panama City, Panama --- February 12, 2014. Copa Holdings, S.A. (NYSE: CPA), today announced financial results for the
Investor Update Issue Date: April 9, 2018
 Investor Update Issue Date: April 9, 2018 This investor update provides guidance and certain forward-looking statements about United Continental Holdings, Inc. (the Company or UAL ). The information in
4Q15 and 2015 Results Presentation. March 30, 2016
 4Q15 and 2015 Results Presentation March 30, 2016 Highlights Paulo Kakinoff CEO Highlights Macro Environment Even more adverse environment for the Brazilian economy, with a GDP drop of 3.8% in 2015 Devaluation
Asia s most profitable LCC airline AirAsia dominates 2012 with another outstanding year-end result
 FOR IMMEDIATE RELEASE Asia s most profitable LCC airline AirAsia dominates 2012 with another outstanding year-end result Note FYE December 2012: Revenue up 11%; Profit After Tax up 238% 4Q2012: Revenue
Management Presentation. September 2015
 Management Presentation September 2015 Forward looking statements This presentation as well as oral statements made by officers or directors of Allegiant Travel Company, its advisors and affiliates (collectively
Copa Holdings Reports Fourth Quarter and Full Year 2007 Results
 Copa Holdings Reports Fourth Quarter and Full Year 2007 Results Panama City, Panama --- February 21, 2008. Copa Holdings, S.A. (NYSE: CPA), parent company of Copa Airlines and Aero Republica, today announced