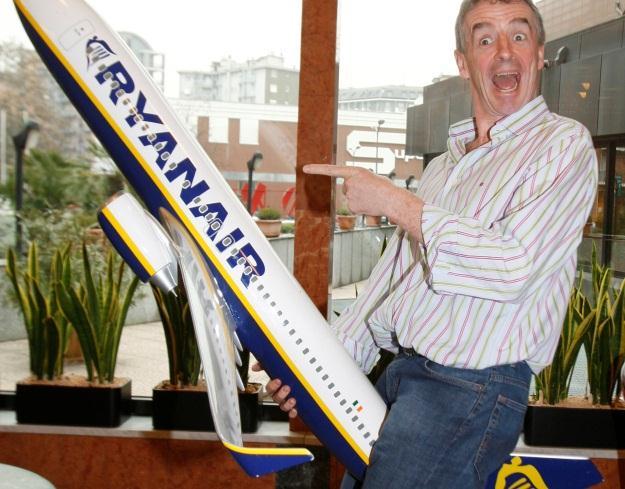
KENNY JACOBS, Chief Marketing Officer Ryanair
|
|
|
- Isabella Parks
- 5 years ago
- Views:
Transcription
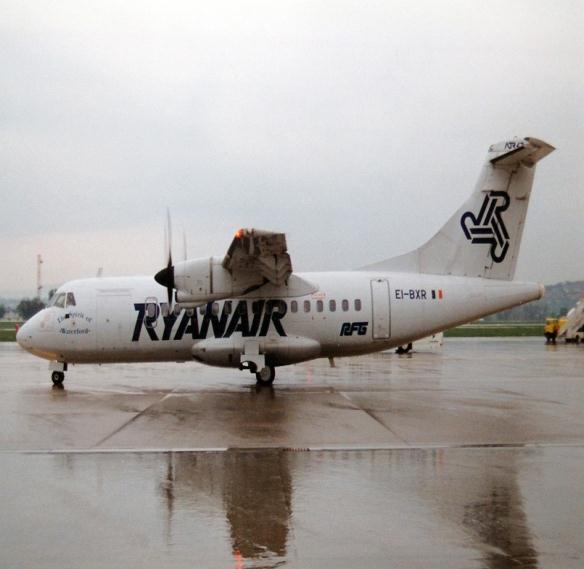
1 KENNY JACOBS, Chief Marketing Officer Ryanair
2 Ich Liebe Berlin
3 es ist so wie Knock
4 Europe s Favourite Airline Europe s Lowest Fares/Lowest Unit Costs Europe s No 1, Traffic Europe s No 1, Coverage 87m (No 1 or 2 in most markets) 69 Bases Europe s No 1, C mer Service Low Fares/On-time/Bags/Canx Always Getting Better/Digital rollout Fwd bookings & Ld factors rising since Sept 13 Aircraft orders (180 NG s & 200 MAX s) deliver 150m c mers by FY24 Unblemished 30 year Safety Record World s highest rated airline, BBB+, S&P and Fitch

5 No 1 For Coverage 69 bases 186 airports 30 countries 1,600+ routes 87m c mers p.a. 304 a/c all s Newest fleet (< 5 Yrs) 180 Boeing NG order New 200 Boeing MAX order
6 Strong Market Position Country (Cap m s) No. 1 No. 2 No. 3 RYA Share UK (117) easyjet IAG 16% Germany (112) Luft Air Berlin 4% Spain (104) IAG Vueling 18% Italy (86) Alitalia easyjet 25% France (72) AF- KLM easyjet 7% Portugal (19) TAP easyjet 17% Belgium (15) SN Brussels Jetairfly 25% Ireland (15) Aer Lingus AF-KLM 46% Poland (15) LOT Wizz 27% Morocco (12) RAM easyjet 12% Source: 2013 Dep. Seats per Capstats & Diio Mii. Mkt positions adj. for 2014 schedules. 6
7 No 1 For Traffic C mers (m s) FY 15 FY 16 FY 17 FY 18 FY 19 Source: Latest traffic stats for 12 mths to Mar14 and company forecasts. 7
8 Europe s Lowest Fares Avg. Fare % > Ryanair LOW Ryanair 46 MEDIUM Norwegian % easyjet % Aer Lingus (s/h) % Air Berlin % HIGH Alitalia % Lufthansa % IAG % AF-KLM % Ave.Fare 163 Source: Latest Annual Reports


9 Saving Europe > 10bn Every Year Average saving: 117 per flight x 87m customers p.a = 10bn saving every year Average Ryanair fare vs competitors x * * Aer Lingus, Easyjet, IAG, KLM-AF, Air Berlin

10 Ryanair in Transition


11 F a m o u s F o r L o w e s t F a r e s, B e s t R o u t e s & G r e a t S e r v i c e SERVICE CHOICE LOW COST
12 Great Ops Drives Low Cost & Low est Fares The RYR Goal Great Customer Experience The RYR Brand Pillars Lowest Fares Great Service Best Routes Lowest Fares The RYR Model Lowest Cost Operational Efficiency

 6. Develop the product w/out losing the low cost leadership 7.")
13 Marketing Strategy 1. The Goal Great Customer Experience Lowest Fares Great Service Best Routes 3. The Outcome Bookings & load factors Visits & conversion rates % Margin Market Share 2. The Activities 1. A more open brand than listens to customers 2. Still stand for low fares, this time with a better service 3. Improve the travelling experience 4. Use digital and data to drive conversion and retention 5. Broaden the appeal (primary airports, GDS, Corporate) 6. Develop the product w/out losing the low cost leadership 7. Innovate: mobile, Google, content, partnerships 8. Add new capacity, bases and routes Retention rates Brand perception


14 Ryanair Always Getting Better Fix the things customers don t like Improve the travel experience Improve the digital experience Develop the Ryanair offer Improve brand & marketing

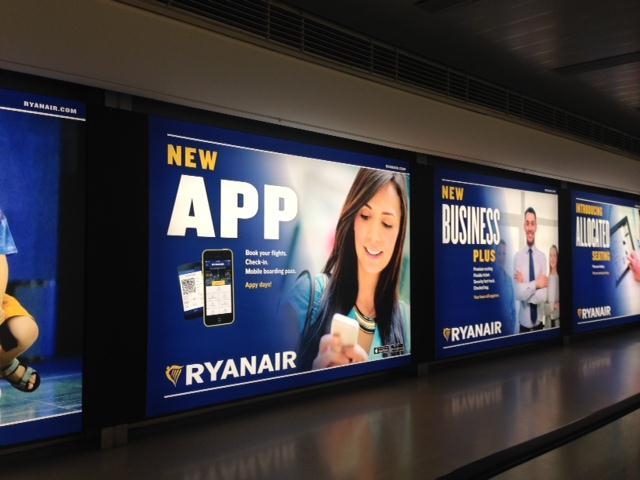
15 Customer Experience Improving RECAPTCHA scrapped 24hr grace period Quiet flights (early AM, late PM) 2 nd free small carry on bag New Groups & Corp. Dept. Allocated seating New PayPal partnership New website & mobile app

16 Digital Experience Improving Better website (17 to 5 clicks) My Ryanair, c mer registration Fare Finder, great response GDS business agents New mobile app for smart phones New Business Plus service Continuous IT & digital improvement


17 Getting Closer To Our Customers Transactions Demographics Behaviours Interests Intent Geo-Location Tech Profile Timing Social / Group


18 Better Product & Distribution Group Bookings Google Flight Travelport & Amadeus Corporate Bookings Ryanair Family Extra Ryanair Business Plus Early summer 15 & new routes

19 Improved Business Service Business Plus More primary airports & city pairs Improved schedules & business timings Corporate & Groups travel Greater distribution (GDS, Google Flight)

20 Business Plus 27% of RYR c mers travel on business Business Plus from Flexibility on Ticket Changes 20kg checked-in bag allowance Free airport check-in Fast track airport security* Priority boarding Premium seats *(at selected airports)


21 Better Brand


22 Better Digital Better Brand Extended Product Better Service New Distribution Always Getting Better Campaign #1 Airport Rebrand Campaign #2 Google Groups GDS 1 GDS 2 Corporate Flight Winter 14 & new bases Summer 15 & new routes Quiet Flights 2 nd Free Bag Fees Cut Allocated seats PED use Website V1 My Ryanair Website V2 App V1 App V2 Nov 13 Dec 14 Sep 14
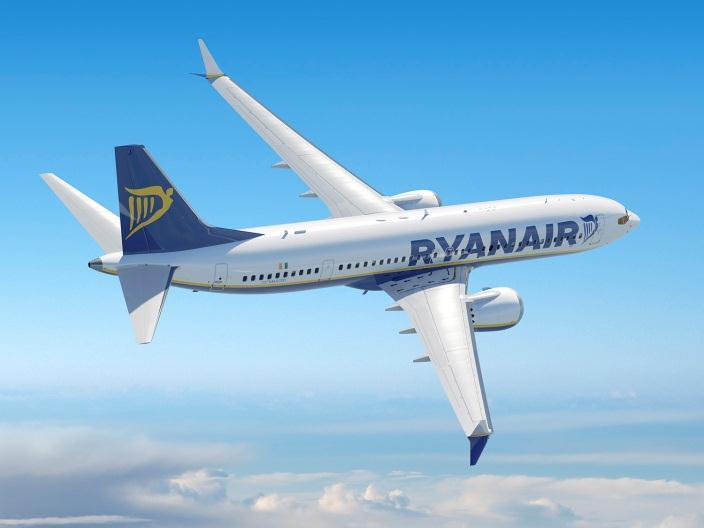
23 Boeing 737 MAX Boeing MAX Aircraft The Gamechanger 100 Firm & 100 Options; Deliveries 2019 to seats (+4%), CFM LEAP Engines & competitive pricing = Lower costs & lower fares for c mers Slimline seats & more leg room Boeing Sky Interior improves c mer experience 18% lower fuel costs & 40% less noise emission redn. Fleet grows to 520 a/c by FY24 Traffic grows to 150m c mers by FY24 Flexibility via options, sales, lease handbacks Maintains youngest fleet <5 yrs
 1bn savings p.a. 86m c mers carried")
24 Ryanair Germany 12 airports 5 bases 19 aircraft 160 routes 8.6m c mers p.a. 8,600 jobs (ACI) 1bn savings p.a. 86m c mers carried


25 Germany Is Famous For Football Public Transport Good Beer Great Cars Strong Economy Cool Fashion


26 Ireland Is Famous For Butter U2 Pubs Being Green Low Fares
 Irish Govt scraps 3 Travel Tax 1 Apr 2014 Ryanair adds 21 new S15 routes Ryanair will deliver over 1m new c mers at Irish airports this year Ryanair to grow by 250,000 c mers at Berlin")
27 Germany Should Follow Ireland APD damages tourism & traffic growth Irish Govt introduced tax 2009 Irish traffic dropped from 30.5m to 23.5m ( ) Irish Govt scraps 3 Travel Tax 1 Apr 2014 Ryanair adds 21 new S15 routes Ryanair will deliver over 1m new c mers at Irish airports this year Ryanair to grow by 250,000 c mers at Berlin this year Ryanair carries 250,000 c mers across Europe every day
28 Berlin = Knock Berlin, Germany Population: 3.5m Catchment: 22.2m Ryanair c mers: 800,000 Knock, Co Mayo, Ireland Population: 1,600 Catchment: 1.2m Ryanair c mers: 800,000
 Always Getting Better delivers for c mers, people & shareholders Germany should follow Ireland &")
29 S t i l l t o c o m e Lowest fares, lowest costs in Europe More primary airports & city pairs Website upgrade & mobile app updates GDS & digital strategy opens new business markets New aircraft drive growth from 87m to 150m by FY24 (+84%) Always Getting Better delivers for c mers, people & shareholders Germany should follow Ireland & axe APD


30 Questions?
Warsaw 17 Sep 2014 Peter Bellew
 Warsaw 17 Sep 2014 Peter Bellew T h e F u t u r e o f LC C i n Po l a n d 1929 Polish Aviation Innovation 2014 A Great year for Poland Ryanair Changing Business in Poland Ryanair s Business Model The Future
Q3 Results, Feb 2016
 Q3 Results, Feb 2016 Europe s Favourite Airline Europe s Lowest Fares/Lowest Cost Carrier No 1, Traffic 106m No 1, Coverage 78 Bases No 1, C mer Service Low Fares/On-time/Fewest/Canx Always Getting Better
Low Fares The Engine For Passenger Growth 3 rd April 2003
 Low Fares The Engine For Passenger Growth 3 rd April 2003 Europe s No 1. Low Fares Airline No. 1 Established 1990 No 1 for traffic 24m passengers this year No 1 for On-Times No 1 for Lowest Fares No 1
The Changing Trends in the International Airline Industry. Dr John Frankie O Connell First Annual Tourism Policy Workshop Dromoland, 2010
 The Changing Trends in the International Airline Industry How is Ireland being affected by Changes in the Marketplace? Dr John Frankie O Connell First Annual Tourism Policy Workshop Dromoland, 2010 Agenda
Interim results. 11 May 2010
 Interim results 11 May 2010 Introduction Andy Harrison Chief Executive Officer Strong performance despite disruption Improvement in revenue, margins and cash Continued network improvement has driven better
Q1 FY 13 IMS Analyst & Investor presentation. 3 months to 31 December 2012
 Q1 FY 13 IMS Analyst & Investor presentation 3 months to 31 December 2012 24 th January 2013 1 1 Progress against strategic objectives 1. Drive demand, conversion and yields across Europe Passenger numbers
Half Year Traffic Highlights
 Half Year Traffic Highlights Presented by CEO, ALAN BORG 1 Presentation Contents 1. Traffic Highlights 2015 2. Route Development 2015 3. Industry Indicators 2015 4. Forecast 2015 5. Airport Investments
Half Year Results Analyst and Investor Presentation. Tuesday 13 May 2014
 Half Year Results Analyst and Investor Presentation Tuesday 13 May 2014 Introduction Carolyn McCall Chief Executive Officer PBT / seat Strategy is delivering Revenue performance in line with expectations
Nomura Transport conference Carolyn McCall Chief Executive
 Nomura Transport conference Carolyn McCall Chief Executive 1 06-Dec 09-Dec 12-Dec 15-Dec 18-Dec 21-Dec 24-Dec 27-Dec 30-Dec 02-Jan 05-Jan 08-Jan 11-Jan 14-Jan Challenging environment Jet price up 46% in
UBS Transport conference. 14 September 2009
 UBS Transport conference 14 September 2009 Andy Harrison Chief Executive Officer Disclaimer This communication is directed only at (i) persons having professional experience in matters relating to investments
Strong improvement in underlying financial performance. Revenue + 11 % Profit before Tax + 48 % PBT Margin pp. Earnings per Share + 50 %
 20 th November 2007 Highlights Strong improvement in underlying financial performance Revenue + 11 % Profit before Tax + 48 % PBT Margin + 2.7 pp Earnings per Share + 50 % Return on Equity + 3.5 pp Net
Quarter 3 Interim management Statement
 Quarter 3 Interim management Statement 3 months to 30 th June 2012 25 th July 2012 1 1 Strong Q3 performance - in a difficult market Revenue growth in line with expectations Constant currency RPS growth
IAG results presentation. Quarter One th May 2018
 IAG results presentation Quarter One 2018 4 th May 2018 Highlights Willie Walsh, Chief Executive Officer Highlights Another strong quarter performance with an operating profit of 280m (5.6% margin, +2.3pts)
SAS Group Asia Tour Financial Hearing Presentation May 14, 2012
 SAS Group Asia Tour Financial Hearing Presentation May 14, 2012 1 This is the SAS Group 128 destinations 27,2 million passengers 28 new routes to be launched 2012 1,085 daily flights Revenues 2011, MSEK
Traffic Results January June 2010 by Chief Executive Officer Julian Jaeger
 January June 2010 by Chief Executive Officer Julian Jaeger 15 th July, 2010 Contents Traffic Results Forecast 2010 Concluding remarks Highlights January to June 2010 2010 2009 + / - % Change Passenger
STAYING TRUE. BofAML Global Transportation Conference. May
 STAYING TRUE BofAML Global Transportation Conference May 19 2011 FORWARD-LOOKING STATEMENT Certain information in this presentation and statements made during this presentation, including any question
Singapore Airlines Group Analyst/Media Briefing HALF YEAR FY RESULTS 5 NOVEMBER 2012 THE PARENT AIRLINE 1H FY2012/13 RESULTS
 Singapore Airlines Group Analyst/Media Briefing HALF YEAR FY2012-13 13 RESULTS 5 NOVEMBER 2012 THE PARENT AIRLINE 1H FY2012/13 RESULTS THE PARENT AIRLINE COMPANY RESULTS 2Q & 1H FY12/13 2Q/12 $million
American Airlines Group Inc.
 American Airlines Group Inc. Bank of America Merrill Lynch 2018 Transportation Conference Derek Kerr Chief Financial Officer Cautionary Statement Regarding Forward-Looking Statements and Information This
Fourth Quarter and Full Year 2011 Results Presentation. February 1, 2012
 Fourth Quarter and Full Year 2011 Results Presentation February 1, 2012 This presentation may include forward-looking comments regarding the Company s business outlook and anticipated financial and operating
Q3 FY 14 IMS Analyst & Investor presentation. 3 months to 30 June 2014
 Q3 FY 14 IMS Analyst & Investor presentation 3 months to 30 June 2014 24 July 2014 1 1 Continued solid performance 1. Drive demand, conversion and yields across Europe Passenger numbers up by 9.4%; load
Vueling Airlines 2009 Fourth-Quarter, Full-Year Financial Results. The 100-milion turnaround story
 Vueling Airlines 2009 Fourth-Quarter, Full-Year Financial Results The 100-milion turnaround story Barcelona, February 23 rd, 2009 Introduction Revenues Operations and costs Outlook for 2010 Vueling has
2011 Preliminary Full Year Results. 28 February 2012
 2011 Preliminary Full Year Results 28 February 2012 Disclaimer Forward looking information Certain information included in these statements is forward-looking and involves risks and uncertainties that
SAS AB Q December 2018
 SAS AB Q4 2018 4 December 2018 Q4 financial highlights Q4 POSITIVES Q4-18 CHANGE VS. Q4-17 Record number of passengers Total revenue up SEK 1bn vs. LY Yield (nominal) up 5.1% vs. LY RASK (nominal) up 7.0%
Q Analyst & investor presentation. 23 January 2018
 Q1 2018 Analyst & investor presentation 23 January 2018 Strong start in 2018 Strengthening our market positions across the network Network Q1 RPS @ CC up 6.6% - positive underlying revenue trend Cost Underlying
Montie Brewer, President and CEO Joshua Koshy, Executive VP and CFO UBS Transport Conference
 Montie Brewer, President and CEO Joshua Koshy, Executive VP and CFO UBS Transport Conference 1 London, England September 17, 2007 Agenda Strongly positioned international airline Investment proposition
Industry Monitor. The EUROCONTROL bulletin on air transport trends. EUROCONTROL statistics and forecasts. Issue N /09/11
 Issue N 133. 28/09/11 Industry Monitor The EUROCONTROL bulletin on air transport trends European flights increased by 1.6% in August 2011, at the upper end of the forecast. airberlin to reduce its current
2010 ANNUAL GENERAL MEETING. May 4, 2010
 2010 ANNUAL GENERAL MEETING May 4, 2010 FORWARD-LOOKING STATEMENT Certain information in this presentation and statements made during this presentation, including any question and answer session, may contain
Agenda. Conclusion of Transform Key Perform 2020 initiatives. Perform 2020 financial framework. Information meeting
 Information meeting Agenda Conclusion of Transform 2015 Key Perform 2020 initiatives Perform 2020 financial framework 2 Transform 2015: first phase of group turnaround accomplished Strict capacity discipline
Gordon Wilson President and Chief Executive Officer December 17, 2015
 Gordon Wilson President and Chief Executive Officer December 17, 2015 Creating long-term shareholder value Strong core Differentiated focus Leading technology Truly global Focused on the markets that need
Group Flights. Conducted by YouGov on behalf of Civil Aviation Authority. Fieldwork Dates: 28th December th January 2018
 Conducted by YouGov on behalf of Civil Aviation Authority Fieldwork Dates: 28th December 2017-9th January 2018 ACF_Q1. For the following question, by "fly as part of a group", we mean flying anywhere (i.e.
SAS Q1 2017/2018. Q1 in Summary: Improved earnings CHANGE VS. Q1 FY17
 SAS 2017/2018 27.02.2018 in Summary: Improved earnings POSITIVES + Passenger revenue up 1% (FX adj.) + Cargo and EB-point sale revenue increased MSEK 109 + Efficiency program delivered MSEK 165 + Positive
Investor & analyst day. London, 28 September 2011
 Investor & analyst day London, 28 September 2011 2 years ago Andrew Macfarlane Fundamentally attractive airline But Assets Robust balance sheet Modern Airbus fleet; 50% owned Valuable route network & strategic
UCD Michael Smurfit Graduate Business School The Smurfiteers
 UCD Michael Smurfit Graduate Business School The Smurfiteers Security Analysis Ryanair Holdings Plc. By Quan Yuan Shane Carberry David Hannafin Huijie Song Shaozhe Liu Kashish Verma Quick Facts Ryanair
Ancillary Revenues. Dr Frankie O Connell
 Ancillary Revenues Dr Frankie O Connell Istanbul Technical University Air Transportation Management, MSc. Program Airline Business Models and Strategic Management Module #5 10th December 2016 Ancillary
Market Profile. 3 rd largest market 69K 624K
 Market Profile Germany is our 3 rd largest market Visitor Market The island of Ireland welcomed 651K visitors from Germany in 2016. German visitors account for 6% of all visitors to the island. Where do
Deutsche Bank 16 th Annual Global Emerging Markets. New York, September 2017
 Deutsche Bank 16 th Annual Global Emerging Markets New York, September 2017 This presentation may include forward-looking comments regarding the Company s business outlook and anticipated financial and
Start of Season Report Nice Côte d Azur Airport Summer Nice Côte d Azur Airport NCE/LFMN. Summer Start Of Season Report
 Nice Côte d Azur Airport NCE/LFMN Summer 2017 - Start Of Season Report Report data extraction date: 29 March 2017 Table of contents Evolution of allocated slots at the Start Of Season (SOS)... 2 Total
ETIHAD AIRWAYS ANNOUNCES ORDER FOR UP TO 117 AIRBUS AIRCRAFT
 Sunday 17 November, 2013 ETIHAD AIRWAYS ANNOUNCES ORDER FOR UP TO 117 AIRBUS AIRCRAFT Major purchase to accommodate growth, increase efficiency and refresh fleet First order of new generation A320neo family
FY key data Passenger. Cargo. Maintenance. Other. Operating result in m. Revenues in bn -10.4% 78% 11%
 Information meeting FY 2009-10 key data Revenues in bn Operating result in m 78% Passenger 16.3-13.6% -918 11% Cargo 2.4-27.8% -436 5% Maintenance 1.0-4.0% +81 6% Other 1.3-12 -10.4% 2 Our industry is
Punctuality for june 2015 per airline
 for june 2015 per airline Departures scheduled Adria Airways 16 16 0 100% 6 63% 28 Aegean s S.A. 23 23 0 100% 3 87% 24 Aer Lingus 30 30 0 100% 13 57% 45 Aeroflot Russian s 60 60 0 100% 10 83% 43 Air Baltic
And it wasn t just for our Low Fares...
 AN N U A L R E P O R T & F I N A N C I A L S TAT E M E N T S 2 0 0 3 I Another year over... and my head is in such a tizzy! 15,736,936 passengers flew with us on 93 routes - with an average of 316 flights
Singapore Airlines Group Analyst/Media Briefing HALF YEAR FY RESULTS. 13 November 2013 THE PARENT AIRLINE 1H FY2013/14 RESULTS
 Singapore Airlines Group Analyst/Media Briefing HALF YEAR FY2013-14 14 RESULTS 13 November 2013 THE PARENT AIRLINE 1H FY2013/14 RESULTS THE PARENT AIRLINE COMPANY RESULTS 2Q & 1H FY13/14 2Q/13 $million
MONTHLY PERFORMANCE REPORT MAY gatwickairport.com/performance
 MONTHLY PERFORMANCE REPORT gatwickairport.com/performance DOCUMENT HISTORY Monthly Performance Report Published Republished Page Reference Metric Reason for Change May 01/05/2017 01/06/2017 12 Pier Service
Results for the Year Ended 30 th June Brett Godfrey Chief Executive Officer 21 August 2007
 Results for the Year Ended 30 th June 2007 Brett Godfrey Chief Eecutive Officer 21 August 2007 New World Strategy Delivering RASK up 13.0% 10.02 CASK (underlying) up 2.6% 8.24 Net Profit up 92.9% $216M
3rd Quarter Analyst Presentation
 SAS Group 3rd Quarter Analyst Presentation London, November 12, 1999 Contents of 3rd Quarter presentation The quarter in brief SAS International Hotels Business review & financial summary Impact from fleet
SAS Group Presentation Carnegie, May 22, 2012 Sture Stölen, Head of IR
 SAS Group Presentation Carnegie, May 22, 2012 Sture Stölen, Head of IR 1 This is the SAS Group 128 destinations 27,2 million passengers 28 new routes to be launched 2012 1,085 daily flights Revenues 2011,
Intra-European Seat Capacity. January February March April May June July August September October November December. Intra-European Sectors Flown
 ASK's (Million) Sectors Departing Seats 80,000,000 Intra-European Seat Capacity 70,000,000 60,000,000 50,000,000 40,000,000 30,000,000 20,000,000 10,000,000 0 January February March April May June July
UBM Travel Brands. Events & Conferences. Data, Consultancy & Training. Media & Digital
 UBM Travel Brands Events & Conferences Data, Consultancy & Training Media & Digital Why is Air Transport is Important? Aviation transports 2.7 billion passengers annually Aviation generates 33 billion
Start of Season Report Nice Côte d Azur Airport Winter Nice Côte d Azur Airport NCE/LFMN. Winter Start Of Season Report
 Nice Côte d Azur Airport NCE/LFMN Winter 2016 - Start Of Season Report Report data extraction date: 30 Octobre 2016 Table of contents Evolution of allocated slots at the Start Of Season (SOS)... 2 Total
Market Outlook. Michael Warner, Director Market Analysis. Boeing Commercial Airplanes October October 7 10, 2012 Atlanta, Georgia, USA
 Market Outlook Michael Warner Director, Market Analysis Boeing Commercial Airplanes October 2012 Agenda Aviation environment Current products Product strategy & development 2012 719 net orders through
Market Profile. 4 th largest market 62K 494K
 Market Profile France is our 4 th largest market Visitor Market France accounts for 5% of all visitors to the island of Ireland. We welcomed 524K visitors from France in 2016. Where do they come from?
SIA ANALYST/MEDIA BRIEFING Q2 and 1H FY17/18 Results 8 November 2017
 SIA ANALYST/MEDIA BRIEFING Q2 and 1H FY17/18 Results 8 November 2017 THE PARENT AIRLINE Q2 AND 1H FY17/18 RESULTS THE PARENT AIRLINE COMPANY OPERATING PERFORMANCE Q2 % 1H % FY17/18 Change FY17/18 Change
MONTHLY PERFORMANCE REPORT APRIL gatwickairport.com/performance
 MONTHLY PERFORMANCE REPORT gatwickairport.com/performance At Gatwick we are committed to ensuring all areas of our business live up to the expectations of our passengers, our partners and our regulator.
SAS takes forceful action in a challenging market
 SAS Q2 2013/14 1 1 SAS takes forceful action in a challenging market Q2 EBT MSEK -1,078 Disappointing result in a challenging market most European carriers struggle During the last year, capacity has outgrown
Customer Relations Programme
 Customer Relations Programme 2018 2 Customer Relations Thank you for taking time to meet with us today We would like to give you an update on IAA We hope to gain a better understanding of how we can improve
STUDY OF THE OPTIMUM FLEET FOR A LCC (LOW-COST-CARRIER)
") DEGREE IN AEROSPACE VEHICLES ENGINEERING STUDY OF THE OPTIMUM FLEET FOR A LCC (LOW-COST-CARRIER) ANNEXES Student: Durán Gómez, Núria Director: Pérez Llera, Luís Manuel Delivery date: 12/06/2015 Index of
DEGREE IN AEROSPACE VEHICLES ENGINEERING STUDY OF THE OPTIMUM FLEET FOR A LCC (LOW-COST-CARRIER) ANNEXES Student: Durán Gómez, Núria Director: Pérez Llera, Luís Manuel Delivery date: 12/06/2015 Index of
THE FUNDAMENTALS OF ROUTE DEVELOPMENT SETTING THE SCENE MODULE 1
 THE FUNDAMENTALS OF ROUTE DEVELOPMENT SETTING THE SCENE THE FUNDAMENTALS OF ROUTE DEVELOPMENT Mike St Laurent Vice President, Consulting - ASM ASM BACKGROUND Global consultancy founded in 1993 to provide
MONTHLY PERFORMANCE REPORT MARCH gatwickairport.com/performance
 MONTHLY PERFORMANCE REPORT gatwickairport.com/performance At Gatwick we are committed to ensuring all areas of our business live up to the expectations of our passengers, our partners and our regulator.
2017 Marketing and Communications Conference. November 6, 2017
 2017 Marketing and Communications Conference November 6, 2017 1 2 Introduction Carrie Kenrick State of the Industry Industry Consolidation Financial Trends Ancillary Product / Customer Segmentation Fleet
q Analyst & investor presentation Thursday 20 th July 2017
 q3 2017 Analyst & investor presentation Thursday 20 th July 2017 easyjet Europe Following a rigorous and comprehensive year-long process Austria was chosen as the country for easyjet Europe Austro Control
Punctuality for march 2014 per airline
 for march 2014 per airline Departures scheduled **) having less than 10 operations. Aer Lingus 30 30 0 100% 2 93% 68 Aeroflot Russian 63 62 1 98% 1 98% 19 Air Baltic 73 72 1 99% 1 99% 19 Air Berlin 167
Travel Policy Fly America Act Compliance Presentation. Presented by: Travel Services
 Travel Policy Fly America Act Compliance Presentation Presented by: Travel Services Agenda Fly America Act Exceptions Open Skies Agreement Documentation Requirements Good News and Bad News CTP demo 3 Travel
Labs: How Travelport is redefining the airline customer experience. David Gomes Commercial Director, Air Commerce
 Labs: How Travelport is redefining the airline customer experience David Gomes Commercial Director, Air Commerce Travel Commerce Platform GDS GDS GDS Empowered selling Unrivalled content Platform FIS has
Fly America and Open Skies. For Travel on Federal Sponsored Awards
 Fly America and Open Skies For Travel on Federal Sponsored Awards University and Sponsor Travel Policies Federal regulations require the customary standard commercial airfare (coach or equivalent), or
Bank of America Merrill Lynch Global Transportation Conference. June 16, 2010
 Bank of America Merrill Lynch Global Transportation Conference June 16, 2010 FORWARD-LOOKING STATEMENT Certain information in this presentation and statements made during this presentation, including any
Information meeting. 12 September 2011
 Information meeting 12 September 2011 Full Year 2010-11 key data April 2010-March 2011 Revenues in billions Operating result in millions 77% Passenger 18.10 +11.3% -44 +874 13% Cargo 3.16 +29.5% +69 +505
Building A New Silk Road Capacity Planning and Selecting Markets. Greg Kaldahl SVP Resource Management
 Building A New Silk Road Capacity Planning and Selecting Markets Greg Kaldahl SVP Resource Management 1 The Airline Industry Is In A State Of Constant Change Market cap ( bn) as of 1 Jan 1999 10 9.3 NA/EU
Global September 2014
 Jan-13 Feb-13 Mar-13 Apr-13 May-13 Jun-13 Jul-13 Aug-13 Sep-13 Oct-13 Nov-13 Dec-13 Jan-14 Feb-14 Mar-14 Apr-14 May-14 Jun-14 Jul-14 Aug-14 Sep-14 Low cost Oneworld Skyteam Star Alliance Other Billion
Global Seat Capacity July. May. June. Global Sectors Flown July. May. June %
 Jan-14 Feb-14 Mar-14 Apr-14 May-14 Jun-14 Jul-14 Aug-14 Sep-14 Oct-14 Nov-14 Dec-14 Jan-15 Feb-15 Mar-15 Apr-15 May-15 Low cost Oneworld Skyteam Star Alliance Other Billion ASKs - YTD January February
Punctuality for july 2015 per airline
 for july 2015 per airline Departures scheduled **) having less than 10 operations. Acd/Ad Hoc 10 0 10 0% 0 100% 0 Adria Airways 18 18 0 100% 5 72% 25 Aegean S.A. 27 27 0 100% 12 56% 30 Aer Lingus 34 31
Travel Profiles A SNAPSHOT OF KEY MARKETS
 Travel Profiles A SNAPSHOT OF KEY MARKETS Tourism is a vital part of the Irish economy. It is integral to sustainable regional development and an important source of national employment (240,000 jobs in
2005 Q3 investor update. 25 August 2005
 2005 Q3 investor update 25 August 2005 1 This communication is directed only at (i) persons having professional experience in matters relating to investments who fall within the definition of investment
MONTHLY PERFORMANCE REPORT JANUARY gatwickairport.com/performance
 MONTHLY PERFORMANCE REPORT gatwickairport.com/performance At Gatwick we are committed to ensuring all areas of our business live up to the expectations of our passengers, our partners and our regulator.
Is British Airways losing altitude?
 Is British Airways losing altitude? An analysis of consumer perception of the airline based on YouGov data Contents Introduction... 3 How consumer perception of BA has changed Flight risks: which of BA
Operational Performance Reporting Manchester Airport March 2018
 Operational Performance Reporting Manchester Airport March 2018 Departure Punctuality - Mar-18 Last Month Last Year % Change Target Var to Target First Wave 79.8% 88.1% -8.3% 85.0% -5.2% Not First Wave
Derek Sharp Senior Vice President and Managing Director Air Commerce December 17, 2015
 Derek Sharp Senior Vice President and Managing Director Air Commerce December 17, 2015 Airline content Network carriers Low cost carriers Airline merchandising Ancillaries Tailored offerings (Rich Content
MONTHLY PERFORMANCE REPORT OCTOBER gatwickairport.com/performance
 MONTHLY PERFORMANCE REPORT gatwickairport.com/performance At Gatwick we are committed to ensuring all areas of our business live up to the expectations of our passengers, our partners and our regulator.
Punctuality for may 2014 per airline
 for may 2014 per airline Departures scheduled **) having less than 10 operations. Adria Airways 18 18 0 100% 3 83% 118 Aer Lingus 30 30 0 100% 7 77% 36 Aeroflot Russian 62 62 0 100% 4 94% 58 Air Baltic
Santander 22 nd Annual Latin American Conference. Cancun, January 2018
 Santander 22 nd Annual Latin American Conference Cancun, January 2018 This presentation may include forward-looking comments regarding the Company s business outlook and anticipated financial and operating
A320 FAMILY: The most successful aircraft family. Key Figures* 20% fuel burn reduction. 5% lower airframe A320 FAMILY.
 February2019 (Figures at end of January 2019) A320 FAMILY: The most successful aircraft family Key Figures* 20% fuel burn reduction 5% lower airframe maintenance costs 14% lower cash operating costs per
SAS Q2 2017/2018 TELECONFERENCE
 SAS Q2 2017/2018 TELECONFERENCE 30 May 2018 Earnings as expected despite negative currency effect POSITIVES + Total revenue up MSEK 73 vs. LY + Currency adjusted yield up 0.6% vs. LY + EB-point sale revenue
Flybe: Delivery and Future Direction
 Flybe Delivery and Future Direction Making Flybe Fit to Compete Update 23 May 2013 Agenda Context and Introduction Flybe UK - Making Flybe Fit to Compete Flybe Outsourcing Solutions Recap Conclusions and
JT Barcelona-El Prat Airport
 18/2/2019 PORTADA Airport 2018 18/2/2019 MAPA Canary Islands Aena Spanish Airports (excluding MCV, QSA, SBO exclusive for GA) 18/2/2019 CONTENTS Contents Highlights Airport Traffic statistics Route maps
SAS Group Q2 2012/13. Q2 Restructuring programme moving KPIs in the right direction
 SAS Group Q2 2012/13 1 Q2 Restructuring programme moving KPIs in the right direction Operating revenues +1.6%* Yield improvement of +2.7%* Forceful implementation of 4XNG plan: Unit cost down by 10.7%
Norwegian Air Shuttle SEB Nordic Seminar, 8 th January 2019
 Norwegian Air Shuttle SEB Nordic Seminar, 8 th January 2019 CFO Geir Karlsen Corporate strategy overview Company overview Norwegian Air Shuttle is the leading European lowcost airline founded by Bjørn
Travel Policy Fly America Act Compliance Presentation. Presented by: Travel Services
 Travel Policy Fly America Act Compliance Presentation Presented by: Travel Services Travel on Federal Funds Federal regulations require (coach or equivalent), the lowest commercial discount airfare to
Interim results. 7 May 2008
 Interim results 7 May 2008 1 Introduction Andy Harrison Chief Executive Officer 2 Winning in a tough environment Underlying business strong and performing as expected Good revenue growth, underlying cost
Information meeting. September 2011
 Information meeting September 2011 Full Year 2010-11 key data April 2010-March 2011 Revenues in billions Operating result in millions 77% Passenger 18.10 +11.3% -44 +874 13% Cargo 3.16 +29.5% +69 +505
MONTHLY PERFORMANCE REPORT FEBRUARY gatwickairport.com/performance
 MONTHLY PERFORMANCE REPORT gatwickairport.com/performance At Gatwick we are committed to ensuring all areas of our business live up to the expectations of our passengers, our partners and our regulator.
TUI GROUP FACTBOOK. May 2015
 TUI GROUP FACTBOOK May 2015 Pro Forma Turnover 2012/13 & 2013/14 m FY 12/13 Q1 13/14 Q2 13/14 Q3 13/14 Q4 13/14 FY 13/14 Northern Region 6,037.2 1,047.6 922.0 1,660.0 2,571.2 6,200.8 Central Region 5,524.8
MONTHLY PERFORMANCE REPORT DECEMBER gatwickairport.com/performance
 MONTHLY PERFORMANCE REPORT gatwickairport.com/performance At Gatwick we are committed to ensuring all areas of our business live up to the expectations of our passengers, our partners and our regulator.
Company background. August 2013
 Company background August 2013 1 Europe's leading short haul air travel network 58.4m passengers, 65.9 m seats flown; load factors 88.7% fleet of 214 aircraft with an average fleet age of 4.4 years leading
Forward-looking Statements
 September 21, 2011 Forward-looking Statements This presentation contains certain forward-looking statements with respect to the Corporation. These forward-looking statements, by their nature, necessarily
Global Seat Capacity May. June. July. Global Sectors Flown May. June. July
 Global Departing Seats (Millions) 5 45 4 35 3 25 2 15 5 4.6% 5.4% 6.3% 5.6% 5.4% 6.2% 6.8% 6.1% Global Seat Capacity 214 215 January February March April May June July August September October November
Punctuality for september 2013 per airline
 for september 2013 per airline Departures scheduled Adria Airways 17 17 0 100% 3 82% 20 Aer Lingus 26 26 0 100% 4 85% 22 Aeroflot Russian s 60 60 0 100% 9 85% 29 Air Baltic 85 84 1 99% 9 89% 32 Air Berlin
Global Seat Capacity July. May. June. Global Sectors Flown July. May. June %
 Jan-14 Feb-14 Mar-14 Apr-14 May-14 Jun-14 Jul-14 Aug-14 Sep-14 Oct-14 Nov-14 Dec-14 Jan-15 Low cost Oneworld Skyteam Star Alliance Other Billion ASKs - YTD January February March April May June July August
Punctuality for june 2014 per airline
 for june 2014 per airline Departures scheduled **) having less than 10 operations. Adria Airways 17 17 0 100% 4 76% 32 Aegean S.A. 12 12 0 100% 9 25% 39 Aer Lingus 30 30 0 100% 10 67% 34 Aeroflot Russian
MONTHLY PERFORMANCE REPORT OCTOBER gatwickairport.com/performance
 MONTHLY PERFORMANCE REPORT gatwickairport.com/performance At Gatwick we are committed to ensuring all areas of our business live up to the expectations of our passengers, our partners and our regulator.
AIRLINE PERFORMANCE 2012 ISABEL CYSNEIROS 27/03/2013
 AIRLINE PERFORMANCE 2012 ISABEL CYSNEIROS 27/03/2013 DEFINITIONS Late Handbacks: Slots returned after IATA Slot Handback Deadline - the difference between the slots held at the SOS (Start of Season) and
SHAPING A SUSTAINABLE FUTURE
 SHAPING A SUSTAINABLE FUTURE Full Year Results Year ended 31 March 2017 Analyst and Investor Presentation 8 June 2017 Agenda Introduction Christine Ourmieres-Widener Financial Review Philip de Klerk Performance